 Sean Tsz Sum Law1†
 Wenyan Nong1†
 Ho Yin Yip1Eric Ka Yip Liu2Terence Pun Tung Ng2
 Ryan Ho Leung Tsang2
 Nianhe Xia3
 Pang-Chui Shaw4
 Hon Ming Lam5David Tai Wai Lau6
 Jerome Ho Lam Hui1*
- 1School of Life Sciences, Simon F. S. Li Marine Science Laboratory, State Key Laboratory of Agrobiotechnology Institute of Environment, Energy and Sustainability, The Chinese University of Hong Kong, Hong Kong, Hong Kong SAR, China
- 2Agriculture, Fisheries and Conservation Department, The Government of the Hong Kong Special Administrative Region, Hong Kong, Hong Kong SAR, China
- 3Key Laboratory of Plant Resources Conservation and Sustainable Utilization, Guangdong Provincial Key Laboratory of Digital Botanical Garden, South China Botanical Garden, Chinese Academy of Sciences, Guangzhou, China
- 4Li Dak Sum Yip Yio Chin R & D Centre for Chinese Medicine, Institute of Chinese Medicine and School of Life Sciences, The Chinese University of Hong Kong, Hong Kong, Hong Kong SAR, China
- 5School of Life Sciences and Centre for Soybean Research of the State Key Laboratory of Agrobiotechnology, Institute of Environment, Energy and Sustainability, The Chinese University of Hong Kong, Hong Kong, Hong Kong SAR, China
- 6Shiu-Ying Hu Herbarium, School of Life Sciences, The Chinese University of Hong Kong, Hong Kong, Hong Kong SAR, China
The incense tree Aquilaria sinensis (Thymelaeaceae) can produce agarwood with commercial values and is now under threat from illegal exploitation in Hong Kong, impairing the local population and biodiversity. Together with other species of Aquilaria, it is listed in the CITES Appendix II, which strictly regulates its international trade. To understand the population structure of A. sinensis and to make relevant conservation measures, we have sequenced 346 individuals collected in Hong Kong and southern mainland China. Population genomic analyses including principal component analysis, neighbor-joining tree construction, ADMIXTURE, and hierarchical pairwise-FST analyses suggested that genetically distinct populations are contained in certain areas. Genomic scan analyses further detected single-nucleotide polymorphism (SNP) outliers related to plant defense, including the CYP71BE gene cluster. In addition to the population analyses, we have developed a modified hexadecyltrimethyl-ammonium bromide (CTAB) DNA extraction protocol for obtaining DNA from agarwood samples in this study, and resequencing of DNA extracted from two agarwood samples using this method allows us to successfully map to the sample corresponding localities in the phylogenetic tree. To sum up, this study suggested that there is a genetically distinct subpopulation of incense tree in Hong Kong that would require special conservation measures and established a foundation for future conservation measures.
Introduction
The genus Aquilaria (Thymelaeaceae) contains 15 species of agarwood producing trees or also known as “lign aloes” that are native to Southeast Asia. Many species of Aquilaria are critically endangered and are listed in the CITES Appendix II to strictly regulate their trades internationally. Incense tree Aquilaria sinensis (Lour.) Spreng is native to southern China (Harvey-Brown, 2018) and carries special cultural values to Hong Kong, given the name Hong Kong (“Incense Harbour” or “Fragrant Harbour”) is commonly believed to have originated from the exporting of agarwood (or Chen Xiang in Cantonese) of this tree species since the Tang Dynasty (619–907 A. D.) [Kow-choy, 1983; Agriculture, Fisheries and Conservation Department (AFCD), 2013]. Although the cultivation of A. sinensis for the agarwood industry in Hong Kong ceased since the last century given pirates activities, remaining populations persist in the countryside of Hong Kong, including lowland, broad-leaved forests, and fung shui woods (Yip and Lai, 2004). Nevertheless, these natural populations are under threats of illegal felling and harvesting (Jim, 2015; AFCD, 2018; Chen et al., 2019).
Current conservation measures of A. sinensis are 2-fold. On one hand, A. sinensis is classified under the “List of Wild Plant Under State Protection (Category II)” in mainland China (State Council of the People's Republic of China, 1999) and is defined as a vulnerable species in the IUCN Red List of Threatened Species (Harvey-Brown, 2018). It is also listed in Appendix II of the Convention on International Trade in Endangered Species of Wild Fauna and Flora (CITES) (Newton and Soehartono, 2001). In Hong Kong, incense trees located within the Country Parks and Special Areas are protected by the Country Parks and Special Areas Regulations (Cap. 208A), while the remaining populations are prevented from damaging and felling under the Forests and Countryside Ordinance (Cap. 96) (AFCD, 2018). On top of these, cases involving the illegal felling of A. sinensis could be prosecuted under the Theft Ordinance (Cap. 210) with a maximum of 10-year imprisonment (AFCD, 2018). On the other hand, governments in both mainland China and Hong Kong have also expanded the cultivations and active planting of A. sinensis seedlings at different places (Yin et al., 2016; AFCD, 2018; Chen et al., 2019).
In the last two decades, various types of molecular markers ranging from amplified fragment length polymorphism to codominant markers [such as inter-simple sequence repeat, microsatellite and single -nucleotide polymorphisms (SNPs) from DNA barcoding] have been studied to authenticate A. sinensis and explore its genetic diversity (Zhao and Zhao, 2007; Zou et al., 2012; Pern et al., 2020; Kang, 2021). For instance, DNA barcode was applied for species identification of agarwood in the market (Lee et al., 2016). Recently, restriction site-associated DNA sequencing (RAD-seq) has also been employed to obtain 1,305 genic SNPs to trace the source of illegally traded A. sinensis in southern China Guangdong (Wang et al., 2020). Given the availability of its genomic resources (Ding et al., 2020; Nong et al., 2020), it is now possible to resequence genomes of individuals collected from different geographical locations to investigate the population structure and to inform conservation measures for this ecologically, economically, and culturally important species for this region of the Earth.
Materials and methods
Leaf sample collection, genomic DNA extraction, and whole -genome resequencing
In this study, 346 leaf samples were collected from incense tree individuals in Hong Kong (n = 306) and mainland China (n = 40) during two sampling periods, from November 2018 to March 2019 and from December 2020 to April 2021. Majority of the samples are of natural origin, including country parks in Hong Kong and indigenous forests in Guangxi, Hainan, and Guangdong Provinces in mainland China, and only 14 and 5 samples were collected from artificial plantations (such as botanical gardens and urban parks) in Hong Kong and mainland China, respectively. Genomic DNA (gDNA) was extracted from ~200 -mg leaf tissues using DNeasy Plant Mini Kit (Qiagen) following the manufacturer’s instructions. The quality and quantity of extracted gDNA were assessed by NanoDrop spectrophotometer (Thermo Scientific) and gel electrophoresis. Qualified gDNA samples were sent to Novogene for library preparation and sequencing at Illumina HiSeq platform. A low-coverage resequencing approach with a large sample size was taken in this study, where each sample was sequenced at least 2× coverage to reduce false positives in genotype calling (Fumagalli, 2013).
Genotype calling and filtering
Sequenced raw reads were trimmed by Trimmomatic (v0.39) (Bolger et al., 2014), cleaned with Kraken 2 (Wood et al., 2019), and aligned to the A. sinensis reference genome (Nong et al., 2020) with BWA-MEM (Li, 2013) using parameters “-t 30 -M -R.” Genotypes were called with commands “HaplotypeCaller” and “GenotypeGVCFs” from the Genome Analysis Toolkit (GATK, v4.1.2.0) (DePristo et al., 2011). Hard filtering was employed to filter out variants with the following criteria: quality by depth (QD) < 2.0, Fisher strand bias (FS) > 60.0, mapping quality (MQ) < 40.0, mapping quality rank sum test (MQRankSum) < -12.5, and read position rank sum test (ReadPosRankSum) < -8.0, as used in other tree population genomic studies (Salojärvi et al., 2017) and recommended by GATK (https://gatk.broadinstitute.org/hc/en-us/articles/360035890471-Hard-filtering-germline-short-variants). The remaining SNPs were further filtered for biallelic, missing threshold per SNP position at 10% and maximum depth at 2,400 (“–min-alleles 2 –max-alleles 2 –max-missing 0.90 –maxDP 2400”) using VCFtools (v0.1.16) (Danecek et al., 2011) to obtain confident SNPs, noted as SNP subset 1.
To elucidate the effects of transposable elements on SNPs, SNPs located on repeat elements were extracted and excluded from SNP subset 1 to generate SNP subsets 2 and 3, respectively. Linkage disequilibrium (LD) pruning and minor allele frequency (MAF) filtering at 2% and 5% were applied to SNP subsets 1–3. The resulting filtered subsets were assessed by principal component analysis (PCA) using PLINK (v1.90b6.10) (Purcell et al., 2007) to output the eigenvalues and eigenvectors. Principal components 1 and 2 were visualized in a 2D scatter plot in R with ggplot2 package.
Phylogenetic tree, population structure, and principal component analysis
Filtered subsets that could better reveal population clusters in PCA were used to construct a phylogenetic tree with the neighbor -joining (NJ) method and 1,000 bootstraps in R using poppr, ade4, ape, vcfR, and adegenet packages. Furthermore, model-based likelihood ADMIXTURE (v1.3.0) analysis was used to estimate the number of subpopulations (K) by searching K ranging from 1 to 10, where the least cross -validation (CV) value indicates the best K (Alexander et al., 2009). The Q values, which indicate admixture proportions of individuals, were visualized using boxplot together with the phylogenetic tree in Evolview v3 (Subramanian et al., 2019). In addition, to assess the level of genetic differentiation in a finer scale, hierarchical pairwise-FST were analyzed between geographical regions defined by sample grids of locality using the heirfstat package with 1,000 bootstraps to obtain 95% confidence interval in R (Goudet, 2005). To test the significance of genetic differences at the region/district level, analysis of molecular variance (AMOVA) with 1,000 permutations was performed in population pairs using poppr and ade4 packages in R (Dray and Dufour, 2007; Kamvar et al., 2015).
Effective population size and genetic diversity analysis
To estimate the effective population size, the pairwise sequentially Markovian coalescent (PSMC) method (Li and Durbin, 2011) was conducted on three samples with sequencing depth coverage > 20×, which are the reference genome (Nong et al., 2020), H769 (70.4×), and H0597 (26.3×). H769 was a tree individual illegally fallen in the Chinese University of Hong Kong and was not included in population genomic analyses, while H0597 was sampled in an urban park in Hong Kong. The PSMC was run with parameters as described in a previous tree population study (Sollars et al., 2017) with 100 bootstraps. The mutation rate (-u 7.5e-09) was taken from Arabidopsis thaliana (Buschiazzo et al., 2012), and the generation time was assumed at 7 years (-g 7). The resulting estimates of the effective population size were plotted in R.
Furthermore, the level of heterozygosity and inbreeding coefficient FIS were computed per individual, while Tajima’s D was calculated in groups with 1-kb windows using VCFtools (Danecek et al., 2011), followed by visualization in groups of geographical regions in R.
Genomic scan and PCR validation of SNPs
Genomic scans for detecting SNP outliers were conducted using SNP subset 1 with MAF of 2% (without LD pruning) to examine whether there are SNPs in a particular genomic region undergoing selection by comparing predefined population clusters using BayeScan (v2.1) (Foll and Gaggiotti, 2008). The default parameters for the Markov chain Monte Carlo (MCMC) analysis were used, including the prior odds for the neutral model at 10. A false discovery rate (FDR) threshold of 0.05 of the q-value was employed to identify significant outliers. These SNP outlier candidates were processed with SnpEff (Cingolani et al., 2012) for annotation and prediction on the effects of SNP variants in the gene models of the A. sinensis reference genome. The q-value and FST statistics of the analyzed SNPs were visualized in Manhattan plots with CMplot package in R (Yin et al., 2021). To validate the selected SNP outliers, primers were designed where the 3’ end of the forward primer was targeted for SNP mismatches. In silico tests were conducted by blasting the primer sequences in the A. sinensis genome for genome location specificity and by checking the primer criteria using online public tools (https://www.bioinformatics.org/sms2/pcr_primer_stats.html). PCRs were performed on the Bio-Rad T100 Thermal Cycler, with temperature profile of an initial 5 -min denaturation step at 94°C followed by 34 cycles (iterations of 50 s at 94°C, 50 s at 60°C, and 50 s at 72°C) and a final 10 -min extension at 72°C. Gel electrophoresis was carried out to visualize and confirm the amplification of the desired fragment of the target size.
Identification of cytochrome p450 gene families related to SNP outliers
Cytochrome P450 genes were identified from the gene model protein set of the A. sinensis reference assembly (Nong et al., 2020) by protein domain search (PF00067) in HMMER (v3.3.1) (Eddy, 2011). After validating sequences with CD-Search (https://www.ncbi.nlm.nih.gov/Structure/cdd/wrpsb.cgi) to remove false -positive domain hits, the protein sequences were aligned with plant CYP sequences of the cacao tree Theobroma cacao and A. thaliana retrieved from the Cytochrome P450 Homepage (https://drnelson.uthsc.edu/plants/) (Nelson, 2009) using MAFFT (v7.455) (–maxiterate 1000 –genafpair –ep 0). A phylogenetic tree was built using FastTree (Price et al., 2010) with the JTT model and visualized in Evolview v3 (Subramanian et al., 2019). Pairwise sequence identity of selected CYP families was computed using Clustal Omega (v1.2.4; Sievers et al., 2011). The genome locations on chromosomes of selected CYP families were visualized in TBtools (v1.055) (Chen et al., 2020). An expression profile of the identified CYP families was generated from published transcriptome resource, including a wounding stem treatment [stem tissues from intact (day 0) to wounded twice (on day 5 and day 6)] and various tissues such as young and mature leaves, young shoot, flower buds, flower, fruit flesh (pericarp and mesocarp), seed, and aril (Nong et al., 2020). Transcript per million (TPM) values were retrieved from mapped reads, which were visualized with row Z score in Heatmapper (Babicki et al., 2016).
DNA extraction optimization, resequencing, and tracing of agarwood
For the development of effective gDNA extraction method for agarwood samples, three extraction protocols were tested on 100 mg of fresh sapwood tissue of an A. sinensis individual, “TY01,” provided by the Agriculture, Fisheries and Conservation Department. The first protocol, named “DNeasy,” was the column-based isolation method modified from Jiao et al. (2014) using Qiagen DNeasy Plant Mini Kit. The second and third protocols, termed “CTAB” and “CTAB+P3,” respectively, were the phase separation -based method using hexadecyltrimethyl-ammonium bromide (CTAB), in which the latter included the addition of P3 solution (3M potassium acetate) from Qiagen DNeasy Plant Mini Kit in the step of removing contaminating biomolecules. Further details of the three protocols tested were summarized in Supplementary Table S1. Moreover, the addition of polyvinyl pyrrolidone (PVP) with 0% (control), 1%, 2%, and 5% (w/v) to the extraction buffer was tested in all three protocols. The quality of the extracted DNA samples was assessed by NanoDrop spectrophotometer (Thermo Scientific) and gel electrophoresis followed by PCR amplification using an A. sinensis-specific matK primer (Forward 5’ to 3’: CGTACAGTACTTTTGTGTTACGAG; Reverse 5’ to 3’: ACCCAGTCCATCTGGAAATCTTGGTTC; Farah et al., 2018). The optimized protocol was justified with the following criteria: 1) the absorbance ratio at 260 and 280 nm (A260/280) closest to 1.8, 2) intact band of gDNA sample in gel visualization, and 3) clear band of PCR product in gel visualization.
The optimized protocol was employed to extract gDNA from 10 agarwood samples, which were provided by the Agriculture, Fisheries and Conservation Department and were stored in a desiccator at room temperature for 30 days prior to extraction to mimic the storage condition during the process of forfeiture. gDNA samples that pass the quality control with NanoDrop spectrophotometer (Thermo Scientific), gel electrophoresis, and PCR amplification using the A. sinensis-specific matK primer were sent to Novogene for library preparation and sequencing. The gDNA of sapwood sample (TY01) was also sequenced as a positive control, and the Aquilaria agallocha genome sequence (Chen et al., 2014; GenBank ID: GCA_000696445.1) was used as an outgroup control. The raw read processing (adapter trimming and cleaning) and reference mapping were the same as the leaf samples described above. After SNPs were called GATK’s “HaplotypeCaller” individually (DePristo et al., 2011) and were collated with the SNPs from leaf samples with the step “genotypeGVCF,” which is designed for saving the computation cost in case of any addition of samples (n+1). The number of missing sites of wood and agarwood samples in the SNP subsets was inspected using VCFtools (v0.1.16) (Danecek et al., 2011). SNP loci of specific filtered SNP subset were extracted from the collated dataset to construct a neighbor-joining phylogenetic tree with a view to identify the relatedness between the wood/agarwood samples and certain individuals sequenced from leaf samples.
Results
Population structure of A. sinensis in mainland China and Hong Kong
A total of 346 A. sinensis samples were collected from mainland China and Hong Kong, and their distributions are shown in Figure 1. The resulting sequencing coverage of these samples were all >2×, with a median mapping rate of >99% (Supplementary Figure S1). In this study, 19,456,294 raw SNPs passing the hard filtering criteria were called, accounting for 2.72% of the total length of the eight chromosomes (~715 Mb). Subsequent filtering was performed with biallelic SNPs and missing threshold of 10% generated SNP subset 1 with 1,382,105 SNPs, which were further divided into SNP subset 2 (1,101,445 SNPs) and SNP subset 3 (280,660 SNPs) by including and excluding SNPs on annotated sequence repeats, respectively (Table 1). Further filtering with linkage disequilibrium (LD) pruning and minor allele frequencies (MAFs) contributed to derivatives of subsets A–D (Table 1). PCA plots revealed that SNP subset 3D (excluding repeats + LD pruning + MAF 5%) has the best clustering result to reflect the geographical origin of samples among other SNP subsets (Figure 2A; Supplementary Figure S2). Principal component (PC) 1 differentiates samples from districts D6 and D7 from other samples in Hong Kong, while PC2 separates samples between Hong Kong and mainland, where Guangxi samples were placed more apart (Figure 2A).
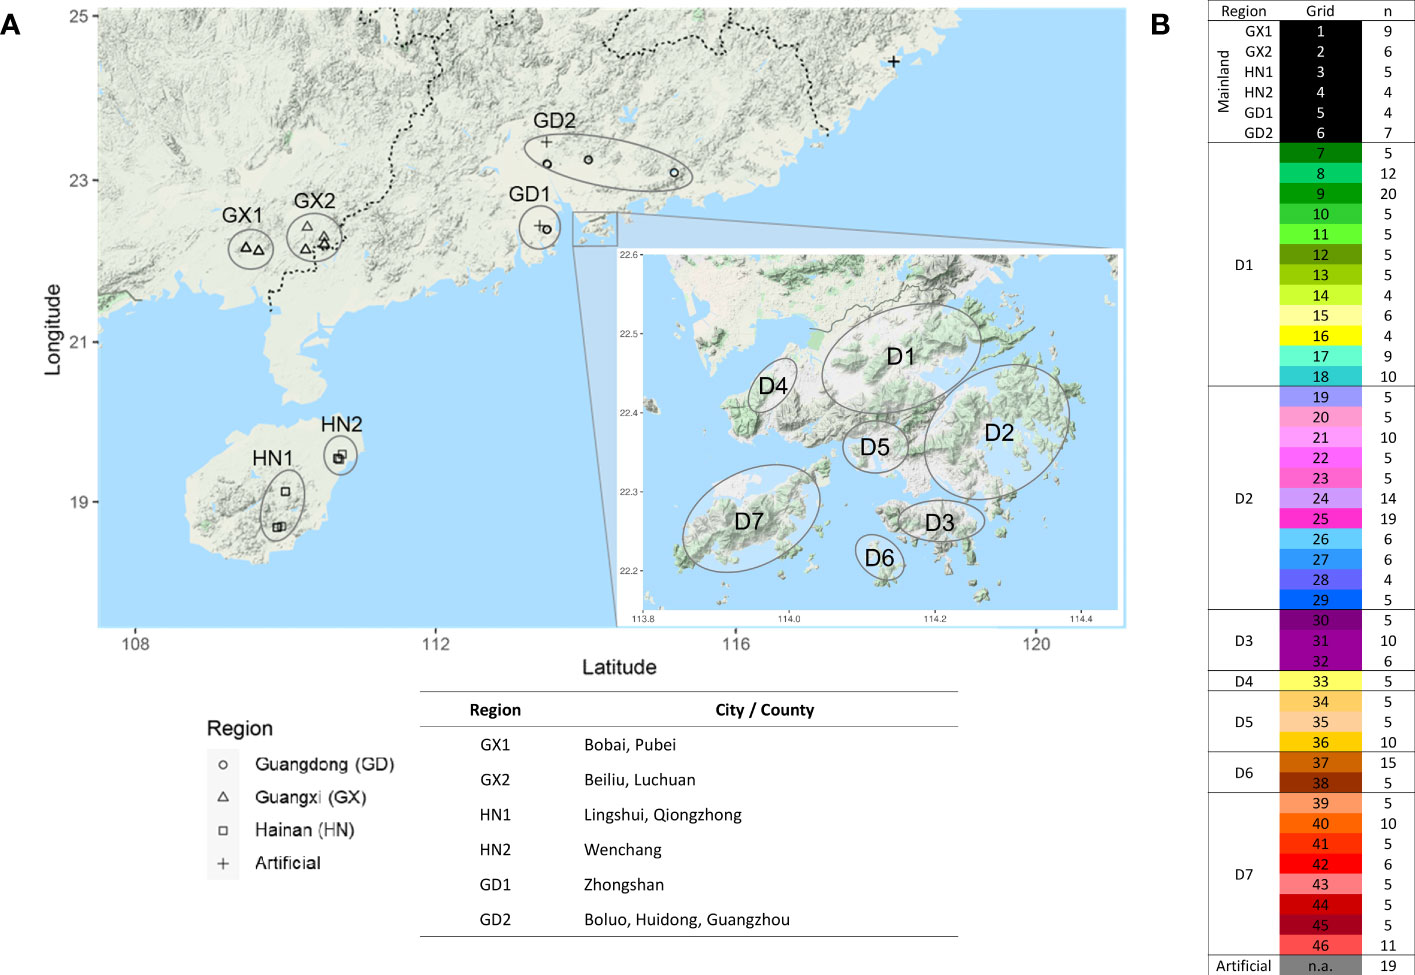
Figure 1 Sample distribution of 346 A. sinensis individuals from mainland and Hong Kong. (A) Geographical distribution. (B) Number of samples (n) collected in defined regions in mainland, including Guangdong (GD), Guangxi (GX), Hainan (HN), and defined grids from different districts in Hong Kong (D1–7), respectively.
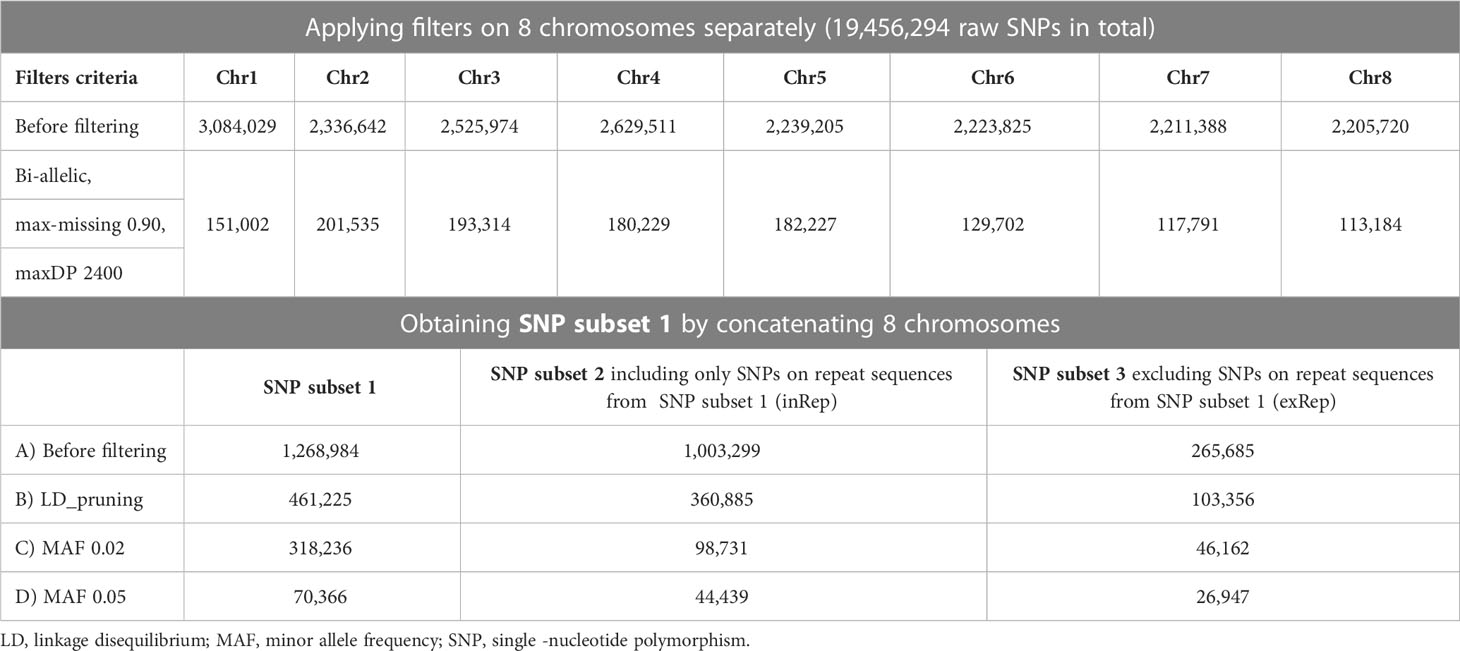
Table 1 Summary of SNP filtering results.
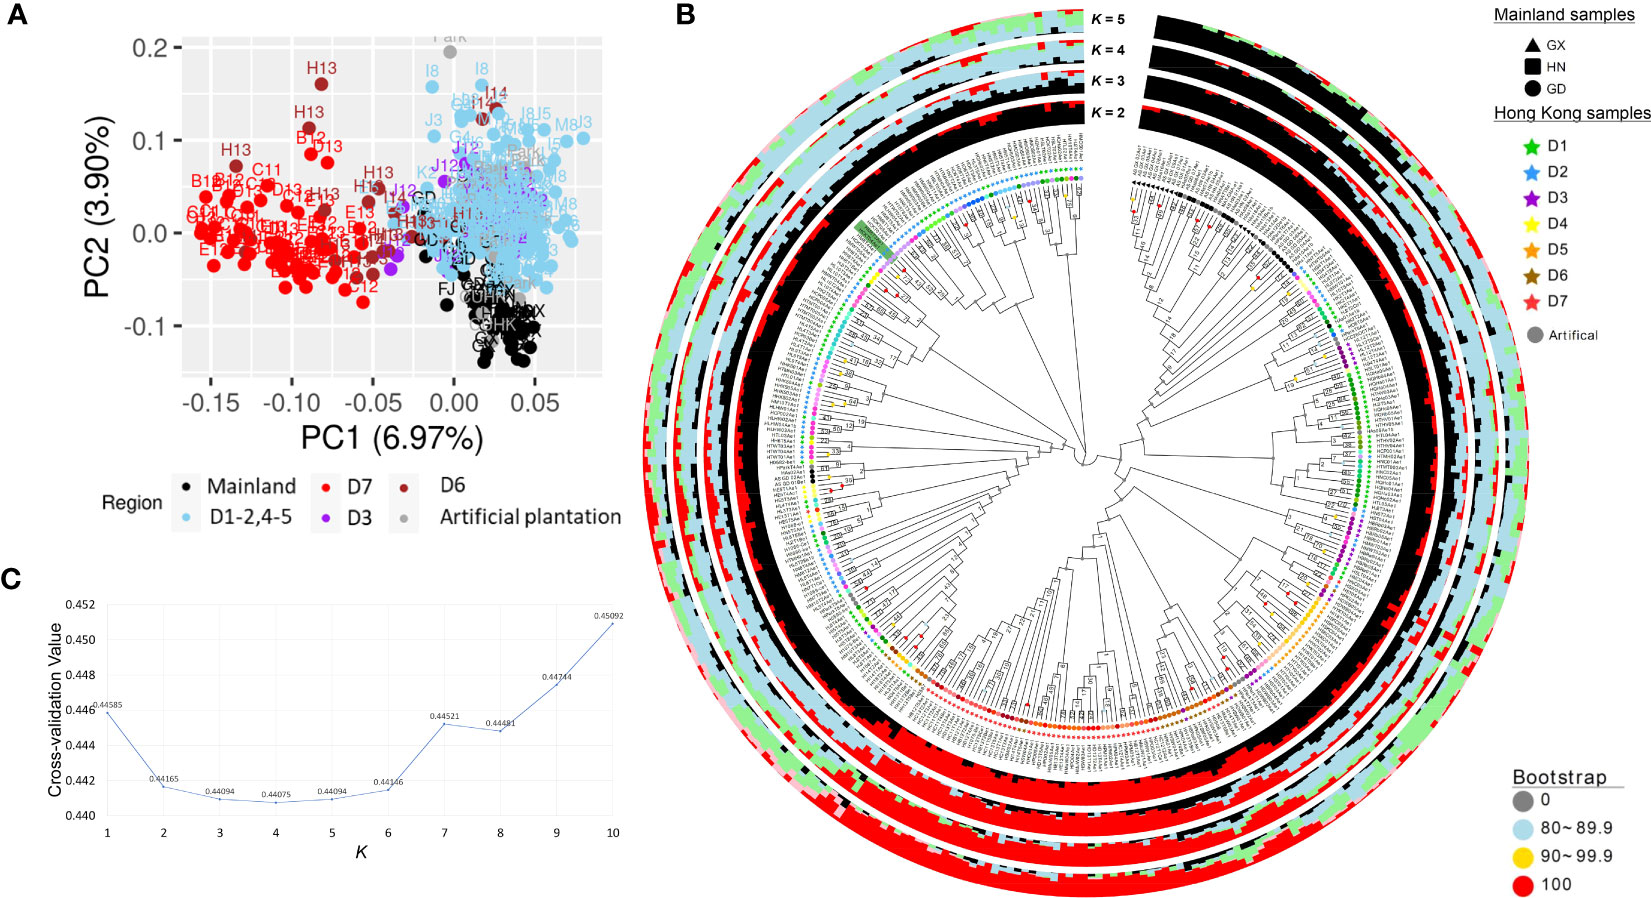
Figure 2 Population analyses of incense trees in mainland China and Hong Kong from SNP subset 3D (26,947 SNPs). (A) Principal component analysis (PCA) plot. (B) Neighbor -joining tree constructed with 1,000 bootstraps. The Hong Kong wild population samples at tips are colored according to the grid color in Figure 1, whereas mainland China samples and artificially planted samples with unknown origin are indicated as black and gray, respectively. The green highlight denotes the blind test sample pair of positive control (“HM8T3” and “HCKT04” from the same individual). The Q values at K = 2–5 from ADMIXTURE analysis are shown in bar plots, with different colors showing the corresponding ancestral subpopulation attributions. (C) Line plot of cross -validation (CV) values for K ranging from 2 to 10. The lower CV values are found at K from 2 to 6, suggesting there are at least two subpopulations.
Furthermore, a neighbor-joining tree was constructed with 1,000 bootstraps from SNP subset 3D (Figure 2B). The most inner nodes of the SNP tree were not well supported by bootstrap values, indicating that there might not be strong demographic effects. Nevertheless, bootstrap values generally increased in the outer nodes, showing that the confidence levels are higher at the outer branches. For instance, the phylogenetic tree revealed a cluster of mainland samples from Guangxi and Hainan at a bootstrap value of 50.5 and another cluster of the district D7 at a lower bootstrap value of 10.7. Although these clusters were not well supported, they are in coherence with the clustering patterns in the PCA plot. Meanwhile, 4 out of 11 Guangdong samples (HAs01-02, and As_GD_01-02 from grid “GD2”) were admixed with Hong Kong individuals located in district D1.
To further investigate the possible number of subpopulations, ADMIXTURE analysis was run with K ranging from 1 to 10 using SNP subset 3D. The least CV values were found at K from 2 to 6, with the lowest being at K = 4 (CV value 0.43132) (Figure 2C), suggesting there are at least two and likely four subpopulations. At K = 2, the ancestral subpopulation attributes were contrasted by samples from mainland China and district D7 (Figure 2B). Interestingly, the remaining Hong Kong samples (districts D1–5) share a higher proportion of ancestral attributes with mainland China samples at K = 2 and carry a higher extent of admixed ancestry when K = 3 and 4. This suggests that most Hong Kong individuals share a closer common ancestry with mainland individuals, except those from district D7.
To examine the population genetic diversity at a finer scale, hierarchical pairwise-FST was computed between groups of samples defined in the sample grids according to Figure 1B with SNP subset 3D (Figure 3; Supplementary Figure S3A). Higher genetic differences were observed between samples from mainland China (except grid “GD2” from Guangdong) and all samples from Hong Kong, which is consistent with the “Guangxi and Hainan” cluster in the phylogenetic tree in Figure 2B. Moreover, samples from district D7 have higher FST values with most other localities in Hong Kong (districts D1 –D5), except district D6. This pattern is coherent to the contrasted source of ancestry examined in ADMIXTURE analysis. However, the overall FST values were low (less than 0.1) in the neutral SNP subset 3D, and the highest value is only 0.055 between Guangxi “GX1” and grid “39” from district D7. The significance of genetic differentiation of population pairs defined by mainland regions and district was further tested with AMOVA (Table 2; Supplementary Figure S3B), and significant genetic differentiation (p-value <0.01) was observed between D7 and all other regions/districts (Supplementary Figure 3B).
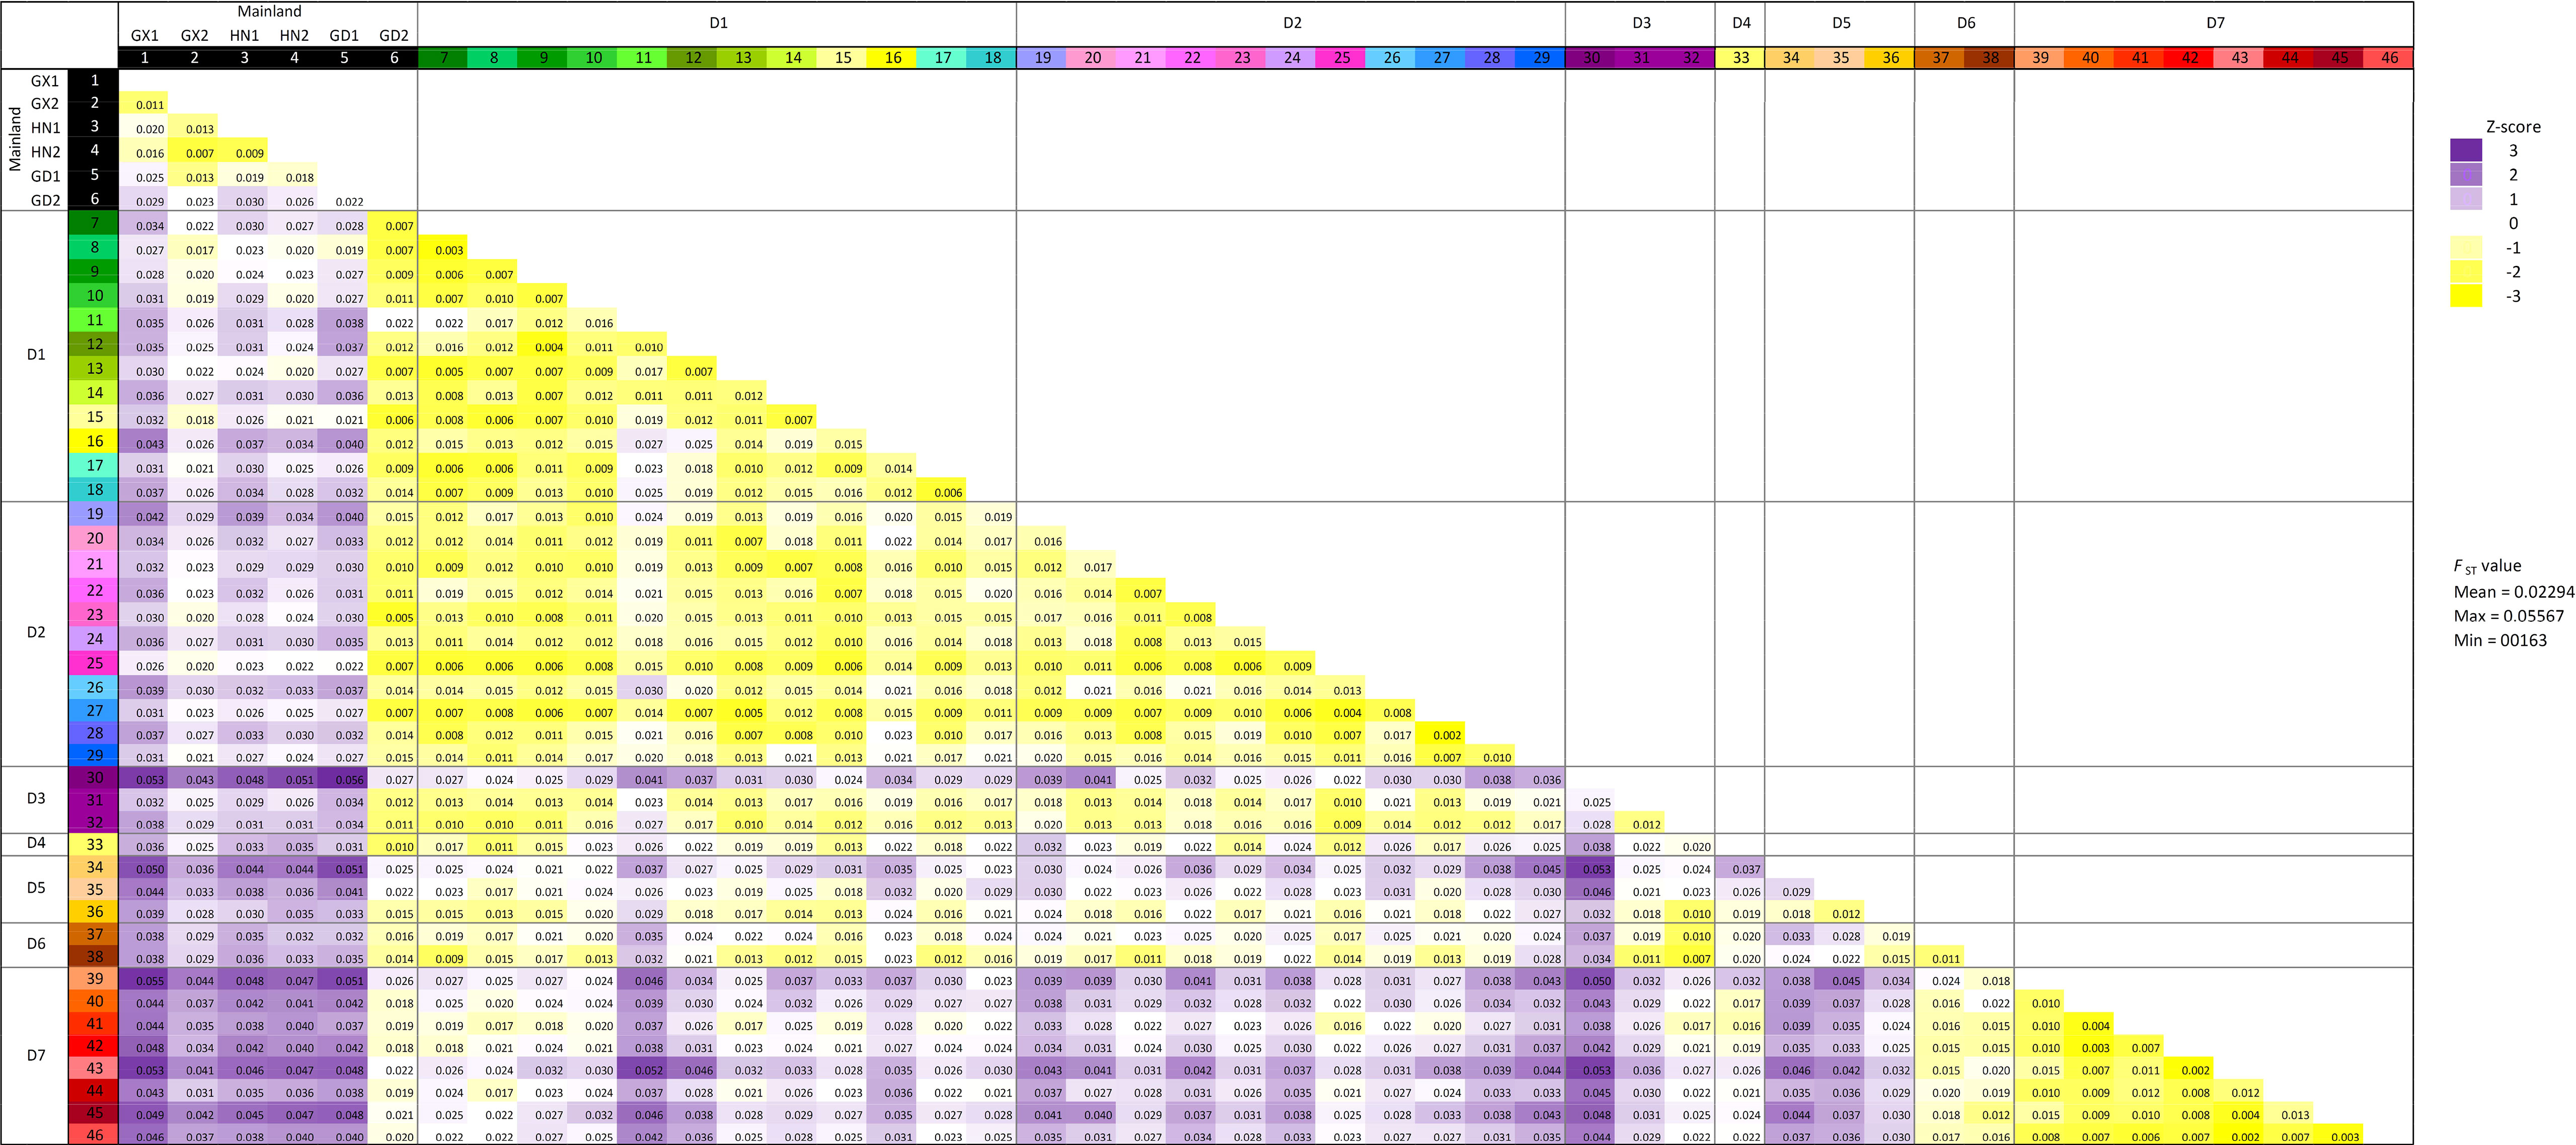
Figure 3 Pairwise FST distance matrix from heirfstat. The geographical regions are defined by sample grids in Figure 1B. FST values are colored according to Z-score calculation, where FST values that are higher and lower than the mean (0.02294) are in colored purple and yellow, respectively.
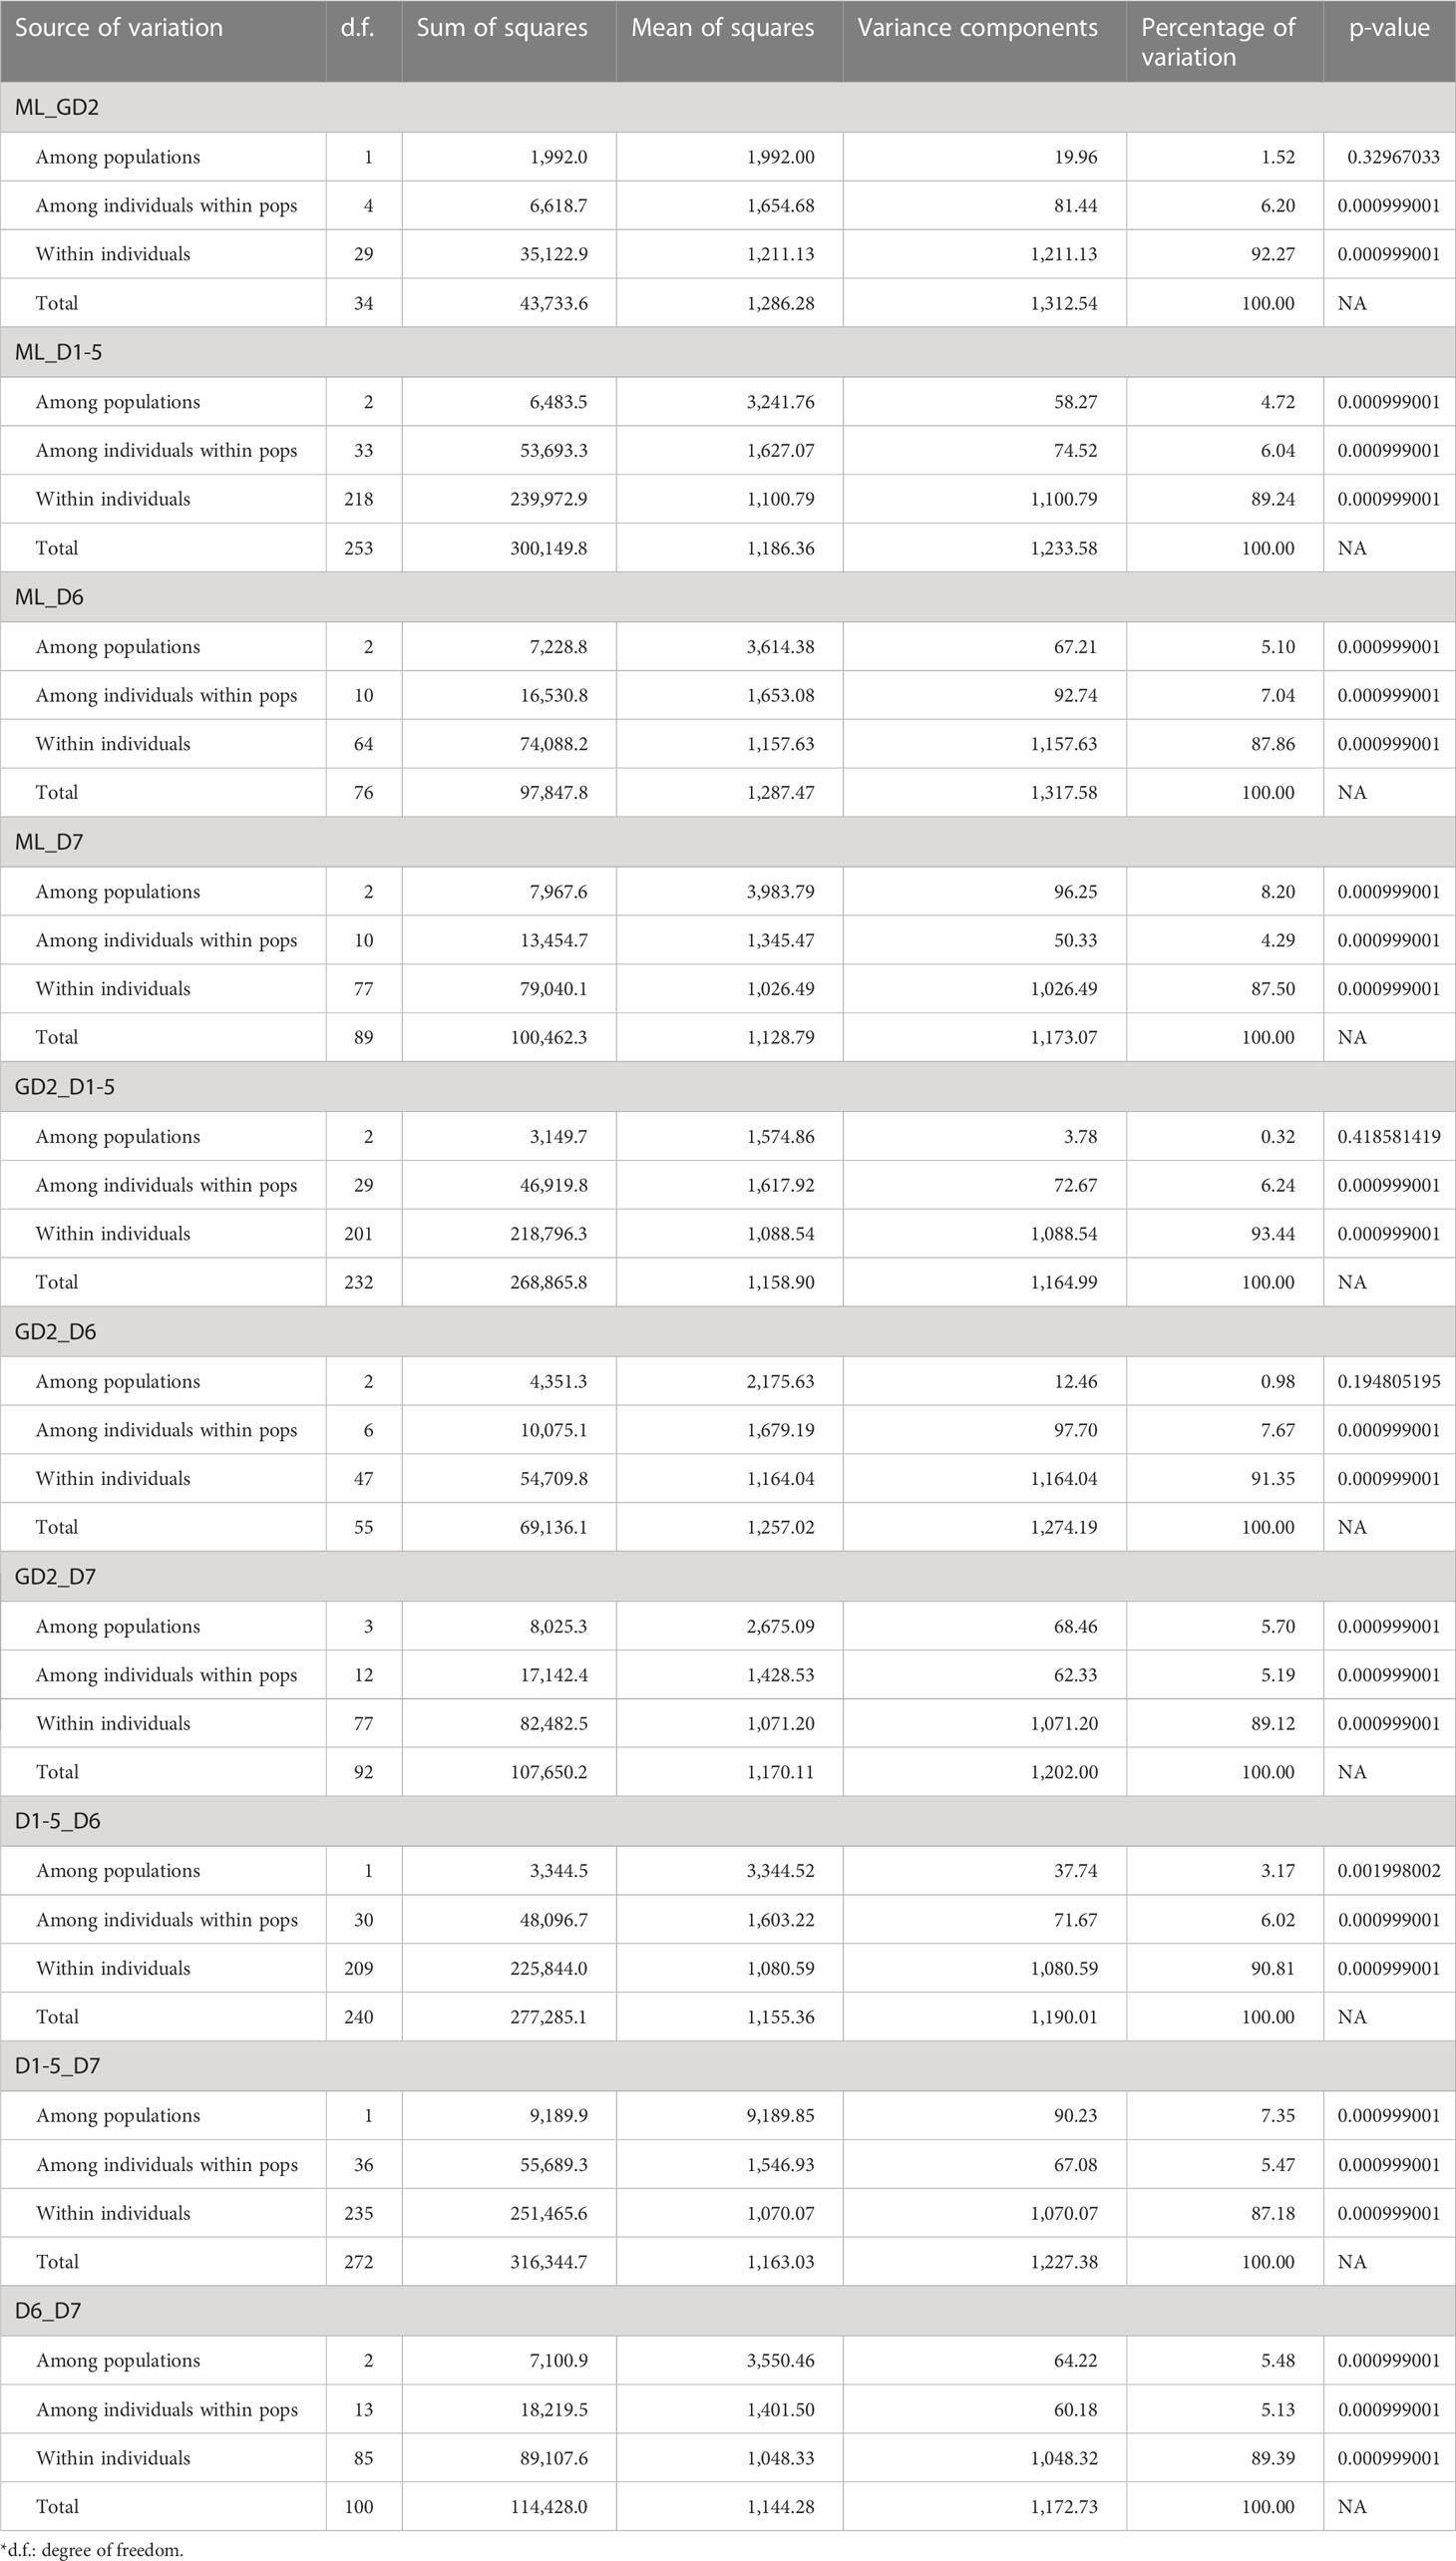
Table 2 Summary on analysis of molecular variance (AMOVA).
Effective population size and genetic diversity analysis
It was estimated that the current effective population size of the incense tree ranges from ~2,800 to ~8,800 with bootstrap intervals spanning from 1,250 to 18,000 after a continuous population decline since ~200,000 years ago (Figure 4). Signal of inbreeding was observed in population groups in Hong Kong (except district D4) and grid “GD2” from Guangdong, with means of inbreeding coefficient (FIS) ranging from 0.02 to 0.12 (Supplementary Figure S4A–C). However, the mean values of genome-wide Tajima’s D from all population groups were below zero (from -1.11 to -0.15), showing that all populations are undergoing expansion and apart from a recent population bottleneck (Supplementary Figure S4D).
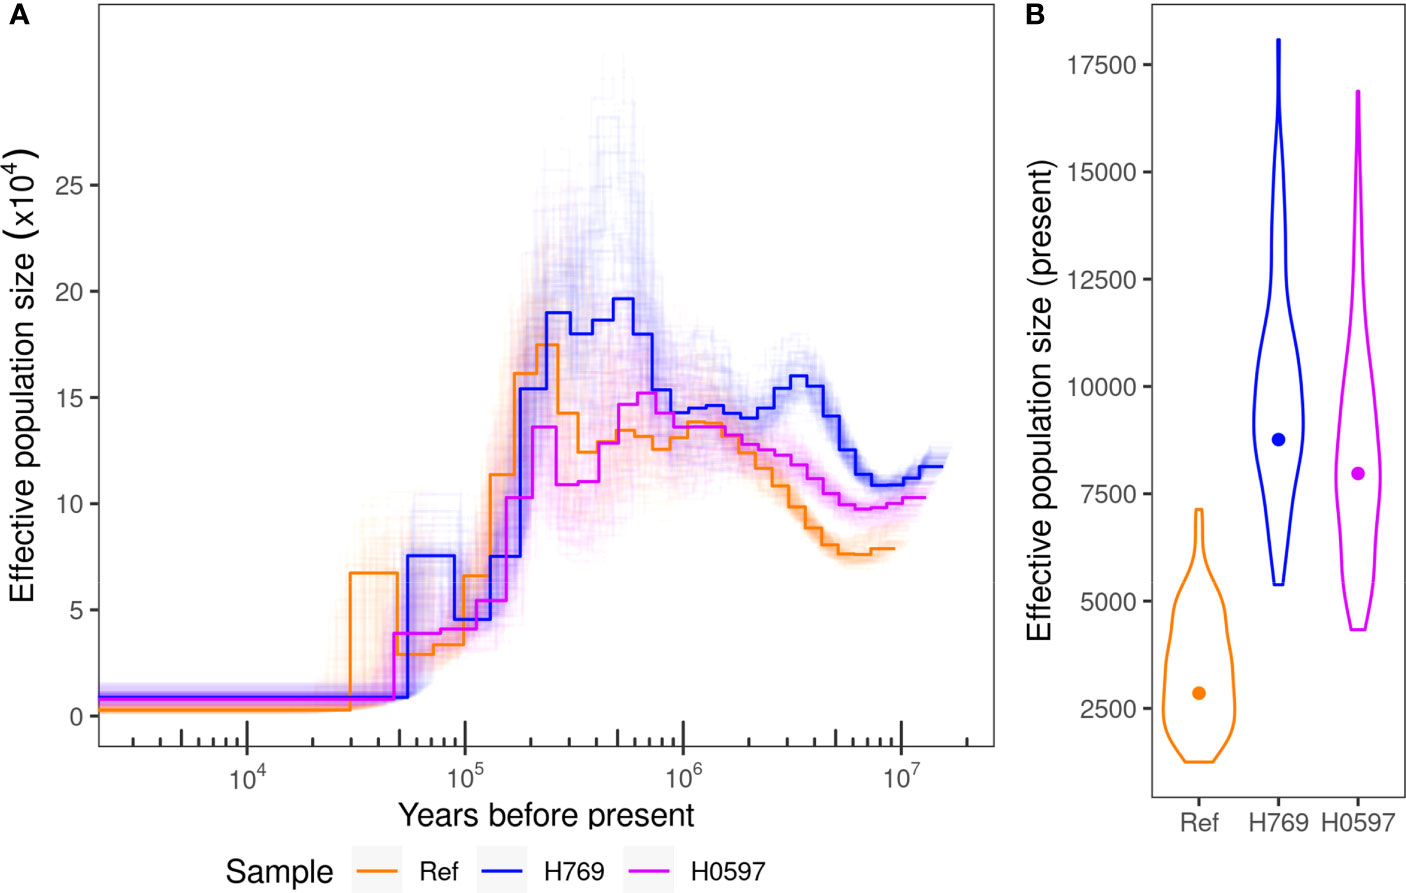
Figure 4 (A) Effective population size history estimated with PSMC method on three samples, the reference genome, H769, and H0579, with 100 bootstraps shown in light lines. (B) Current population size estimates from the three samples with the distribution of bootstrap values shown in violin plots.
Identification of SNP outliers in populations
To search for outlier SNPs that are potentially adaptive or under selection, genomic scans for detecting SNP outliers were conducted using SNP subset 1 with MAF of 2% (without LD pruning) by comparison between mainland China (Guangxi and Hainan, n = 24) and district D7 (n = 52) samples and between districts D1–D5 (n = 221) and district D7 samples (Figure 5A). The false discovery rate (FDR) threshold of q-value at 0.05 identified 131 and 206 SNP outliers from mainland China vs. district D7 and districts D1–D5 vs. district D7, respectively. The functions of associated genes with outlier SNPs include growth development (WAT1-related protein and Agamous-like MADS-box protein AGL12), stress-related responses (resistance gene, cytochrome P450, cysteine-rich RECEPTOR-like protein kinase 8, 23 -kDa jasmonate-induced protein-like) (Figure 5A). Notably, a considerable portion of the SNP outliers were located at the intergenic or upstream region of CYP71BE gene clusters with strong linkage disequilibrium (Figure 5B), and it is worth to mention that the associated CYP71BE gene clusters were highly expressed in wounded stem tissues (Supplementary Figure S5). A pair of primers was designed to validate the genotype of an SNP marker at this genomic region and successfully matched genotypes on 19 selected mainland China samples (Supplementary Figure S6).
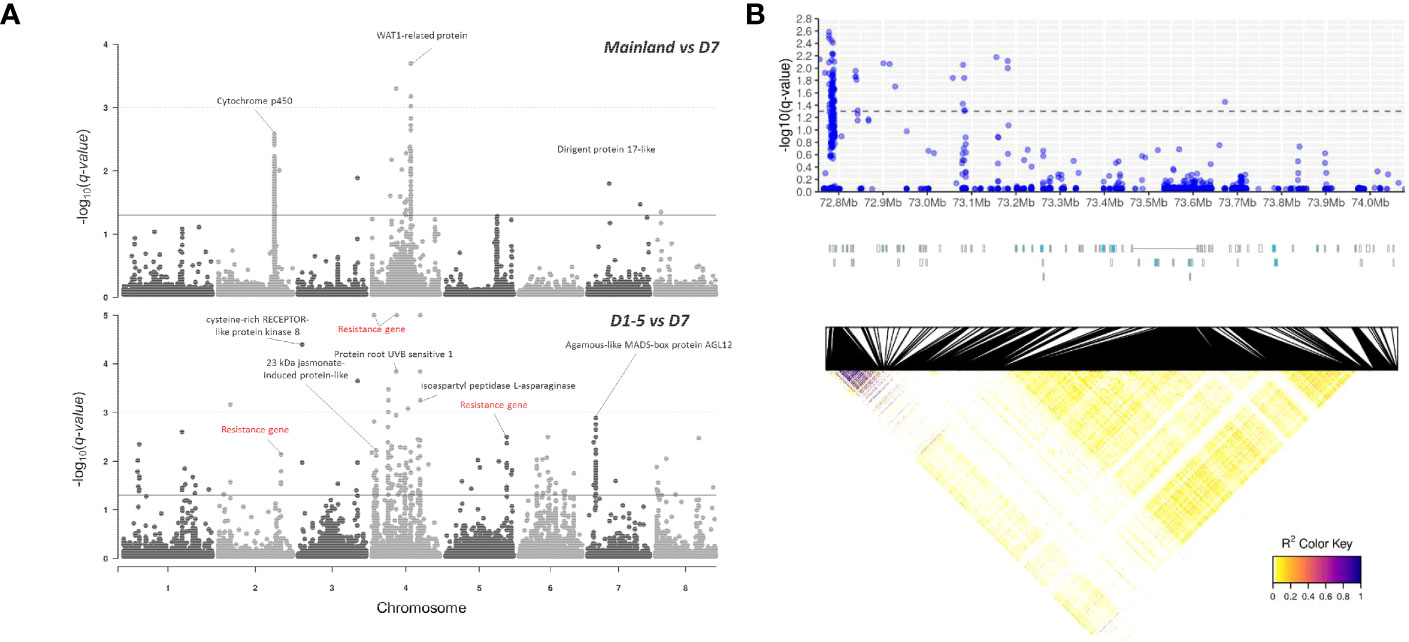
Figure 5 (A) Manhattan plot of q-values from BayeScan analyses between mainland and district D7 groups (upper panel) and between districts D1–5 and district D7 groups (lower panel). The solid and dashed horizontal lines indicate the false discovery rate thresholds of q-values at 0.05 and 0.001, respectively. Red labels indicate missense SNP variants. (B) Enlarged scale of SNP outliers detected across CYP71BE gene clusters across ~1.2 Mb region on chromosome 2, visualized with -log10 (q-value) (upper panel), annotation track of 33 CYP71BE genes indicated in blue (middle panel), and heatmap of linkage disequilibrium (r2) statistics between loci in this genomic region (lower panel).
DNA extraction optimization, resequencing, and tracing of agarwood
Three DNA extraction protocols, namely, “DNeasy,” “CTAB,” and “CTAB+P3,” were tested with 100 mg of wood tissue sample (from individual TY01) in different concentrations [0%, 1%, 2%, and 5% (w/v)] of polyvinyl pyrrolidone (PVP). It was observed that the DNA extracted from the “CTAB+P3 + 1%PVP” protocol has the closest absorbance ratio A260/280 to 1.80, indicating a higher quality of DNA (Supplementary Figures S7A, B). A stable concentration range (approximately 15–20 ng/µL) and band intensity were observed from “DNeasy” and “CTAB+P3” protocols but not in “CTAB” (Supplementary Figure S7C). The absence of “P3” solution could be prone to failure in the removal of biocontaminants, as reflected by low absorbance ratios of A260/230. Nevertheless, DNA samples from all extraction combinations were successfully amplified with A. sinensis-specific matK primer (Supplementary Figure S7D). Therefore, “CTAB+P3 + 1% PVP” is considered as the optimized protocol, as it gives the best DNA quality and is not limited by the column capacity as in “DNeasy.”
The optimized “CTAB+P3 + 1% PVP” protocol was applied to the extraction of genomic DNA from 10 agarwood samples (Supplementary Figure S8). During sample disruption, it was noted that the agarwood samples consist of woody and resinous tissues while some woody tissues are darker or more grayish in color (Supplementary Figure S8). Therefore, DNA extraction was performed on the woody and resinous tissues separately. Higher concentrations of DNA were yielded from the resinous tissues in general (Supplementary Figure S9). However, DNA samples from woody tissues have a higher successful rate (7 out of 10) in PCR amplification, in which the failed samples were those with grayish color in the woody tissue (Supplementary Figure S9). Conversely, a lower successful rate (only 2 out of 10) in PCR amplification was observed in resinous tissues. Therefore, the seven successfully amplified DNA samples of woody tissue of agarwood (NAg_01-06, and -10) together with the DNA sample from wood (bark of TY01, as a positive control) were used for resequencing.
To investigate whether the sequenced wood (Bark_TY01) and agarwood samples (NAg_01-06, and -10) could be clustered into certain population groups, their performance in alignment to the reference genome and the number of informative SNPs (SNP positions without missing data) that were successfully mapped to SNP subset 3D were examined (Table 2). To further compare the effect of the number of informative sites on phylogenetic tree construction, two phylogenetic trees were built based on the SNP positions available in “NAg_03” (23,303 SNPs) and “NAg_05” (23,900 SNPs) (Figure 6), respectively. Notably, wood sample “Bark_TY01” had a bootstrap value of 100 at the node shared with the corresponding leaf sample of the same individual (HTY01Ae1) in both phylogenetic trees. Agarwood sample “NAg_03” was clustered with “HK2T3Ae1” (bootstrap value of 42) and further with “HK2T2Ae1” (bootstrap value of 21) based on the SNP set with its available SNP positions (Figure 6A), but it was clustered with the outgroup lineages in the phylogenetic tree constructed from SNP positions available in “NAg_05” (Figure 6B). Moreover, “NAg_05” was clustered with “HSKC01Ae1” and “HSKC03Ae1” with bootstrap values of 63.7 and 56.9 in Figures 6A, B, respectively. It was noted that these two agarwood samples were clustered to the relevant localities; “NAg_03,” “HK2T2Ae1,” and “HK2T3Ae1” were collected from the same location in grid 8 in district D1, while “NAg_05,” “HSCK01Ae1,” and “HSKC03Ae1” were sampled from grid 36 in district D5. Other agarwood samples covering less than 90% informative sites (“NAg_01,02,04,06,10”) did not cluster with any A. sinensis samples but remained with the outgroup. The low extent of mapping rate of these samples, ranging from 0.08% (NAg_04) to 55.41% (NAg_02) (Table 3), was probably due to contaminated reads from bacteria or fungi that coexisted in the agarwood sample and were not recognized by the read-cleaning process in Kraken analysis.
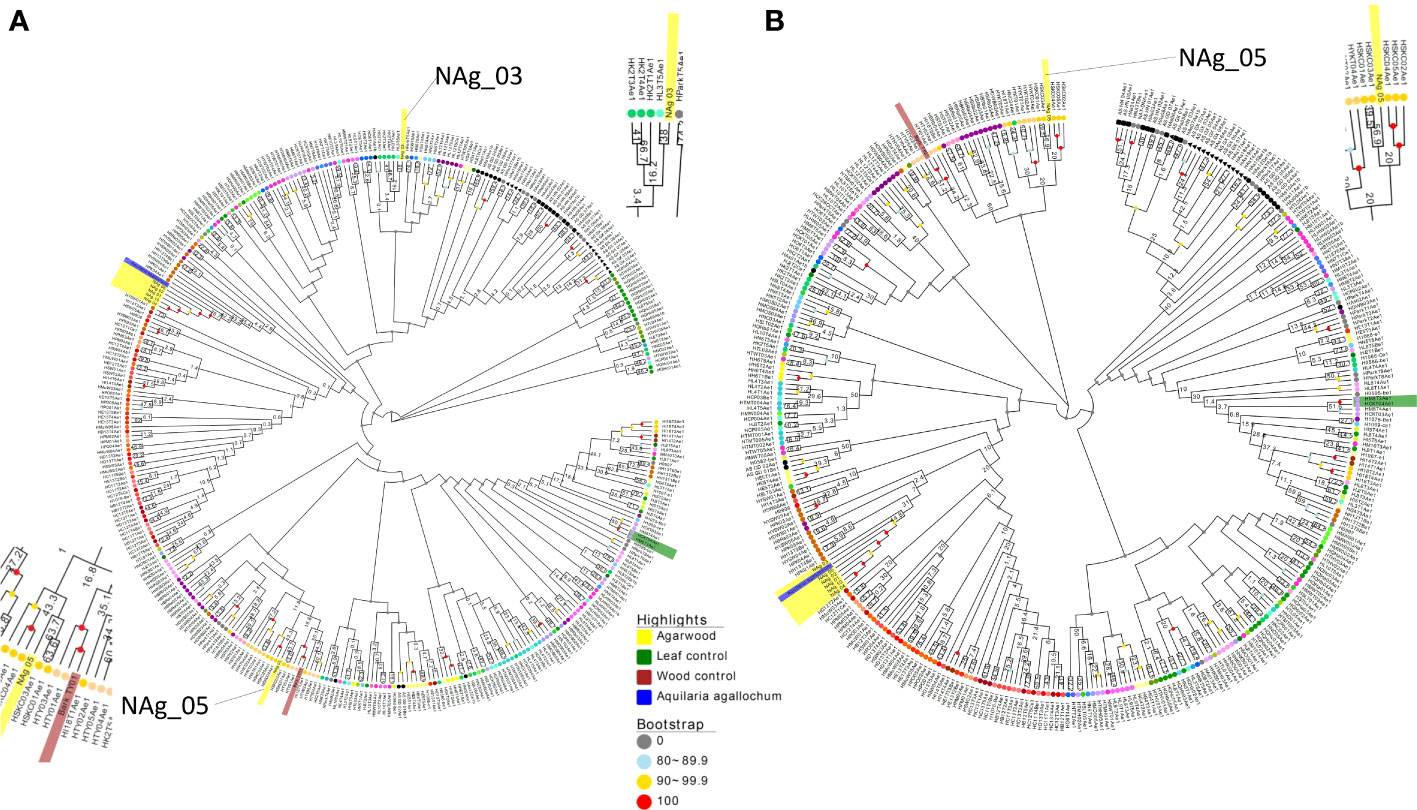
Figure 6 Neighbor -joining tree constructed from available informative SNPs in SNP subset 3D from agarwood sample NAg_03 (23,303 SNPs) (A) and Nag_05 (23,900 SNPs) (B) with 1,000 bootstraps. Wood and agarwood samples are highlighted in green and yellow, respectively, while the outgroup A. agallochum is shown in blue. The Hong Kong wild population samples at terminal nodes are colored according to the grid color in Figure 1, whereas mainland China samples and park samples with unknown origin are indicated as black and gray, respectively.
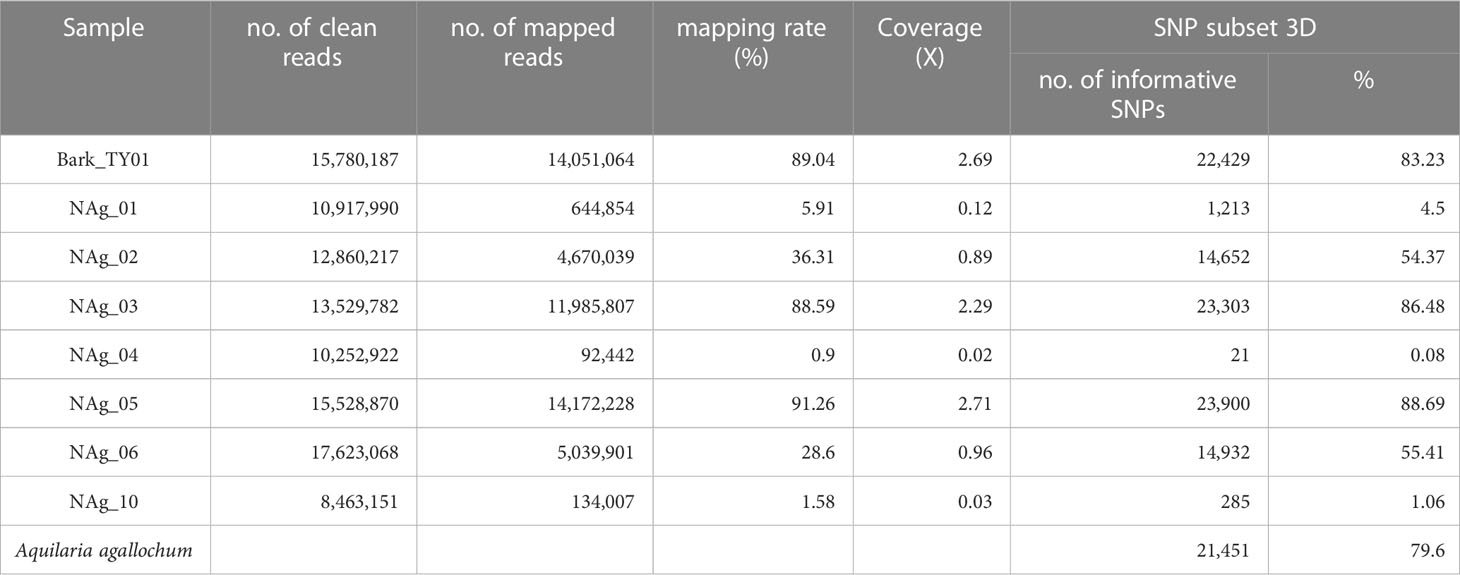
Table 3 Summary on the alignment results and informative SNPs in SNP subset 3D from sequenced wood and agarwood samples.
Discussion
Genetic diversity of A. sinensis
This study by far encompasses the most comprehensive distributions of A. sinensis populations, including those from three provinces in southern China and most populations in Hong Kong. Our population analyses revealed significantly higher genetic differentiation between populations from mainland China (Guangxi, Hainan, and grid “GD1” from Guangdong, except grid “GD2”) and all samples from Hong Kong. This coheres with the previous population genetic study that distinguished the Zhongshan population (which is equivalent to “GD1” in this study) from the cultivated sources in Guangdong (Wang et al., 2020). Meanwhile, the admixture of some samples from grid “GD2” in Guangdong with Hong Kong samples echoes historical documentations that incense trees in Hong Kong were cultivated from “Kuan-heung” (which means incense trees originated from Dongguan, Guangdong) long time ago (Kow-choy, 1983). This could also explain the higher inbreeding signals observed in grid “GD2” and major populations in Hong Kong. Nevertheless, no signs of population bottleneck were detected in any population groups, which is an encouragement for ongoing planting schemes. On top of that, this study unveils the existence of an incense tree population from district D7 in Hong Kong, which is significantly differentiated from other districts. Two documented A. sinensis cultivation sites, Lik Yuen and Sha Lo Wan, were located in districts D1 and D7, respectively (Kow-choy, 1983), and the high degree of genetic difference could be driven by independent cultivations in the past. It is noteworthy that district D7 is an island, which could prevent gene flow with populations on the continent and other islands after the cease of incense tree industry. While it is still unclear whether this was directly caused by cultivation activities in the past or geographical constraints, this marks the appreciation of genetic diversity of this precious tree species in Hong Kong.
Detection of SNP outliers at the upstream region of CYP71BE gene clusters
From the genomic scan analysis, the annotation of SNP outliers identified signals of selection at the upstream region of CYP71BE gene clusters. Although plant cytochrome P450 families are known for taking part in stress response and oxidation of sesquiterpenes (Weitzel and Simonsen, 2013), little was known in the genus Aquilaria until a recent genome-wide study of CYPs in A. agallocha (Das et al., 2023). The CYP71 family contains the largest number of differentially expressed genes under stressed induction in A. agallocha (Das et al., 2023). In A. sinensis, the CYP71BE members are expanded in forms of gene cluster and are highly expressed in wounded tissues similar to A. agallocha. However, further investigation is needed to understand the function of these gene clusters and the effect of SNP outliers found in mainland populations [Hainan + Guangxi + Guangdong1 (GD1)].
Feasibility of tracing forfeited/illegally traded agarwood with new extraction and resequencing methods
Applying the resequencing technology to tracing the source of agarwood requires a few breakthroughs of sequential barriers. The modified “CTAB+P3 + 1% PVP” protocol enabled DNA extraction from 7 out of 10 agarwood samples, from which two resequenced agarwood samples were successfully mapped to the reference genome and cluster to known localities in phylogenetic tree analyses. The results demonstrate that the modified DNA extraction protocol was effective in removing contaminants such as polysaccharides, but the main challenge remains in the extent of bacterial/fungal infection in the agarwood tissue. Increasing the sequencing depth could be a possible solution to generate more reads that could be mapped to the reference genome. However, the effectiveness of this option needs to be further tested. Nevertheless, this could provide insight to handle agarwood specimens upon forfeiture, such as sampling agarwood/sapwood as soon as possible in the cases of illegal felling and/or avoiding further biodegradation of samples.
Indeed, the role of whole-genome sequencing is increasingly important in the field of forensic DNA analysis, given that the establishment of a DNA database has become more available (Daeid et al., 2021). In recent years, the approach of whole-genome sequencing and comparing the SNPs from DNA at a crime scene to an SNP dataset was taken as part of the investigative genetic genealogy (IGG), which successfully identified candidates of suspect in a double murder case (Tillmar et al., 2021). In this study, two sets of positive controls, a leaf and a fresh sapwood sample, underwent the processes of DNA extraction, resequencing, mapping to reference genome, and variant calling and were successfully clustered to the exact individual in phylogenetic tree at 100% bootstrap value. This marks that the SNP subset can be potentially used to match a sample of query to a known individual with assessed confidence level. However, a large sampling size of database is essential to contain representative genotypes, if not all, in each population in a mature DNA genomic database.
Further conservation implications
Advances in sequencing technology has empowered and envisioned the understanding of biodiversity in the context of evolution and conservation. In recent years, there are emerging projects that aim to sequence the genomes in a defined biogeographic region, such as the EarthBioGenome Project (Lewin et al., 2018) and Darwin Tree of Life project, which are going to sequence all eukaryotic genomes in Britain and Ireland (Darwin Tree of Life Project Consortium, 2022). In this study, a genetically distinct subpopulation on island D7 was identified in Hong Kong, and special conservation measures such as consideration of outlining protected areas and detailed surveillance of A. sinensis individuals on D7 would be needed to conserve the genetic diversities of A. sinensis. In addition, where mature individuals are becoming rare and prone to illegal poaching, how to enhance the power of gathering crime evidence for law enforcement would also be needed for the protection of this species. Therefore, the 346 individuals sequenced in this study could be the starting point for establishing a genomic database/foundation of this species of conservation concern.
Data availability statement
The datasets presented in this study can be found in online repositories. The names of the repository/repositories and accession number(s) can be found below: https://www.ncbi.nlm.nih.gov/, PRJNA966896.
Author contributions
SL–formal analyses and article writing. WN–formal analyses and article writing. HY–logistics, sample collection, and article writing. EL–sample collection and article writing. TN–sample collection and article writing. RT–sample collection and article writing. NX–sample collection and article writing. PS–conceptualization, funding acquisition, and article writing. H-ML–conceptualization, funding acquisition, and article writing. DL–conceptualization, sample collection, funding acquisition, and article writing. JH–conceptualization, supervision, funding acquisition, and article writing. All authors contributed to the article and approved the submitted version.
Funding
This study was funded by Hong Kong Research Grant Council Collaborative Research Fund (C4015-20EF), The Chinese University of Hong Kong Direct Grant (4053547), CUHK Group Research Scheme (3110154), CUHK Strategic Seed Funding for Collaborative Research Scheme (3133356), CUHK Project Impact Enhancement Fund (3133283), Li Dak Sum Yip Yio Chin R & D Centre for Chinese Medicine, The Chinese University of Hong Kong and Agriculture, Fisheries and Conservation Department, Hong Kong Special Administrative Region (AFCD/SQ/125/18 and AFCD/SQ/123/20). SL was supported by PhD studentship provided by The Chinese University of Hong Kong.
Conflict of interest
The authors declare that the research was conducted in the absence of any commercial or financial relationships that could be construed as a potential conflict of interest.
Publisher’s note
All claims expressed in this article are solely those of the authors and do not necessarily represent those of their affiliated organizations, or those of the publisher, the editors and the reviewers. Any product that may be evaluated in this article, or claim that may be made by its manufacturer, is not guaranteed or endorsed by the publisher.
Supplementary material
The Supplementary Material for this article can be found online at: https://www.frontiersin.org/articles/10.3389/fevo.2023.1216370/full#supplementary-material
References
Agriculture, Fisheries and Conservation Department (2013) Status of Aquilaria sinensis (Incense Tree) in Hong Kong. Available at: http://www.epd.gov.hk/epd/sites/default/files/epd/english/boards/advisory_council/files/ncsc_paper03_2013.pdf.
Agriculture, Fisheries and Conservation Department (2018). “Incense tree (Aquilaria sinensis) species action plan 2018-2022” in Agriculture, Fisheries, and Conservation Department Press Releases. Available at: https://www.afcd.gov.hk/english/conservation/con_flo/con_flo_con/files/Incense_Tree_SAP_final.pdf.
Alexander D. H., Novembre J., Lange K. (2009). Fast model-based estimation of ancestry in unrelated individuals. Genome Res. 19, 1655–1664. doi: 10.1101/gr.094052.109
Babicki S., Arndt D., Marcu A., Liang Y., Grant J. R., Maciejewski A., et al. (2016). Heatmapper: web-enabled heat mapping for all. Nucleic Acids Res. 44 (W1), W147–W153. doi: 10.1093/nar/gkw419
Bolger A. M., Lohse M., Usadel B. (2014). Trimmomatic: a flexible trimmer for Illumina sequence data. Bioinformatics 30 (15), 2114–2120. doi: 10.1093/bioinformatics/btu170
Buschiazzo E., Ritland C., Bohlmann J., Ritland K. (2012). Slow but not low: genomic comparisons reveal slower evolutionary rate and higher dN/dS in conifers compared to angiosperms. BMC Evol. Biol. 12, 1–15. doi: 10.1186/1471-2148-12-8
Chen C., Chen H., Zhang Y., Thomas H. R., Frank M. H., He Y., et al. (2020). TBtools: an integrative toolkit developed for interactive analyses of big biological data. Mol. Plant 13 (8), 1194–1202. doi: 10.1016/j.molp.2020.06.009
Chen C. H., Kuo T. C. Y., Yang M. H., Chien T. Y., Chu M. J., Huang L. C., et al. (2014). Identification of cucurbitacins and assembly of a draft genome for Aquilaria agallocha. BMC Genomics 15 (1), 1–11. doi: 10.1186/1471-2164-15-578
Chen Y., Liu H., Heinen J. (2019). Challenges in the conservation of an over-harvested plant species with high socioeconomic values. Sustainability 11 (15), 4194. doi: 10.3390/su11154194
Cingolani P., Platts A., Wang L. L., Coon M., Nguyen T., Wang L., et al. (2012). A program for annotating and predicting the effects of single nucleotide polymorphisms, SnpEff: SNPs in the genome of Drosophila melanogaster strain w1118; iso-2; iso-3. Fly 6 (2), 80–92. doi: 10.4161/fly.19695
Daeid N. N., Hackman L., Haddrill P. R. (2021). Developments in forensic DNA analysis. Emerging Topics Life Sci. 5 (3), 381–393. doi: 10.1042/ETLS20200304
Danecek P., Auton A., Abecasis G., Albers C. A., Banks E., DePristo M. A., et al. (2011). The variant call format and VCFtools. Bioinformatics 27 (15), 2156–2158. doi: 10.1093/bioinformatics/btr330
Darwin Tree of Life Project Consortium (2022). Sequence locally, think globally: The Darwin tree of life project. Proc. Natl. Acad. Sci. 119 (4), e2115642118. doi: 10.1073/pnas.2115642118
Das A., Begum K., Akhtar S., Ahmed R., Tamuli P., Kulkarni R., et al. (2023). Genome-wide investigation of Cytochrome P450 superfamily of Aquilaria agallocha: Association with terpenoids and phenylpropanoids biosynthesis. Int. J. Biol. Macromol. 234, 123758. doi: 10.1016/j.ijbiomac.2023.123758
DePristo M. A., Banks E., Poplin R., Garimella K. V., Maguire J. R., Hartl C., et al. (2011). A framework for variation discovery and genotyping using next-generation DNA sequencing data. Nat. Genet. 43 (5), 491–498. doi: 10.1038/ng.806
Ding X., Mei W., Lin Q., Wang H., Wang J., Peng S., et al. (2020). Genome sequence of the agarwood tree Aquilaria sinensis (Lour.) Spreng: the first chromosome-level draft genome in the Thymelaeceae family. GigaScience 9 (3), giaa013. doi: 10.1093/gigascience/giaa013
Dray S., Dufour A. B. (2007). The ade4 package: implementing the duality diagram for ecologists. J. Stat. softw. 22, 1–20. doi: 10.18637/jss.v022.i04
Eddy S. R. (2011). Accelerated profile HMM searches. PloS Comput. Biol. 7 (10), e1002195. doi: 10.1371/journal.pcbi.1002195
Farah A. H., Lee S. Y., Gao Z., Yao T. L., Madon M., Mohamed R. (2018). Genome size, molecular phylogeny, and evolutionary history of the tribe Aquilarieae (Thymelaeaceae), the natural source of agarwood. Front. Plant Sci. 9, 712.
Foll M., Gaggiotti O. (2008). A genome-scan method to identify selected loci appropriate for both dominant and codominant markers: a Bayesian perspective. Genetics 180 (2), 977–993. doi: 10.1534/genetics.108.092221
Fumagalli M. (2013). Assessing the effect of sequencing depth and sample size in population genetics inferences. PloS One 8 (11), e79667. doi: 10.1371/journal.pone.0079667
Goudet J. (2005). Hierfstat, a package for R to compute and test hierarchical F-statistics. Mol. Ecol. Notes 5 (1), 184–186. doi: 10.1111/j.1471-8286.2004.00828.x
Harvey-Brown Y. (2018). “Aquilaria sinensis,” in The IUCN red list of threatened. Species. 2018, e.T32382A2817115.
Iu K. C. (1983). “The cultivation of the “Incense tree” (Aquilaria sinensis),” in Royal Asiatic Society Hong Kong Branch, vol. 23. , 247–249.
Jiao L. C., Yin Y. F., Cheng Y. M., Jiang X. M. (2014). DNA barcoding for identification of the endangered species Aquilaria sinensis: comparison of data from heated or aged wood samples. Holzforschung 68, 487–494. doi: 10.1515/hf-2013-0129
Jim C. Y. (2015). Cross-border itinerant poaching of agarwood in Hong Kong's peri-urban forests. Urban Forest. Urban Greening 14 (2), 420–431. doi: 10.1016/j.ufug.2015.04.007
Kamvar Z. N., Brooks J. C., Grünwald N. J. (2015). Novel R tools for analysis of genome-wide population genetic data with emphasis on clonality. Front. Genet. 6, 208. doi: 10.3389/fgene.2015.00208
Kang Y. (2021). Molecular identification of Aquilaria species with distribution records in China using DNA barcode technology. Mitochon. DNA Part B 6 (4), 1525–1535. doi: 10.1080/23802359.2021.1914210
Kow-choy I. (1983). The cultivation of the" Incense Tree "(Aquilaria sinensis). J. Hong Kong Branch R. Asiat. Soc. 23, 247–249
Lee S. Y., Ng W. L., Mahat M. N., Nazre M., Mohamed R. (2016). DNA barcoding of the endangered Aquilaria (Thymelaeaceae) and its application in species authentication of agarwood products traded in the market. PloS One 11, e0154631. doi: 10.1371/journal.pone.0154631
Lewin H. A., Robinson G. E., Kress W. J., Baker W. J., Coddington J., Crandall K. A., et al (2018). Earth BioGenome Project: Sequencing life for the future of life. Proc. Natl. Acad. Sci. 115 (17), 4325–4333.
Li H. (2013). Aligning sequence reads, clone sequences and assembly contigs with BWA-MEM. arXiv preprint arXiv. p. 1–3. doi: 10.48550/arXiv.1303.3997
Li H., Durbin R. (2011). Inference of human population history from individual whole-genome sequences. Nature 475 (7357), 493–496. doi: 10.1038/nature10231
Nelson D. R. (2009). The cytochrome p450 homepage. Hum. Genomics 4 (1), 1–7. doi: 10.1186/1479-7364-4-1-59
Newton A. C., Soehartono T. (2001). CITES and the conservation of tree species: the case of Aquilaria in Indonesia. Int. Forest. Rev. 3, 27–33. Available at: https://www.jstor.org/stable/42609343.
Nong W., Law S. T. S., Wong A. Y. W., Baril T., Swale T., Chu L. M., et al. (2020). Chromosomal-level reference genome of the incense tree Aquilaria sinensis. Mol. Ecol. Resour. 20 (4), 971–979. doi: 10.1111/1755-0998.13154
Pern Y. C., Lee S. Y., Ng W. L., Mohamed R. (2020). Cross-amplification of microsatellite markers across agarwood-producing species of the Aquilarieae tribe (Thymelaeaceae). 3 Biotech. 10 (3), 1–9. doi: 10.1007/s13205-020-2072-2
Price M. N., Dehal P. S., Arkin A. P. (2010). FastTree 2–approximately maximum-likelihood trees for large alignments. PloS One 5 (3), e9490. doi: 10.1371/journal.pone.0009490
Purcell S., Neale B., Todd-Brown K., Thomas L., Ferreira M. A., Bender D., et al. (2007). PLINK: a tool set for whole-genome association and population-based linkage analyses. Am. J. Hum. Genet. 81 (3), 559–575. doi: 10.1086/519795
Salojärvi J., Smolander O., Nieminen K., Rajaraman S., Safronov O., Safdari P., et al. (2017). Genome sequencing and population genomic analyses provide insights into the adaptive landscape of silver birch. Nat. Genet. 49, 904–912. doi: 10.1038/ng.3862
Sievers F., Wilm A., Dineen D., Gibson T. J., Karplus K., Li W., et al. (2011). Fast, scalable generation of high-quality protein multiple sequence alignments using Clustal Omega. Mol. Syst. Biol. 7 (1), 539. doi: 10.1038/msb.2011.75
Sollars E. S. A., Harper A. L., Kelly L. J., Sambles C. M., Ramirez-Gonzalez R. H., Swarbreck D., et al. (2017). Genome sequence and genetic diversity of European ash trees. Nature 541, 212–216. doi: 10.1038/nature20786
State Council of the People's Republic of China (1999) National red data list of Chinese plants (Vol.2). Available at: http://www.iplant.cn/rep/protlist/2.
Subramanian B., Gao S., Lercher M. J., Hu S., Chen W. H. (2019). Evolview v3: a webserver for visualization, annotation, and management of phylogenetic trees. Nucleic Acids Res. 47 (W1), W270–W275. doi: 10.1093/nar/gkz357
Tillmar A., Fagerholm S. A., Staaf J., Sjölund P., Ansell R. (2021). Getting the conclusive lead with investigative genetic genealogy–A successful case study of a 16 year old double murder in Sweden. Forensic Sci. International: Genet. 53, 102525. doi: 10.1016/j.fsigen.2021.102525
Wang Z. F., Cao H. L., Cai C. X., Wang Z. M. (2020). Using genetic markers to identify the origin of illegally traded agarwood-producing Aquilaria sinensis trees. Global Ecol. Conserv. 22, e00958. doi: 10.1016/j.gecco.2020.e00958
Wood D. E., Lu J., Langmead B. (2019). Improved metagenomic analysis with Kraken 2. Genome Biol. 20 (1), 1–13. doi: 10.1186/s13059-019-1891-0
Yin Y., Jiao L., Dong N., Jiang X., Zhang S. (2016). “Wood resources, identification, and utilization of agarwood in China,” in Agarwood Science Behind the Fragrance. Ed. Mohamed R. (Singapore: Springer), 21–38.
Yin L., Zhang H., Tang Z., Xu J., Yin D., Zhang Z., et al. (2021). rMVP: a memory-efficient, visualization-enhanced, and parallel-accelerated tool for genome-wide association study. Genomics Proteomics Bioinf. 19 (4), 619–628. doi: 10.1016/j.gpb.2020.10.007
Yip K. L., Lai C. C. (2004). The nationally rare and endangered plant, Aquilaria sinensis: Its status in Hong Kong. Hong Kong Biodivers. 7, 14–16.
Zhao X., Zhao S. J. (2007). Extraction of genomic DNA and establishment of silver-stained AFLP system of Aquilaria sinensis (Lour.) Spreng. Pharm. Biotechnol. 14, 14–17.
Keywords: Aquilaria, agarwood DNA extraction, incense tree, resequencing, population genomics, conservation
Citation: Law STS, Nong W, Yip HY, Liu EKY, Ng TPT, Tsang RHL, Xia N, Shaw P-C, Lam HM, Lau DTW and Hui JHL (2023) Population genomic analyses of protected incense trees Aquilaria sinensis reveal the existence of genetically distinct subpopulations. Front. Ecol. Evol. 11:1216370. doi: 10.3389/fevo.2023.1216370
Received: 03 May 2023; Accepted: 27 July 2023;
Published: 21 August 2023.
Edited by:
Jihong Hu, Northwest A&F University, ChinaReviewed by:
Qiang Fan, Sun Yat-sen University, ChinaKevin Kit Siong Ng, Forest Research Institute Malaysia (FRIM), Malaysia
Copyright © 2023 Law, Nong, Yip, Liu, Ng, Tsang, Xia, Shaw, Lam, Lau and Hui. This is an open-access article distributed under the terms of the Creative Commons Attribution License (CC BY). The use, distribution or reproduction in other forums is permitted, provided the original author(s) and the copyright owner(s) are credited and that the original publication in this journal is cited, in accordance with accepted academic practice. No use, distribution or reproduction is permitted which does not comply with these terms.
*Correspondence: Jerome Ho Lam Hui, amVyb21laHVpQGN1aGsuZWR1Lmhr
†These authors have contributed equally to this work