 Rui Song
 Xueming Li
 Xinyu Hou
- 1School of Geography, Liaoning Normal University, Dalian, China
- 2Center for Human Settlements, Liaoning Normal University, Dalian, China
- 3Research Base of Urban Agglomeration in Central-South Liaoning of China Urban Agglomeration Research Base Alliance, Dalian, China
Introduction: Urban human settlements' spatial network structures have emerged as crucial determinants impacting their health and sustainability. Understanding the influencing factors is pivotal for enhancing these settlements. This study focuses on 34 prefecture-level cities in Northeastern China from 2005 to 2020. It employs a modified gravitational model to establish spatial relationships among urban human settlements. Social network analysis techniques, including modularity and the quadratic assignment procedure (QAP) regression model, are introduced to analyze the network's characteristics and driving factors.
Methods: A modified gravitational model is applied to create the spatial association network of urban human settlements. Social network analysis tools, along with modularity and the QAP regression model, are utilized to investigate the network's attributes and influencing elements. The study evaluates the evolution of spatial correlation, network cohesion, hierarchy, and efficiency.
Results: Throughout the study period, spatial correlation among urban human settlements in Northeastern China progressively intensified. However, the network exhibited relatively low density (0.217675), implying limited interconnectivity among cities. The average network hierarchy was 0.178225, indicating the need for optimization, while the average network efficiency was 0.714025, reflecting fewer redundant relationships. The analysis reveals the emergence of a polycentric network pattern with core and sub-core cities like Shenyang, Dalian, Changchun, Daqing, and Harbin. The urban network configuration has largely stabilized. The spatial association network showcases the intertwining of "small groups" and community organizations. Geographic proximity and merit-based linkages govern feature flow. Measures such as breaking administrative barriers, reducing flow time and distance, boosting resident income, and increasing government investment are identified to foster balanced network development and structural optimization.
Discussion: The research underscores the increasing spatial correlation and evolving network pattern among urban human settlements in Northeastern China. Despite the observed strengthening correlation, challenges related to network cohesion and hierarchy persist. The formation of a polycentric network signifies positive progress in urban development. The study highlights the importance of proximity and merit-based connections for feature flow. The proposed measures offer pathways to enhance network development and optimize structure, promoting holistic urban settlement growth and sustainability.
1 Introduction
Urban human settlements are the external environmental condition on which urban residents rely for survival and development, which is closely related to the level of social and economic development and urban construction level, and is an important indicator for evaluating the overall quality of a city. (Steiner, 2004; Hua et al., 2021; Michele, 2022). With the rapid development of transportation and communication industries, the cross-regional flow of various factors has been intensified, and the spatial interaction trend of “flow elements” such as “population flow, material flow, capital flow, and information flow” is obvious, which greatly promotes the formation and development of human settlements networks between cities (Cooper, 2017; Simini et al., 2021; Guo et al., 2022; Ido and Ayu Sukma, 2023). On one hand, to obtain greater externality benefits, each city uses its advantages in human settlements resources and environment and comparative advantages to merit-based links with other cities in the region (Hausmann et al., 2021). On the other, the deeper the degree of embedding of urban human settlements systems in the network, the smaller the risk of falling into “opportunism”, and the stronger its initiative and maneuverability (Schrock and Wolf-Powers, 2019). With the proposal of China’s high-quality development slogan and the in-depth implementation of the revitalization policy of Northeast China, the spatial interaction of human settlements has become prominent under the promotion of various “flow factors”, and a more complex spatial association network structure has gradually formed (Nath et al., 2021). From the perspective of the spatial correlation network of urban human settlements, grasping its spatial structure characteristics and influencing drivers can improve the coordinated development of regional cities and optimize the spatial association structure, which has strong practical significance (Hong and Xin, 2022).
Human settlements studies were pioneered by C.A. Doxiadis, who proposed his Ekistics development theory in the 1950s. The spatial association network of human settlements is a spatial architecture formed by the cross-regional flow between various elements of human settlements. It has the function of optimizing the allocation of human settlements resource elements (Shekhar et al., 2019). In recent decades, the application of new models and technical means such as Ucinet, Gephi, GIS, and graph neural networks and the application of big data have further expanded the research scope of spatial correlation networks of human settlements (Hashem et al., 2016; Oswald Beiler, 2016; Gama et al., 2020; Bai et al., 2021; Otero Peña et al., 2022). At present, the research methods of human settlements mainly use the coupled coordination model, spatiotemporal geographic weighted regression (GTWR), exploratory spatiotemporal data analysis (ESTDA), and interpretation and analysis of night light remote sensing data (Gontia et al., 2019; Levin et al., 2020; Margherita and Luca, 2022; Xiao and Hanxue, 2022). The research content mainly revolves around the quality (Chen et al., 2021), habitability (Ghasemi et al., 2018), vulnerability (Chen, 2022), and comprehensive competitiveness (Smith, 2016) of human settlements and other aspects of comprehensive evaluation research. At the same time, some scholars have also explored the mutual relationships and functional mechanisms between the human settlements and architecture (Baldwin et al., 2011), neighborhoods (Foster et al., 2019), aging (Punyakaew et al., 2019), shopping businesses (Khera, 1973), health (Brown et al., 2018), low carbon emissions (Jan et al., 2013), education (Qi et al., 2021), security (Magigi and Majani, 2006), and transportation (van Strien et al., 2018) ;The geographical scale research involves a relatively broad range of scope, mainly two types: administrative (regional) geographical scale (Gueguen et al., 2017) and grid (raster) geographical scale (Ali et al., 2002).
In summary, research on human settlements has yielded fruitful results, but there is still room for improvement. First of all, the city is an important “node” in the spatial association network of human settlements, which is the indispensable aspect in urban network research. However, existing human settlements research mostly focuses on the static attributes of urban individuals and not dynamic network associations, and it is difficult to portray the “relationship” of the flow of human settlements elements (Marull et al., 2019; Zhou et al., 2020; Boeing, 2021; Runyu et al., 2022). Secondly, the urban human settlements association network has strong non-consistency, and the common and different perspectives of urban human settlements provide new ideas for urban human settlements research. Existing related research focuses on geographical proximity and focuses more on individuals, ignores the organizational structure and spatial evolution law of large regional scales, and uses the modular model to deeply explore the organizational structure and evolution of urban human settlements spatial association networks, which is beneficial for understanding the “community” correlation features of urban human settlements network from a holistic and local perspective. (Xu et al., 2018; Allen et al., 2022).
This paper conducts research from the following aspects: first, from the perspective of spatial role and spatial integration, 34 prefecture-level cities in Northeast China (located in Heilongjiang, Jilin, and Liaoning Provinces) from 2005 to 2020 are used as research objects, and the evolution of the spatial association network of human settlements as a whole is investigated. Second, the modularity model is used to analyze the organizational mode and evolution law of urban human settlements spatial association networks under a complex network (Bnaya et al., 2020). Finally, the influence of economic and social factors on the heterogeneity of urban human settlements association networks is explored with the help of the quadratic assignment procedure (QAP) relationship model (Dong and Li, 2022). Under the background of the policy of revitalization of Northeast China, this paper objectively evaluates the differences in human settlements in the three Northeast provinces, promotes the rational allocation of “flow factors”, and provides a reference for the integrated and coordinated development of regional human settlements. Furthermore, it optimizes the network structure of human settlements, improves the network system, and improves internal balanced and high-quality development (Shen et al., 2021; Wang et al., 2021).
2 Study area and data
2.1 Study area
The provinces of Liaoning, Jilin, and Heilongjiang are generally considered to be the three northernmost provinces in latitude in China, with a latitude and longitude range of 118°E–135°E, 48°N–55°N. There are 34 prefecture-level cities within the prefecture, as well as the Yanbian Korean Autonomous Prefecture and Daxing’anling Prefecture. The three Northeastern provinces of China generally have a temperate monsoon climate with cold and long winters. Their terrain is mainly mountainous and plain, rich in resources, and with a developed industrial system (Figure 1).
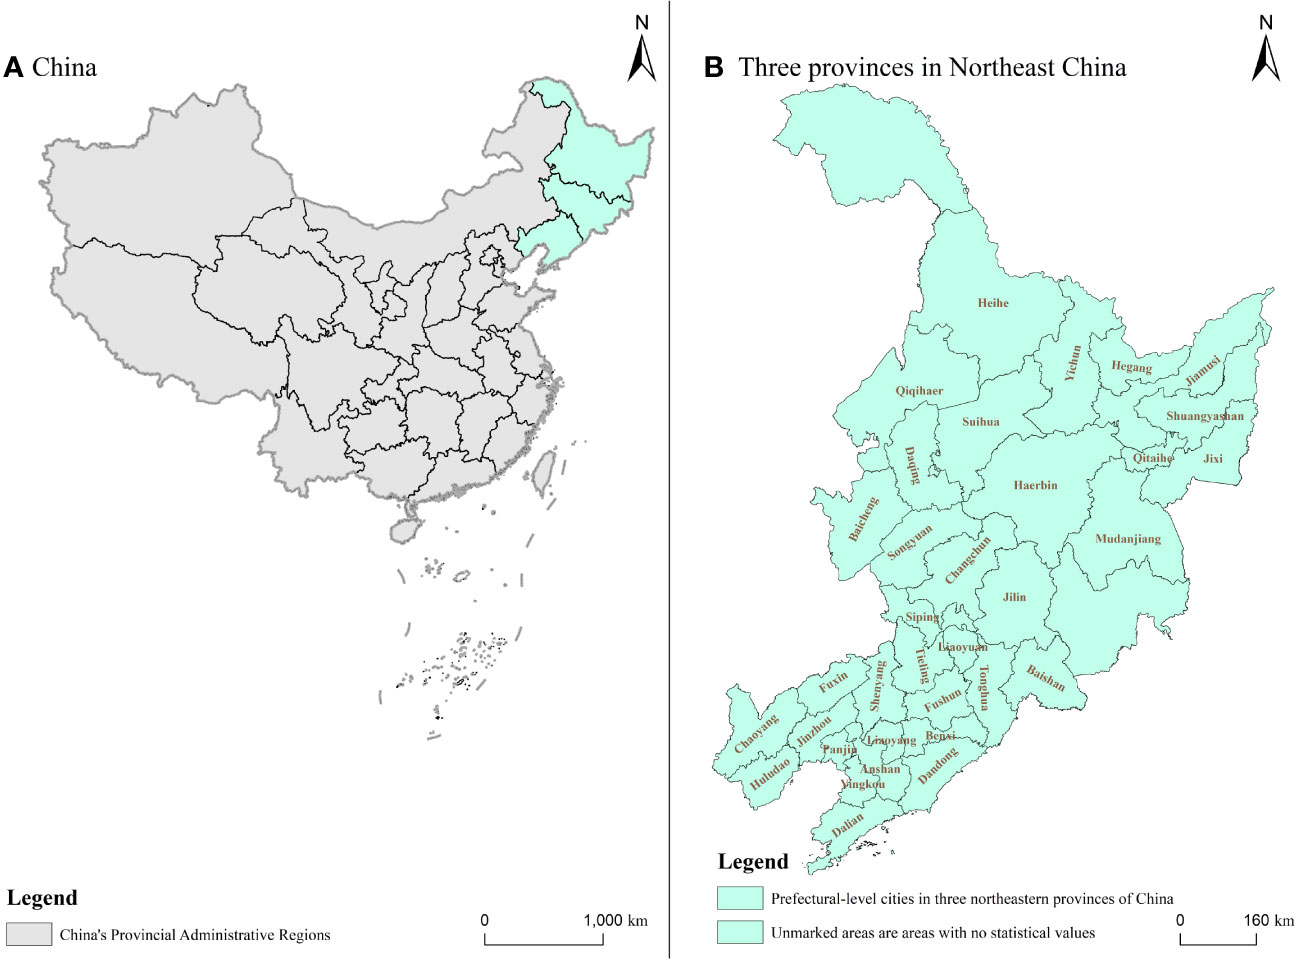
Figure 1 Research Area Overview Maps. (A) Administrative Map of China. (B) Administrative Map of the Three Northeastern Provinces.
2.2 Data sources and processing
Regarding the input data, my research incorporates various datasets relevant to the urban human settlement environment. These datasets may include socio-economic indicators, demographic information, spatial data such as transportation networks, and other relevant variables. The specific sources and types of data used depend on the research objectives and availability within the study area. Based on the principles of reliability, scientificity, and continuity of data, the indicators selected in this paper are mainly derived from the Liaoning Statistical Yearbook, Jilin Statistical Yearbook, Heilongjiang Statistical Yearbook, China Urban Construction Statistical Yearbook, China Urban Statistical Yearbook, as well as the year-end statistical bulletin data of prefecture-level cities and the official statistical yearbooks of prefecture-level cities from 2005 to 2020. Positive indicators, also known as forward indicators, represent measures that signify progress, growth, or desirable outcomes. Higher values of these indicators indicate better performance or evaluation. Positive indicators are also referred to a benefit-oriented or aspiration-driven measures. In contrast, negative indicators, also known as inverse indicators, follow the opposite pattern where smaller values are considered more favorable or desirable, while larger values are seen as unfavorable or undesirable. To eliminate the positive and negative impact of statistical unit differences, this paper standardizes the weights of each index, and the specific operations are as follows:
In the formula, Xij represents the standardized values of the jth year index of i city, and MAXxj and MINxj, respectively, are the maximum and minimum values in their respective indicators, and xij is the original value of the index.
2.3 Construction of indicator system
Drawing on existing research achievements and indicator systems related to the urban human settlements (Xue et al., 2021). Referring to the new version of the Ministry of Housing and Urban-Rural Development’s “Evaluation Index System for Chinese Settlement Environment Award” and the “Guidelines for the Selection of Themes and Application Materials for the Chinese Settlement Environment Model Award”, following the principles of people-oriented and scientific development concepts, starting from the scientific connotation of human settlements, the comprehensive evaluation system of human settlements indicators include the five major systems of human settlements: nature, population, society, residence, and support (Table 1).
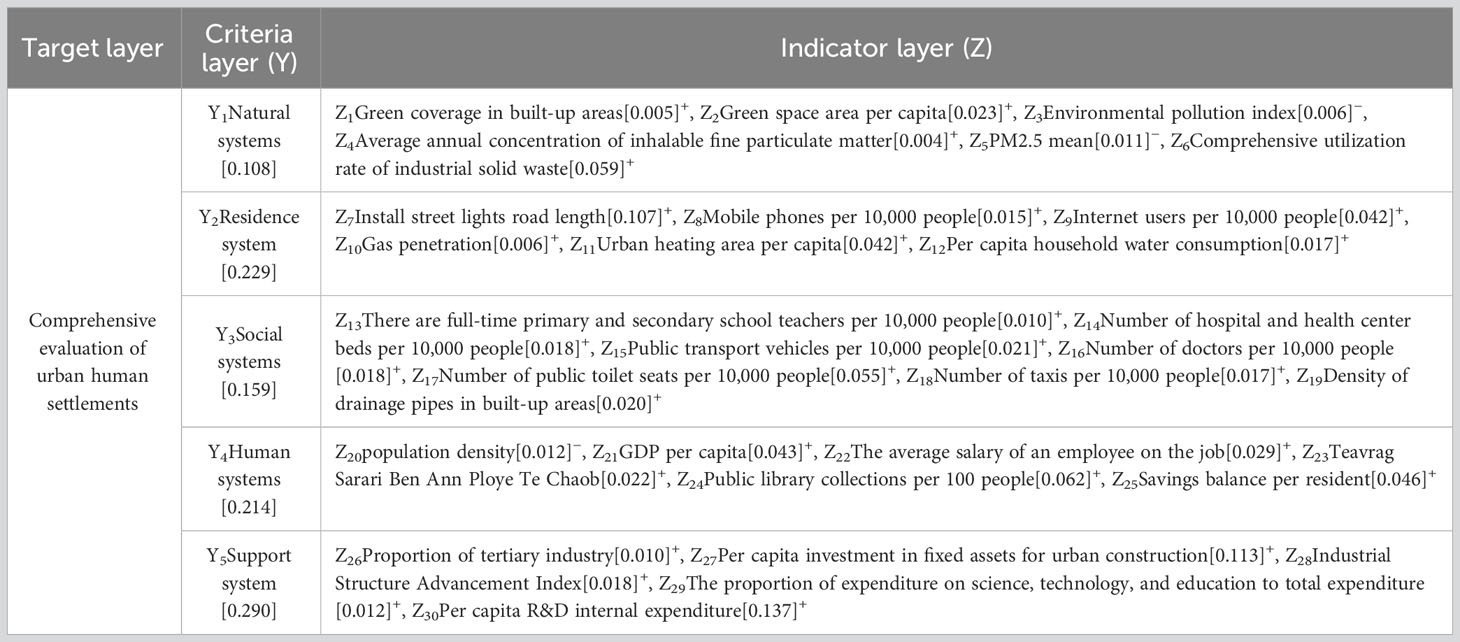
Table 1 Evaluation Index System and Weighting of Human Settlements in Cities in Northeast China’s Three Provinces.
3 Research methods and models
3.1 Modified gravity model
The establishment of relationships in spatial association networks and the strength of their connections are the basis for studying association networks. The spatial network of cities is defined by establishing connections between cities based on their geographic proximity or functional relationships. Geographic proximity refers to the physical distance between cities, while functional relationships consider factors such as economic ties, transportation connectivity, and social interactions. The network can be constructed using various methodologies, such as calculating distances or determining connectivity based on specific criteria, depending on the research context and objectives. Existing correlation models are mostly based on the Granger causality test and the traditional gravitational model to determine the relationships, as they do not consider the influence of external interference factors and or the nonlinear interrelationship between time series, which has certain drawbacks and low accuracy. The modified gravitational model is inspired by Newton’s universal gravitational model and produces a modified model that considers the law of distance decay and the economic situation of the city (Marull et al., 2019). Specific model:
Fij represents the gravitational value or connection strength of the i region and the j region, Hi and Hj represent the comprehensive score of the quality of the human settlements in cities i and j. The variable Dij represents the time-distance between city i and city j. This article uses web crawling software to obtain the shortest driving time between the 34 prefecture-level cities in the three Northeastern provinces of China from a map application, and the shortest driving distance represents the time-distance between cities; G is the gravitational coefficient, Mi and Mj represent the GDPs of i city and j city, mi and mj represent the per capita GDPs of i city and j city, respectively, and α is the distance attenuation coefficient (its usual value is 2).
From the above formula, the spatial correlation intensity matrix of urban human settlements in the three Northeastern provinces of China is obtained. Referring to the modified gravity model formula, since each row of the default matrix of Ucinet software is the city i emitting the gravitational value to the city j, the average of the gravitational value of each row is taken as the minimum threshold of the row. If the Fij value is higher than this minimum threshold, it is considered that there is a correlation between the two cities, and in the process of binarization, these two cities are assigned a value of 1, while if it is lower than this threshold, it is assigned a value of 0.
3.2 Network topological indicators
3.2.1 Network density
Network density is a measure of the closeness of connections between nodes in a network. It represents the ratio between the actual number of connections and the total number of possible connections. The calculation method typically involves dividing the actual number of connections by the total possible number of connections.
N represents the number of network nodes, and M represents the number of actual existing edges.
3.2.2 Network connectivity
Network connectivity is used to measure the interconnectivity and interdependence between nodes in a network. Common calculation methods include degree centrality, betweenness centrality, and closeness centrality, which evaluate the importance of nodes in terms of information flow, resource exchange, and social relationships. (The specific calculation formula will be explained in detail in the following section.)
3.2.3 Network hierarchy
Network hierarchy describes the hierarchical structure of nodes in a network. Common calculation methods include degree difference metrics, hierarchy ratio metrics, and node hierarchy metrics, which measure the position of nodes in the network and the complexity of the hierarchical structure.
HD represents the Hierarchy Degree, Idn stands for the In-degree of the node, Odn represents the Out-degree of the node, and Dn represents the Degree of the node.
3.2.4 Network efficiency
Network efficiency evaluates the efficiency and optimization of information flow and resource exchange in a network. Common calculation methods include average path length, clustering coefficient, and small-worldness, which measure the closeness and transmission efficiency between nodes in the network.
GE stands for Global Network Efficiency, and N represents the number of nodes in the network. The distance dij between nodes i and j is defined as the number of edges on the shortest path (geodesic path) connecting the two nodes.
3.3 Point-out and point-in degrees
In directed networks, “point-in degree” refers to the total number of points that point directly to that point, and “point-out degree” refers to the total number of points that the point is pointing to. The greater the degree of point outreach, the stronger the city’s ability to radiate or diffuse externally in the human settlements association network, and the greater the point-in degree, the stronger the city’s ability to internal agglomeration in the human settlements association network.
3.4 Closeness to centrality
If a prefecture-level city in the three Northeastern provinces of China is a point with a high degree of Closeness to centrality, it means that the city is closest to any other city, and the city is also in the center of the spatial location. The Closeness centrality in the directed network is divided into in-Closeness centrality and out-Closeness centrality. Closeness centrality can measure the ease of other cities (nodes) to reach this city by calculating the number of “edge” towards the city. If the city’s Closeness centrality is higher, other cities in the human settlements spatial association network have an easier access to the city. Closeness centrality refers to the ease with which a city can reach other cities, and the reciprocal of the sum of the shortest distances from this city to other cities, the greater the proximity centrality, the easier it is for the city to reach other cities in the human settlements association network. The specific model is as follows:
u is the city for which Closeness centrality is calculated, n is the number of all cities in the urban human settlements association network, d(u,v), is the most convenient path distance between city v and city u.
3.5 Intermediary center degree
The degree of intermediary centrality reflects the extent to which a city has become an “intermediary” of two or more cities and indirectly expresses the intermediary ability and control power of a city in the network channel related to the human settlements. The specific model is as follows:
Ci indicates the intermediary centrality of city i, and the larger Ci indicates that the higher the level of control of the i city in the human settlements association network, the higher the level of control of other cities in the human settlements association network; dij represents the sum of the most convenient paths from city i to j, and is number of cities with the easiest way to get through the city α.
3.6 Modularity
Modularity can accurately divide communities and detect their interaction relationship and closeness. It is a commonly used optimization algorithm in complex association networks (Kirti et al., 2023). The definition of modularity refers to the proportion of edges falling in the same community. It is obtained by first randomly assigning these edges and then obtaining the expected value (the random allocation of edges is to keep the urban node degree of each city node unchanged) of the ratio of the total number of edges in the community to the total number of edges in the overall spatial network associated with the human settlements minus the expected value. Specific model:
Q is modularity, n is the number of edges in the human settlements association network, Wij is the weight value of the city node i and the city node j, if connected, it is 1, otherwise, it is 0; vi and vj are the point values of cities I and J, respectively; θ(Ci,Cj) indicates whether the two communities are the same. If they are the same, it equals 1, otherwise, it equals 0.
3.7 QAP secondary assignment procedure
In this paper, the structure of the human settlements association network and its driving factors in the three Northeastern provinces of China are studied, as most of the “Relational data” is prone to multicollinearity problems and noise effects in traditional regression models, and the use of traditional econometric models may lead to bias in the results (Ma et al., 2020). The QAP quadratic assignment procedure is based on the comparison of a matrix (M) with another matrix (N1) or a matrix (M) with multiple matrices (N1, N2, N3…Nx) for correlation and regression analysis, as well as nonparametric and stratified tests. This method does not require the assumption that the explanatory variables are independent of each other, effectively solving the endogenous problem.
4 Spatial association network organization model of human settlements
The accelerated flow of “flow elements” of human settlements activities and the obvious trend of spatial interaction between elements have promoted the construction of a spatial association network system of human settlements. To visually depict the evolution process and characteristics of spatial correlation networks, based on the spatial association data of human settlements in 34 prefecture-level cities, combined with Ucinet, Gephi, ArcGIS, and other tools, the spatial association networks of human settlements in the three Northeastern provinces of China were visualized.
4.1 Characteristics of the overall spatial association network of human settlements in the three Northeast provinces of China
The overall characteristics of the spatial association network of human settlements reflect the structural and topological characteristics of regional integrated networks, which can help to better understand the operation mode of the network. This paper mainly measures network density, network connectivity, network hierarchy, and network efficiency. (1) The network densities in 2005, 2010, 2015, and 2020 were 0.1889, 0.2041, 0.2513, and 0.2264, respectively. This shows that the overall tightness of the spatial association network of human settlements in the three Northeast provinces of China is low, the overall topology is loose, and the cooperation space between cities is large. Importantly, the increase in network density will bring more power and influence to some city nodes, weakening the robustness and stability of the entire network. Whether the network density is too high or too low needs to be fully considered, adjusted, and analyzed according to the specific situation. (2) The network connectivity for all four years is 1, meaning that the network is connected, that is, any node in the network can reach any other via a path. It describes the relationships between different nodes in the network, including the degree and betweenness of nodes. They are all connected to each other by paths, allowing for the study of the overall characteristics of the urban human settlements spatial association network. There is no “island city” separated from the network in the spatial association network of human settlements in the three Northeastern provinces of China, and the spatial spillover effect is prominent (3) Network hierarchy is an indicator to measure the uneven degree of the distribution of urban nodes in the network. The 34 prefecture-level cities in the three Northeastern provinces of China show a gradual decrease in network hierarchy over time (0.4286, 0.1667, 0.0588, 0.0588, in 2005, 2010, 2015, and 2020, respectively), that is, the degree distribution of nodes in the network gradually tends to become uniform. (4) The network efficiencies in 2005, 2010, 2015, and 2020 are 0.7557, 0.7367, 0.6648, and 0.6989, respectively. Network efficiency is an indicator of the ability of the network to transmit information, and high network efficiency means that the information transmission between nodes in the network is more efficient, with low redundancy. From 2005 to 2020 network efficiency shows a decreasing trend. A high network efficiency indicates that the information transmission between nodes in the network is more efficient with lower redundancy. The network efficiency data of the urban human settlements spatial association network in the three Northeastern provinces of China shows a slight decrease but still fluctuates in a relatively high range. The overall redundancy is relatively low, indicating that the information of the spatial correlation between the urban human settlements can be transmitted faster in the network.
In summary, by analyzing the overall topology and characteristics of the spatial association network of human settlements, a spatial spillover effect and good connectivity can be detected. However, the shortcomings of loose spatial structure and the low-level coordinated development trend that tends to be hierarchical must be considered.
4.2 Evolution characteristics of spatial association networks of human settlements in three Northeast provinces of China
From 2005 to 2020, the number of spatial association network relationships in prefecture-level cities in the three Northeastern provinces of China showed an overall upward trend, and the scale of associated networks continued to expand, breaking through the influence of traditional geographical restrictions. The point-out and point-in degrees between different cities essentially conformed to the “Position order – the law of scale effect” (Figure 2). However, due to the complex composition of the spatial association of human settlements, the organizational methods are different, and the network connection characteristics are heterogeneous. With the policy support and the flow of population and various resource elements, the barriers of geographical proximity and spatial association between prefecture-level cities have been broken, and urban residents in the study area have higher requirements for the construction of and cooperation in the living environment, and the frequency of interaction has increased accordingly.
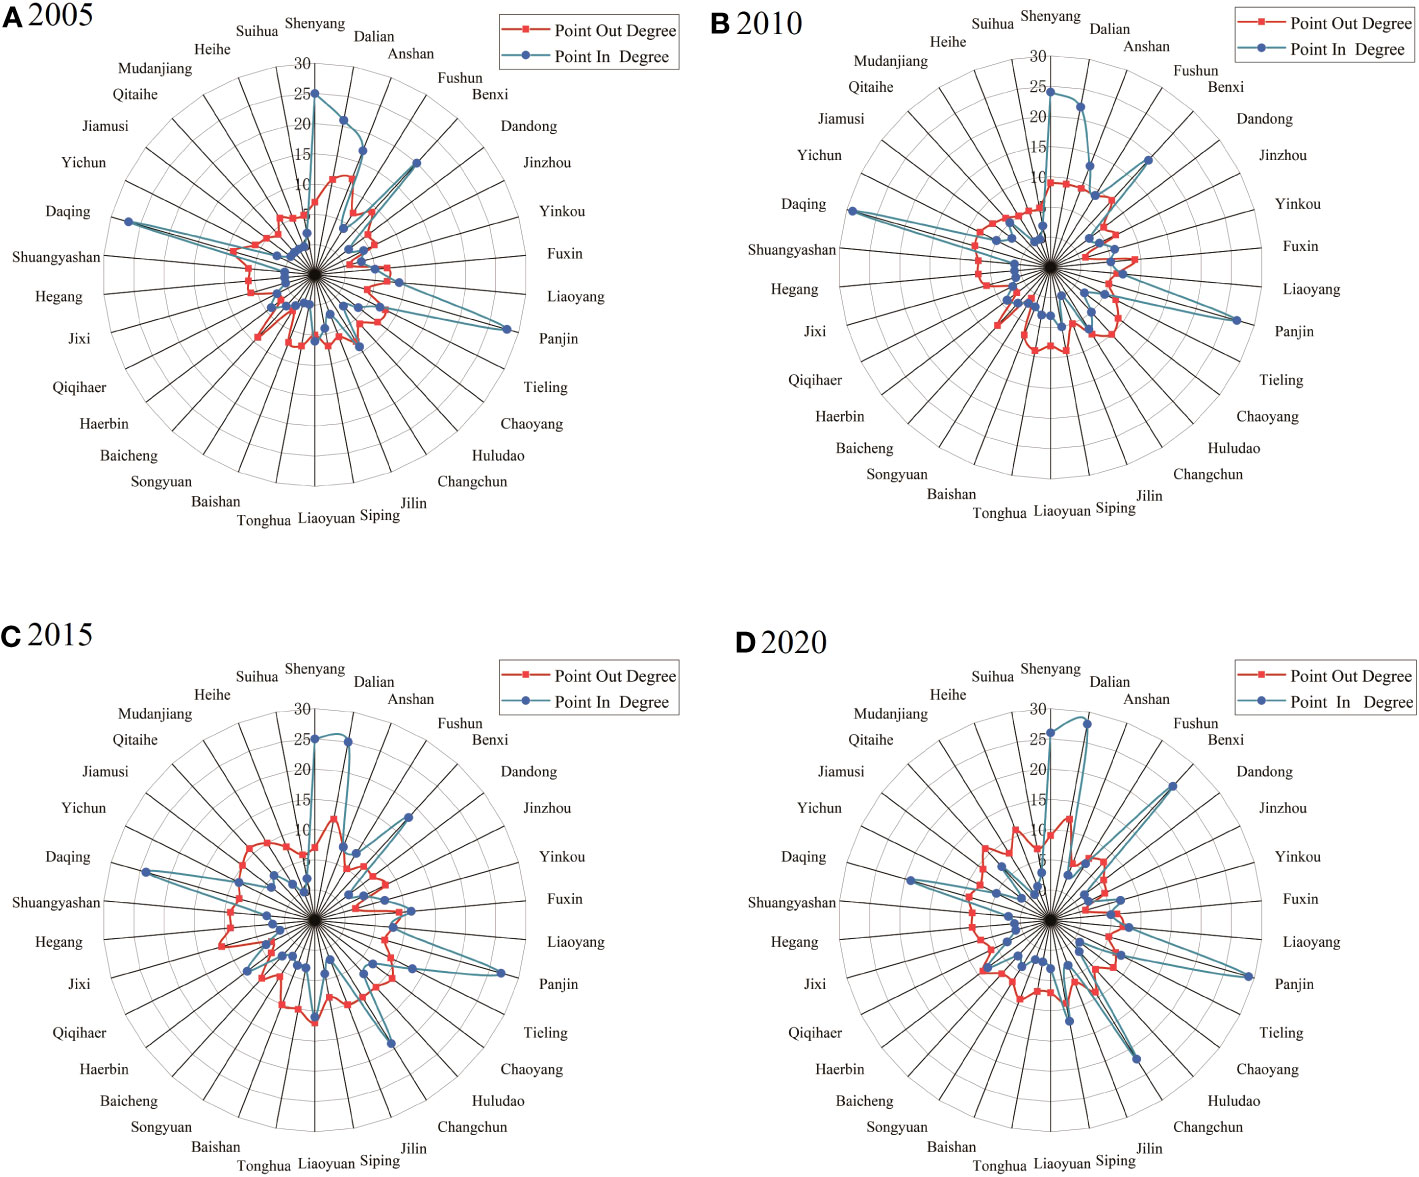
Figure 2 Chinese Northeastern Three Provinces Human Settlements Spatial Correlation Network Point-Out Degrees and Point-In Degrees Graphs. (A) Point-Out Degrees and Point-In Degrees in 2005, (B) Point-Out Degrees and Point-In Degrees in 2010, (C) Point-Out Degrees and Point-In Degrees in 2015, (D) Point-Out Degrees and Point-In Degrees in 2020.
The point-out degree and point-in degree represent the city’s radiation and agglomeration abilities, respectively. The change of point-in degree in the four time nodes from 2005 to 2020 is different, the standard deviations of the values are substantial, and the difference between high and low-value areas is evident. Shenyang, Dalian, Changchun, Benxi, Panjin, and Daqing tend to have high points in the four years, indicating that they mainly receive spillovers from other cities in the spatial correlation network of human settlements. This is mainly because some of these cities are provincial capitals or surrounding areas with good ecological protection, partly due to good economic development and high infrastructure investment, and partly because the ecological environmental protection of the region is higher than that of other regions. Most other cities have a trend of low-value popularity, indicating that the “siphon effect” of the human settlements in the three Northeastern provinces of China is mainly concentrated in a few cities, and the polarization is obvious, and the low-value cities need to strengthen cooperation with high-value areas and increase spillover channels.
However, the numerical standard deviation of the point-out degree and the point-in degree in the four years is small, and the overall change trend of the point-out degree in all cities is not obvious. However, it can be seen that with the change of the year, most cities in the three Northeastern provinces of China have a small but considerable expansion trend. This indicates that, overall, the 34 prefecture-level cities in the three Northeastern provinces have an overflow expansion trend. The underdeveloped areas in the network such as Qitaihe, Mudanjiang, Tonghua, and Baishan have become key development cities in terms of point-out degree, indicating that they are at the edge of the network and need to strengthen their construction and improve their agglomeration capacity.
The main purpose of closeness centrality (Figure 3) is to evaluate the importance and influence of nodes relative to other nodes in the network as an indicator of the magnitude of influence. In the directed graph, divided into in-closeness centrality and out-closeness centrality, the average in-closeness centrality in the human settlements association network of the three Northeastern provinces of China in four years was 46.36925, but the average out-closeness centrality was only 24.12575. The overall closeness centrality in the network is dominated by in-closeness centrality, indicating that the interconnection between cities is based on the main theme of the edge city to the central city, the greater “In-closeness centrality”, the easier it is for the edge cities to reach the central city. Shenyang, Dalian, Panjin, Daqing, Changchun, and Harbin were high “In-Closeness Centrality” in the four years, and the number of times higher than the average accounted for a relatively high proportion of the four years. They played the role of “core participants” in the spatial association network of human settlements. Other urban factors flowed to these cities with high convenience. Out-closeness centrality, Jiamusi, Qitaihe, Jixi, Heihe, Liaoyuan, Tonghua, Baishan, and other cities comprehensively compare other cities, and their Out-closeness centrality is higher, it can be seen that these cities are mostly economically backward areas in Jilin and Heilongjiang Provinces. Most of the cities are located in remote areas, the network correlation degree is weak, and they act as a “marginal actor” in the spatial association network of human settlements, while the elements in the spatial network flow to the core cities conveniently.
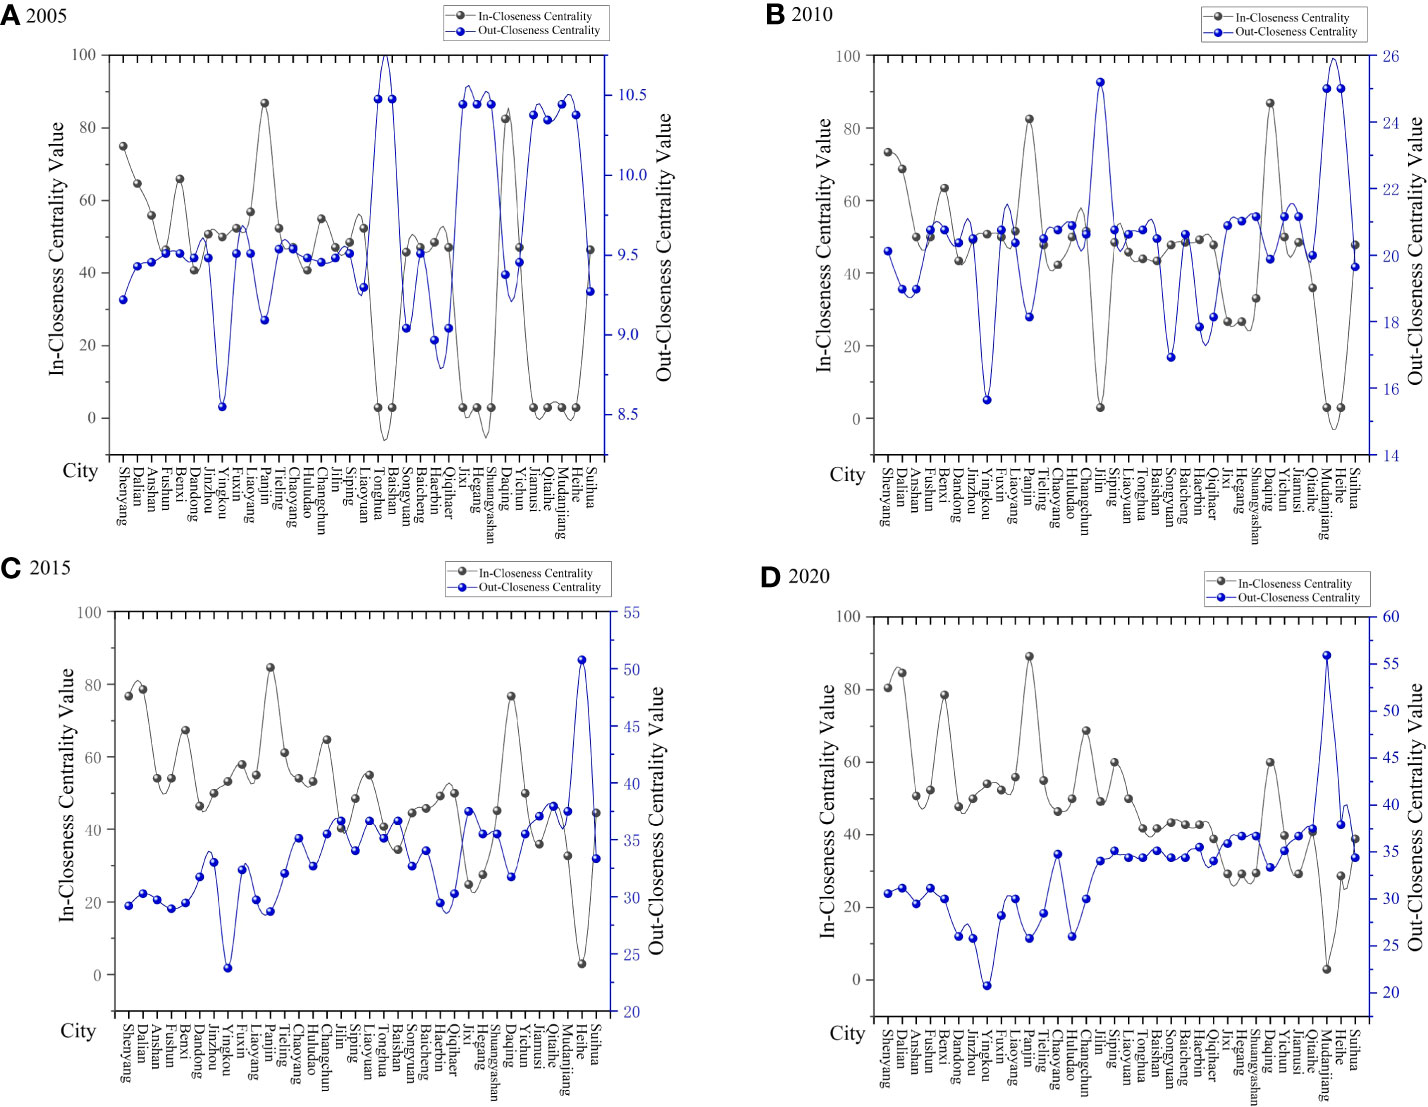
Figure 3 Chinese Northeastern Three Provinces Human Settlements Spatial Correlation Network In-Closeness Centrality and Out-Closeness Degree Graphs. (A) In-Closeness Centrality and Out-Closeness Degree in 2005, (B) In-Closeness Centrality and Out-Closeness Degree in 2010, (C) In-Closeness Centrality and Out-Closeness Degree in 2015, (D) In-Closeness Centrality and Out-Closeness Degree in 2020.
From the perspective of intermediary centrality (Figure 4), the average intermediary centrality of the spatial association network of human settlements was 32.29425 in four years, Shenyang, Dalian, Daqing, Yichun and Qitaihe were among the highest among all cities in the number of occurrences higher than the average value of intermediary centers in four years. This shows that these cities play the role of “bridge links” in the spatial association network of human settlements in the three Northeastern provinces of China and have great dominance over the transmission and flow of factors, acting as key elements. Hegang, Mudanjiang, and Heihe ranked high among all cities in terms of frequency below the average intermediary centrality in the four years, mainly because they were economically backward, in a “dominated” position, and had a weak sense of presence in the network.
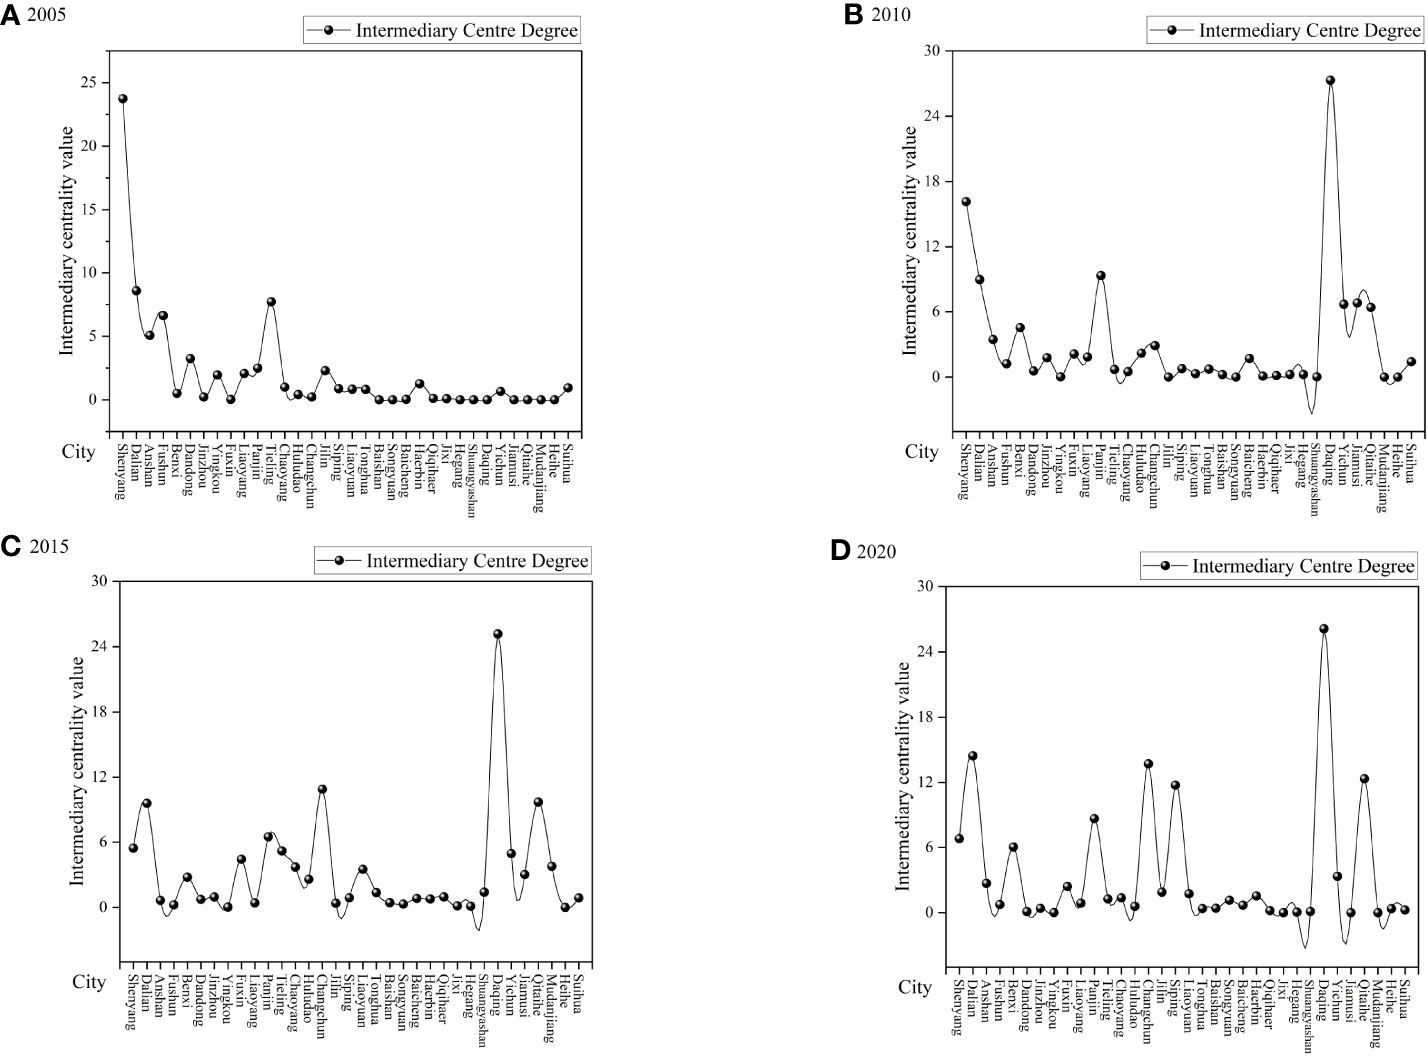
Figure 4 Intermediary Centre Degrees in the Human Settlements Spatial Correlation Network of China's Northeastern Three Provinces. (A) Intermediary Centre Degrees in 2005, (B) Intermediary Centre Degrees in 2010, (C) Intermediary Centre Degrees in 2015, (D) Intermediary Centre Degrees in 2020.
From the perspective of the characteristics of the spatial association network of human settlements (Figure 5), the total value of network correlation in the four years increased with time. The overall network structure in the four years was relatively close, showing a “V-shaped” radial spatial pattern radiating to Changchun, Daqing, Harbin, and other cities with Shenyang and Dalian as the core. The connection form of the network was “solidified” and tended to be stable. The network connection characteristics change to the unbalanced and polycentric development stage, and the close connection degree in the southern region is much higher than that in the northern region, it can be seen that with time, the degree of flow and agglomeration of spatial elements of the human settlements deepens, and the outward radiation is relatively small. The reasons are that the overall social and economic development of the three Northeastern provinces of China is uneven, the population outflow is serious, the region is dominated by heavy industry, and industrial upgrading is slow. Comparing the spatial correlation network of urban human settlements in different years, it is not difficult to find that the evolution of urban network patterns in the three Northeastern provinces of China has certain characteristics of temporal and spatial heterogeneity. Network hierarchy is obvious, the central and southern Liaoning region has gradually become the center of network connection, and there is a certain diffusion trend in the later stage with the deepening of the connection intensity, although the overall situation is still agglomeration.
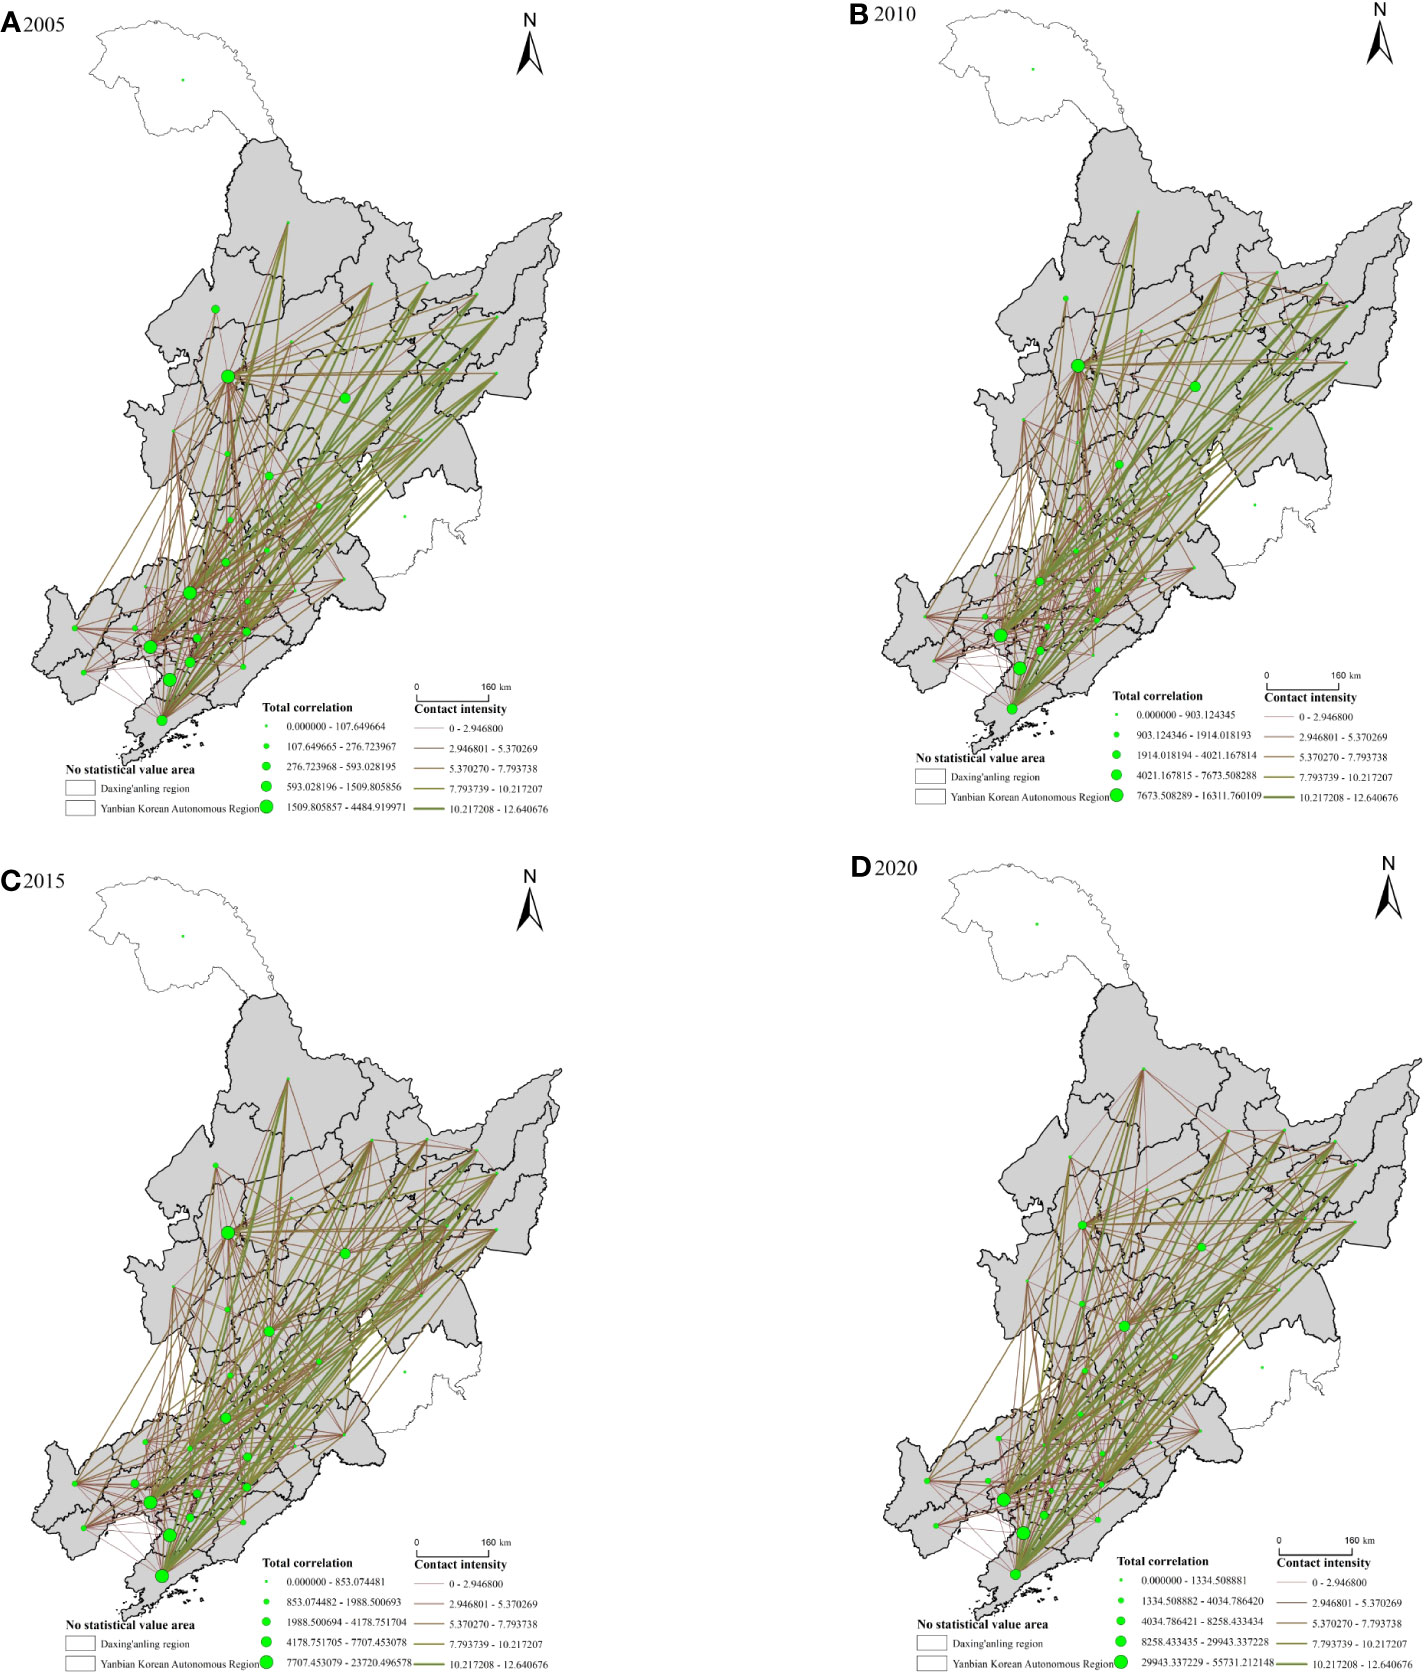
Figure 5 Evolution of Spatial Correlation Networks in the Human Settlements of China's Northeastern Three Provinces. (A) Evolution of Spatial Correlation Networks in 2005, (B) Evolution of Spatial Correlation Networks in 2010, (C) Evolution of Spatial Correlation Networks in 2015, (D) Evolution of Spatial Correlation Networks in 2020.
4.3 Identification of human settlements spatial association networks in three Northeastern provinces of China
The Gephi modularity model, identifying the spatial association networks of urban human settlements, was used to understand the organization, function, and evolution of the network and study the heterogeneity and dynamics of the urban spatial association network (Figure 6). In 2005 and 2010, three major community groups were roughly formed, with Shenyang, Dalian, Daqing, and Panjin as their main members. In the early years of 2005, the three major community groups were divided by geographical proximity and strong regional orientation as the main basis for the division of “factions”. It is worth noting that Jilin Province did not form its own factions, and most cities merged with Daqing or Shenyang and Dalian as the core community groups. The Panjin Society is a small, independent community group. In 2010, the three mainstream community groups were further refined into Shenyang as the core association, Dalian as the core association and Daqing as the core association. The division of community group ownership was clearer, and the small Panjin community group disappeared and was integrated into the Dalian community. At this stage, the eight prefecture-level cities in Jilin Province have still not formed their own “factions”.
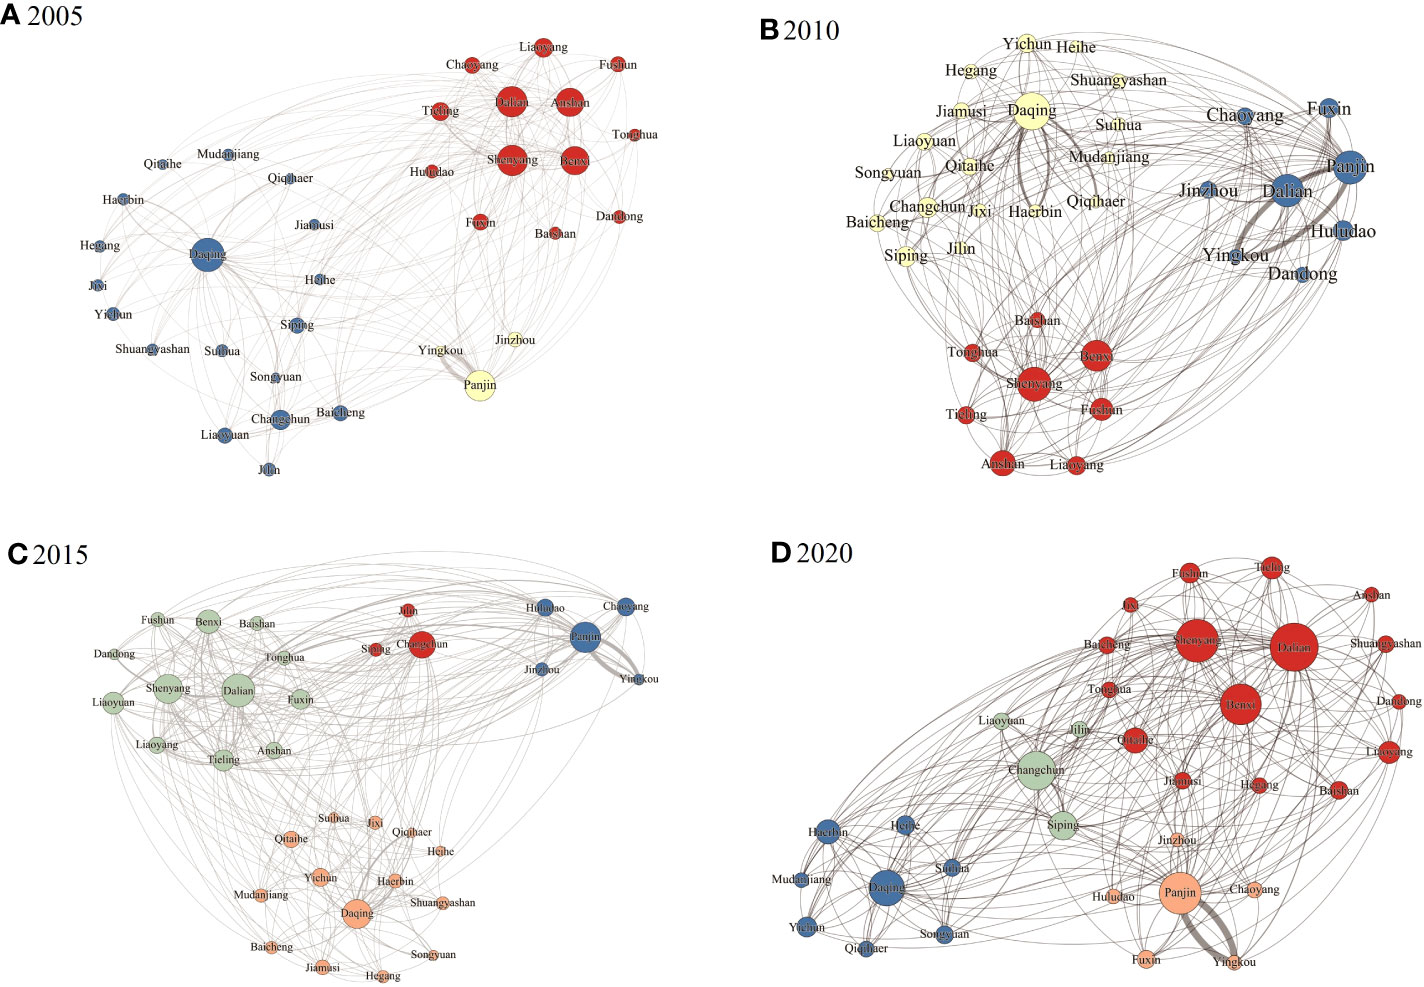
Figure 6 Spatial Community Groups in the Human Settlements Spatial Correlation Network of China's Northeastern Three Provinces. (A) Spatial Community Groups in 2005, (B) Spatial Community Groups in 2010, (C) Spatial Community Groups in 2015, (D) Spatial Community Groups in 2020.
In 2015 and 2020, the basic community group structure of Shenyang and Dalian (“Shenda” community group), Changchun community group, Daqing community group, and Panjin community group was roughly formed. In mid-2015, Changchun gradually separated from the Daqing and “Shenda” community groups and established a new network community group. The number of members in the Daqing community group decreased slightly, indicating that the network cohesion of the Daqing community group was weakened. The Dalian community group gradually merged with the Shenyang community from the previous independent faction and established a dual-core community structure. In 2020, the number of members in the Changchun and Panjin community groups increased slightly, the number of members in the “Shenda” community group also increased slightly, and the number of members in the Daqing community group decreased significantly, indicating that the overall structure of the community network was stable, with small changes in some areas, being relatively stable. With time, the members of the community flow, infiltrate, and overlap each other, and the hierarchical division of the network community tends to be reasonable.
In summary, the common characteristics mainly include the following aspects: the four years of human settlements spatial association network have formed community with main cities as the core, and the core members of the community are mainly provincial capitals, sub-provincial cities, sub-central cities of the province, and cities with good ecological protection, while the geographical orientation is obvious. The main characteristics of the difference are the internal structure of the community group with Changchun as the core is relatively weak. With time, the internal structure changes are obvious, and the network structure is unstable. The intensity of community connections in spatially association networks gradually increases, and the network boundaries become increasingly blurred with time.
5 Influencing factors of spatial correlation networks of human settlements in three Northeast provinces of China
5.1 Indicator selection and relational regression model setting
In essence, the spatial association network of human settlements is essentially a relationship network, and the use of conventional econometric models to compare and study relationships is difficult. The QAP model overcomes the weakness of traditional econometric models and constructs a difference matrix to explain the relational data by comparing the absolute values of matrix differences (see Ma et al., 2020; Shen et al., 2021 for relevant literature). In our research, we chose 2020 as the data acquisition time point. This choice was made because 2020 represents the most recent year in our study, and the data collected at this time point have higher timeliness and representativeness. By selecting indicators at the last time point for the analysis of influencing factors, we can better reflect the current state and development trends of the urban human settlement environment correlation networks. Considering the actual situation of the three Northeastern provinces of China, six levels were specially selected for measurement: administrative division, geographical distance, economic situation, urban construction investment, city scale, and degree of openness. The absolute value of the difference between variables is selected at each level to construct the QAP relationship model (Table 2). The specific model is as follows:
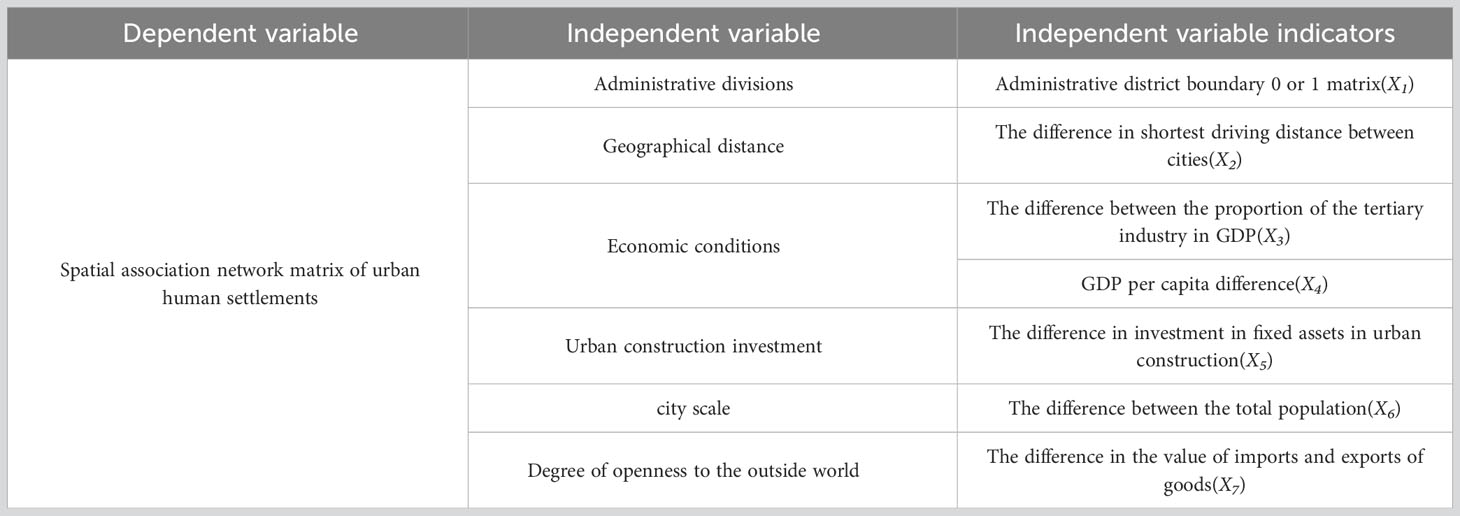
Table 2 The Driving Factors of the Spatial Correlation Network of Human Settlements for Two Individuals.
where Rm represents the dependent variable urban human settlements spatial association network, k0 is the constant term, k1~k7 is the model coefficient, and X1~X7 is the independent variable index and explanatory factor.
The independent variable contains: (1) Administrative divisions. Generally speaking, the Chinese government uses the administrative region under its jurisdiction as the boundary for policy formulation and economic, trade, and cultural exchanges. Members within the same administrative region have common characteristics, and it is easy to form a cooperation mechanism. Membership within the same administrative region is assigned a value of 1, and membership between different administrative regions is assigned a value of 0(X1). (2) Geographical distance. Geographical proximity can reduce the cost of factor flow, communication, and coordination, alleviate spatial friction to a certain extent, improve the efficiency of network connection, and select the shortest driving distance (X2) between prefecture-level cities to characterize the geographical distance. (3) Economic conditions. The human settlements is affected by the economy, and the economic development gap affects the direction of factor flow. The downturn in the real estate market during the economic depression and the postponement of urban renewal plans may lead to a decline in living conditions. On the contrary, when the economy is prosperous, more resources will be used to improve the living environment, such as public facilities construction, greening renovation, etc. (Yiran et al., 2023). In this paper, the difference between the proportion of the tertiary industry to GDP is selected (X3), along with GDP per capita difference (X4), to characterize disparities in economic conditions between cities. (4) Urban construction investment. The more adequate the investment in urban construction, the higher the level of urban infrastructure, public services, and environmental governance, thereby improving the living conditions and living environment of urban residents. On the contrary, if the investment in urban construction is insufficient, the city’s infrastructure and public services will not meet the needs of urban residents, and pollution and environmental problems may also be aggravated, which will have a negative impact on the living environment. The difference between fixed asset investment in urban construction is used to characterize the level of urban construction (X5). (5) City scale. Relevant studies have shown that the larger the city, the more resilient the human settlements. Use the difference in total population to characterize the scale of a city (X6). (6) Degree of openness to the outside world. Opening up can promote the city’s cultural diversification and international exchanges, improve the attractiveness and vitality of the city, and enhance its overall quality and living environment. The difference between the import and export value of goods (X7) is selected for characterization.
5.2 QAP correlation analysis and regression analysis
With the help of the QAP correlation analysis in Ucinet software, it is concluded that six influencing factors, including administrative district boundaries, shortest driving distance difference between cities, per capita GDP difference, urban construction fixed asset investment difference, total population difference, and import and export difference of goods, all passed the 1% significance test, and only the difference in the proportion of tertiary industry to GDP failed the significance test, indicating that the development of the tertiary industry has no significant impact on the formation of the spatial association network of human settlements. The other six indicators significantly affected the formation and development of spatially linked networks. The correlation coefficient of the shortest driving distance difference between cities is significantly negatively correlated, indicating that geographical proximity and close distance together are important reasons for spatial correlation and spatial spillover. The differences in administrative boundaries, per capita GDP, investment in fixed assets in urban construction, total population, and import and export of goods are all significantly positively correlated, indicating that these five factors promote the formation of urban human settlements spatial association networks in the three Northeast provinces of China.
In QAP regression analysis, the influence of multicollinearity of independent variables on the regression results is avoided. Then the number of random substitutions is set to 5000. The first regression was performed, and the R-squared coefficient was 0.382, indicating that the spatial correlation network of urban human settlements in the three Northeastern provinces of China was explained by 38.2% by seven independent variables. The differences between the proportions of tertiary industry in GDP, between total populations, and between import and export volume of goods were not significant. The differences between total populations were negative, indicating that the industrial structure, city scale, and foreign exchange do not sufficiently explain the spatial network. The differences between the boundary of administrative districts and the difference in per capita GDP both passed the 1% significance level test and were positive, indicating that the common language and logical thinking within the same administrative region can reduce the cost of factor flow and strengthen the network connection. Furthermore, the formation of networks in areas with good economic development levels is also conducive to the formation of networks. The difference between urban construction fixed asset investment passed the 10% significant level test and was also positive, indicating that the interpretation of urban construction level in the influence of human settlements spatial association network is not as strong as that of administrative division and economic conditions, but it still had a certain impact on the spatial correlation network of urban human settlements in the three Northeastern provinces of China. The shortest driving distance difference between cities passed the 1% significance level test and was negative, indicating that geographical proximity can effectively alleviate spatial friction and promote the flow between features.
Due failing the significance test in the first regression analysis, 5000 substitutions were selected by eliminating the non-significant index, the second stepwise regression was carried out, and the R-Squared coefficient was adjusted to 0.380. The spatial association network of human settlements in the three Northeast provinces of China showed that the explanatory degree of the four independent variables was 38.2%. The difference in explanatory degree from the first regression analysis was minimal, indicating that the excluded indicators had almost no explanatory power on the spatial association network of human settlements in the region. The stepwise regression coefficient and the first regression coefficient did not change significantly, and their significance did not change. Measures such as breaking the barriers of administrative regional restrictions, shortening the communication distance between cities, increasing people’s income levels, and increasing government investment in urban construction infrastructure projects are important means to improve the spatial connection and networking level of urban human settlements in the three Northeastern provinces of China and their coordinated and integrated development (Table 3).
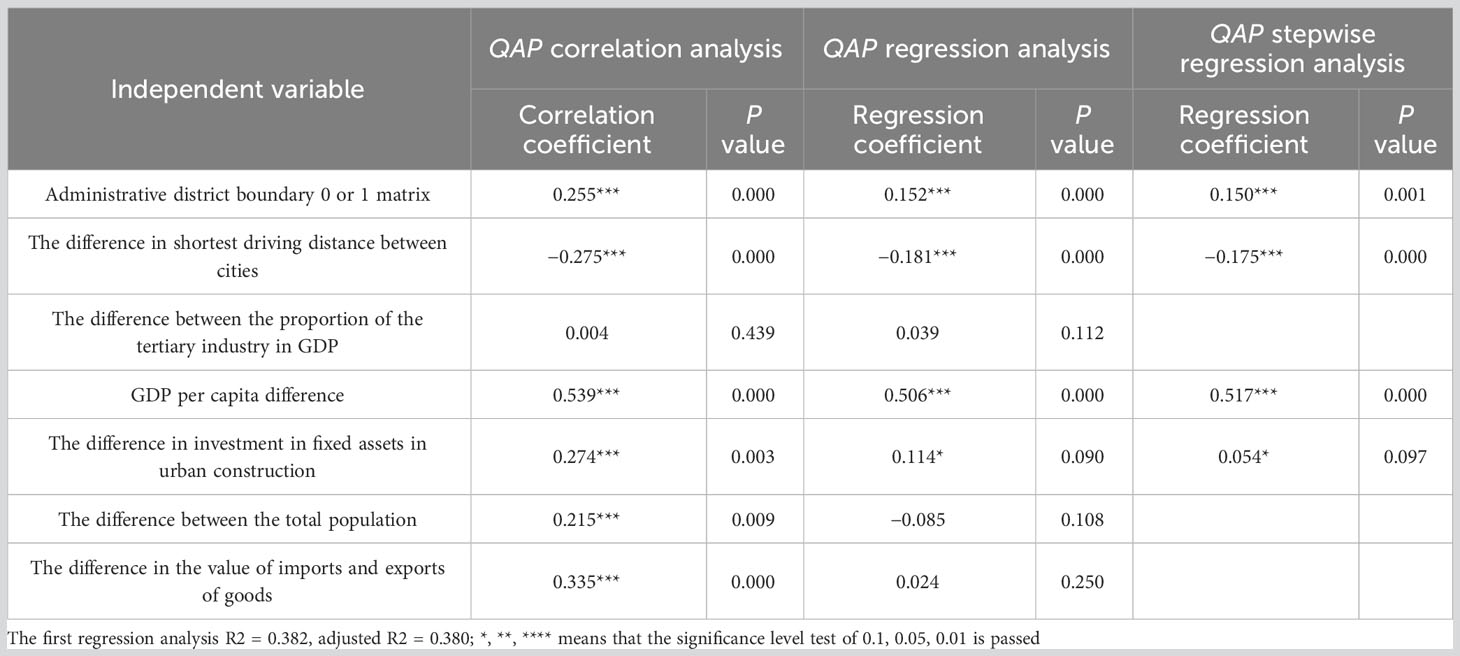
Table 3 Analysis of Influencing Factors on the Spatial Correlation Network of Human Settlements in the Three Provinces of Northeast China.
6 Discussion and conclusions
6.1 Discussion
From the perspective of spatial interconnection and spatial interaction, this paper shows that although the spatial correlation network of urban human settlements in the three Northeastern provinces has certain hierarchical characteristics and geographical directionality, there is still a significant “Matthew effect”, which is detrimental to underdeveloped areas and cities with a poor urban ecological environment (Tian et al., 2022). Based on the above conclusions, the following optimization paths are proposed: (1) Optimizing the allocation of human settlements resources and promoting the integrated development of human settlements spatial association. The urban human settlements network advocates the concept of balanced and coordinated development (Wu et al., 2021). However, there is still a lack of coordination in the spatial correlation structure of urban human settlements in the three Northeastern provinces of China. Shenyang, Dalian, Changchun, Daqing, Panjin, Harbin, and other cities are show significantly better coordination than other cities, although the marginal cities are connected to them but have not yet fully integrated into them. In the future, it is necessary to further adjust the radiation capacity and driving role of the core cities of the human settlements spatial association network to promote the spatial dislocation of human settlements. (2) People-oriented measures should improve the income levels and happiness index of urban residents (Dong and Liu, 2022; Zhaoqiang and Zhiguang, 2022). Increased income levels can lead to improved accessibility and mobility within the urban area, which may enhance interactions and connectivity between cities. Higher incomes can also stimulate economic growth and development, attracting investments and fostering infrastructural improvements, which in turn can positively impact the network structure of the urban human settlement environment. The government should adopt an active employment policy and a reasonable monetary policy to stimulate the vitality of the market economy, thereby increasing the government’s fiscal revenue, and further increasing investment in fixed assets in the construction of cities in marginal and underdeveloped areas through fiscal transfer payments and other means. (3) Regions should eliminate barriers to factor flow, weaken the binding force of administrative boundaries and geographical distances, replace individualized development with networked development, and promote the high-quality integrated development of the three Northeastern provinces of China.
This paper comprehensively and objectively integrates the comprehensive evaluation index system of human settlements into urban spatial association networks, which has strong practical and theoretical significance. However, this paper does not focus on human settlements research on human feelings, such as the cultural richness and natural suitability of human settlements and the satisfaction of their residents. The data can be deeply mined from these perspectives in the future to supplement and improve our study. Due to length limitations, this article selects the driving factors of the spatial correlation network of human settlements in previous research and combines the current situation of urban human settlements in three Northeastern provinces of China, exploring the driving factors of its spatial association network from 7 index levels at 6 levels and leading to certain limitations.
6.2 Conclusions
The present work analyzes the comprehensive evaluation data of urban human settlements in the three Northeastern provinces of China from 2005 to 2020 and uses the network degree model (point centrality, closeness centrality, intermediary centrality), modularity, QAP correlation regression model, and other methods to explore the spatial association network structure and the influencing factors of urban human settlements in the three Northeastern provinces of China. The main conclusions are as follows:
(1) From the perspective of the characteristics of the overall spatial association network, the four dimensions of network density, network connectivity, network level, and network efficiency in the three Northeastern provinces of China show different development directions. With time, the overall network density increases, network connectivity remains stable and unchanged, network hierarchy decreases, and network efficiency decreases. The spatial association network develops in the direction of a balanced and closed network, the accessibility of each node city in the network is better, and the hierarchical division between cities tends to be rationalized.
(2) From the perspective of individual spatial association network characteristics, urban network nodes show obvious regional differences. Shenyang, Dalian, Panjin, Changchun, Daqing, Harbin, and other cities are in the core position of the network and have a high dominance in the network related to human settlements. Shenyang, Dalian, Daqing, Yichun, and Qitaihe play the role of intermediary hubs in the network. Therefore, Shenyang and Dalian are not only in the core position but also act as intermediary hubs, and cannot be ignored in the individual spatial association network. Most prefecture-level cities have a low status in the network and are in a passive position.
(3) With time, the community structure of “Shenda community groups”, “Panjin community groups”, “Daqing community groups” and “Changchun community groups” with Shenyang and Dalian as the core has gradually formed, as detected through the identification of community groups through modularity. The network of various community groups are constantly overlapping and intertwining, and the “faction” hierarchy in the community structure has gradually become balanced and scientific
(4) According to the analysis results of QAP influencing factors, except for the proportion of tertiary industry to GDP, the other six indicators have a significant correlation with the spatial correlation network of urban human settlements in the three Northeastern provinces of China. However, in the spatial correlation regression model, the administrative district boundary, per capita GDP, and urban construction fixed asset investment all show a significant positive impact, the shortest driving distance between cities shows a significant negative impact, the other three indicators are not significant, and the response mechanism and response effect of the urban human settlements spatial association network in the three Northeastern provinces of China must be improved and strengthened.
Data availability statement
The original contributions presented in the study are included in the article/supplementary material. Further inquiries can be directed to the corresponding author.
Author contributions
RS and ML: conceptualization. RS: software, data curation, and writing – original draft preparation. RS and YH: formal analysis. RS: writing – review and editing and supervision. All authors have read and agreed to the published version of the manuscript.
Conflict of interest
The authors declare that the research was conducted in the absence of any commercial or financial relationships that could be construed as a potential conflict of interest.
References
Ali M., Emch M., Donnay J. P. (2002). Spatial filtering using a raster geographic information system: methods for scaling health and environmental data. Health Place. 8, 85–92. doi: 10.1016/s1353-8292(01)00029-6
Allen W. J., Bufford J. L., Barnes A. D., Barratt B. I. P., Deslippe J. R., Dickie I. A., et al. (2022). A network perspective for sustainable agroecosystems. Trends Plant Science. 27, 769–780. doi: 10.1016/j.tplants.2022.04.002
Bai J., Chen Y., Long Y. (2021). The structural equivalence of tourism cooperative network in the Belt and Road Initiative Area. Environ. Res. 197, 111043. doi: 10.1016/j.envres.2021.111043
Baldwin R. F., Powell R. B., Kellert S. R. (2011). Habitat as architecture: integrating conservation planning and human health. Ambio. 40, 322–327. doi: 10.1007/s13280-010-0103-7
Bnaya G., Dana V., Sergey V. B., Shlomo H. (2020). Two transitions in spatial modular networks. New J. Physics. 22, 053002. doi: 10.1088/1367-2630/ab8263
Boeing G. (2021). Street network models and indicators for every urban area in the world. Geographical Analysis. 54, 519–535. doi: 10.1111/gean.12281
Brown R., Leder K., Wong T., French M., Diego-Ramirez-Lovering N., Chown S. L., et al. (2018). Improving human and environmental health in urban informal settlements: the Revitalising Informal Settlements and their Environments (RISE) programme. Lancet Planetary Health 2, S29. doi: 10.1016/s2542-5196(18)30114-1
Chen J. (2022). Temporal-spatial assessment of the vulnerability of human settlements in urban agglomerations in China. Environ. Sci. pollut. Res. 30, 3726–3742. doi: 10.1007/s11356-022-22420-2
Chen W., Zhu K., Wu Q., Cai Y., Lu Y., Wei J. (2021). Adaptability evaluation of human settlements in Chengdu based on 3S technology. Environ. Sci. Pollut. Res. 29, 5988–5999. doi: 10.1007/s11356-021-15998-6
Cooper C. H. V. (2017). Using spatial network analysis to model pedal cycle flows, risk and mode choice. J. Transport Geogr. 58, 157–165. doi: 10.1016/j.jtrangeo.2016.12.003
Dong J., Li C. (2022). Structure characteristics and influencing factors of China's carbon emission spatial correlation network: A study based on the dimension of urban agglomerations. Sci. Total Environment. 853, 158613. doi: 10.1016/j.scitotenv.2022.158613
Dong J., Liu W. (2022). Association of physical activity level, income and environmental factors among chinese adults. Front. Public Health 10, 946756. doi: 10.3389/fpubh.2022.946756
Foster S., Hooper P., Burton N. W., Brown W. J., Giles-Corti B., Rachele J. N., et al. (2019). Safe habitats: does the association between neighborhood crime and walking differ by neighborhood disadvantage? Environ. Behav. 53, 3–39. doi: 10.1177/0013916519853300
Gama F., Isufi E., Leus G., Ribeiro A. (2020). Graphs, convolutions, and neural networks: from graph filters to graph neural networks. IEEE Signal Process. Magazine. 37, 128–138. doi: 10.1109/msp.2020.3016143
Ghasemi K., Hamzenejad M., Meshkini A. (2018). The spatial analysis of the livability of 22 districts of Tehran Metropolis using multi-criteria decision making approaches. Sustain. Cities Society. 38, 382–404. doi: 10.1016/j.scs.2018.01.018
Gontia P., Thuvander L., Wallbaum H. (2019). Spatiotemporal characteristics of residential material stocks and flows in urban, commuter, and rural settlements. J. Cleaner Production. 251, 119435. doi: 10.1016/j.jclepro.2019.119435
Gueguen L., Koenig J., Reeder C., Barksdale T., Saints J., Stamatiou K., et al. (2017). Mapping human settlements and population at country scale from VHR images. IEEE J. Selected Topics Appl. Earth Observations Remote Sensing. 10, 524–538. doi: 10.1109/jstars.2016.2616120
Guo Z., Li J., Xiao G., Gong L., Wang Y. (2022). Dynamic model of respiratory infectious disease transmission by population mobility based on city network. R. Soc. Open Science. 9, 221232. doi: 10.1098/rsos.221232
Hashem I. A. T., Chang V., Anuar N. B., Adewole K., Yaqoob I., Gani A., et al. (2016). The role of big data in smart city. Int. J. Inf. Management. 36, 748–758. doi: 10.1016/j.ijinfomgt.2016.05.002
Hausmann R., Stock D. P., Yıldırım M. A. (2021). Implied comparative advantage. Res. Policy. 51, 104143. doi: 10.1016/j.respol.2020.104143
Hong Z., Xin W. (2022). Border effects within a city and regional coordinated development in emerging economies. Finance Res. Letters. 50, 103304. doi: 10.1016/j.frl.2022.103304
Hua Y., Qiu Z., Luo W., Wang Y., Wang Z. (2021). Correlation between elderly migrants’ Needs and environmental adaptability: A discussion based on human urbanization features. Int. J. Environ. Res. Public Health 18, 5068. doi: 10.3390/ijerph18105068
Ido N., Ayu Sukma A. (2023). Urban wind corridors analysis via network theory. Atmosphere. 14, 572. doi: 10.3390/atmos14030572
Jan M., Giovanni B., Thomas W., John B., Felix C., Kuishuang F., et al. (2013). Carbon footprints of cities and other human settlements in the UK. Environ. Res. Letters. 8, 035039. doi: 10.1088/1748-9326/8/3/035039
Khera I. P. (1973). Business, government, and the science of human settlements. Business Horizons. 16, 65–72. doi: 10.1016/0007-6813(73)90050-5
Kirti J., Vasudha B., Sharanjit K. (2023). Epidemic dynamics in census-calibrated modular contact network. Network Modeling Anal. Health Inf. Bioinf. 12, 14. doi: 10.1007/s13721-022-00402-1
Levin N., Kyba C. C. M., Zhang Q., Sánchez de Miguel A., Román M. O., Li X., et al. (2020). Remote sensing of night lights: A review and an outlook for the future. Remote Sens. Environment. 237, 111443. doi: 10.1016/j.rse.2019.111443
Ma F., Wang X., Wang P., Luo X. (2020). Dense networks with scale-free feature. Phys. Rev. E. 101, 052317. doi: 10.1103/physreve.101.052317
Magigi W., Majani B. B. K. (2006). Community involvement in land regularization for informal settlements in Tanzania: A strategy for enhancing security of tenure in residential neighborhoods. Habitat Int. 30, 1066–1081. doi: 10.1016/j.habitatint.2005.12.002
Margherita C., Luca S. (2022). Assessing path-dependent urban growth with geographically weighted regressions. Environ. Impact Assess. Review. 98, 106920. doi: 10.1016/j.eiar.2022.106920
Marull J., Farré M., Boix R., Palacio A. B., Ruiz-Forés N. (2019). Modelling urban networks sustainable progress. Land Use Policy. 85, 73–91. doi: 10.1016/j.landusepol.2019.03.038
Michele M. (2022). The global human settlement layer sets a new standard for global urban data reporting with the urban centre database. Front. Environ. Sci. 10, 1003862. doi: 10.3389/fenvs.2022.1003862
Nath B., Ni-Meister W., Özdoğan M. (2021). Fine-scale urban heat patterns in new york city measured by ASTER satellite—The role of complex spatial structures. Remote Sensing. 13, 3797. doi: 10.3390/rs13193797
Oswald Beiler M. (2016). Organizational sustainability in transportation planning: Evaluation of multi-jurisdictional agency collaboration. J. Transport Geography. 52, 29–37. doi: 10.1016/j.jtrangeo.2016.02.013
Otero Peña D., Perrotti D., Mohareb E. (2022). Advancing urban metabolism studies through GIS data: Resource flows, open space networks, and vulnerable communities in Mexico City. J. Ind. Ecology. 26, 1333–1349. doi: 10.1111/jiec.13261
Punyakaew A., Lersilp S., Putthinoi S. (2019). Active ageing level and time use of elderly persons in a thai suburban community. Occup. Ther. Int. 22, 7092695. doi: 10.1155/2019/7092695
Qi B., Wang X., Sutton P. (2021). Can nighttime satellite imagery inform our understanding of education inequality? Remote Sensing. 13, 843. doi: 10.3390/rs13050843
Runyu F., Jun L., Weijing S., Wei H., Jining Y., Lizhe W. (2022). Urban informal settlements classification via a transformer-based spatial-temporal fusion network using multimodal remote sensing and time-series human activity data. Int. J. Appl. Earth Observation Geoinformation. 111, 102831. doi: 10.1016/j.jag.2022.102831
Schrock G., Wolf-Powers L. (2019). Opportunities and risks of localised industrial policy: the case of “maker-entrepreneurial ecosystems” in the USA. Cambridge J. Regions Economy Society. 12, 369–384. doi: 10.1093/cjres/rsz014
Shekhar H., Schmidt A. J., Wehling H.-W. (2019). Exploring wellbeing in human settlements - a spatial planning perspective. Habitat Int. 87, 66–74. doi: 10.1016/j.habitatint.2019.04.007
Shen Y., Sun X., Fu Y. (2021). The spatial network and its driving factors for sustainable total-factor ecology efficiency: the case of China. Environ. Sci. pollut. Res. 28, 68930–68945. doi: 10.1007/s11356-021-15456-3
Simini F., Barlacchi G., Luca M., Pappalardo L. (2021). A Deep Gravity model for mobility flows generation. Nat. Commun. 12, 6576. doi: 10.1038/s41467-021-26752-4
Smith C. M. (2016). An adaptive paradigm for human space settlement. Acta Astronautica. 119, 207–217. doi: 10.1016/j.actaastro.2015.11.017
Steiner F. (2004). Urban human ecology. Urban Ecosystems. 7, 179–197. doi: 10.1023/B:UECO.0000044035.22316.d1
Tian L., Hong Z., Zhilin L. (2022). Exploring the evolution of road centrality: A case study of Hong Kong from 1976 to 2018. Appl. Geograph. 146, 102767. doi: 10.1016/j.apgeog.2022.102767
van Strien M. J., Axhausen K. W., Dubernet I., Guisan A., Grêt-Regamey A., Khiali-Miab A., et al. (2018). Models of coupled settlement and habitat networks for biodiversity conservation: conceptual framework, implementation and potential applications. Front. Ecol. Evolution. 6, 41. doi: 10.3389/fevo.2018.00041
Wang F., Ren J., Liu J., Dong M., Yan B., Zhao H. (2021). Spatial correlation network and population mobility effect of regional haze pollution: empirical evidence from Pearl River Delta urban agglomeration in China. Environment Dev. Sustainability. 23, 15881–15896. doi: 10.1007/s10668-021-01326-y
Wu S.-S., Cheng J., Lo S.-M., Chen C. C., Bai Y. (2021). Coordinating urban construction and district-level population density for balanced development: An explorative structural equation modeling analysis on Shanghai. J. Cleaner Production. 312, 127646. doi: 10.1016/j.jclepro.2021.127646
Xiao Y., Hanxue C. (2022). Study on coupling coordination of the human settlement environment and tourism industry in the yellow river basin. Front. Environ. Sci. 10, 1016839. doi: 10.3389/fenvs.2022.1016839
Xu Q., Dong Y.-x., Yang R. (2018). Influence of the geographic proximity of city features on the spatial variation of urban carbon sinks: A case study on the Pearl River Delta. Environ. Pollution. 243, 354–363. doi: 10.1016/j.envpol.2018.08.083
Xue Q., Yang X., Wu F. (2021). A two-stage system analysis of real and pseudo urban human settlements in China. J. Cleaner Production. 293, 126272. doi: 10.1016/j.jclepro.2021.126272
Yiran Y., Xingping W., Sidong Z., Yang Z. (2023). Spatial structure and influencing factors of regional city supply networks in manufacturing: A case study of Shandong, China. Front. Environ. Sci. 11, 131. doi: 10.3389/fenvs.2023.1107835
Zhaoqiang Z., Zhiguang C. (2022). Urbanization, green development and residents' happiness: The moderating role of environmental regulation. Environ. Impact Assess. Review. 97, 106900. doi: 10.1016/j.eiar.2022.106900
Keywords: human settlements, spatially associative structure, Northeastern China, influencing factors, feature flow
Citation: Song R, Li X and Hou X (2023) Spatial network structure and driving factors of human settlements in three Northeastern provinces of China. Front. Ecol. Evol. 11:1206808. doi: 10.3389/fevo.2023.1206808
Received: 21 April 2023; Accepted: 18 August 2023;
Published: 07 September 2023.
Edited by:
Salvador García-Ayllón Veintimilla, Polytechnic University of Cartagena, SpainReviewed by:
Qingsong He, Huazhong University of Science and Technology, ChinaJohannes Uhl, University of Colorado Boulder, United States
Zhou Huang, Peking University, China
Copyright © 2023 Song, Li and Hou. This is an open-access article distributed under the terms of the Creative Commons Attribution License (CC BY). The use, distribution or reproduction in other forums is permitted, provided the original author(s) and the copyright owner(s) are credited and that the original publication in this journal is cited, in accordance with accepted academic practice. No use, distribution or reproduction is permitted which does not comply with these terms.
*Correspondence: Xueming Li, bGl4dWVtaW5nOTk5QDE2My5jb20=