 Qihong Yang
 Chaobo Zhang
 Xiaoguang Liu
 Shiming Yao1
94% of researchers rate our articles as excellent or good
Learn more about the work of our research integrity team to safeguard the quality of each article we publish.
Find out more
ORIGINAL RESEARCH article
Front. Ecol. Evol., 23 June 2023
Sec. Conservation and Restoration Ecology
Volume 11 - 2023 | https://doi.org/10.3389/fevo.2023.1205697
Under the combined effects of topography and vegetation, hydrological connectivity characteristics of riverbank slopes become complex and unclear, which limit the utilization and protection of riparian zones. To quantify the hydrological connectivity in root–soil composites, we conducted dyeing and tracing experiments in a high elevation plot and a low elevation plot on the bank of the Fenhe River. Soil and root properties and hydrological connectivity indexes in the plots were measured and analyzed. The results showed that the soil dyeing area ratio was approximate 1 in the soil depth of 0–5 cm and then decreased to 0.1 from 5 cm to 25 cm. The dyeing area ratio, maximum dyed depth, length index, peak value and non-uniformity coefficient of the high plot (Pc2) were 27%, 26%, 5%, 40% and 45% greater than those of the low plot (Pc1). The index of hydrological connectivity (IHC) of Pc2 was 7%, 44% and 71% greater than Pc1 in the soil depths 0–10 cm, 10–20 cm and 20–30 cm respectively. There was no significant correlation between the IHC and the physical properties of the soil at different depths, and the soil hydrological connectivity was closely related to the plant roots with diameter less than 1mm. The study primarily explored the characteristics of hydrological connectivity in root–soil composites. The results provide a scientific basis for exploring hydrological connectivity of riparian zones, which can support future riparian zone protection and restoration efforts in similar regions.
As an important tributary of the Yellow River, the Fenhe River Basin is rich in natural resources and blessed with productive conditions. However, the Fenhe River’s runoff is unevenly distributed within the year and has typical regional characteristics (Cai and Feng, 2021). Moreover, intense human activities and climate change have led to significant changes in precipitation, runoff and sand transport in the Fenhe River basin (Zhang et al., 2020). The riparian zone coordinates the longitudinal and lateral material and energy flows of the river and land, and it is an important component of riverine ecosystems (Yarrow and Marín, 2007). The special geographical location determines that the riparian zone of the Fenhe River is a fragile ecological area vulnerable to degradation by hydrological environment and human activities. Due to the unreasonably exploitation of the riparian zone, some negative impacts such as the reduction of riparian vegetation area, degradation of soil and water conservation functions, and destruction of ecosystem structure and functions, have been seriously threatening the sustainable development of the environment. In order to scientifically manage the water resources in the middle and upper reaches of the Fenhe River and to reasonably protect the water environment and the ecological health of the riparian zone, it is necessary to define the hydrological characteristics of the riparian zone of the Fenhe River. Hydrological, ecological and geomorphological processes interact and influence the structure and function of the riparian zone. Studying the mechanisms between hydrology, vegetation and soil is key to developing appropriate conservation measures (Liu J. et al., 2020). More generally, by exploring the spatial distribution patterns of hydrological connectivity in riparian zones, and by clarifying the relationship between plant roots and soils and hydrological connectivity, an understanding of the hydrological and ecological environment of riparian zones can be promoted. This will contribute to the development of strategies to mitigate the effects of anthropogenic disturbance damage, provide a scientific basis and technical support for riparian zone restoration, and provide theoretical guidance for riparian zone management in similar habitats. The concept of hydrological connectivity has its origins in the “river continuum” proposed by Vannote et al. (1980). Hydrological connectivity expresses the extent to which an ecological process takes place between different landscape units (Bracken and Croke, 2007). It has stimulated increasing research because of its impact on runoff development, nutrient transport and sediment transport on watershed slopes (Artza and Wainwright, 2009). The meaning of hydrological connectivity has been elaborated on different scales. It has been used specifically to refer to the in-stream environment (Nadeau and Rains, 2007), or it has focused on subsurface processes (Ocampo et al., 2006). Eliminating the individual complexity between watersheds, hydrological connectivity refers to the water-mediated transport of matter, energy and organisms (Bracken and Croke, 2007). More studies focus on large-scale hydrological connectivity. For example, Lane et al. (2009) applied the PDHM model to quantitatively assess the connectivity between land and river networks, and Jencso et al. (2010) revealed the hydrological connectivity between hillside landscape patterns and river networks through flow path continuity. Dynamic/static hydrological connectivity was assessed through in situ hydrological monitoring (Karim et al., 2012), hydrological modeling (Ameli and Creed, 2017), or functional analysis (Liu J. et al., 2020) based on soil water content and topography (Liu et al., 2019). However, these methods are limited to the watershed scale and more suitable for quantifying the connectivity of surface hydrological structures. Small-scale measurements of hydrological connectivity can assess the biological activity of a given area and thus provide a simple visualization of the ecological status of the area (Mooney and Korošak, 2009), which can influence the larger hydrological cycle processes, while insufficient attention has been paid to small-scale hydrological connectivity. Through field dye tracing experiments, Dai et al. (2020a) obtained hydrological connectivity below the soil surface and assessed the function of wetland water resources. However, hydrological connectivity below the surface at the riparian zone scale has not been fully investigated.
Hydrological connectivity below the soil surface may strongly influence hydrological processes, and then affect soil composition and the growth and distribution of plants (Rosier et al., 2016; Liu Y. et al., 2020). Certainly, plants and animals also have influence on hydrological processes through affecting hydrological connectivity (Zhang et al., 2018). Different vegetation environments can greatly influence connectivity, especially plant roots. The interactions between root systems and hydrological responses cause the active response zones (Zhang Y. et al., 2022). Zhang et al. (2021) demonstrated the influence of soil properties on hydrological connectivity using back propagation (BP) neural networks. Under the combined influence of some factors, unsteady seepage of water and solutes can occur down specific preferential paths such as root holes, caves or fissures (Fischer et al., 2015), which play a non-negligible role in surface water transfer and infiltration, rhizosphere water, solute and energy transport. Flow in pore networks reflects the spatial dimension of hydrology, but direct monitoring of its connectivity is difficult. Therefore, assessments of small-scale hydrological connectivity are often based on preferred flow indices (Liu J. et al., 2020). Dye tracing has become an established way of studying hydrological connectivity in soil. However, it is not only enough to use dye patterns as a qualitative picture to illustrate hydrological connectivity in soil, but also it can be used more effectively to quantify and compare flow processes in soil (Weiler and Flühler, 2003). The index of hydrological connectivity (IHC) below the soil surface obtained through field dye tracing experiments, allows the quantification of the hydrological connectivity within the soil and the evaluation of water flow and solute transport conditions and characteristics (Zhang W. et al., 2022). In the Yellow River Delta Wetland, the relationship between hydrological connectivity, root and wetland degradation based on IHC has been extensively studied (Zhang et al., 2021; Zhang Y. et al., 2022). The hydrological connectivity below the forest soil surface can also be presented by this index (Zhang W. et al., 2022). In the context of the combined effect of topography and vegetation, it is an interesting try to analyze hydrological connectivity on riparian zones based on dye-tracer technology.
Therefore, in order to assess the hydrological connectivity and its relationship with root–soil composites, we selected the root–soil composites at different heights in the riparian zone of the Fenhe River and used the dye tracing method and combined image processing techniques to analyze the morphological and spatial distribution characteristics of the dye profiles in the area. This study aimed to (1) analyze the hydrological connectivity at different heights in the riparian zone, (2) study the spatial variability of hydrological connectivity, and (3) determine the relationship between hydrological connectivity and soil and vegetation factors in the riparian zone.
Field experiments were conducted on the bank of the Fenhe River (112°25′52″E, 38°0′37″N) in the north of Taiyuan City, Shanxi Province, China (Figure 1). The Fenhe River is the largest river in Shanxi Province and the second largest tributary of the Yellow River, with a total length of about 716 km. Originated in Xinzhou City, the Fenhe River runs from north to south across the two basins of Taiyuan and Linfen into the Yellow River, with a basin area of 39,721 km2. The Fenhe River is a graben-type river. The topography is generally long in the north and south, narrow in the east and west, and irregularly wide banded distribution (Zhao et al., 2022). Fenhe River basin is located in the continental monsoon climate zone, which belongs to the semi-arid and semi-humid climate transition zone with an average precipitation of 504.8 mm and a water surface evaporation of 1,000–1,200 mm. The total annual runoff is 2.59 billion m3, and the average flow rate is 46.5 m3·s−1. The strata in the basin are relatively complete, and the regional karst water-bearing strata are mainly Cambrian-Ordovician carbonate strata. The main type of groundwater in the study area is carbonate karst water. The flood level is 808 m. The groundwater table elevation is approximately 795 m (You et al., 2013). The soil belongs to alluvial-proluvial cinnamon soil, and its parent material is primary eolian loess. The textural information of the soil was shown in Table 1. The vegetation zone is warm temperate broad-leaved forest zone.
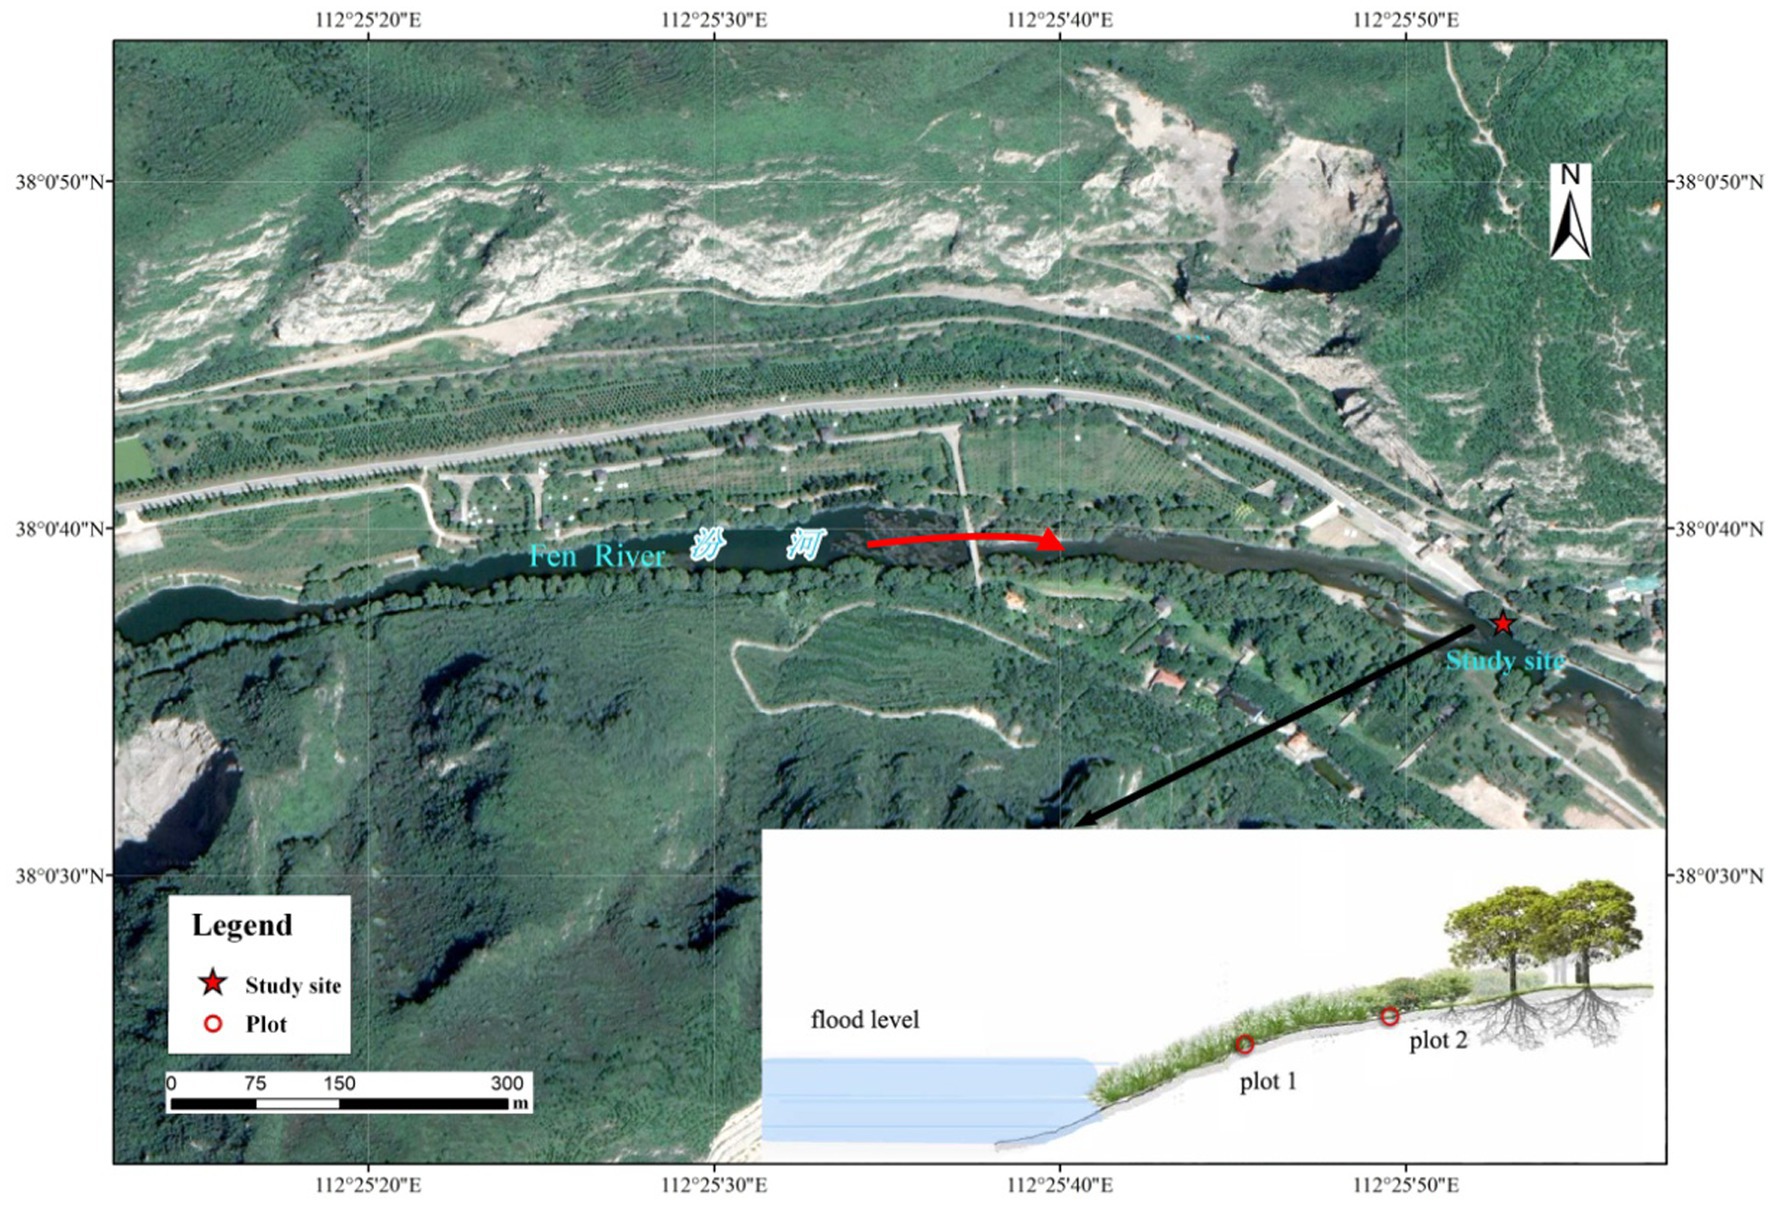
Figure 1. The location of the study site.
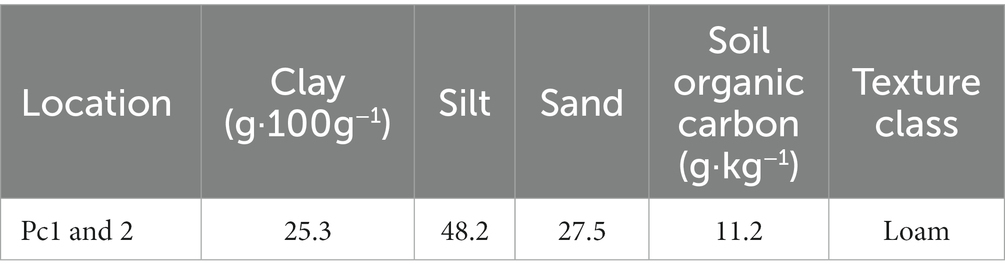
Table 1. The textural characteristics of the soil.
Two sample plots (Pc1 and Pc2) were set up at different elevations (low site and high site) in the riparian zone of the Fenhe River in August of 2021. Two reservoir dams are on the upstream of the study area. The water level at the plots remains below the elevation of the plots throughout the year. Sedimentary deposition mainly happens in the reservoirs. The riparian zone is located in the middle area and both plots were located on a sunny slope. The herbaceous dominant species in the high site were wild wormwood (Artemisia lavandulaefolia DC.) and hogweed (Salsola collina Pall.), while the main herbs in the low site were ryegrass (Lolium perenne L.), knotgrass (Equisetum ramosissimum Desf.) and reed [Phragmites australis (Cav.) Trin. ex Steud.]. The slopes of the two plots were similar, but the low site was a bit steeper than the high site. The two plots were 3 m apart. The fieldwork was conducted after 7 days of no rainfall to ensure the accuracy of the results. The plots were 0.8 m × 0.8 m in size, covered with film after removing weeds and garbage to protect them from external conditions such as rainfall and animals. The pretreatment time was 48 h.
At each plot, a metallic frame with a size of 0.6 m × 0.6 m × 0.4 m (length × width × height) was used to surround the field. Each metallic frame was embedded 0.3 m into the soil, and the soil at 5 cm of the inner wall of the frame was crushed to prevent the dye solution from infiltrating along the wall. Before the dye-tracing tests, the gravels and vegetation on the soil surface were cleared. The surfaces of the plots were then leveled. A 10 L dye solution (C.I. Food Blue 2), which was an ordinary amount for the dyeing volume in this study (Kan et al., 2019), was then applied to the surface of each experimental plot evenly through a sprayer. The blue brilliant dye tracer was used to visualize the trace of water at the initial stage of infiltration (24 h), which is a common and effective dyeing reagent. The tracer concentration of 3–5 g·L−1 is the most suitable color concentration value (Morris and Mooney, 2004). The concentration of the solution was 4 g·L−1. Then, each plot was covered with a plastic film that was removed 24 h after the infiltration stopped to prevent interference and solution evaporation. An area in 0.5 m × 0.5 m from the central part was selected as the sampling area. Six soil profiles were excavated at an interval of 10 cm horizontal width and marked with the numbers from 1 to 6. The sequence of the sections was indicated with the excavation direction (arrow) (Figure 2). Once the profile was trimmed, the pictures of each vertical portion were taken with a digital camera. The standard colorimetric card and the straight rule were placed next to the section for future image correction. The sunshade was used to control the light.
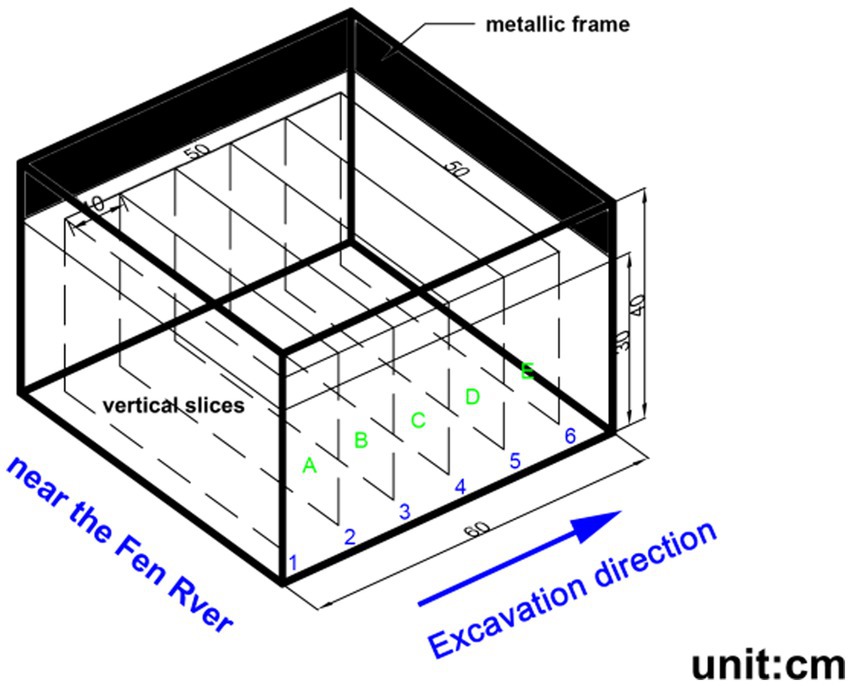
Figure 2. Schematic layout of the six vertical soil profiles in a plot.
Soil samples were collected from each of the two sample plots to measure soil physical properties (Jiang et al., 2019; Li et al., 2020). The soil samples were collected from each soil depth interval (0–10, 10–20, and 20–30 cm) using iron rings (volume of 100 cm3) in each experimental plot. The weight of the empty ring was recorded as WR (g) in advance. After leveling the surface of the soil at the sampling point, the ring was pressed slowly into the soil. When the soil column was exposed, the surrounding soil was carefully removed. The excess soil at the bottom of the ring was trimmed with a knife to ensure the accurate soil volume. The ring was placed in filter paper and covered to avoid water evaporation. Soil samples were immediately weighed (accurate to 0.01 g) and recorded (WN, g). They were then transported back to the laboratory to measure other parameters. The soil samples were soaked to saturation, ensuring that no water entered the samples from above, and the saturation weight was WSAT (g). The saturated soil core cylinders were placed on sand for 12 h to drain the gravity water and to measure the weight WD12H (g) next. Finally, they were dried at 105°C to a constant weight in an oven to measure the weight of the ring containing dry soil (WDS, g). The soil parameters were determined with the following formulas:
During the excavation, root samples were collected from the sections between profiles. Root samples within individual soil section were carefully collected and put into sealed bags. The samples were taken back to the laboratory and then washed with water. A vernier caliper with an accuracy of 0.01 mm was used to measure the root diameter, and a straight rule was used to measure the root length. The root volume is calculated from the measured values.
The photos were processed in Photoshop CS6 and Image Pro Plus 6.0 to quantify the stained areas (Kan et al., 2019). Adobe Photoshop CS6 was used for geometric correction, illumination correction and color substitution (Figure 3). First, the brightness, contrast and exposure of the images were adjusted referring to the gray card. The profile photos were then cropped to 500 pixel × 300 pixel (representing the actual size of 50 cm × 30 cm) by referring to the image ruler. The stained areas were then replaced with black and the unstained areas with white. After adjusting the greyscale and threshold values, the images were then processed by Imagepro Plus, such as erosion and noise reduction. Finally, the binary matrix was outputted. Hydrological connectivity indexes were calculated using these binary matrices (Dai et al., 2020a,b).
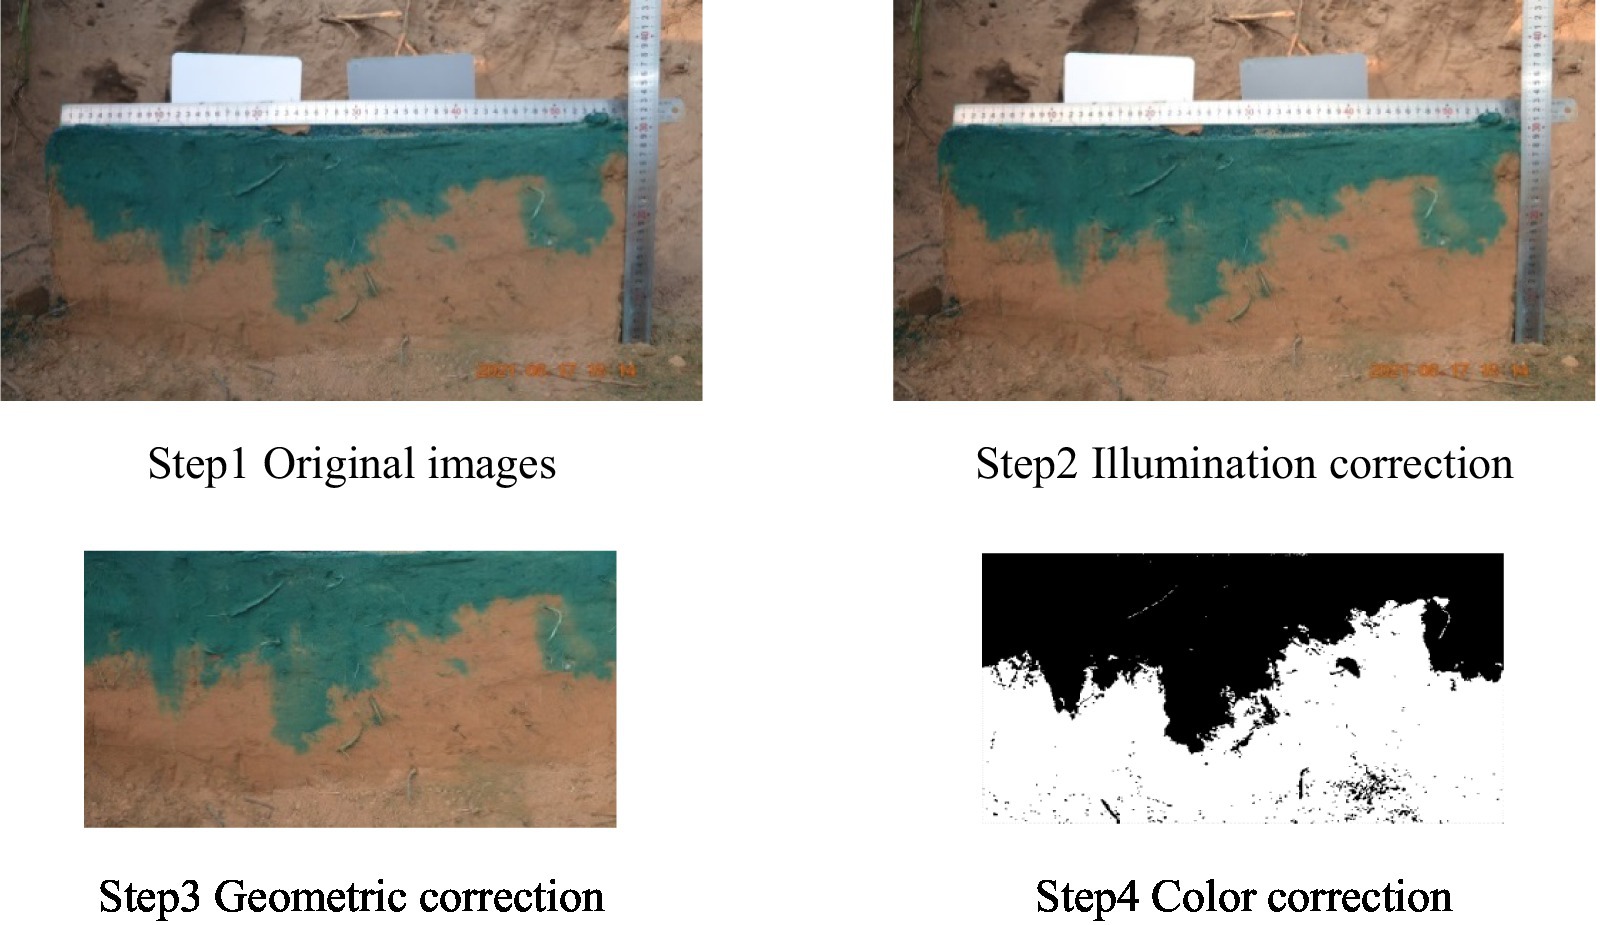
Figure 3. The steps of the image processing.
The dyeing area ratio (DC, %) refers to the proportion of the dyeing area of the whole soil profile to the total area of the soil profile,
where DC is the soil profile dyeing area ratio (%), D is the total dyeing area of the soil profile (cm2), and ND is the unstained area of the soil profile (cm2).
The maximum dyeing depth Hmax refers to the maximum infiltration depth of dye liquor in the soil profile, which can be used to characterize the vertical migration of soil moisture.
The length index Li refers to the sum of the absolute values of the difference between every two adjacent layers within each vertical,
where Li is the length index (%), DC (i + 1) and DCi are the dyeing area ratio (%) corresponding to the layer i + 1 and the layer i of the soil profile, and n is the total number of soil layers.
Peak value Pi is the number of intersection points between the vertical line of the total dyeing area ratio and the dyeing area ratio curve.
Infiltration depth non-uniform coefficient Cμ was calculated with the following formula.
where Cμ is the non-uniform coefficient of infiltration depth, hmax (xi, yi) is the maximum dyed infiltration depth (cm) at the vertical section (xi, yi), h is the average value (cm) of the maximum dyed infiltration depth at different (xi, yi) positions, and N is the total number of pixels in the parallel direction of the test pit section.
FD can describe the complexity of the dyeing zone of a soil profile (Zhang W. et al., 2022).
where FD is the fractal dimension, ε is the average width of each dye-stained area, and N(ε) is the number of fractals covered by this dye-stained area.
IHC reflects the degree of overall hydrological connectivity and the contribution of patches (Zhang W. et al., 2022).
where DC is the dyeing coverage (%), FD is the fractal dimension, and n is the number of profiles at a specific depth.
The mean value for each of the calculated parameters of hydrological connectivity was computed from the six soil slices in each plot. The data were analyzed by SPSS 20. The data met the requirements of homogeneous variance. One-way analysis of variance (ANOVA) was used to evaluate the influence of plot on the hydrological connectivity indexes. The difference was significant at the level of 0.05. Correlation analysis was carried out on the hydrological connectivity indexes and their affecting factors (soil and root properties). Graphs were plotted using Origin Pro 2016.
The physical parameters of the soils in the two sample plots were significantly different except the natural water content between Pc1 and Pc2 in the soil layer of 0–30 cm (p < 0.05, Table 2). The difference in bulk density between the two samples was 0.177. The saturation capacity of Pc2 was 28.9% greater than that of Pc1, while the total soil porosity of Pc2 was 11.5% greater than that in Pc1. The capillary porosity and non-capillary porosity of Pc2 were 1.1 and 2.0 times higher than those of Pc2, respectively. Soil bulk density increased significantly with soil depth, while porosity decreases with soil depth. As the soil depth from 0–10 cm to 20–30 cm, the bulk density increased by 12.0% (Pc1) and 14.7% (Pc2). The decrease in total, capillary and non-capillary porosity with depth was 12.3, 12.8, and 16.1%, respectively in Pc1, and 4.3, 2.4, and 52.4%, respectively in Pc2.
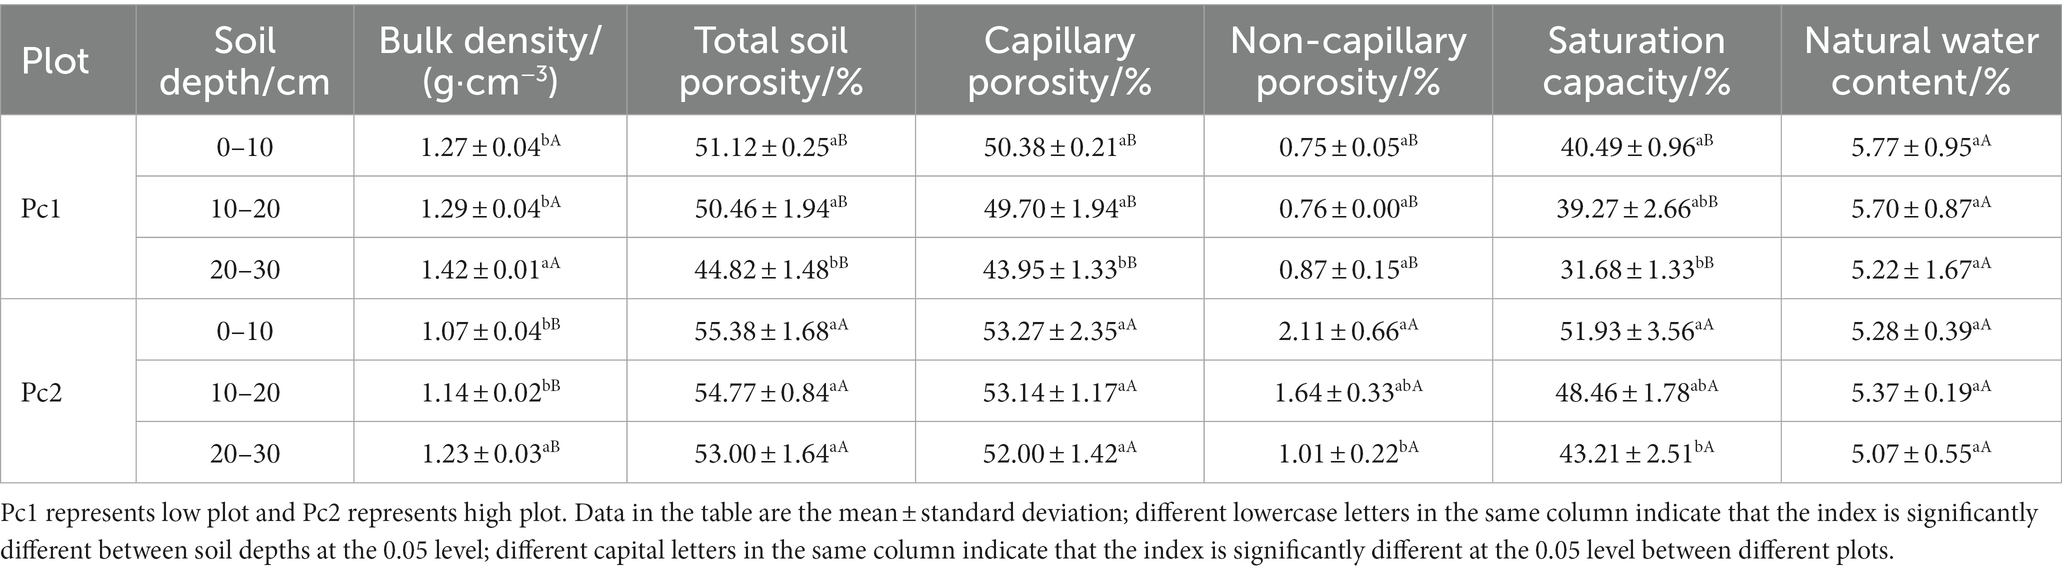
Table 2. Soil physical properties.
The number of roots in the two diameter classes (D < 1 mm and D ≥ 1 mm) did not vary significantly from one section to another, but it was significantly greater in Pc1 than in Pc2 (Figure 4). The number of roots in Pc2 was less than that in Pc1. Specifically, The roots of Pc2 were only 0.48 times (D < 1 mm) and 0.35 times (D ≥ 1 mm) less than those of Pc1. The number of roots with D < 1 mm was about 5 times as many as D ≥ 1 mm in Pc1, and about 7 times in Pc2. The root volume ratio was also greater in Pc1 that in Pc2, but the difference was not significant between the two plots (Figure 5). The root system was larger in volume for larger diameter classes.
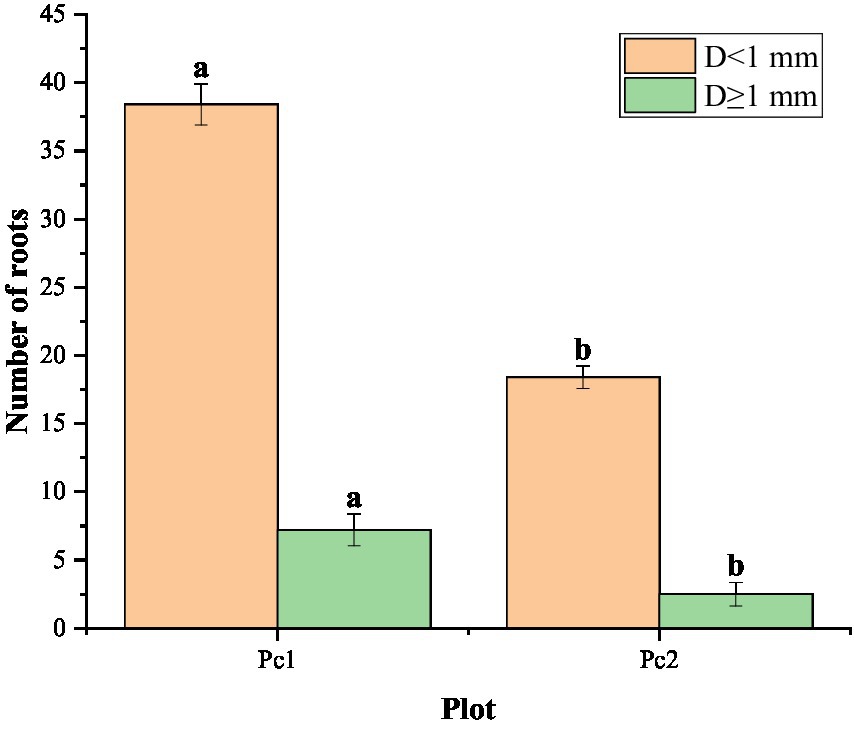
Figure 4. Distribution of root number by root diameter (D) class in the Pc1 (low plot) and Pc2 (high plot). Different letters on the bars indicate that the index is significantly different between the two plots at the 0.05 level.
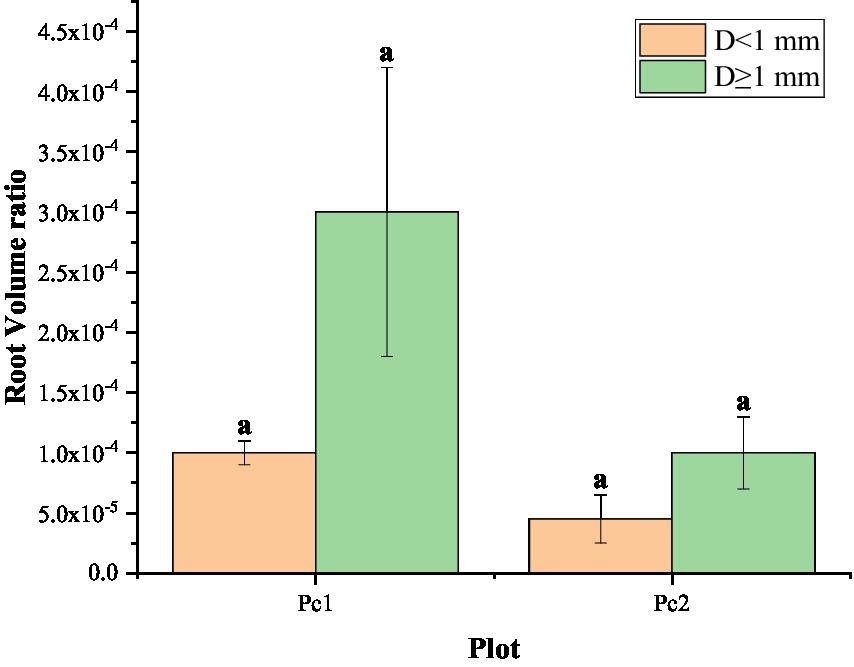
Figure 5. Root volume ratio in the Pc1 (low plot) and Pc2 (high plot). Different letters on the bars indicate that the index is significantly different between the two plots at the 0.05 level.
In the process of vertical migration of soil dyeing solution in the riparian zone, the distribution of dyeing area was not uniform even in the same plot (Figure 6). The maximum dyeing depth occurred in the center of the samples, with some stained areas bifurcating in the image and the staining path penetrating downwards in strands from either side. The staining was concentrated within 25 cm soil depth, and pronounced staining of the upper soil layer was observed for all experiments. The staining fraction gradually decreased with increasing soil depth. Irregular morphology of the soil staining was observed in different height samples. The infiltration depth increased with the increase of elevation, and the spatial distribution of the high plot was noticeably more non-uniform.
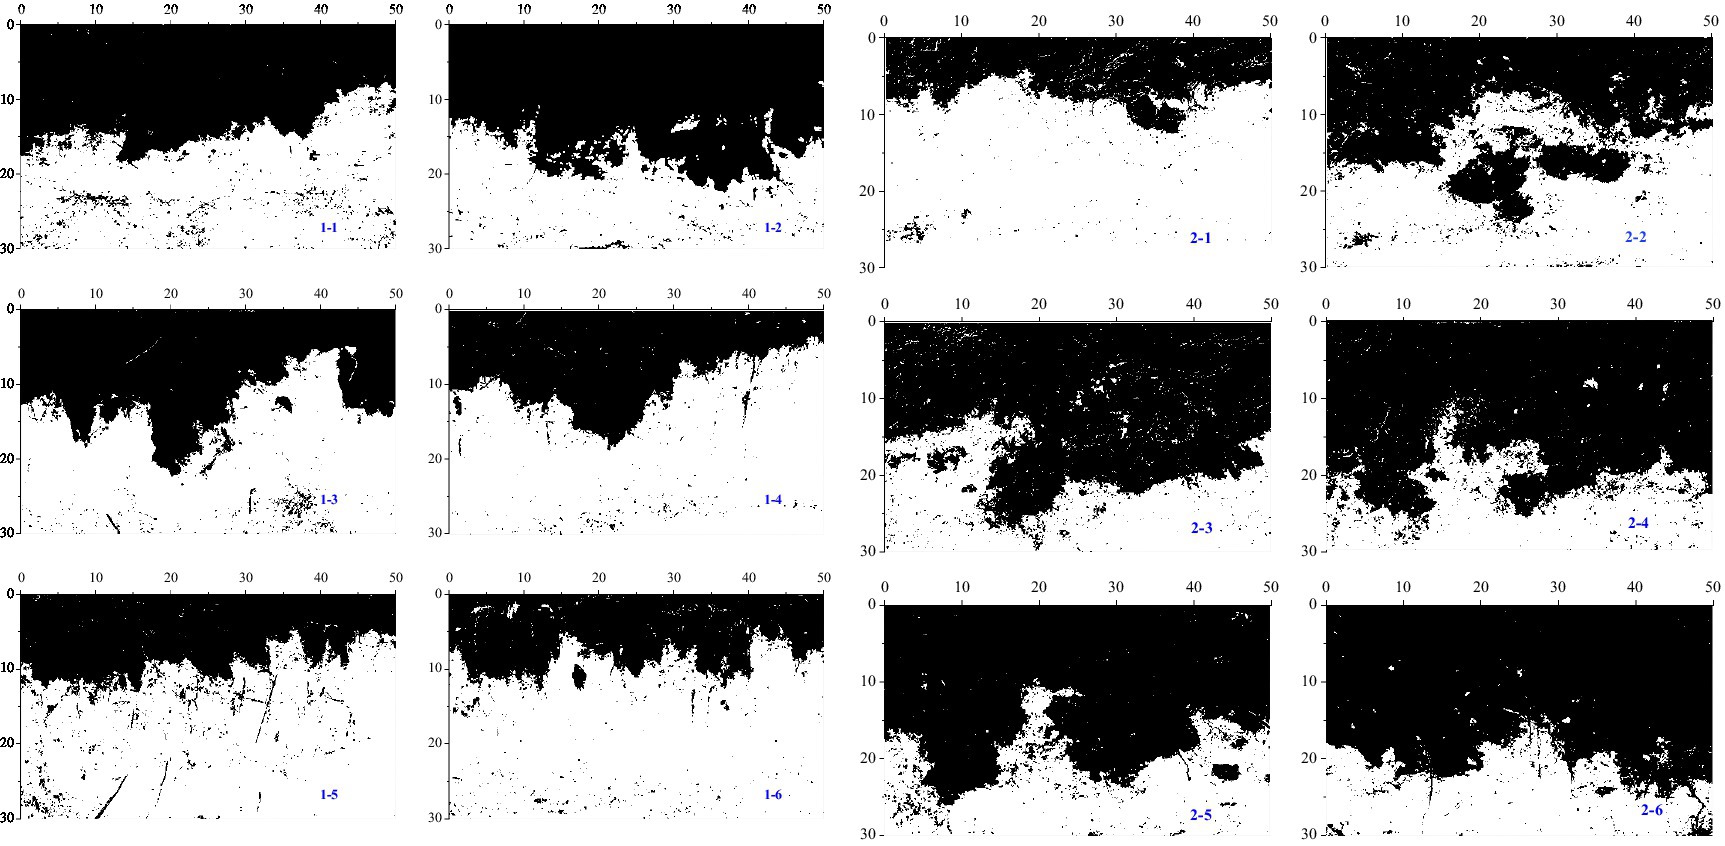
Figure 6. Example dye images for profiles under different heights. (1-×) corresponds to the vertical profiles of Pc1; (2-×) refers to the vertical profiles of Pc2. The width of each profile closest to the river was recorded as 0.
The curves of dyeing area ratio with soil depth showed that the dye tracer stained mainly in the depth of 0–20 cm for Pc1 and Pc2 (Figure 7). Pronounced staining of the upper soil layer was observed for all profiles. The staining area ratio decreased in a fluctuating manner with increasing soil depth. The staining of the top soil was almost complete. Dyeing area ratio was approximate 1 in the soil depth of 0–5 cm. The dyeing area was distinctly declined in the soil layer from 5 to 25 cm, and the staining was weak below 20 cm. The dyeing area ratio was not monotonically decreased with the soil depth.
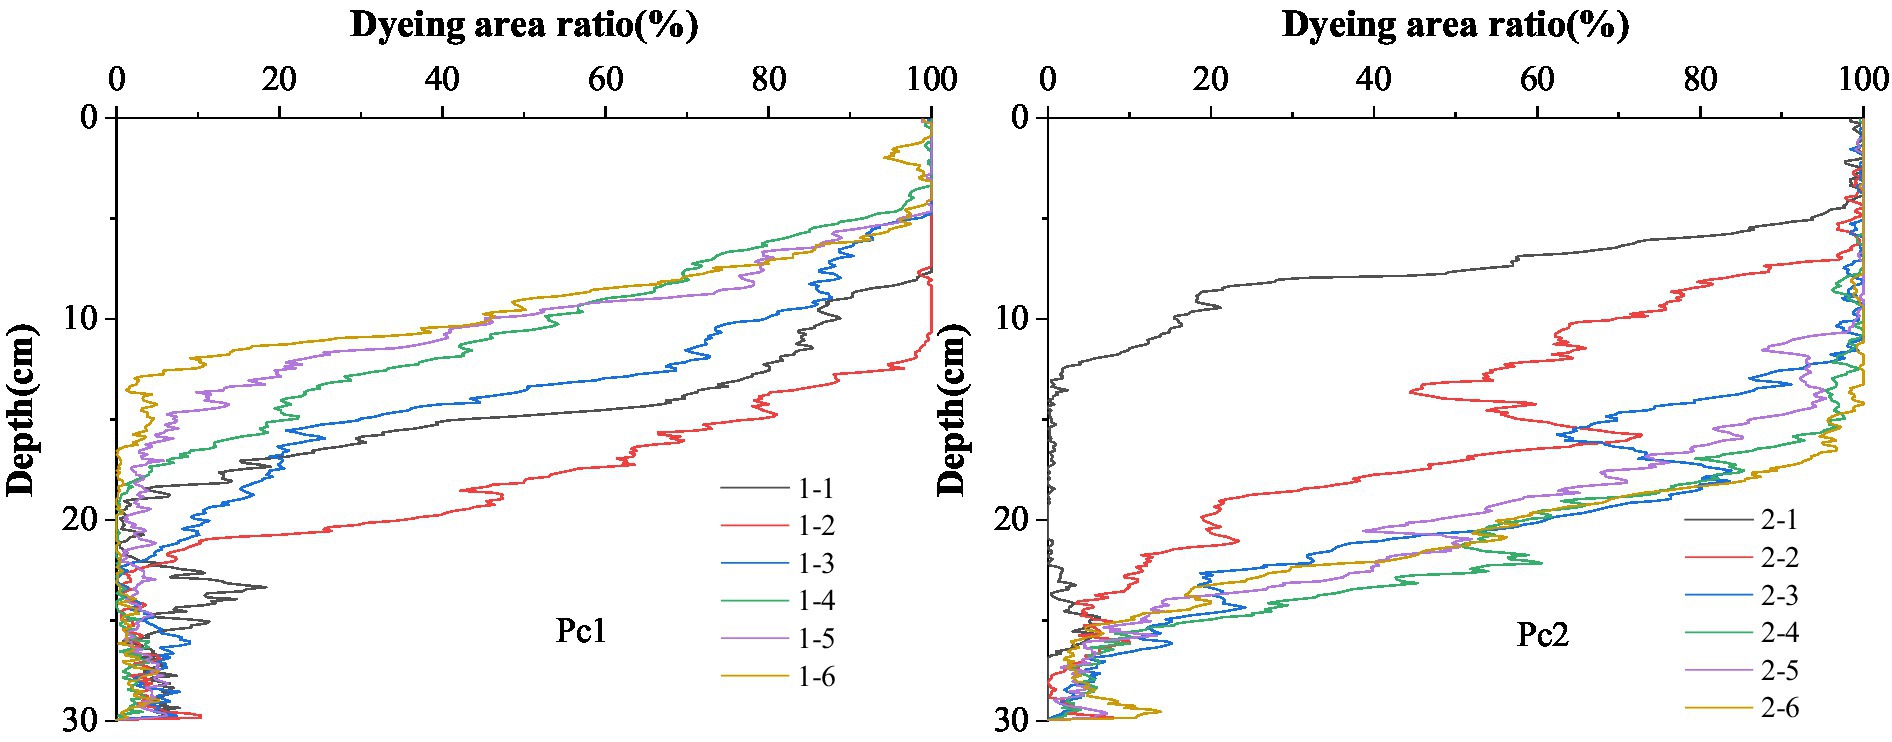
Figure 7. Dyeing area ratio of the two plots Pc1 and Pc2.
The variability of the dyeing area ratio in Pc1 was larger and more uniform in the depth of 5–20 cm than Pc2, but it fluctuated more greatly near the soil depth 20 cm. In the plot Pc2, the largest variability was in the soil depth 13 cm. The variation of dyeing area ratio in the high plot (Pc2) was greater than that in the low plot (Pc1). The maximum dyeing depth in the same plot fluctuated in a direction perpendicular to the river (Figure 8).
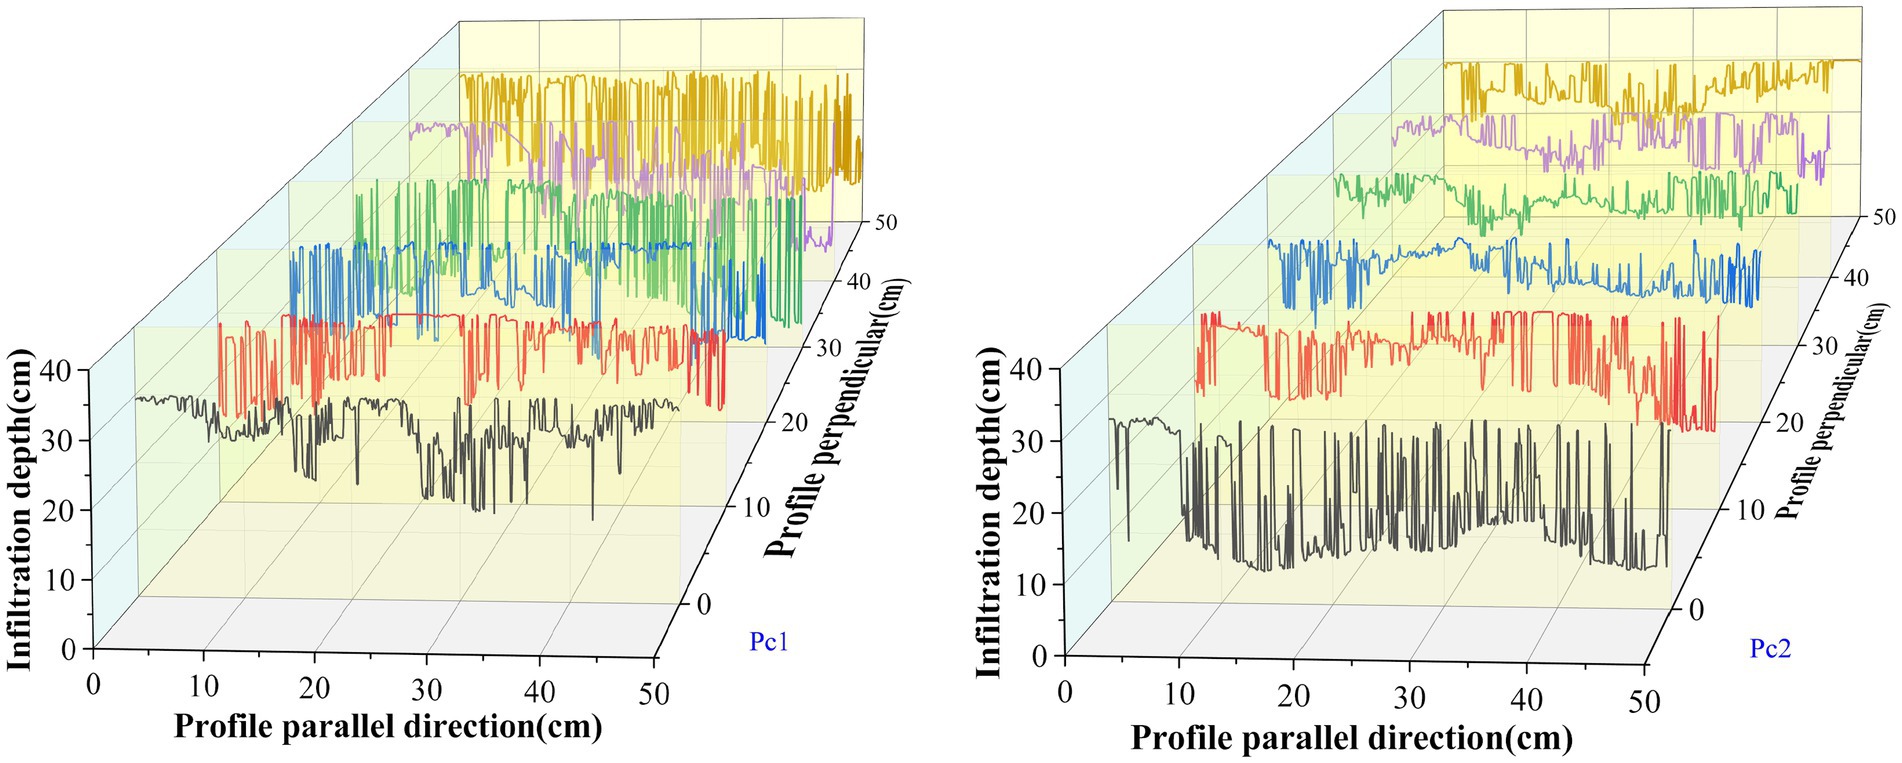
Figure 8. Depth of infiltration in different profiles.
The five parameters used in this study to quantify the degree of hydrological connectivity were greater in Pc2 than in Pc1. Specifically, Pc2 had 27% greater Dc, 26% greater Hmax, 5% greater Li, 40% greater Pi and 45% greater Cμ than Pc1 (Table 3), which showed that the hydrological connectivity in the high plot was deeper than the low plot. No significant difference was observed in each staining characteristic index between the two plots at different heights except for Cμ.
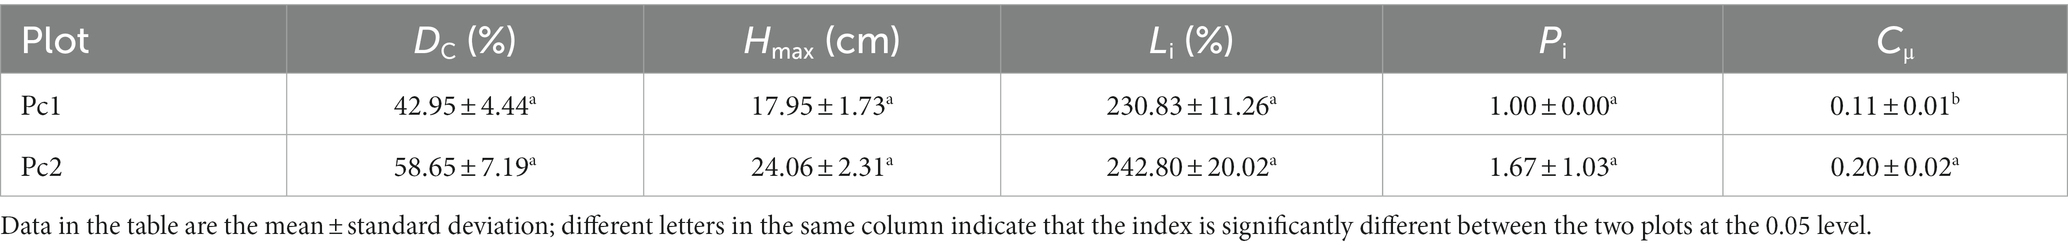
Table 3. The dyeing morphological parameters.
The correlation analysis illustrated a significant positive correlation between the dyeing area ratio and the maximum dyeing depth (Table 4). There was a significant positive correlation between the length index and the peak. No significant correlation was found between other parameters.
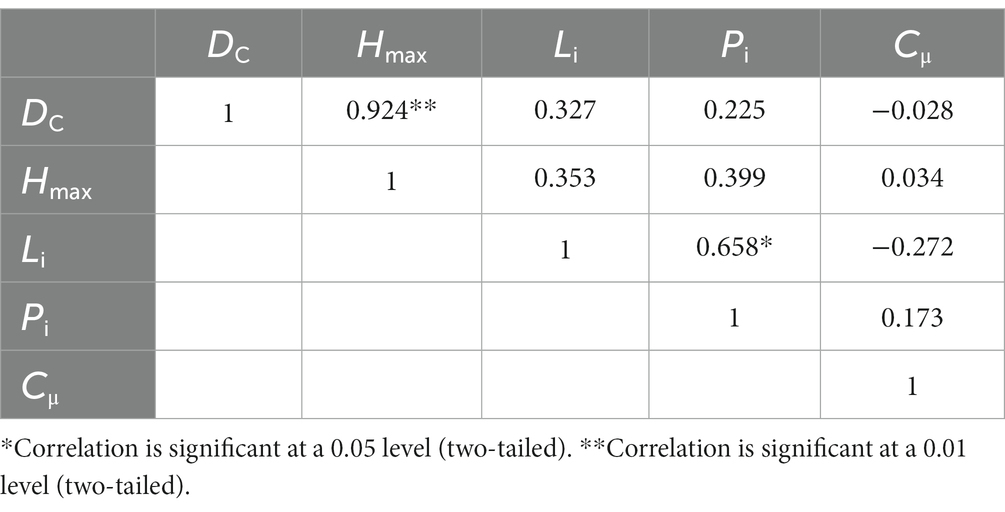
Table 4. Correlation analysis of the dyeing morphological parameters.
FD and IHC decreased with increasing soil depth (Table 5). The decrease of FD was 33.15% in Pc1 and 24.34% in Pc2. The decreasing values of IHC were 0.414 and 0.383, respectively. The FD was 1, 6, and 12% greater and the IHC was 7, 44, and 71% greater in Pc2 than in Pc1 in the soil depths 0–10, 10–20, and 20–30 cm, respectively.
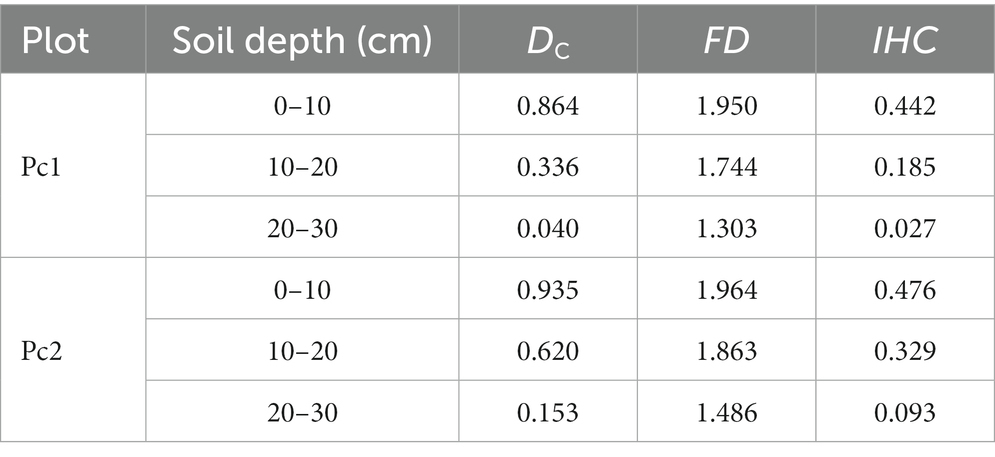
Table 5. Changes of dyeing area ratio (DC), fractal dimension (FD), and index of the hydrological connectivity (IHC) with soil depth.
Soil bulk density was significantly and negatively correlated with total porosity, capillary porosity, non-capillary porosity and saturated water content, while saturated water content was positively correlated with total porosity, non-capillary porosity and capillary porosity. No significant correlation existed between IHC and the physical properties of the soil in each layer, but IHC was significantly and negatively correlated with soil depth (Table 6).
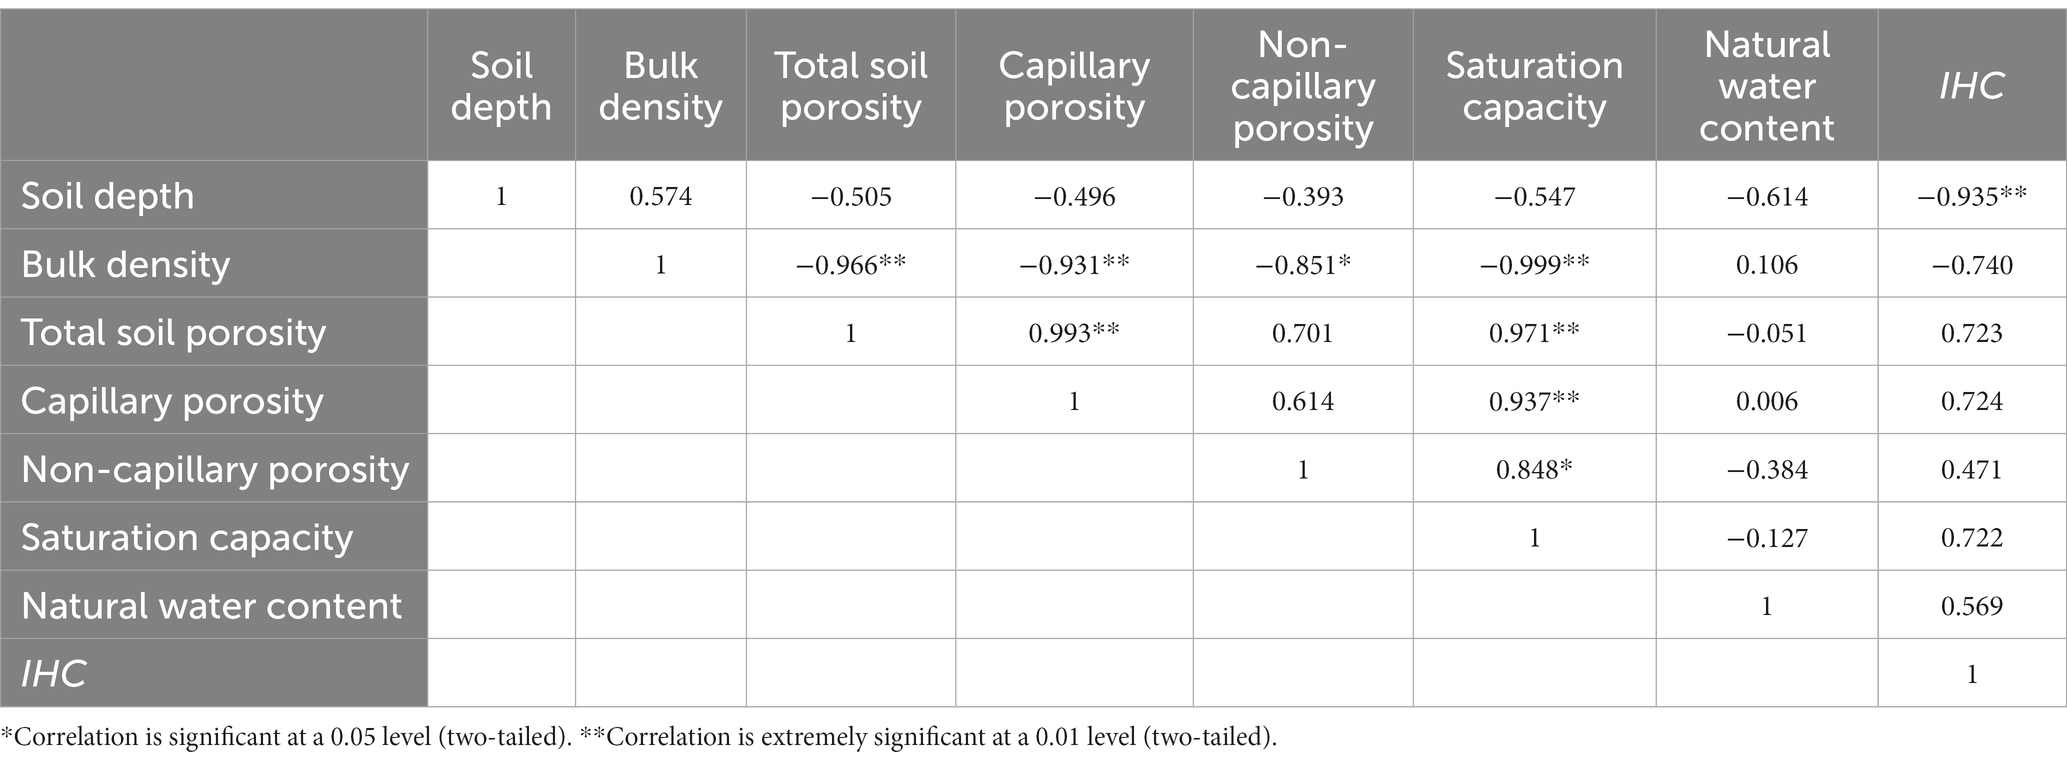
Table 6. Correlation between the IHC and soil physical properties of each layer.
The dyeing area ratio, maximum dyeing depth and peak were all significantly and negatively correlated with the number of roots less than 1 mm in diameter in the two plots (Table 7). The length index was not significantly correlated with root parameters, while the non-uniform coefficient of infiltration depth was highly significantly correlated with the number of roots in each diameter class. An extremely significantly negative correlation existed between the non-uniform coefficient and the root volume ratio.
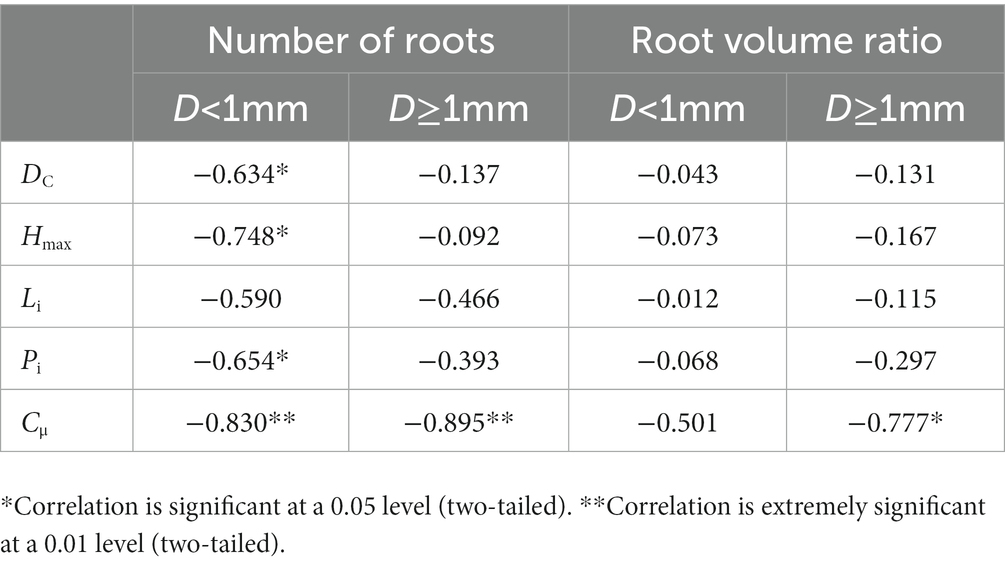
Table 7. The correlation between the dyeing indexes and the plant root indexes.
The distribution of dyeing area was not uniform even in the same plot due to the strong spatial heterogeneity of soil water distribution and the encircling characteristics of preferential flows. Dyeing area ratio had little change in the top soil. It decreased rapidly in the 10–25 cm layer and stained very weakly below 25 cm. This indicated that the hydrological connectivity was weak at the start of the experiment, and then strengthened. With the rapid spread of the dye solute through the soil and the reduced dye coverage, the hydrological connectivity became weaker again. Eventually, little dye was left and the dye coverage dropped to a very small value (Dai et al., 2020a). The fluctuating decrease in dyeing area ratio is a good indication of the shift in water flow patterns (Weiler and Flühler, 2003). The reason may be that the surface layer of soil was more biologically active and looser, and the roots were more evenly distributed. Large pores formed by roots and animal activities in the 10–20 cm soil layer led to rapid transport of the dye to the lower soil layers. The soil was more compact in lower layers. It was difficult to form large pores. Consequently, the plant root length density and root biomass were decreased, and the hydrological connectivity became weaker. Fewer fissures in the subsoil restricted water transport, which resulted in final zero of the stained area.
Some dyeing area ratio curves showed an overall “S” shaped curve. It might be caused by the presence of fine roots or rhizolith structures in the soil. Root network enhances the permeability of soil and the difference in the number of macropores allows the lateral flow of soil water movement. It was also possible that the presence of a hydrological barrier layer caused the lateral dye infiltration. As soil texture changes from coarse to fine, the retention effect of the hydrological barrier layer becomes apparent (Chelli et al., 2018), and dyeing area ratio increases abruptly when the dye accumulates on the surface of the hydrological barrier layer. The differences in the dyeing area ratios and rates of decline between different soil profiles at the same elevation indicated a high degree of spatial variability of soil water movement.
The indexes of dye-tracing images were used in this study to characterize the strength of the hydrological connectivity. Dyeing area ratio should be interpreted together with other dyeing morphological parameters, because morphological and variation indicators may differ for the same dyeing area ratio. The length index, peak index, and non-uniform coefficient of infiltration depth are all indicators related to the heterogeneity of the stained image, and can more accurately reflect the degree of variability in dyeing patterns (Dai et al., 2020a). The index of hydrological connectivity (IHC) can provide a better understanding of hydrological processes at the microscopic scale. The results showed that IHC below the soil surface decreased with increasing soil depth and the connectivity of the soil surface was stronger. It is consistent with the results of dyeing area ratio, which confirms that the IHC is indeed a suitable indicator of hydrological connectivity. IHC in this study was similar to the results in the forest area, but differed from the values in the Yellow River Delta region (Zhang W. et al., 2022; Zhang Y. et al., 2022). This may be due to the fact that the same DC with homogeneous and isolated dye-stained patches would lead to variable FD, which results in the changes of IHC. Complex isolated patches in wetland soils may have enhanced the spatial heterogeneity of hydrological connectivity, while the riparian zone was more uniformly stained. Changes in the dyeing patterns were complicated. However, in this study, these patterns were only used to analyze the change manner of the hydrological connectivity. The plots in this study were set up avoiding trees, which affect hydrological connectivity (Tobella et al., 2014). Therefore, it would be reasonable to study the vertical hydrological connections under these conditions.
The properties of soil and root system influence soil water infiltration. Water transport and connectivity in soil are influenced by soil physical properties of and vegetation characteristics. Vegetation cover types were richer in the low plots near the river, but the physical properties of the soil also affected the rate of water infiltration, which could explain the greater hydrological connectivity in the high plot (Pc1).
No significant correlation was observed between IHC of each layer and the physical properties of the soil, indicating that IHC was not influenced or weakly influenced by these physical properties in this study. Although soil hydrological connectivity is influenced by soil properties, soil physical properties may be not the dominant influence (Dai et al., 2020a). Theoretically, soil with larger pore sizes has faster percolation rates (Tobella et al., 2014). Differences in soil macropore structure influence the process of water infiltration (Fischer et al., 2015). The presence of macropores provides a preferential pathway for soil water movement. Soil water bypass part of the soil matrix to infiltrate in areas of soil with relatively higher macropore content. Soil porosity and connectivity have a direct influence on preferential pathways and intensity, but the soil pores consist of both connected and unconnected pores (Zhang et al., 2018), and the probability of the water flowing to each pore is different. Pore geometry and continuity vary due to soil management practices (Alaoui et al., 2011). Soil with higher initial water content has lower water potential gradient, which limit the transport of soil water and solutes. Matrix potential can significantly reduce the energy state of water near the particle surface, although the movement of water due to the potential may be slow. The potential is extremely important in supplying water to plant roots. Water movement in fine-textured soil is also more likely to form higher forms of non-uniform flow, but the effect of soil texture on hydrological connectivity is negligible (Fischer et al., 2015). The presence of salt-based ions and organic matter could promote the formation of soil agglomerates, and the ability of micro agglomerates to repel water is more likely to lead to uneven water distribution in the soil (Dai et al., 2020a). These factors still need further study. Significantly negative correlations were observed between the number of roots (D < 1 mm) and the dyeing area ratio, peak value, depth of penetration, and inhomogeneity coefficient. The result was different from those found in previous research in which the longitudinal root network made the soil more hydrologically connected. The differences in plant type and root distribution could be possible reasons. Taproot plants favor stable macropore generation, but the dense root network of fibrous plants with a high proportion of fine roots may block the channels in soil (Liu Y. et al., 2020). Fine roots having greater water absorption than coarse roots could impede the flow of the dye. The results also indicated that not all root systems contributed to the hydrological connectivity pathway and roots with a smaller diameter (D < 1 mm) contributed more to water infiltration. The mass distribution of fine roots depends on the growth and mortality of individual root tips and has a high turnover rate, depending on local conditions and seasons (Schwarz et al., 2010). Some studies have shown that root systems with a large diameter (D > 5 mm) squeeze the soil as they grow in soil, which can lead to smoother soil channels and have the greatest impact on soil hydrological connectivity. However, the diameter of the roots collected in the plots in this study was less than 5 mm.
Root system and soil have a certain combined influence on the dyeing pattern, which needs to be comprehensively considered. The mechanism of root–soil interaction is complex and the presence of roots is important for soil water infiltration. Roots can indirectly influence soil water infiltration by affecting soil properties, and root growth and temperature changes can cause the formation of annular pores, which can also enable accelerated water movement (Li et al., 2009). Moreover, root secretions and decay of dead roots facilitate the accumulation of organic matter, leading to the formation of agglomerates and the stabilization of soil pores thus accelerating the transport of water and solutes in the soil. In addition, the salinity and total soil nitrogen/phosphorus contribute to the species and community distributions. Soil water movement inhibits the loss of organic matter and facilitates the transport and accumulation of elements required for the growth of surface vegetation (Kan et al., 2019).
Soil water flow is a heterogeneous and unstable flow, and its developmental characteristics are more influenced by plant roots and soil properties (Mei et al., 2018). Considering roots and soil together will help in studying the hydrological processes in the soil. However, the shortcomings of the study include the inability to observe the effect of root configuration on hydrological connectivity and the lack of insight into the microstructure of soil pores. The relationship between root–soil composites and hydrological connectivity needs to be analyzed in three dimensions in conjunction with root morphology in the future.
A dye-tracing test was conducted on the riparian root–soil composites to visually assess the hydrological connectivity on a small scale riparian zone. According to the tested parameters of hydrological connectivity, the plot at high elevation in the riparian zone had greater degree of hydrological connectivity than the plot at low elevation. No significant correlation was observed between the index of hydrological connectivity and the physical properties of the soil at different depths. Dyeing area ratio and the maximum dyeing depth were influenced by the number of roots. The non-uniform coefficient of the penetration depth was significantly correlated with root number and root volume ratio. The soil hydrological connectivity was closely related to the plant roots with diameter less than 1 mm. The study provides a scientific basis for exploring hydrological connectivity and root–soil composites, which can support guidance for future riparian zone protection and restoration efforts in similar regions. Besides, soil microstructure should be considered in future studies.
The original contributions presented in the study are included in the article/supplementary material, further inquiries can be directed to the corresponding author.
CZ and QY designed the experiment and wrote the draft of the manuscript. RH, SY, and CZ carried out material preparation, data collection, and analysis. All authors contributed to the study conception, read, and approved the final manuscript.
This research was supported by the National Key Research and Development Plan (2022YFC3202601 and 2021YFC3200305), the CRSRI Open Research Program (CKWV20221006/KY), the Natural Science Foundation of China (51679009), and the Natural Science Foundation of Shanxi Province of China (20210302123105).
We wish to thank Xiaohui Feng, Xiaoyu Ma, and Qiang Zhang for technical support.
The authors declare that the research was conducted in the absence of any commercial or financial relationships that could be construed as a potential conflict of interest.
All claims expressed in this article are solely those of the authors and do not necessarily represent those of their affiliated organizations, or those of the publisher, the editors and the reviewers. Any product that may be evaluated in this article, or claim that may be made by its manufacturer, is not guaranteed or endorsed by the publisher.
Alaoui, A., Lipiec, J., and Gerke, H. H. (2011). A review of the changes in the soil pore system due to soil deformation: a hydrodynamic perspective. Soil Tillage Res. 115, 1–15. doi: 10.1016/j.still.2011.06.002
Ameli, A. A., and Creed, I. F. (2017). Quantifying hydrologic connectivity of wetlands to surface water systems. Hydrol. Earth Syst. Sci. 21, 1791–1808. doi: 10.5194/hess-21-1791-2017
Artza, I. L., and Wainwright, J. (2009). Hydrological connectivity: linking concepts with practical implications. Catena 79, 146–152. doi: 10.1016/j.catena.2009.07.001
Bracken, L. J., and Croke, J. (2007). The concept of hydrological connectivity and its contribution to understanding runoff-dominated geomorphic systems. Hydrol. Process. 21, 1749–1763. doi: 10.1002/HYP.6313
Cai, Y., and Feng, M. (2021). Study on the spatial and temporal distribution and influencing factors of soil nitrogen and phosphorus in riparian zones of Fenhe River. J. Soil Water Conserv. 35, 222–229, 236. doi: 10.13870/j.cnki.stbcxb.2021.04.031
Chelli, A., Zanini, A., Petrella, E., Feo, A., and Celico, F. (2018). A multidisciplinary procedure to evaluate and optimize the efficacy of hydraulic barriers in contaminated sites: a case study in northern Italy. Environ. Earth Sci. 19, 1253–1267. doi: 10.1007/s10040-011-0742-1
Dai, L., Zhang, Y., Liu, Y., Xie, L., Zhao, S., and Zhang, Z. (2020a). Thick roots and less microaggregates improve hydrological connectivity. Chemosphere 266:129008. doi: 10.1016/j.chemosphere.2020.129008
Dai, L., Zhang, Y., Liu, Y., Xie, L., Zhao, S., Zhang, Z., et al. (2020b). Assessing hydrological connectivity of wetlands by dye-tracing experiment. Ecol. Indic. 119:106840. doi: 10.1016/j.ecolind.2020.106840
Fischer, C., Ravenek, J., Tischer, J., Scheu, S., and Hildebrandt, A. (2015). Plant species diversity affects infiltration capacity in an experimental grassland through changes in soil properties. Plant Soil 397, 1–16. doi: 10.1007/s11104-014-2373-5
Jencso, G. K., McGlynn, L. B., Gooseff, N. M., Bencala, E. K., and Wondzell, M. S. (2010). Hillslope hydrologic connectivity controls riparian groundwater turnover: implications of catchment structure for riparian buffering and stream water sources. Water Resour. Res. 46:10524. doi: 10.1029/2009WR008818
Jiang, X. J., Chen, C., Zhu, X., Zakari, S., Singh, A. K., Zhang, W., et al. (2019). Use of dye infiltration experiments and HYDRUS-3D to interpret preferential flow in soil in a rubber-based agroforestry systems in Xishuangbanna, China. Catena 178, 120–131. doi: 10.1016/j.catena.2019.03.015
Kan, X., Cheng, J., Hu, X., Zhu, F., and Li, M. (2019). Effects of grass and forests and the infiltration amount on preferential flow in karst regions of China. Water 11:1634. doi: 10.3390/w11081634
Karim, F., Kinsey-Henderson, A., Wallace, J., Arthington, A. H., and Pearson, R. G. (2012). Modelling wetland connectivity during overbank flooding in a tropical floodplain in North Queensland, Australia. Hydrol. Process. 26, 2710–2723. doi: 10.1002/hyp.8364
Lane, S. N., Reaney, S. M., and Heathwaite, A. L. (2009). Representation of landscape hydrological connectivity using a topographically driven surface flow index. Water Resour. Res. 45, 2263–2289. doi: 10.1029/2008WR007336
Li, J., Wang, Y., Guo, Z., Li, J., Tian, C., Hua, D., et al. (2020). Effects of conservation tillage on soil physicochemical properties and crop yield in an arid loess plateau, China. Sci. Rep. 10:4716. doi: 10.1038/s41598-020-61650-7
Li, X., Yang, Z., Li, Y., and Lin, H. (2009). Connecting ecohydrology and hydropedology in desert shrubs: stemflow as a source of preferential flow in soils. Hydrol. Earth Syst. Sci. 13, 1133–1144. doi: 10.5194/hess-13-1133-2009
Liu, J., Engel, B. A., Wang, Y., Wu, Y., Zhang, Z., and Zhang, M. (2019). Runoff response to soil moisture and micro-topographic structure on the plot scale. Sci. Rep. 9:2532. doi: 10.1038/s41598-019-39409-6
Liu, J., Engel, B. A., Wang, Y., Zhang, G., Zhang, Z., and Zhang, M. (2020). Multi-scale analysis of hydrological connectivity and plant response in the Yellow River Delta. Sci. Total Environ. 702:134889. doi: 10.1016/j.scitotenv.2019.134889
Liu, Y., Guo, L., Huang, Z., López-Vicente, M., and Wu, G.-L. (2020). Root morphological characteristics and soil water infiltration capacity in semi-arid artificial grassland soils. Agric. Water Manag. 235:106153. doi: 10.1016/j.agwat.2020.106153
Mei, X., Zhu, Q., Ma, L., Zhang, D., Wang, Y., and Hao, W. (2018). Effect of stand origin and slope position on infiltration pattern and preferential flow on a loess hillslope. Land Degrad. Dev. 29, 1353–1365. doi: 10.1002/ldr.2928
Mooney, S. J., and Korošak, D. (2009). Using complex networks to model two-and three-dimensional soil porous architecture. Soil Sci. Soc. Am. J. 73, 1094–1100. doi: 10.2136/sssaj2008.0222
Morris, C., and Mooney, S. J. (2004). A high-resolution system for the quantification of preferential flow in undisturbed soil using observations of tracers. Geoderma 118, 133–143. doi: 10.1016/S0016-7061(03)00189-7
Nadeau, T. L., and Rains, M. C. (2007). Hydrological connectivity between headwater streams and downstream waters: how science can inform policy1. J. Am. Water Resour. Assoc. 43, 118–133. doi: 10.1111/j.1752-1688.2007.00010.x
Ocampo, C. J., Sivapalan, M., and Oldham, C. (2006). Hydrological connectivity of upland-riparian zones in agricultural catchments: implications for runoff generation and nitrate transport. J. Hydrol. 331, 643–658. doi: 10.1016/j.jhydrol.2006.06.010
Rosier, C. L., Levia, D. F., Stan, J. T. V., Aufdenkampe, A., and Kan, J. (2016). Seasonal dynamics of the soil microbial community structure within the proximal area of tree boles: possible influence of stemflow. Eur. J. Soil Biol. 73, 108–118. doi: 10.1016/j.ejsobi.2016.02.003
Schwarz, M., Lehmann, P., and Or, D. (2010). Quantifying lateral root reinforcement in steep slopes–from a bundle of roots to tree stands. Earth Surf. Process. Landf. 35, 354–367. doi: 10.1002/esp.1927
Tobella, A. B., Reese, H., Almaw, A., Bayala, J., Malmer, A., Laudon, H., et al. (2014). The effect of trees on preferential flow and soil infiltrability in an agroforestry parkland in semiarid Burkina Faso. Water Resour. Res. 50, 3342–3354. doi: 10.1002/2013WR015197
Vannote, R. L., Wayne, M. G., Cummins, K. W., Sedell, J. R., and Cushing, C. E. (1980). The river continuum concept. Can. J. Fish. Aquat. Sci. 37, 130–137. doi: 10.1139/f80-017
Weiler, M., and Flühler, H. (2003). Inferring flow types from dye patterns in macroporous soils. Geoderma 120, 137–153. doi: 10.1016/j.geoderma.2003.08.014
Yarrow, M. M., and Marín, V. H. (2007). Toward conceptual cohesiveness: a historical analysis of the theory and utility of ecological boundaries and transition zones. Ecosystems 10, 462–476. doi: 10.1007/s10021-007-9036-9
You, L., Li, H., and Yan, J. (2013). Study on multiple regression model of karst groundwater level in Lancun Spring area. Ground water 35, 36–38.
Zhang, Y., Chen, J., Zhang, J., Zhang, Z., and Zhang, M. (2021). Novel indicator for assessing wetland degradation based on the index of hydrological connectivity and its correlation with the root–soil interface. Ecol. Indic. 133:108392. doi: 10.1016/j.ecolind.2021.108392
Zhang, K., Lu, K., Li, P., Li, Z., Shi, P., and Yang, S. (2020). Trend of runoff and sediment change and its driving factors in the middle and upper reaches of Fenhe River in the past 60 years. J. Soil Water Conserv. 27, 57–59. doi: 10.13869/j.cnki.rswc.2020.04.007
Zhang, W., Wang, L., Tang, Z., and Zhang, Y. (2022). Effects of the root system architecture of Pinus taeda and Phyllostachys edulis on the index of hydrological connectivity in subtropical forest ecosystems. Forests 13:2008. doi: 10.3390/f13122008
Zhang, Y., Jiang, J., Zhang, J., Zhang, Z., and Zhang, M. (2022). Effects of roots systems on hydrological connectivity below the soil surface in the Yellow River Delta wetland. Ecohydrology 15:e2393. doi: 10.1002/eco.2393
Zhang, Y., Zhang, Z., Ma, Z., Chen, J., Akbar, J., Zhang, S., et al. (2018). A review of preferential water flow in soil science. Can. J. Soil Sci. 98, 604–618. doi: 10.1139/cjss-2018-0046
Keywords: hydrological connectivity, dye-tracer technology, riparian zone, root–soil composite, soil water flow
Citation: Yang Q, Zhang C, Liu X, Yao S and Huang R (2023) Assessment of hydrological connectivity characteristics of riparian zones and their correlation with root–soil composites at different bank heights of a first-class river in China. Front. Ecol. Evol. 11:1205697. doi: 10.3389/fevo.2023.1205697
Edited by:
Junhong Bai, Beijing Normal University, ChinaReviewed by:
Yuanchun Zou, Chinese Academy of Sciences, ChinaCopyright © 2023 Yang, Zhang, Liu, Yao and Huang. This is an open-access article distributed under the terms of the Creative Commons Attribution License (CC BY). The use, distribution or reproduction in other forums is permitted, provided the original author(s) and the copyright owner(s) are credited and that the original publication in this journal is cited, in accordance with accepted academic practice. No use, distribution or reproduction is permitted which does not comply with these terms.
*Correspondence: Chaobo Zhang, emhhbmdjaGFvYm9AdHl1dC5lZHUuY24=
Disclaimer: All claims expressed in this article are solely those of the authors and do not necessarily represent those of their affiliated organizations, or those of the publisher, the editors and the reviewers. Any product that may be evaluated in this article or claim that may be made by its manufacturer is not guaranteed or endorsed by the publisher.
Research integrity at Frontiers
Learn more about the work of our research integrity team to safeguard the quality of each article we publish.