- 1Chongqing Geomatics and Remote Sensing Center, Chongqing, China
- 2Key Laboratory of Monitoring, Evaluation and Early Warning of Territorial Spatial Planning Implementation, Ministry of Natural Resources, Chongqing, China
- 3School of Public Health, Chongqing Medical University, Chongqing, China
- 4Chongqing Zishui Middle School, Chongqing, China
Floating object pollution in the Three Gorges Reservoir area (TGRA) is a serious environmental problem. It directly harms the safety of the reservoirs. Currently, relevant research has only focused on certain aspects, such as the salvage and treatment of floating objects, and little has been done on the underlying causes of floating object. The way humans use land will have a large influence on floating object in rivers, but the relationship between the two still needs to be further explored. We used remote sensing images to obtain the distribution of floating objects in the Chongqing section of the TGRA, and combined that with current land use data to study the relationship between land use and river floating objects. We found that: ① The number of floating object spots in the main stream of the Yangtze River gradually increased from the upper reaches (the main urban section of Chongqing) to the lower reaches (northeast section of Chongqing), while the opposite was true in the tributaries of the Yangtze River. ② Under different buffer scales, urban, rural residential, farmland, gardenland, grassland and other land use types were positively correlated with the number of floating debris spots in the river, and the correlation order was rural residential > farm land > urban> gardenland > grassland > forest. ③ When the buffer radius was 1.5 km, the land use comprehensive intensity index (LUI) had the highest interpretation degree to the number of floating debris spots, with a rate of 68.8%. In terms of land use types, rural settlements and cultivated land have a greater impact on river floaters, while woodland and grassland have a lesser impact on river floaters. We suggested that the construction of rural residential areas and cultivated land should be avoided as far as possible in the territorial space planning within 1.5 kilometers on both sides of the river, and ecological modification should be carried out by returning cultivated land to forest and grassland.
Highlights
– There are spatial differences in floating objects in the Chongqing Yangtze River.
– Floating object effects are rural residential > farm land > urban > garden.
– The correlation between land use and floating objects is affected by buffer scale.
1. Introduction
The Three Gorges Hydropower Station is the largest in the world and makes up a special area, called the TGRA. The TGRA refers to the area where the Three Gorges Dam is impounded to 175 m and is inundated when the water level rises (Liu et al., 2022; Liu Yansui, 2022). It begins in Jiangjin, Chongqing in the west and reaches Yichang, Hubei in the east, involving 20 districts and counties with a total area of about 58,000 square kilometers and a water area of 1,084 square kilometers (Chen and Xiao, 2017; Bao et al., 2021). After the completion of the Three Gorges Project, the speed, amplitude, and frequency of water level fluctuations in the TGRA were artificially regulated and were very different from the original river’s hydrological characteristics. It has also produced a series of environmental problems, one of which is floating objects (Zhang et al., 2020). Floating objects in the TGRA affect the operation of the hub, flood discharge, power generation, shipping, water quality, and the environment. Large uncontrolled floating objects also threaten the safe operation of the hub of the Three Gorges Dam (Chen and Xiao, 2017; Cao et al., 2020). The treatment of floating debris in the TGRA has always been a serious environmental problem. There are three main sources of floating debris in the TGRA: (1) garbage that flows into the Yangtze River from cities and towns along the river (garbage dumps are generally located on the slopes leading to the river so that garbage continuously slides down into the river, forming garbage belts); (2) straw and firewood from fields washed into the river by the rain during the flood season; (3) garbage dumped into the river by passing ships. Thus, the components of floating debris in the TGRA mainly include plant residue, woody debris, and plastic debris (Yuan, 1998).
Currently, research related to floating objects mainly includes the aspects outlined below. First, techniques such as image recognition and deep learning are used to carry out target recognition of floating objects (Kim et al., 2018; Akiyama TS, 2020;Manickam et al., 2020). Second, research is conducted on the treatment of floating objects (Domingos et al., 2017; Kwangjin et al., 2018). Third, the impacts of floating object on river water quality are studied (St-Hilaire et al., 2016; Zhang et al., 2020). However, few studies have focused on the causes of floating object and the relationship with land use. Similar studies have focused on the effects of land use methods on river water quality (Nobre et al., 2020; Shehab et al., 2021; Zhu et al., 2023). We believe that the generation of floating object is closely related to human activity, and how land is used will have a strong influence on floating object.
Taking the Chongqing section of the TGRA as the study area, the effects of land use on floating object in rivers at different spatial scales were studied. The Chongqing section includes cities, suburbs, villages, forests, arable land, etc. The types of land use are comprehensive and diverse, which is very conducive to the development of research (Yao et al., 2022; Wang Zhaolin et al., 2023). We attempt to study the relationship between land use types, the land use comprehensive intensity index (LUI) and river floating debris in the upper reaches of the Yangtze River. Factors influencing floating object in the Chongqing section were further explored, which can provide reference for floating object treatment work in the study area, as well as reference for territorial spatial planning and ecological protection.
2. Materials and methods
2.1. Study area
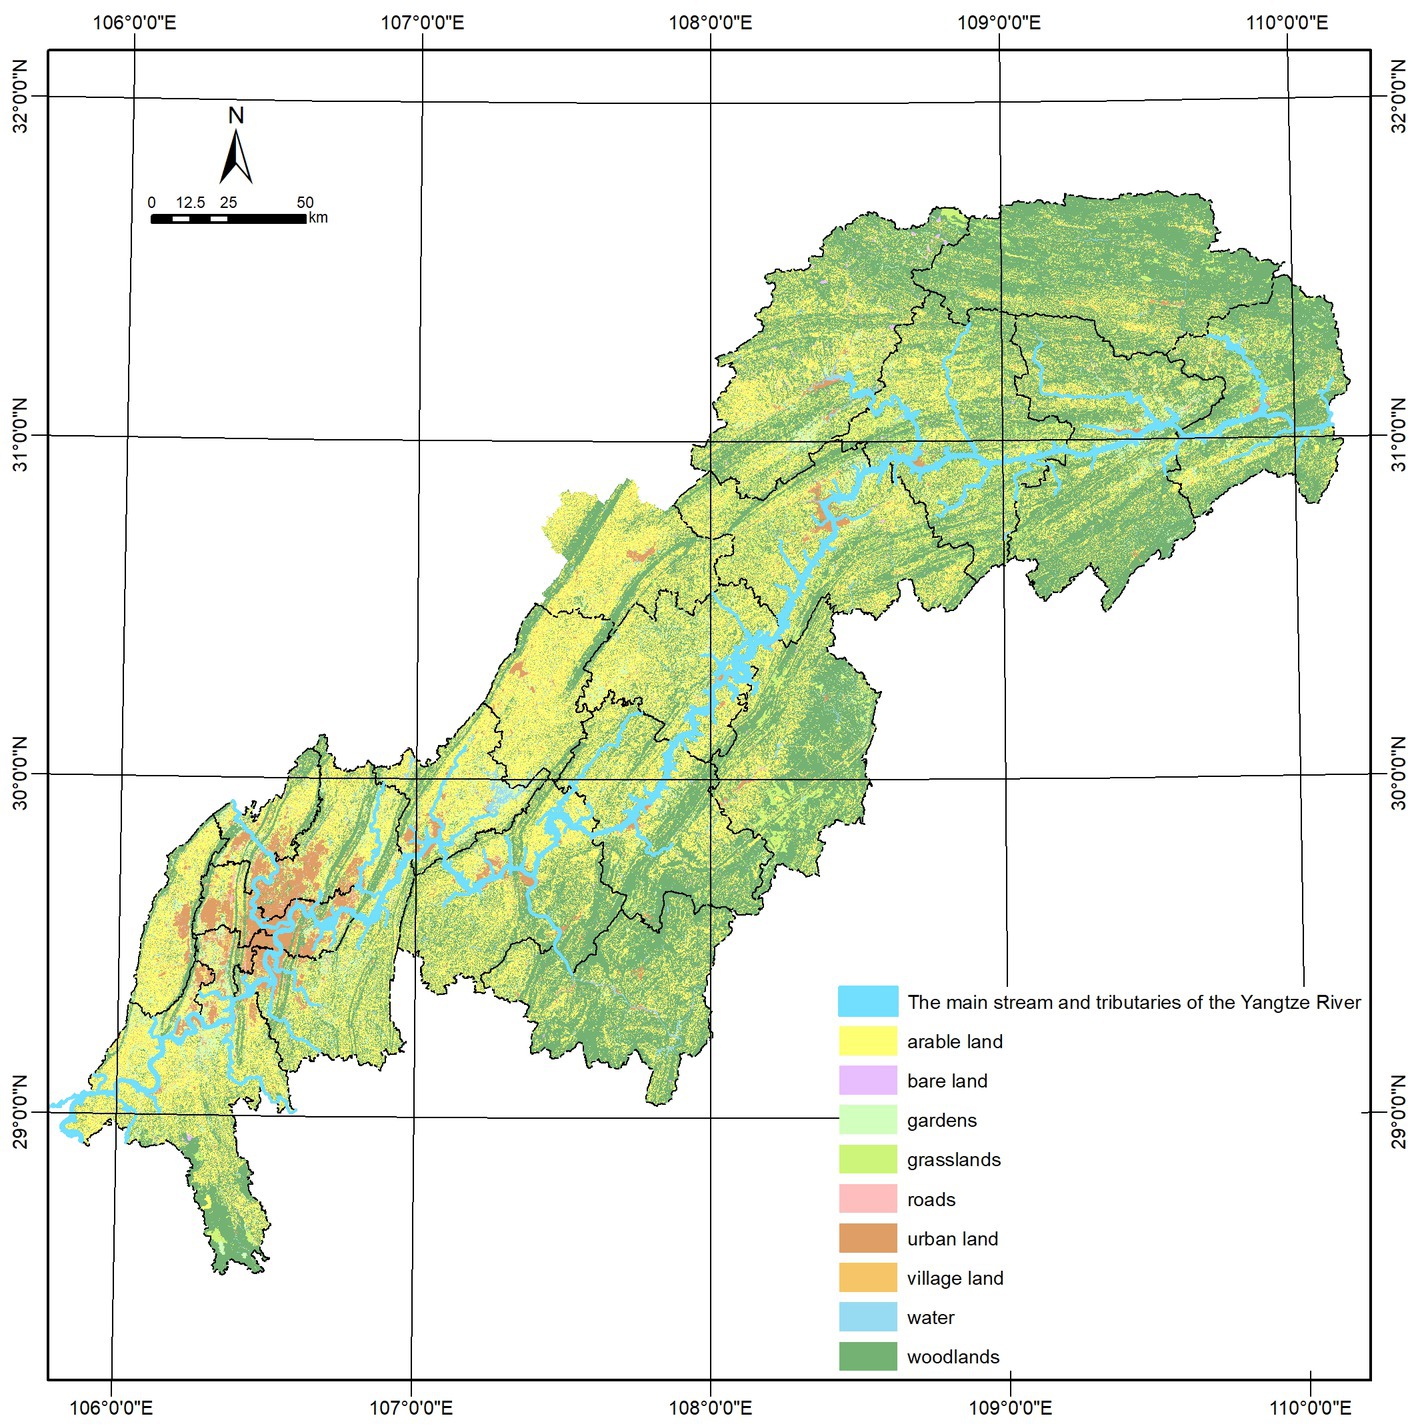
The location of this study is the Chongqing section of the TGRA (Figure 1), which is in the upper reaches of the Yangtze River. It spans three major economic regions and extends from Jiangjin in the west, Wushan in the east, Wulong in the south, and Kaizhou in the north. The urban economically developed area and the ecological economic zone of China’s TGRA are geographically between 28°28′ ~ 31°44′N latitude and 105°49′ ~ 110°12′ E longitude, covering 85.6% of the entire TGRA (Liu et al., 2022; Liu Yansui, 2022). Landforms in this area are dominated by mountains and hills.
2.2. Data sources
Three main data sources were used in the study: ① Vector layer data of floating object spots in the Chongqing section of the TGRA from June to August 2021, extracted through drone remote sensing image recognition by Chongqing Geomatics and Remote Sensing Center, with an overall accuracy of 96%. ② 2021 land use status data in Chongqing from the results of a survey on current land use. The survey of land use status in Chongqing is a project organized by Chongqing Bureau of Planning and Natural Resources. The accuracy of remote sensing image used in the project is better than 1 m. ③ 2020 building data obtained through remote sensing image interpretation and processing by Chongqing Geomatics and Remote Sensing Center, with an overall accuracy of 90%.
2.3. Methods
2.3.1. Floating object spot recognition
Using drone remote sensing images from June to August 2021, the band threshold was set to 65 to extract preliminary identification results for floating objects. The band threshold used for floating object identification was 65, which was obtained through multiple comparison test analysis. Then, the machine learning method was used to eliminate misidentified ground objects in the preliminary recognition results, including bridges, ships, islands, etc. Manual visual inspection was used to verify the individual floating object recognition results. Finally, the spatial distribution results for floating object in the Chongqing section of the TGRA were obtained, with an overall accuracy of 96% (Supplementary Table S1).
2.3.2. Redundancy analysis
The ability to explain the effects of land use on floating object in rivers was studied using a redundancy analysis (RDA) model. The significance of the RDA analysis results was tested using the Monte Carlo method (500 random samples). RDA and canonical correspondence analysis (CCA) can be, respectively, used for gradient sorting calculations according to different linear or unimodal situations. Generally, de-trend correspondence analysis (DCA) is used to identify the maximum gradient value in four axes before gradient sorting. A shorter gradient (≤3) reflects better linear fit, so the RDA linear model method is more suitable for sorting (Gao et al., 2022). If the gradient is longer (≥4), the single-peak model fits better, and the CCA single-peak model is more appropriate. If the gradient is between 3 and 4, both methods are applicable (Jan and Petr, 2003). RDA is calculated as follows:
In the formula, and are two sets of standardized variables X and Y extracted components, respectively. The ecological analysis software Canoce (version 5) was used to analyze the relationship between floating object and land use. The correlation between the two in the ranking diagram of RDA analysis is expressed by the cosine value of the included angle of the arrow. A higher cosine value reflected a strong correlation. A smaller cosine value reflected a weak correlation. A longer arrow line reflected a greater extent to which the type of land use affects floating object in the river. A shorter arrow line reflected less influence of land use on floating object.
2.3.3. Land use intensity composite index model
The land-use intensity composite index model was used to measure the extent to which human activity interfered with land use patterns. Referring to relevant studies, method improvements (Zhuang and Liu, 1997; Brown and Vivas, 2005; Chen and Lin, 2013; Chen et al., 2015; Ge and Yue, 2016) were also made based on the actual situation in this study. According to the characteristics of different land use types, land use intensity was divided into four levels: other land use levels (corresponding to bare land), forest grass water use grade (corresponding to forest, grassland and water), agricultural land grade (corresponding to farmland, gardenland, grassland), and construction land (corresponding to towns, villages, industrial mines and transportation land). The intensity rating index was set to 1, 2, 3, 4 in that order. Considering that the development intensity of different construction sites varied greatly, further segmentation needed to be carried out to be more in line with objective reality. To this end, three levels of construction land were further refined based on the actual floor area ratio of construction land. When the floor area ratio was ≤1, the strength grading index was set to 4, 1 < floor area ratio ≤ 3, the strength rating index was set to 5, and when the floor area ratio was >3, the strength rating index was set to 6. Therefore, in this study, the land use intensity grading index was set to 1, 2, 3, 4, 5, and 6 in that order. Because there may be a variety of land use patterns in the region, the land use intensity composite index was used to reflect its magnitude, which is calculated as follows:
In the formula: LUI is a composite index of land use intensity in the sample area. Ai is a grade i land use intensity grading index. Si is the Class i land use area. S is the total land use area. n is the grading number of land use intensity.
3. Results
3.1. Current status of the spatial distribution of floating object
From June to August 2021, 3,663 floating object spots were identified in the Chongqing section of the TGRA (Figure 2). The number of floating object spots in the main stream of the Yangtze River gradually increased from the upper reaches (Chongqing’s main city section) to the lower reaches (northeast section of Chongqing). The number of floating spots in the lower reaches of the Yangtze River (northeast section of Chongqing) was about 1.89 times that of the upper reaches of the Yangtze River (Chongqing’s main urban section). The opposite was true in the Yangtze River tributaries. The number of tributary floating spots in the upper reaches of the Yangtze River (Chongqing’s main urban section) was high, while the number of tributary floating spots in the lower reaches of the Yangtze River (northeast section of Chongqing) was about 2.82 times that of tributaries in the lower reaches. Of the tributaries in Chongqing, the Changshou Taohua River had the largest number of floating debris spots. Most of the area that Taohua Creek flows through is urban and farmland. It is relatively densely populated, and human activity frequently produces a lot of garbage. There were many floating debris spots in the river due to a lack of good management.
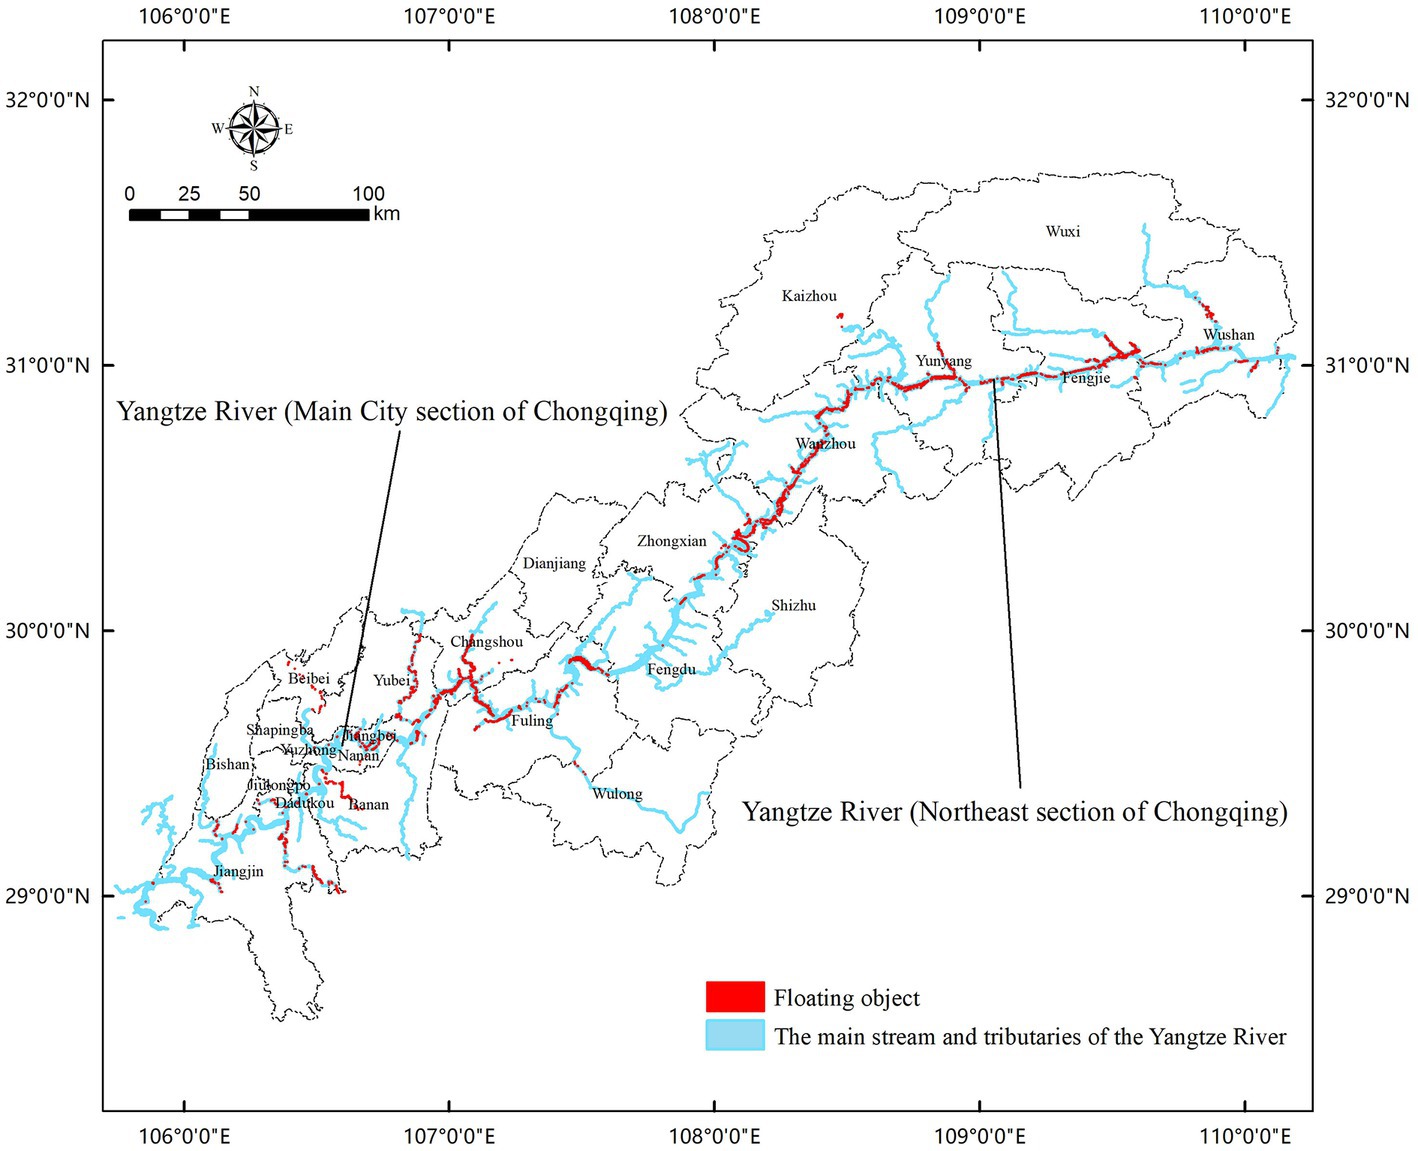
Figure 2. Spatial distribution of floating objects in the Chongqing section of the Three Gorges Reservoir area.
3.2. Composition of land use types at different spatial scales
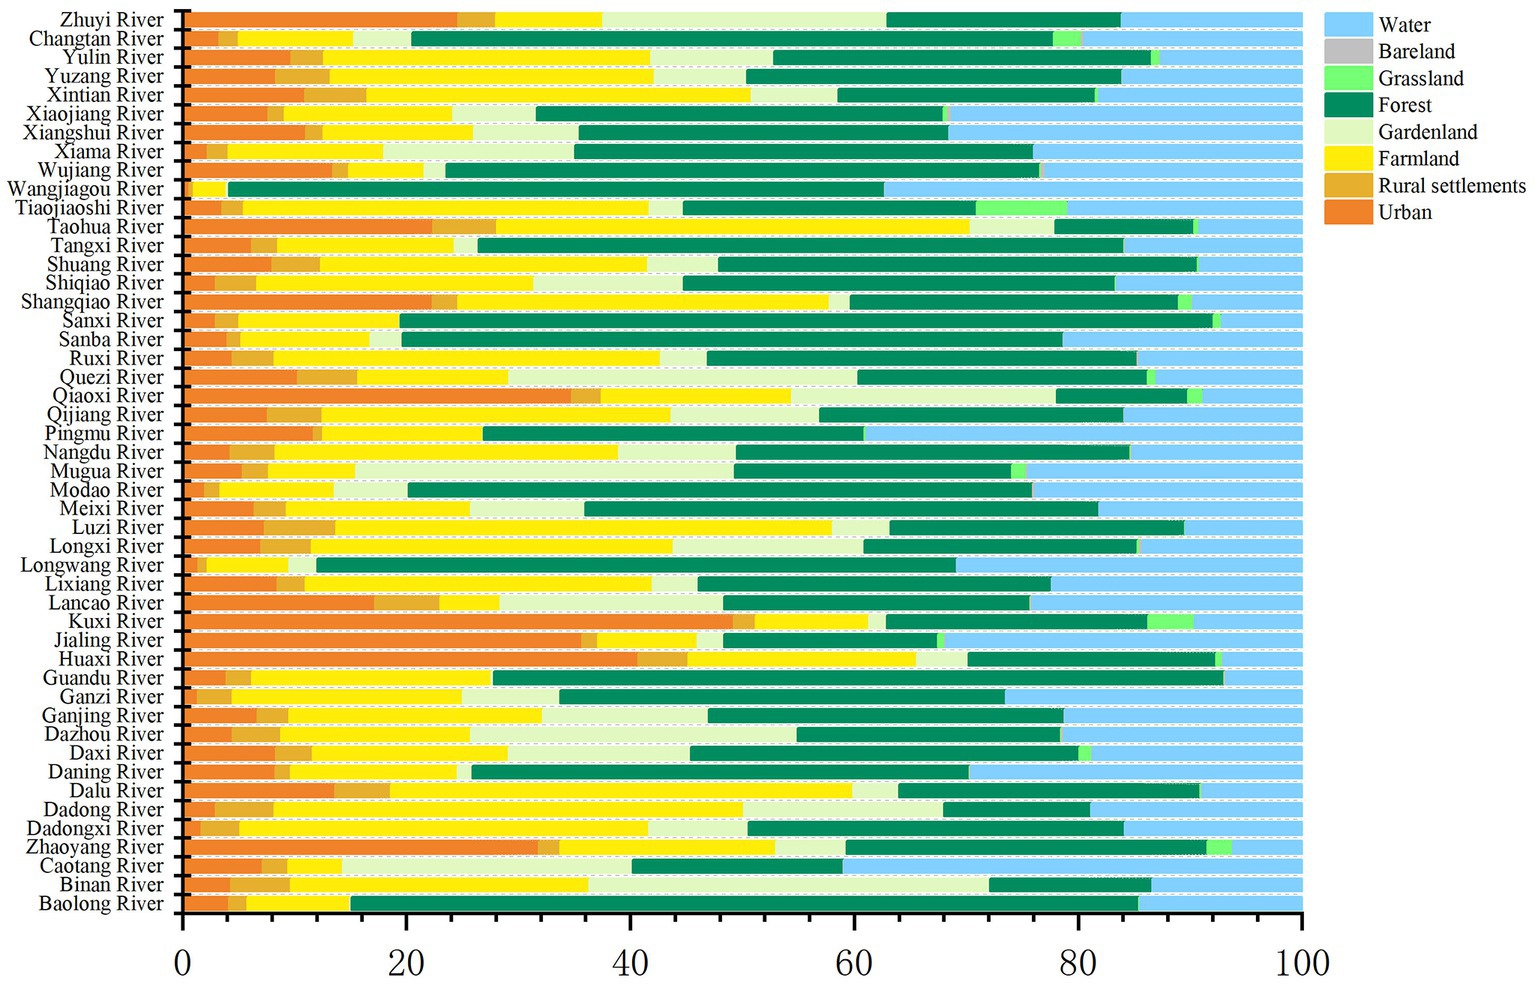
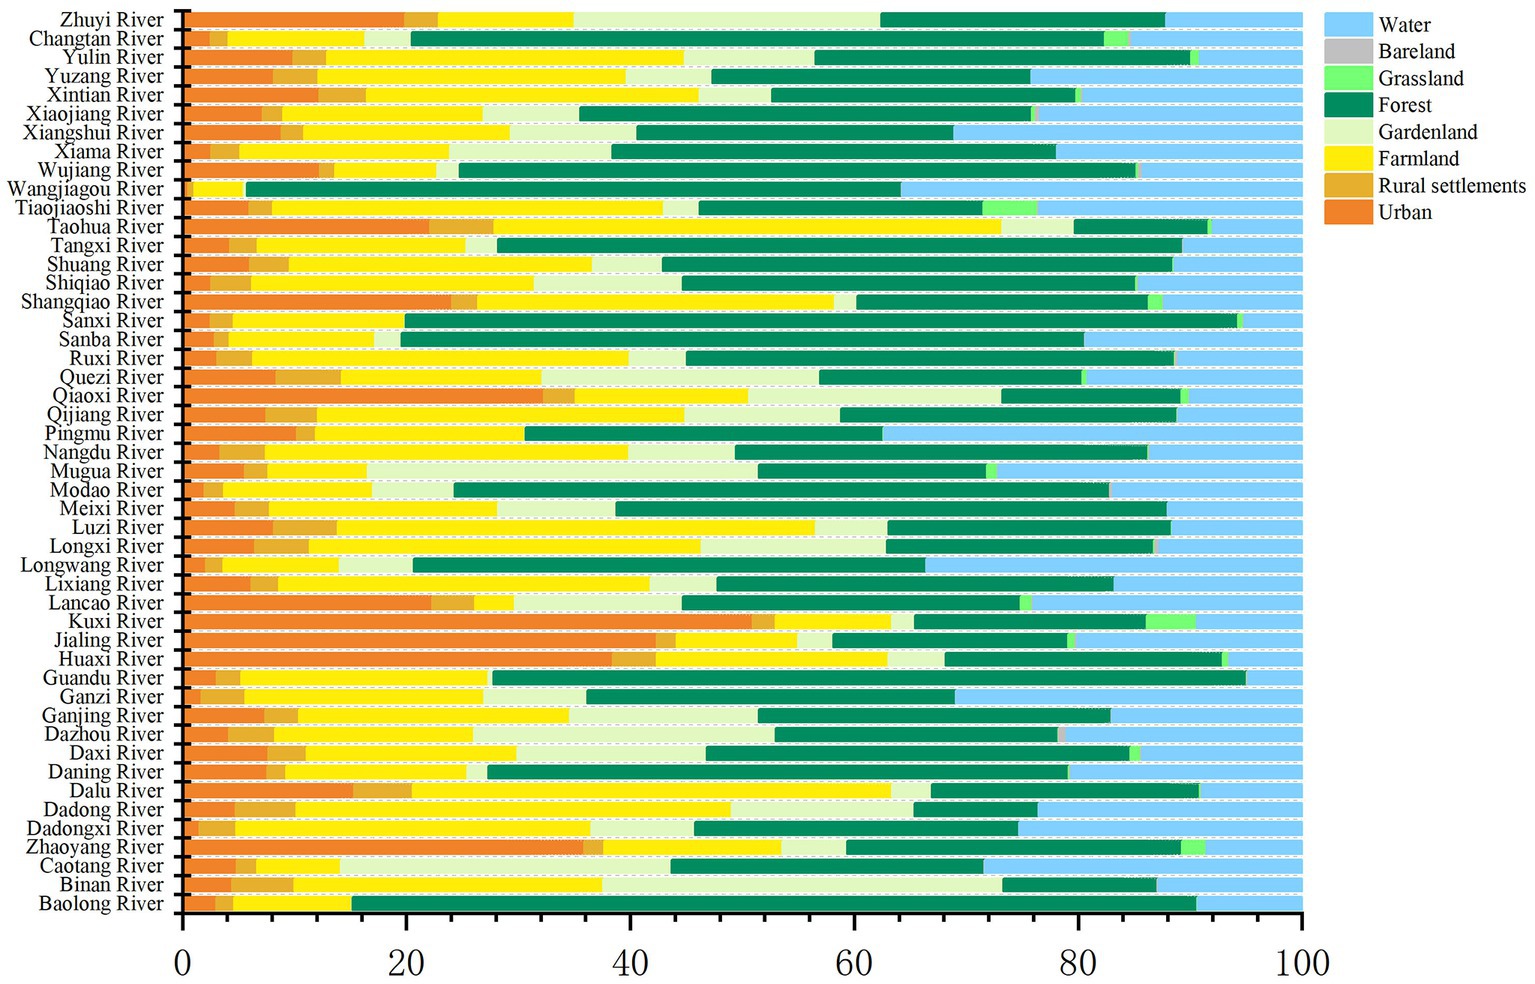
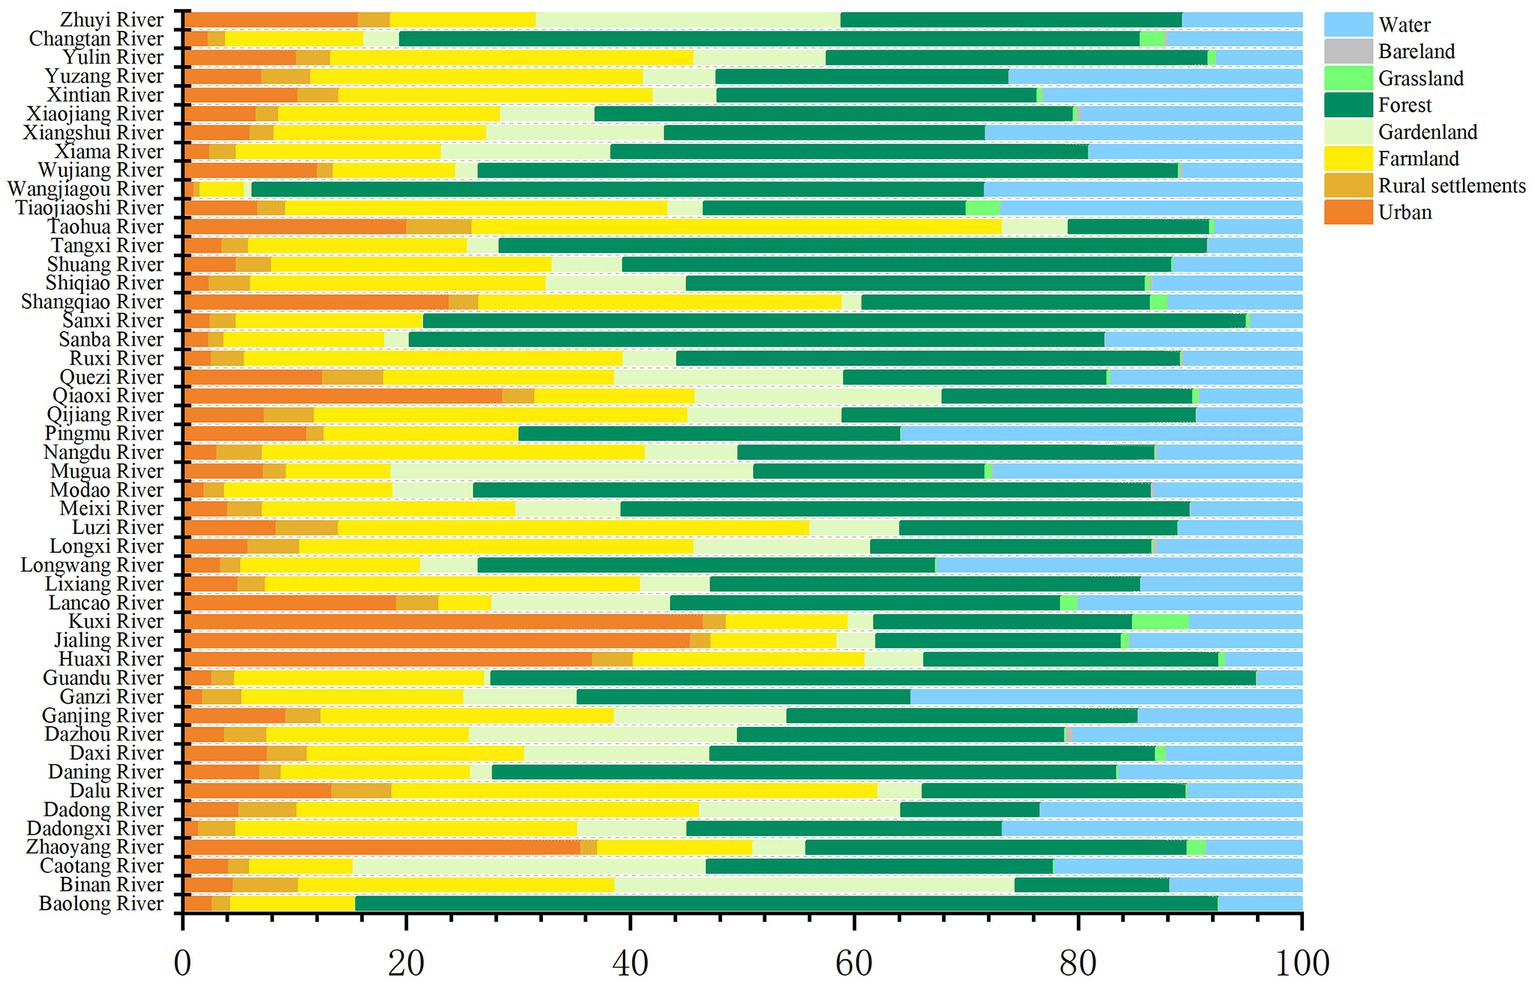
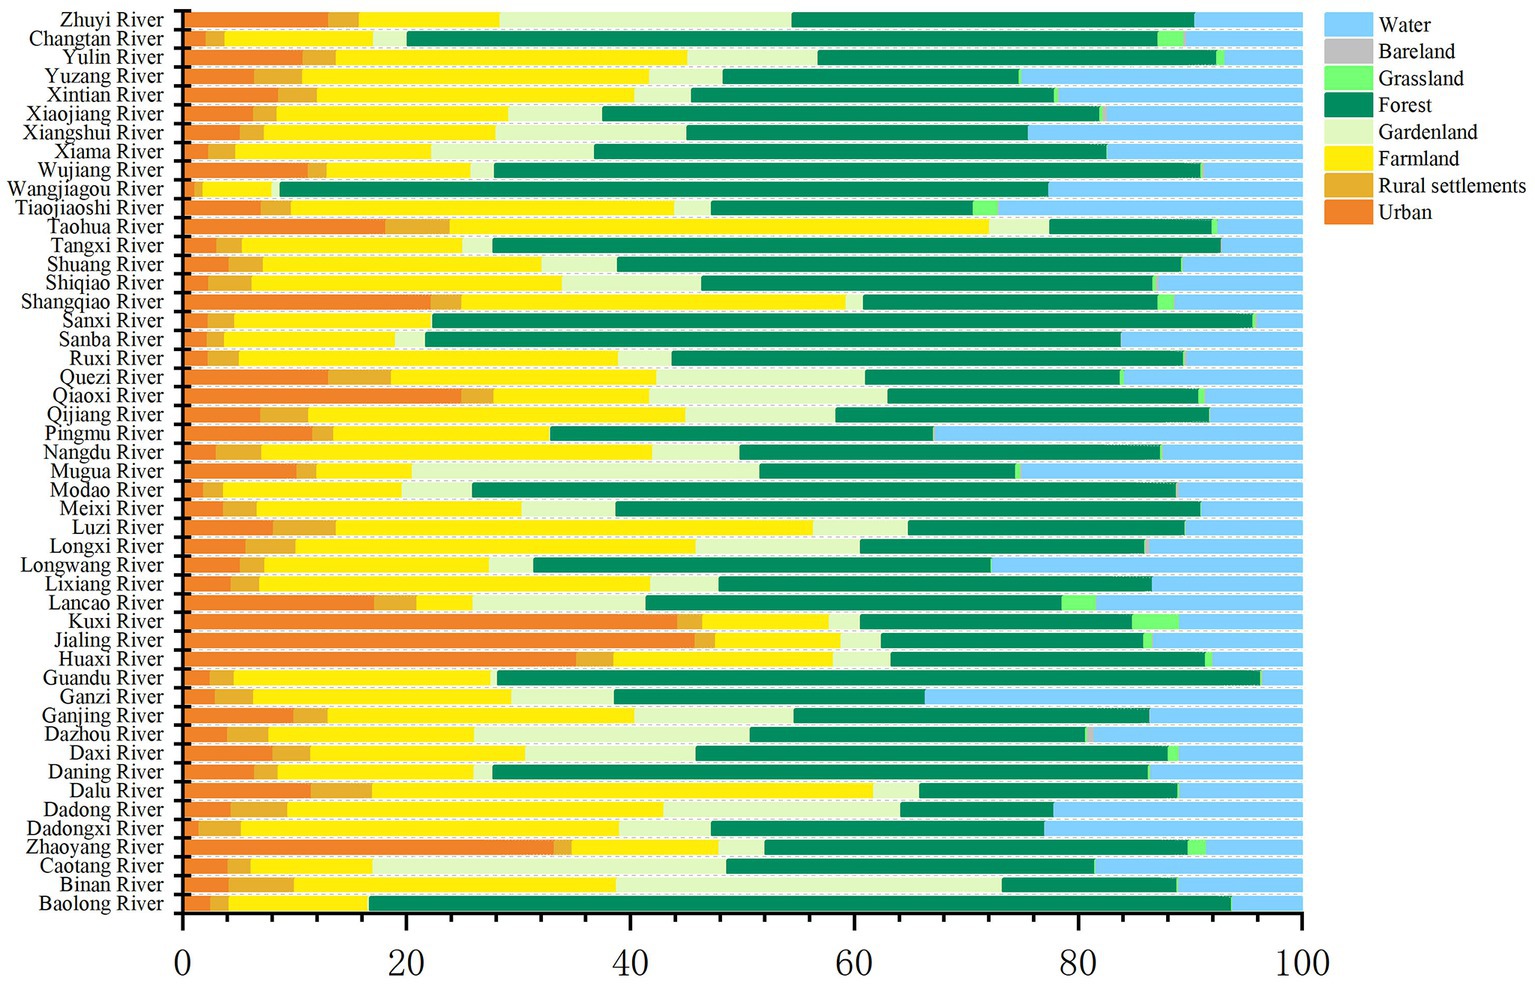
Prior studies have shown that the most significant interactions between land use and a river occur between 100 m and 2 km along the river bank (Duan et al., 2017; Xu et al., 2017; Xiang et al., 2018). Therefore, the buffer radii for rivers in this study were 0.5 km, 1 km, 1.5 km, and 2 km, respectively. Using ArcGIS10.3, four buffer radii were applied to the Yangtze River tributaries in Chongqing: 0.5 km, 1 km, 1.5 km, and 2 km, respectively. The four buffer ranges and land use data were then superimposed and analyzed separately, and land use data within the four buffer ranges was obtained. Then, the field fusion tool was used to fuse the land types of different tributaries and ensure that only one record of the same land type was within the buffer range of each tributary. Finally, the attribute table records were exported to excel for statistical analysis, and land use type composition maps of different tributaries at different spatial scales were obtained (Figures 3–6). As the chart shows, the land use type percentages within the different buffer radii of each tributary were quite similar. The average percentages of forest, farmland, gardenland, and urban land were relatively high, accounting for more than 75% of the total. The percentage of forest land was the highest and it gradually increased as the buffer radius increased. When the buffer radius was 0.5 km (Figure 3), the average percentage was 35%, and when the buffer radius was 2 km (Figure 6), it was 39%. The average percentage of farmland is 22%, and as the buffer radius increased it also increased. The average percentage of gardenland was 10%. As the buffer radius increased it first increased and then decreased. When the buffer radius was 1 km (Figure 4), the percentage was greatest. Urban land accounted for an average of 10%, and its percentage slowly decreased as the buffer radius increased.
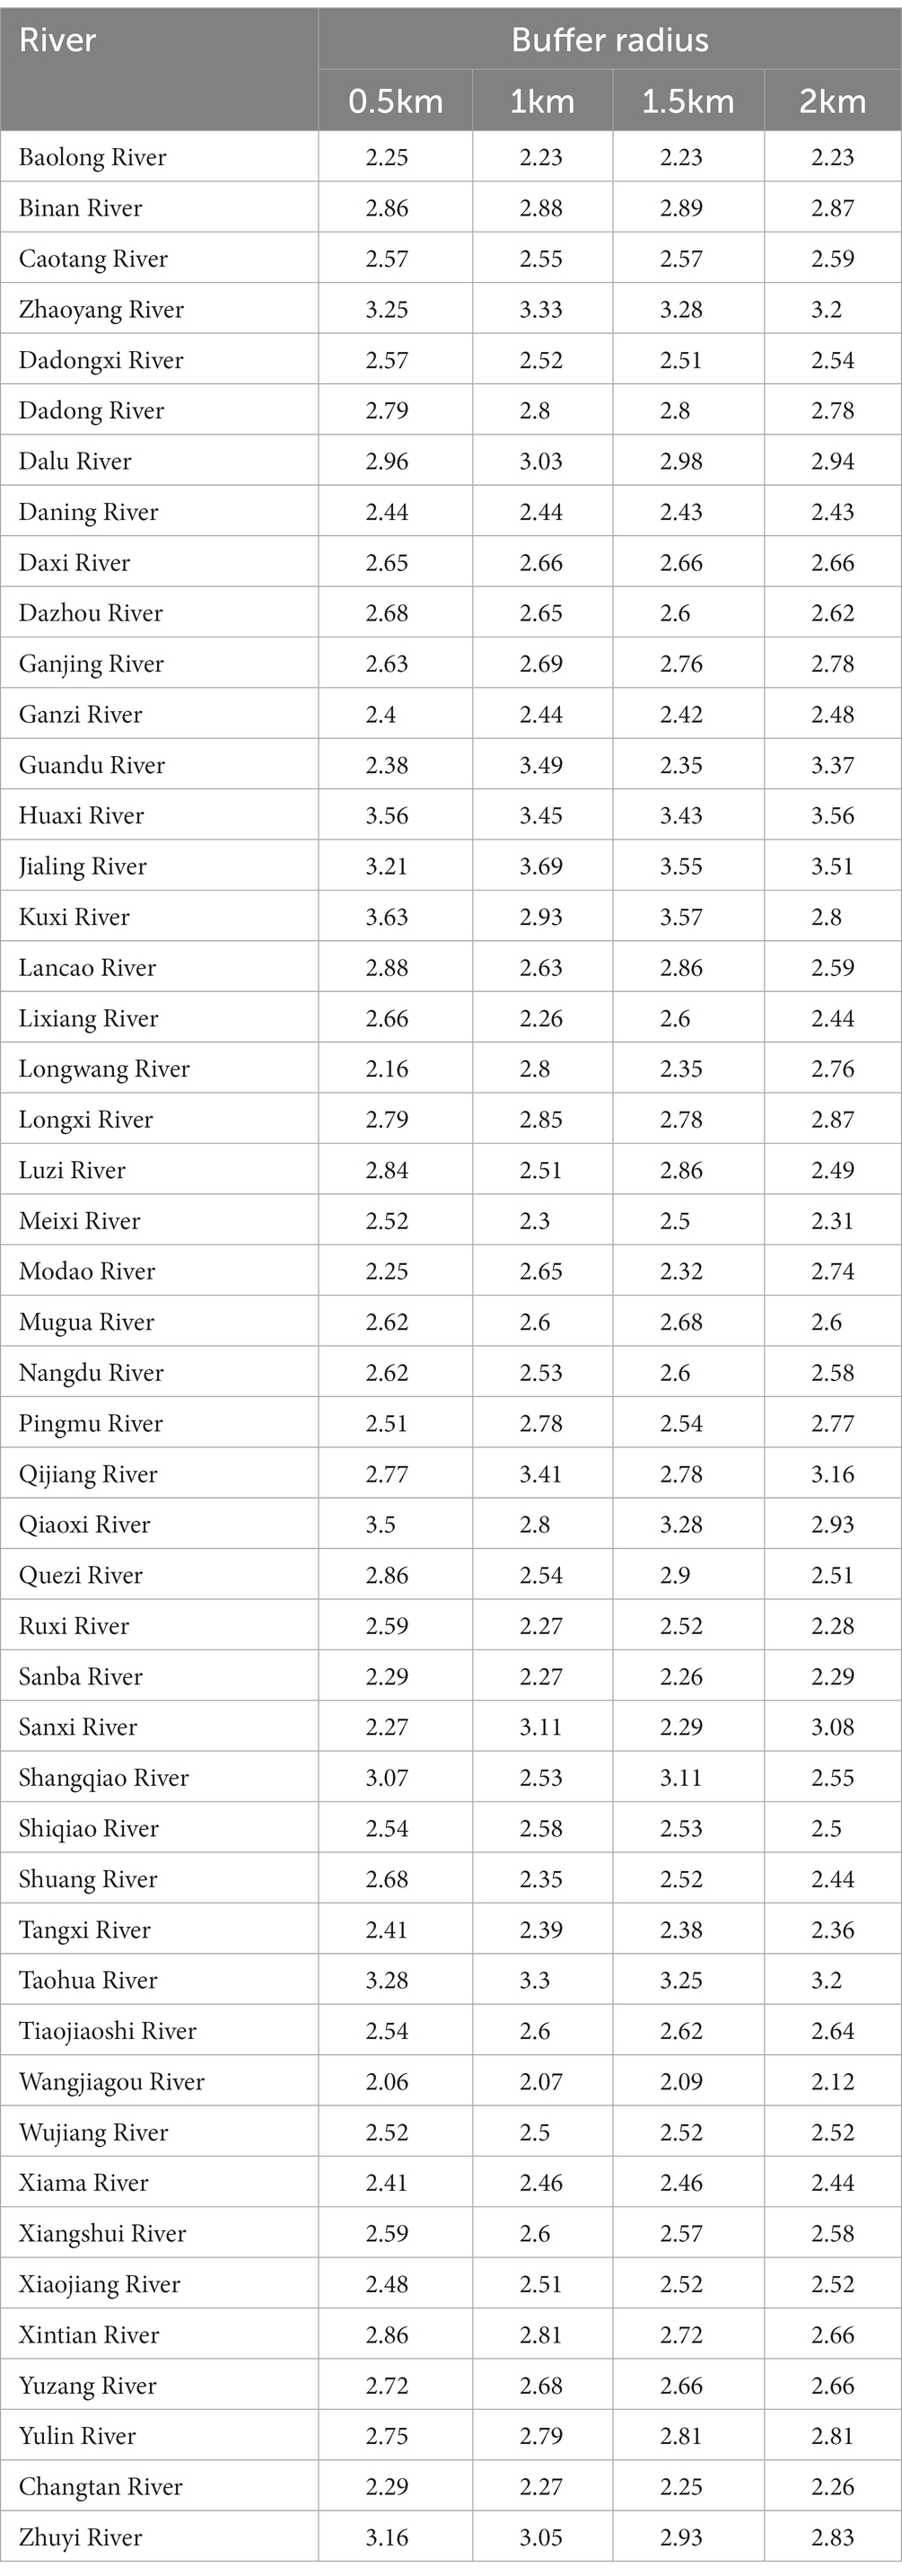
3.3. Land use intensity at different spatial scales
Land use type describes the composition and spatial structure of the land, while land use intensity measures the degree of land transformation. The focus of the two is not the same. Using the optimized land use intensity model, the LUI of each tributary at different buffer scales was calculated (Table 1). As the buffer radius increased, LUI first increased and then decreased. When the buffer radius was 1 km, LUI was highest, with an average value of 2.7. Overall, from the main urban section of Chongqing to northeastern Chongqing, LUI gradually decreased. The average LUI within the buffer range of the Kuxi River, located in the main urban area of Chongqing, was the highest. LUI values within the buffer radius of 0.5 km, 1 km, 1.5 km, and 2 km were 3.63, 2.93, 3.57, and 2.8, respectively. The average LUI within the Wangjiagou buffer range in Kaizhou was the lowest. LUI values within the four buffer radii of 0.5 km, 1 km, 1.5 km, and 2 km were 2.06, 2.07, 2.09, and 2.12, respectively.
4. Discussion
4.1. Analysis of the causes of floating object distribution
The upper reaches of the Yangtze River (the main urban section of Chongqing) had a small number of floating object spots in the main stream and a large number of floating debris spots in the tributaries (Figure 2). The upper reaches (Chongqing’s main urban section) are economically developed. Most of its tributaries flow through towns, rural settlements, farmland, and other areas with relatively high population density. For example, urban, rural settlements, and farmland within a 1 km buffer radius of Taohua Creek account for more than 72%. The total share of towns, rural settlements, farmland, etc. within the 1 km buffer radius of the Huaxi River was greater than 63%. The total share of urban, rural settlements, farmland, etc. within the 1 km buffer radius of the Chaoyang River was greater than 52%. Cheng Jinhai and others believe that human production and life are the main source of floating object (Bao et al., 2013; Cai et al., 2020; Cheng et al., 2022). Land types such as urban, rural settlements, and farmland within the buffer range of rivers were more likely to generate garbage, and a lack of management measures resulted in floating object in rivers. The small number of floating objects in the main stream of the Yangtze River was because the floating objects routinely migrated to the lower reaches (northeast section of Chongqing) with the current. As a result, there were a large number of floating object spots in the main stream (northeast section of Chongqing). At the same time, we found that there was little data on floating object spots in the tributaries of the lower reaches (northeast section of Chongqing). The lower reaches had relatively low economic development, the population density was low, and most tributaries flowed through woodland with little human activity. For example, the percentage of forest land within the 1 km buffer range of Sanxi River was 74%, that of Tangxi River was 61%, and that of Modaoxi River was 59%.
4.2. Effects of land use types on floating object at different spatial scales
Using Origin (2022 edition) software, the correlation between land use types and the number of floating debris spots in river buffering ranges at different scales were analyzed separately (Figures 7–10). The analysis found that under different buffer scales, urban, rural residential, farmland, gardenland, grassland and other land types all were positively correlated with the number of floating debris spots. The analysis results were similar to those of Xia Huijuan et al. (Li et al., 2021; Wang et al., 2021; Xia et al., 2021) Rural settlements, farmland, and the number of floating debris spots had strong positive correlations. Weak positive correlations were found with urban, gardenland, and grasslands. The correlations between forest, bare land, water, etc. and the number of floating debris spots in rivers were not obvious. The correlation sizes for each type of land used with the number of floating debris spots were ranked as rural settlements > farmland > urban > gardenland > grassland > forest. As the buffer radius increased, the correlations between rural settlements, farmland and the number of floating debris spots increased markedly. Research by Li Ruxia and others found that farmland has a great influence on river water quality, with a spatial scale effect (Ding et al., 2016; Li Ruxia et al., 2023). The results of this study further revealed that land use methods such as farmland not only affected water quality, but also had a strong impact on floating object in rivers. This was confirmed by previous research results (Giri and Qiu, 2016; Zhang et al., 2018; Duffy et al., 2020). When the buffer radius was 0.5 km, 1 km, 1.5 km, and 2 km respectively, the correlation coefficients between rural settlements and the number of floating objects were 0.51, 0.51, 0.52, and 0.52, respectively, and the correlation coefficients between farmland and the number of floating objects were 0.49, 0.49, 0.5, and 0.51, respectively. As the buffer radius increased the correlations of the number of floating objects in urban, gardens and rivers decreased significantly. When the buffer radius was 0.5 km, 1 km, 1.5 km, and 2 km, respectively, correlations between urban land and the number of floating objects were 0.26, 0.24, 0.21, 0.2, and correlations between garden land and the number of floating objects were 0.19, 0.16, 0.15, and 0.14, respectively.
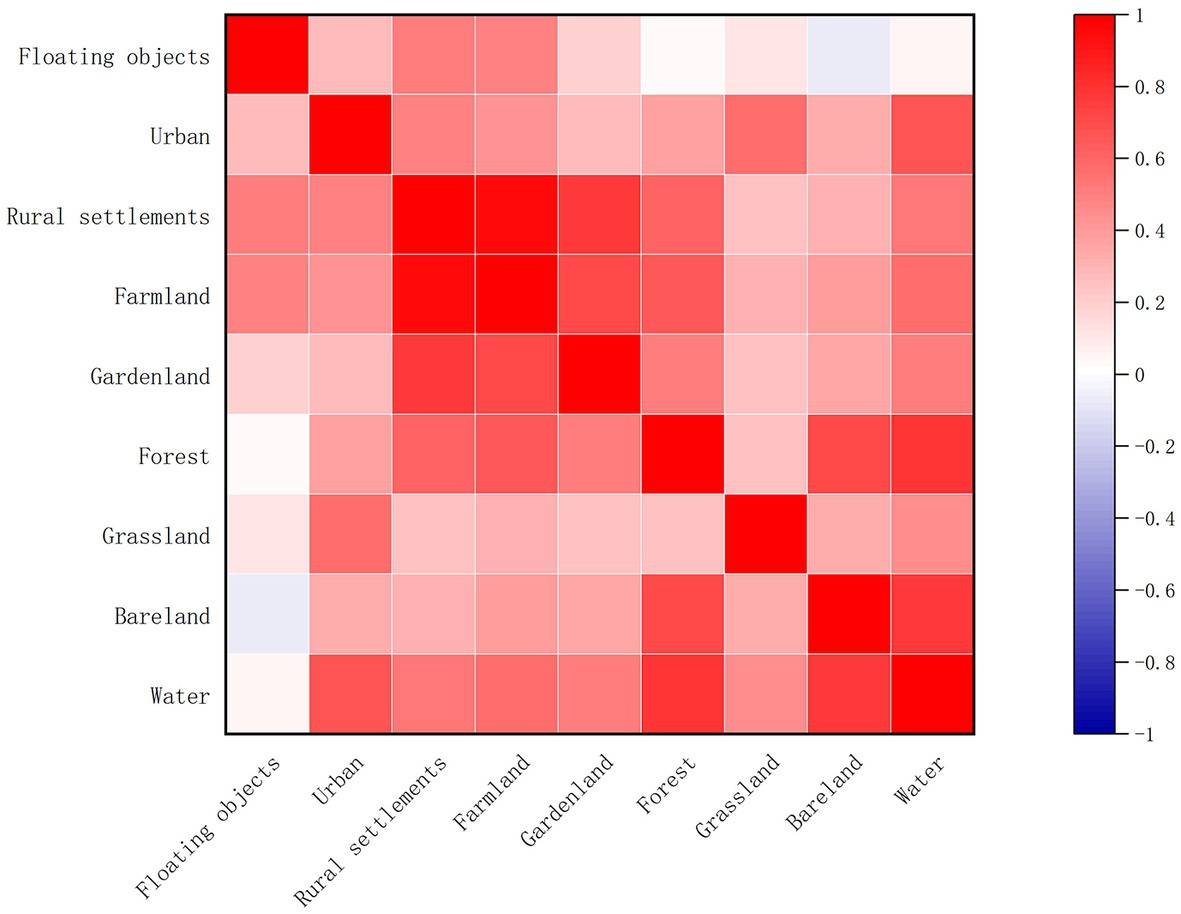
Figure 7. Correlation between land use type and number of floating debris spots in rivers when the buffer radius is 0.5 km.
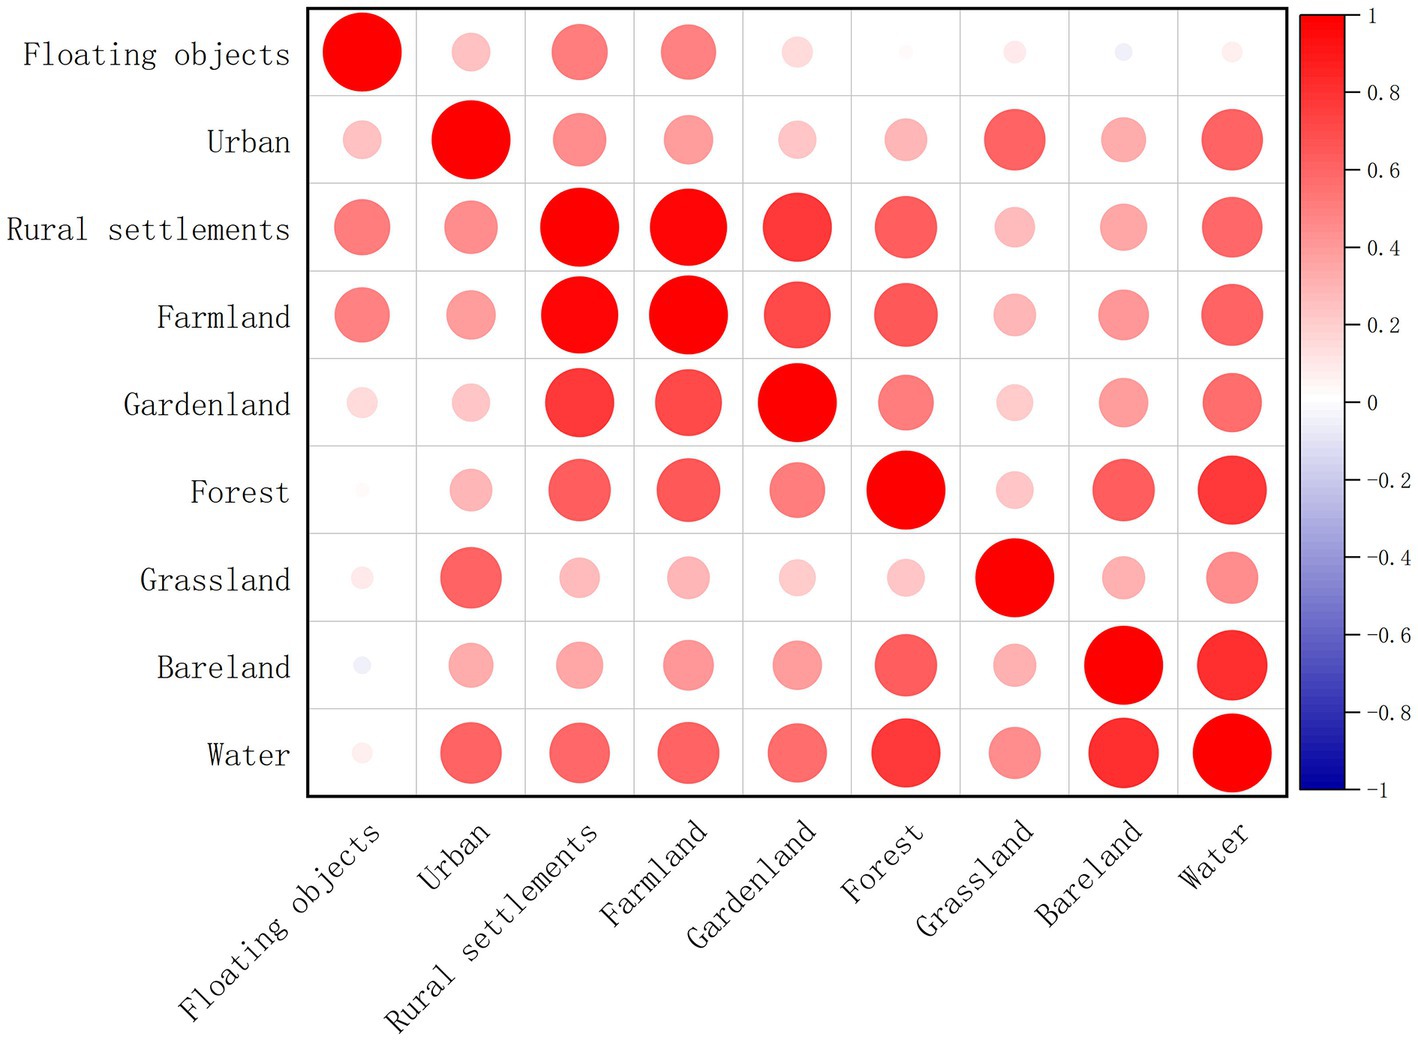
Figure 8. Correlation between land use type and number of floating debris spots in rivers when the buffer radius is 1 km.
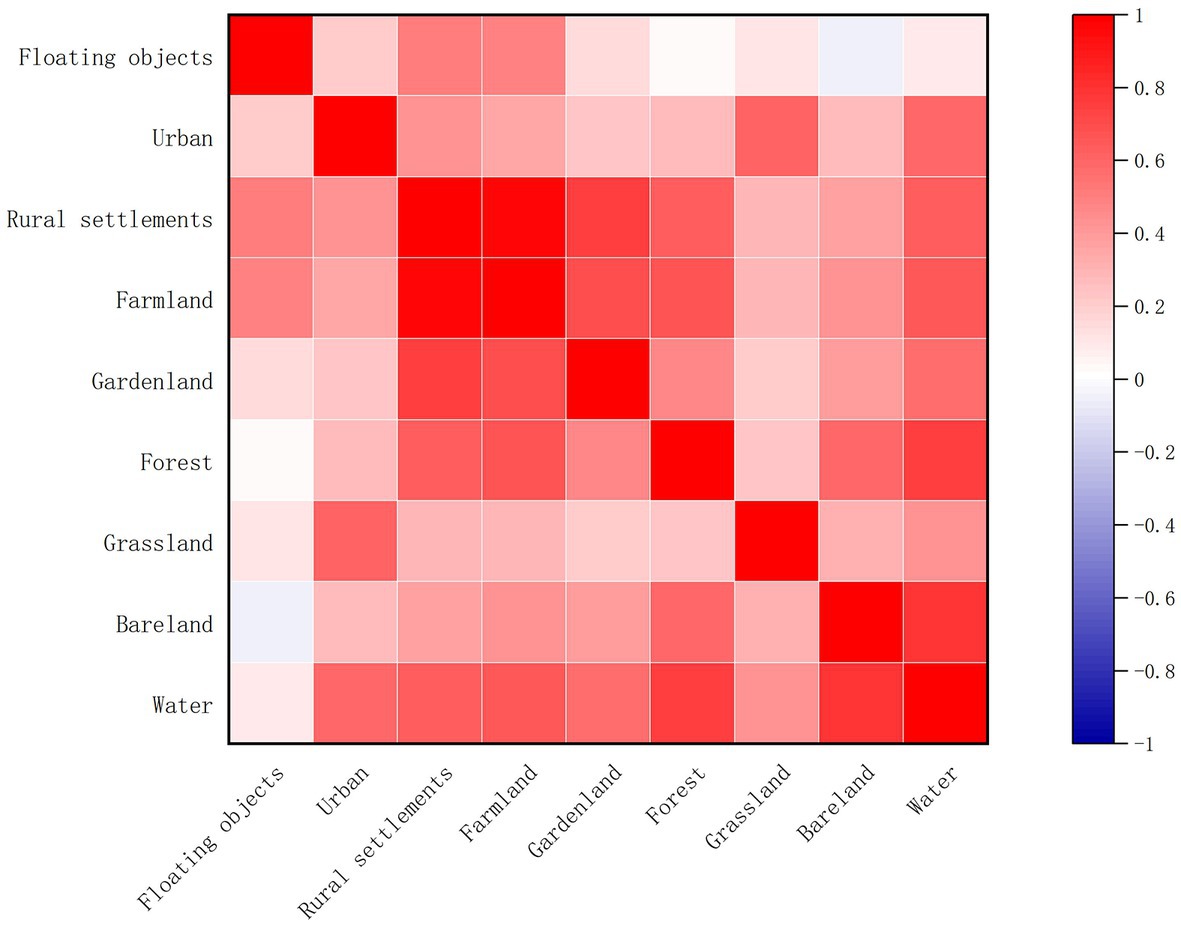
Figure 9. Correlation between land use type and number of floating debris spots in rivers when the buffer radius is 1.5 km.
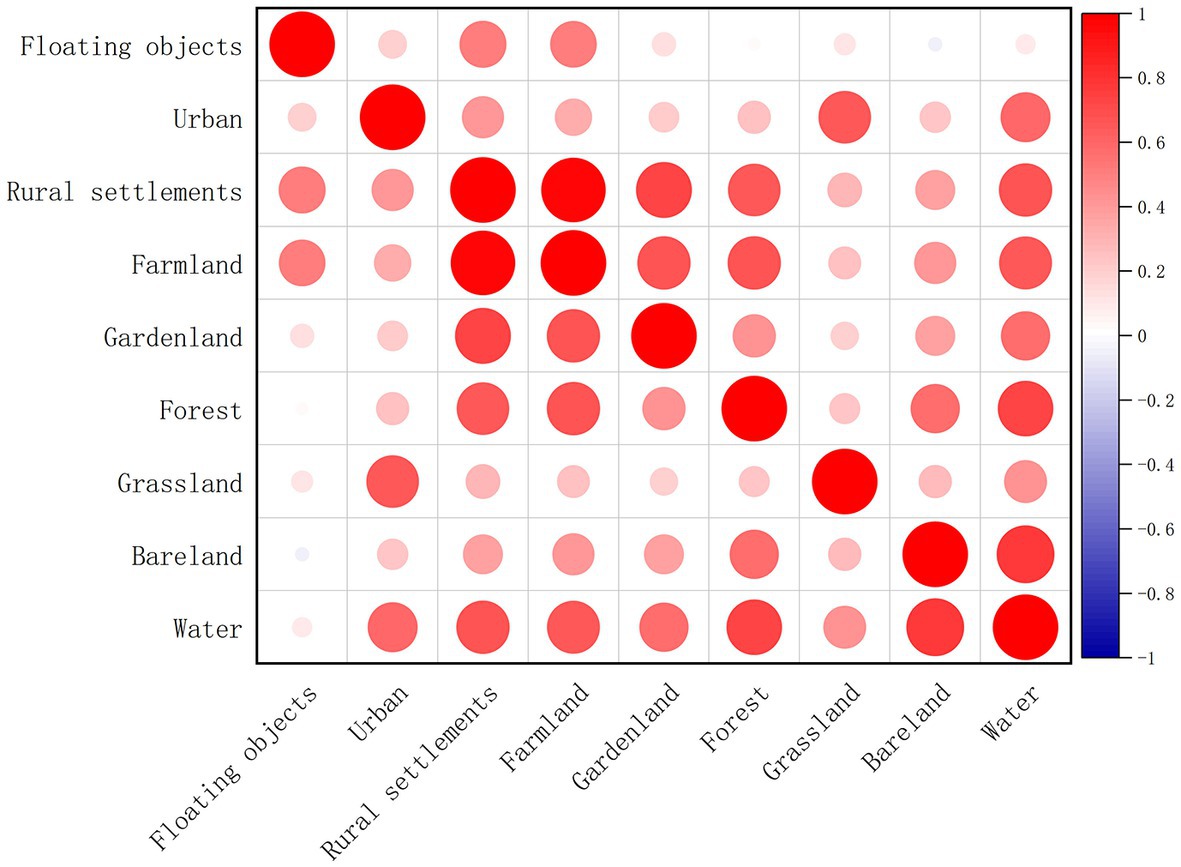
Figure 10. Correlation between land use type and number of floating debris spots in rivers when the buffer radius is 2 km.
4.3. Effects of land use intensity on floating objects at different spatial scales
There were correlations between LUI and the number of floating debris spots at different buffer scales (Figure 11; Li et al., 2013; Zhang et al., 2015; Zeng et al, 2022). When the buffer radius was 1.5 km, the correlation was the strongest (Figure 12). The correlation coefficient was 0.27 (p < 0.05). There is a difference between land use intensity and land use type, and the study found that its impact on floating objects was also different from land use type. Compared with land use type, the correlation between the number of floating debris objects and land use intensity was weak.
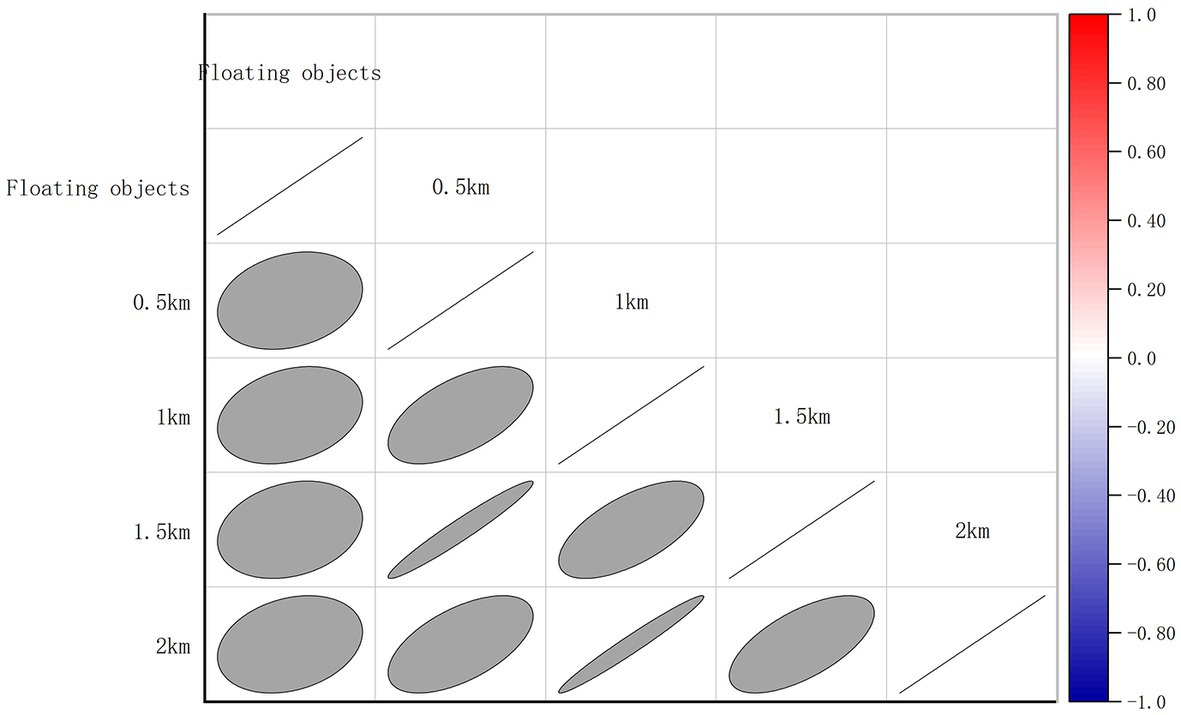
Figure 11. Correlation analysis between land use intensity and number of floating objects at different spatial scales.
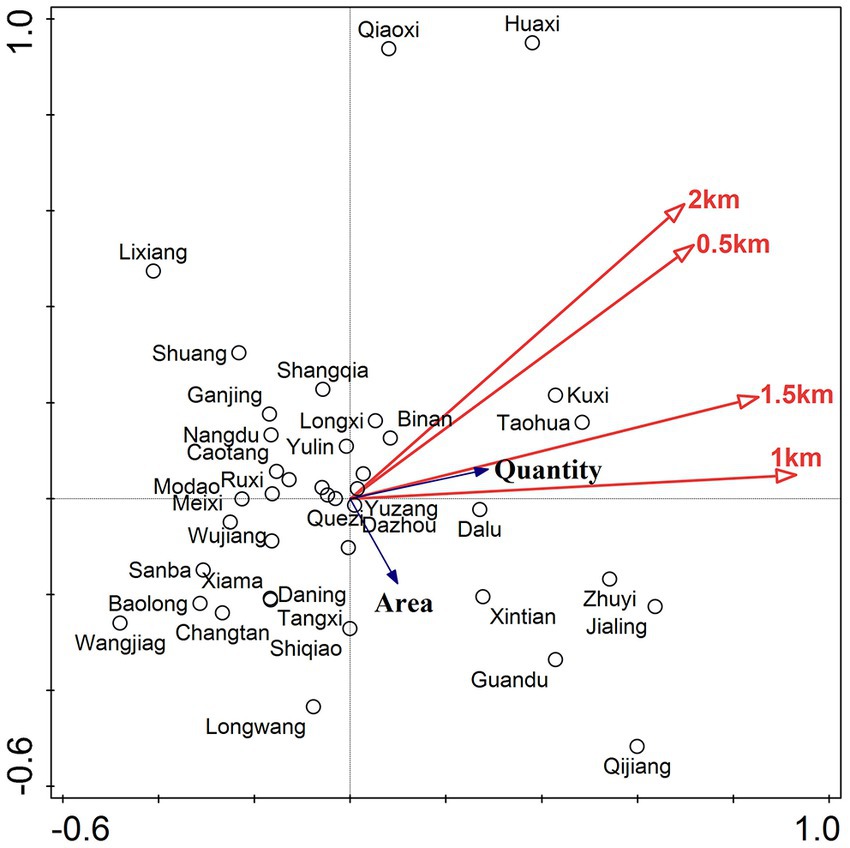
Figure 12. Redundant analysis of land use intensity and number of floating objects at different spatial scales.
Further utilizing redundant analysis methods, the multi-scale LUI interpretive analysis of floating object was carried out. When the buffer radius was 1.5 km, LUI had the highest interpretation degree to the number of floating debris spots, and the interpretation rate was 68.8%. When the buffer radius was 1 km, the explanatory rate was 28.6%. This further reflected that LUI within a 1.5 km buffer radius of the sampling site had the strongest influence on the number of floating objects.
5. Conclusion
Taking the Chongqing section of the TGRA as the study area, we explored the relationship between land use and floating objects in rivers. The study found that: ① The number of floating objects in the main stream of the Yangtze River gradually increased from the upper reaches (the main urban section of Chongqing) to the lower reaches (northeast section of Chongqing), while the opposite was true in the tributaries of the Yangtze River. ② At different buffer scales, urban, rural residential, farmland, gardenland, grassland and other land use were all positively correlated with the number of floating debris spots in the river, and the correlation order was rural settlements > farmland > urban> gardenland > grassland > forest. ③ When the buffer radius was 1.5 km, LUI had the highest explanatory degree for the number of floating debris spots, and the interpretation rate was 68.8%. The results of this study found the spatial distribution characteristics of floating objects in the Chongqing section of the Three Gorges Reservoir area, a large number of floating objects from the upstream tributaries into the main stream of the river. It is suggested to strengthen the interception management of river floaters at the branch inlet estuary to prevent the floaters of tributaries from flowing into the main stream. In terms of land use types, rural settlements and cultivated land have a greater impact on river floaters, while woodland and grassland have a lesser impact on river floaters. According to the research findings, it is suggested that the construction of rural residential areas and cultivated land should be avoided as far as possible in the territorial space planning within 1.5 kilometers on both sides of the river, and ecological modification should be carried out by returning cultivated land to forest and grassland. It is suggested to plant more trees and grass on both sides of the river. In this study, only the data of river floaters in summer were obtained, and the rule of river floaters changing with seasons could not be studied. Future studies should collect data of river floating objects in different seasons and continue to explore the spatio-temporal variation of river floating objects. In addition to land use, other factors can be considered in the study of influencing factors on river floaters, such as urban or rural household waste management, industrial waste discharge, etc.
Data availability statement
The original contributions presented in the study are included in the article/Supplementary material, further inquiries can be directed to the corresponding author.
Author contributions
SY: data curation, writing original draft, and software analysis. DP: conceptualization, funding acquisition, project administration, and writing editing. XZ: writing editing. YL and JL: charting. LC: software analysis. All authors contributed to the article and approved the submitted version.
Funding
This work was supported by high-level Talents Project of Chongqing Medical University (No. R4014), CAS Team Project of the Belt and Road (to DP), Research Program of Chongqing Science and Technology Commission (No. cstc2019jcyj-zdxmX0035 and CSTCCXLJRC201714), National Natural Science Foundation of China (No. 42001269), China–Sri Lanka Joint Center for Education and Research by Chinese Academy of Sciences (CAS), International Partnership Program of CAS (No. 121311kysb20190071), and Program of China–Sri Lanka Joint Center for Water Technology Research and Demonstration by Chinese Academy of Sciences (CAS), Special Project for Performance Incentive and Guidance of Research Institutions in Chongqing (No.DLYG2022JXJL004).
Acknowledgments
The authors are grateful for the remote sensing image acquisition team of Chongqing Geomatics and Remote Sensing Center for providing the remote sensing images and technical support.
Conflict of interest
The authors declare that the research was conducted in the absence of any commercial or financial relationships that could be construed as a potential conflict of interest.
Publisher’s note
All claims expressed in this article are solely those of the authors and do not necessarily represent those of their affiliated organizations, or those of the publisher, the editors and the reviewers. Any product that may be evaluated in this article, or claim that may be made by its manufacturer, is not guaranteed or endorsed by the publisher.
Supplementary material
The Supplementary material for this article can be found online at: https://www.frontiersin.org/articles/10.3389/fevo.2023.1203973/full#supplementary-material
References
Akiyama, T. S., Marcato Junior, J., Gonçalves, W. N., Bressan, P. O., Eltner, A., Binder, F., et al. (2020). Deep learning applied to water segmentation. The international archives of photogrammetry, remote sensing and spatial information sciences. 43, 1189–1193.
Bao, J. S., Huang, X. X., Ji, K., and Lu, Z. B. (2021). Classification and recognition of floating objects on water surface based on DCNN. Transducer Microsyst. Technol. 40, 138–146. doi: 10.13873/J.1000-9787(2021)10-0136-03
Bao, X., Javanbakhti, S., Zinger, S., Wijnhoven, R., and de With, P. H. N. (2013). Context modeling combined with motion analysis for moving ship detection in port surveillance. J. Electron. Imaging. 22:041114. doi: 10.1117/1.JEI.22.4.041114
Brown, M. T., and Vivas, M. B. (2005). Landscape development intensity index. Environ. Monit. Assess. 101, 289–309. doi: 10.1007/s10661-005-0296-6
Cai, Y., Huang, G. B., and Liu, S. F. (2020). Improving floating debris control in Three Gorges Reservoir with integrated measures according to hydraulic condition. Express Water Resour. Hydropower Inf. 41, 62–66. doi: 10.15974/j.cnki.slsdkb.2020.01.011
Cao, X., Gao, S., Chen, L., and Wang, Y. (2020). Ship recognition method combined with image segmentation and deep learning feature extraction in video surveillance. Multimed. Tools Appl. 79, 9177–9192. doi: 10.1007/s11042-018-7138-3
Chen, T.-S., and Lin, H.-J. (2013). Development of a framework for landscape assessment of Taiwanese wetlands. Ecol. Indic. 25, 121–132. doi: 10.1016/j.ecolind.2012.09.012
Chen, Y. R., and Xiao, W. F. (2017). Research progress on land use and ecological environment change in the TGRA. Ecol. Sci., 36, 213–221. doi: 10.14108/j.cnki.1008-8873.2017.06.029
Chen, Q., Zhu, H. M., He, R. A., Dahlgren, R., Zhang, M. H., and Mei, K. (2015). Evaluating the impacts of land use on surface water quality using geographically weighted regression. Acta Sci. Circumst. 35, 1571–1580. doi: 10.13671/j.hjkxxb.2015.0013
Cheng, J. H., Chen, H. F., Li, T., and Gan, S. B. (2022). Floating objects' cleaning up on water surface of TGRA and its quantity evolution analysis. Yangtze River 53, 10–15. doi: 10.16232/j.cnki.1001-4179.2022.S1.003
Ding, J., Jiang, Y., Liu, Q., Hou, Z., Liao, J., Fu, L., et al. (2016). Influences of the land use pattern on water quality in low-order streams of the Dongjiang river basin, China: a multi-scale analysis. Sci. Total Environ. 551-552, 205–216. doi: 10.1016/j.scitotenv.2016.01.162
Domingos, H. A., de Melo Faria, A. M., Fuinhas, J. A., and Marques, A. C. (2017). Renewable energy and greenhouse gas emissions from the waste sectors of European Union member states: a panel data analysis. Environ. Sci. Pollut. Res. Int. 24, 18770–18781. doi: 10.1007/s11356-017-9324-7
Duan, S. Q., An, Y. L., Su, X. L., Wu, Q. X., Jin, T., Hou, Y. L., et al. (2017). Effects of multi-scale land use on water quality in Sancha River. Environ. Pollut. Cont. 39, 529–533. doi: 10.15985/j.cnki.1001-3865.2017.05.013
Duffy, C., O'Donoghue, C., Ryan, M., Kilcline, K., Upton, V., and Spillane, C. (2020). The impact of forestry as a land use on water quality outcomes: an integrated analysis. Forest Policy Econ. 116:102185. doi: 10.1016/j.forpol.2020.102185
Gao, R., Yang, L., Tian, X., Yang, H., and Lin, Y. (2022). Redundancy analysis of the relationship between plant and environmental factor on shady and sunny unstable slope in Dry-Hot Valley. Mountain Res. 40, 835–846. doi: 10.16089/j.cnki.1008-2786.000717
Ge, S., and Yue, W. (2016). Spatial and temporal distribution of land use pattern change in Songnen high plain. Trans. Chinese Soc. Agric. Eng. 31, 61–66. doi: 10.11975/j.issn.1002-6819.2016.18.031
Giri, S., and Qiu, Z. (2016). Understanding the relationship of land uses and water quality in twenty first century: a review. J. Environ. Manag. 173, 41–48. doi: 10.1016/j.jenvman.2016.02.029
Jan, L., and Petr, S. (2003). Multivariate analysis of ecological data using CANOCO. Cambridge: Cambridge University Press.
Kim, K., Hong, S., Choi, B., and Kim, E. (2018). Probabilistic ship detection and classification using deep learning. Appl. Sci. 8, 936–952. doi: 10.3390/app8060936
Li Ruxia, D. A., Saimire, T., Wang, X., and Zhang, M. (2023). Effects of land use patterns at different spatial scales on water quality of Kidu Rve. Trans. Oceanol. Limnol. 98:106. doi: 10.13984/j.cnki.cn37-1141.2023.01.014
Li, H., Wang, J., Zhang, J., Qin, F., Hu, J., and Zhou, Z. (2021). Analysis of characteristics and driving factors of wetland landscape pattern change in Henan Province from 1980 to 2015. Land. 10:564. doi: 10.3390/land10060564
Liu, X. Y., Shao, W. F., Su, L., and Wang, T. (2022). Analysis on sediment scouring and silting characteristic of TGRA since 175 m tiral impoundment. Port Waterway Eng. 95–99. doi: 10.16233/j.cnki.issn1002-4972.20211227.002
Liu Yansui, Q. L. (2022). Land use pattern change and human-earth system evolution in Three Gorges Reservoir Area in recent 30 years. Resour. Environ. Yangtze Basin. 31, 1664–1676.
Manickam, R., Kumar Rajan, S., Subramanian, C., Xavi, A., Eanoch, G. J., and Yesudhas, H. R. (2020). Person identification with aerial imaginary using SegNet based semanic segmentation. Earth Sci Inform. 13, 1293–1304. doi: 10.1007/s12145-020-00516-y
Nobre, R. L. G., Caliman, A., Cabral, C. R., Araújo, F. C., Guérin, J., Dantas, F. C. C., et al. (2020). Precipitation, landscape properties and land use interactively affect water quality of tropical freshwaters. Sci. Total Environ. 716:137044. doi: 10.1016/j.scitotenv.2020.137044
Shehab, Z. N., Jamil, N. R., Aris, A. Z., and Shafie, N. S. (2021). Spatial variation impact of landscape patterns and land use on water quality across an urbanized watershed in Bentong, Malaysia. Ecol. Indic. 122:107254. doi: 10.1016/j.ecolind.2020.107254
St-Hilaire, A., Duchesne, S., and Rousseau, A. N. (2016). Floods and water quality in Canada: a review of the interactions with urbanization, agriculture and forestry. Can. Water Resour. J./Revue canadienne des ressources hydriques 41, 273–287. doi: 10.1080/07011784.2015.1010181
Wang, N., Li, J., and Zhou, Z. (2021). Landscape pattern optimization approach to protect rice terrace Agroecosystem: case of GIAHS site Jia Che valley, Guizhou, Southwest China. Ecol. Indic. 129:107958. doi: 10.1016/j.ecolind.2021.107958
Wang, Z. L., Zhang, L. Y., Zhong, W. Y., Chen, M., Yang, C. X., Huang, D. N., et al. (2023). Temporal and spatial Evolution Characteristics of Ecological Space Vulner ability in TGRA. Res. Soil Water Conser. 30, 348–355. doi: 10.13869/j.cnki.rswc.2023.01.020
Xia, H., Kong, W., Zhou, G., and Sun, O. J. (2021). Impacts of landscape patterns on water-related ecosystem services under natural restoration in Liaohe River Reserve, China. Sci. Total Environ. 792:148290. doi: 10.1016/j.scitotenv.2021.148290
Xiang, S., Pang, Y., Dou, J. S., Lu, X. Z., Xue, L. Q., and Chu, Z. S. (2018). Impact of land use on the water quality of inflow river to Erhai Lake at different temporal and spatial scales. Acta Ecol. Sin. 38, 876–885. doi: 10.5846/stxb201612192610
Xu, N., Gao, J. Q., and Wang, Q. (2017). Simulation of non-point source pollution in the State River basin based on SWAT model. Haihe Water Resour. 31, 53–56. doi: 10.3969/j.issn.1004-7328.2017.05.018
Yan, L., Yu, P., Wang, Y., Li, Z., Liu, G., Shuai, P., et al.(2013). Effects of land use change on runoff in Rouyuanchuan small basin. Sci. Soil Water Conserv. 11, 40–46. doi: 10.3969/j.issn.1672-3007.2013.03.008
Yao, C., An, R., Dou, C., and Liu, Y. (2022). Research on construction and evaluation of forest land ecological network in TGRA based on MSPA and MCR model. Resourc. Environ. Yangtze Basin. 31, 1953–1962.
Yoon, K., Song, Y. M., and Jeon, M. (2018). Multiple hypothesis tracking algorithm for multi-target multi-camera tracking with disjoint views. IET Image Process. 12, 1175–1184. doi: 10.1049/iet-ipr.2017.1244
Yuan, J. (1998). Influence of floating objects in the Yangtze River on the operation of Gezhouba power station. China Three Gorges Project, 9, 34–35.
Zeng, Z. W., Yang, H., Ning, Q. M., and Tang, H. (2022). Temporal and Spatial Evolution of Land Use Intensity and Its Impact on Ecosystem Services in Dongting Lake Zone. Econ. Geogr. 42, 176–185. doi: 10.15957/j.cnki.jjdl.2022.09.020
Zhang, X., Gao, Q., Yan, J., Ji, D., and Luo, Y. (2020). Water quality affected by floating debris near the dam section of Three Gorges Reservoir. J. Lake Sci. 32, 609–618. doi: 10.19478/j.cnki.2096-2347.2020.02.06
Zhang, J., Li, S., Dong, R., Jiang, C., and Ni, M. (2018). Influences of land use metrics at multi-spatial scales on seasonal water quality: a case study of river systems in the Three Gorges Reservoir Area, China. J. Clean. Prod. 206, 76–85. doi: 10.1016/j.jclepro.2018.09.179
Zhang, R., Qiao, Y., and Liu, H. (2015). The map analysis of wetland landscape evolution with land use intensity change response in Yinchuan Plain. Science of Surveying and Mapping. 40, 54–59. doi: 10.16251/j.cnki.1009-2307.2015.10.010
Zhu, A. P., Yuan, S. Y., Wen, S. S., Huang, B. B., Feng, X. L., and Xie, Z. L. (2023). Effects of landscape pattern on water quality at multi-spatial scales in the Liuxi River. Acta Ecol. Sin. 43, 1485–1495. doi: 10.5846/stxb202204110949
Keywords: floating matter, land use, correlation analysis, redundancy analysis, Chongqing section of the Three Gorges Reservoir
Citation: Ye S, Pei D, Zhang X, Luo Y, Liu J and Chen L (2023) Analysis of the impact of land use on floating object in rivers at different spatial scales—the Chongqing section of the Three Gorges Reservoir area. Front. Ecol. Evol. 11:1203973. doi: 10.3389/fevo.2023.1203973
Edited by:
Ning Niu, Henan University of Economic and Law, ChinaReviewed by:
Lilei Zhou, Chongqing Jiaotong University, ChinaLei Yao, Shandong Normal University, Chin
Copyright © 2023 Ye, Pei, Zhang, Luo, Liu and Chen. This is an open-access article distributed under the terms of the Creative Commons Attribution License (CC BY). The use, distribution or reproduction in other forums is permitted, provided the original author(s) and the copyright owner(s) are credited and that the original publication in this journal is cited, in accordance with accepted academic practice. No use, distribution or reproduction is permitted which does not comply with these terms.
*Correspondence: Desheng Pei, cGVpZHNAY3FtdS5lZHUuY24=
 Sheng Ye
 Desheng Pei3*