 Xuan Luo
 Yinfei Wang1,2
 Yungang Li
- 1Institute of International Rivers and Eco-Security, Yunnan University, Kunming, China
- 2Yunnan Key Laboratory of International Rivers and Transboundary Eco-security, Yunnan University, Kunming, China
The ecosystem water use efficiency (WUE), a crucial indicator of how climate change will affect terrestrial ecosystems, depicts the coupling of the carbon gain and water loss in terrestrial ecosystems. In this study, the spatiotemporal variations in the WUE and its responses to drought in the Lancang–Mekong River Basin (LMRB) from 1982 to 2018 were investigated using the gross primary productivity (GPP) and evapotranspiration (ET) data acquired from the Global Land Surface Satellite (GLASS) products. The analyses revealed that: (1) the mean yearly WUE for the LMRB was 1.63 g C kg−1 H2O, with comparatively higher values in forests and warm temperate climatic types. The interaction of temperature and leaf area index was the main factor affecting the spatial distribution of WUE. The yearly WUE for the entire region exhibited a decreasing trend with a rate of −0.0009 g C kg −1 H2O·yr−1, and the spatially significantly decreasing area accounted for 41.67% of the total area. (2) The annual WUE was positively correlated with drought in the humid regions, accounting for 66.55% of the total area, while a negative relationship mainly occurred in the high-altitude cold region. (3) The ecosystem WUE lagged behind the drought by 3 months in most regions. The lag effect was more apparent in the grassland-dominated upstream region and the cropland-dominated Mekong Delta. (4) The resilience analysis revealed that the ecosystems in forests and temperate climate types were strongly resistant to drought, while the grassland and high-altitude regions with a dry and cold climate had relatively poor resilience. The results of this study shed light on how the WUE responds to drought across diverse land use types, climate types, and elevation gradients, uncovering fresh insights into the potential mechanisms behind the impact of drought on water and carbon cycles within ecosystems.
1. Introduction
Drought is a common hydroclimatic hazard and has unfavorable consequences for terrestrial ecosystems (Mishra and Singh, 2010; Vicente-Serrano et al., 2020). Drought has been recognized as a critical component in the circulation between terrestrial water and carbon (Gentine et al., 2019), affecting soil evaporation, plant transpiration, and carbon absorption at the ecological scale (Liu et al., 2019; Yang et al., 2021). Climate model projections suggest that as a consequence of climate change, the frequency and intensity of droughts will increase (Dai, 2012; Su et al., 2021) and are expected to pose extensive and adverse impacts on ecosystem carbon and water exchange (Huang et al., 2016; Gentine et al., 2019; Zhang et al., 2020). The water use efficiency (WUE) is calculated as the rate of carbon assimilation during photosynthesis to water loss via transpiration, and it is a crucial metric of the coupling of carbon and water in the ecosystem. The ratio of the evapotranspiration (ET) to the gross primary production (GPP) at the ecosystem scale can be used to determine the WUE (Huang et al., 2016; Kang and Kang, 2019). Knowledge of drought impacts on WUE is essential for elucidating how terrestrial ecosystems respond to climate change (Yi and Jackson, 2021; Zhao et al., 2021; Zhou et al., 2021).
The WUE has been extensively inspected on the basis of site measurements (Acuna et al., 2015; Medrano et al., 2015; Lin et al., 2018; Duan et al., 2020). Scientists have examined the spatial variability of the WUE in various regions using network eddy covariance measurements (Zhu et al., 2015; Zhao et al., 2021). However, due to the restricted observations of the eddy covariance flux towers, an accurate estimation of the ecosystem WUE at the global scale remains difficult (Yang et al., 2020). Recent research has shown that process-based ecosystem models and remote sensing methods provide new tools to help us comprehensively understand the WUE dynamics on regional and even global scales (Wei et al., 2019; Yang et al., 2020, 2021). For example, the moderate resolution imaging spectroradiometer (MODIS), breathing Earth system simulator (BESS), Penman-Monteith-Leuning model (PML), Global Land Surface Satellite (GLASS), and global land evaporation Amsterdam model (GLEAM) have been extensively utilized to assess the WUEs of regional or global terrestrial ecosystems (Liu et al., 2019; Xu et al., 2019; Zhao A. et al., 2020; Measho et al., 2021; Yang et al., 2021).
WUE variations are strongly affected by various biotic (i.e., leaf area index and vegetation types) and abiotic factors (i.e., precipitation, temperature, and radiation) (Liu et al., 2015). The influencing factors of WUE had significant spatial heterogeneity and varied with the time scales. Li et al. (2023) employed structural equation modeling (SEM) to investigate the influences of WUE in a subtropical evergreen forest in southeastern China and found that WUE responded significantly to soil moisture (SM) at different time scales (from half-hourly to monthly scales). Qin et al. (2023) used geographic detector modeling (GDM) to discover that land surface temperature (LST) had the strongest driving effect on WUE in Central Asia, and temperature (TEM) had the largest interaction effect with vegetation cover. Nandy et al. (2022) used a random forest (RF) algorithm to reveal that TEM is the main driver of the WUE in Indian forests.
Drought may simultaneously alter both components of the WUE (the GPP and ET) and is therefore regarded as one of the most influential abiotic variables affecting the WUE (Zhao A. et al., 2020). The impacts of drought on ecosystem WUE vary according to the vegetation types, drought severity, and dry and wet zones (Zhao J. et al., 2020). According to Yang et al. (2021), over 50% of the vegetated regions worldwide have positive correlations between the WUE and drought, whereas the negative correlations basically were distributed in the high-latitude areas. Yang et al. (2016) discovered that there are strong negative relationships between the WUE and the drought index in dry areas, while sub-humid and semi-arid zones have positive relationships. This discovery is in line with the results of Huang et al. (2017), who demonstrated that the WUE in wet ecosystems often exhibited both a positive and negative response to drought, while the WUE in dry ecosystems frequently exhibited a negative response to drought. However, Guo et al. (2019) reported a positive correlation between the WUE and the standardized precipitation and evapotranspiration index (SPEI) in subarid China. In areas with a high humidity, the response of the WUE drought indices was found to be both positive and negative.
The core concept for determining how an ecosystem responds to a major disturbance is based on resilience (Yi and Jackson, 2021). The ecosystem resilience mainly describes the state changes in the ecosystem before and after the response to interference (Ingrisch and Bahn, 2018). Malone et al. (2016) quantified the resilience of the ecosystem to drought by comparing the changes in the WUE in normal years and under drought conditions. Their results revealed that the arid ecosystem in California has more drought resistance than the high-productivity ecosystem in the northern part of the state. Sharma and Goyal (2018a) introduced a resilience index and found that many of India’s river basins were insufficiently resilient to drought disturbances. Guo et al. (2019) reported that certain ecosystems in northeastern, central, and southwestern China demonstrated relatively high levels of resilience based on the dimensionless resilience index developed by Sharma and Goyal (2018a). In addition, Liu et al. (2019) further assessed the WUE resilience to drought in China in several dimensions, including the grid cell, land use, climate type, river basin, and province.
The Lancang–Mekong River Basin (LMRB) is the largest cross-border river basin in Southeast Asia, and is unparalleled in terms of its biodiversity and ecosystem services. Drought events have been more common in the LMRB during the last few decades. Examples of years with extreme droughts that threatened water and grain security include 1992–1993, 1998–1999, 2003–2005, 2010–2011, 2015–2016, and 2019–2020 (Guo et al., 2017; Tran et al., 2019). Recent research indicates that both meteorological and hydrological drought will intensify in the near future (Li Y. et al., 2021). Nonetheless, there is a lack of comprehensive analysis regarding how the WUE responds to drought occurrences, as well as a deficiency in research pertaining to ecosystem resilience to drought, which is the primary natural disaster in the LMRB. Therefore, understanding the impacts of drought on the WUE is imperative for managing drought risks and minimizing uncertainties in forecasting future terrestrial carbon sequestration. We evaluated the response of the WUE to drought in the LMRB from 1982 to 2018 utilizing remote sensing and model-based data. The particular aims of this study were (1) to investigate the spatiotemporal changes in the GPP, ET, and WUE from 1982 to 2018; (2) to explore how the WUE responded to drought and the ecosystem resilience; and (3) to examine the changes in WUE and ecosystem resilience across different land use types, climate types, and elevation gradients.
2. Materials and methodology
2.1. Study area
The Lancang–Mekong River (LMR) has the distinction of being the longest river in Southeast Asia. It originates on the Tibetan Plateau, flows approximately 4,880 km to the southeast, and eventually empties into the South China Sea. The LMRB drains a total land area of 810,000 km2 within the six counties of China, Myanmar, Laos, Thailand, Cambodia, and Vietnam. The basin comprises several different areas that are differentiated by their diverse topography, drainage patterns, and geomorphology (Mekong River Commission, 2005). The topography fluctuates greatly in elevation and decreases from the northwest to the southeast. The climate characteristics of the LMRB transition from a high-altitude continental and temperature climate in the upper part of the basin to a tropical monsoon climate in the lower part. The annual precipitation ranges from 600 to 3,000 mm, with the precipitation mainly occurring from May to October. The mean annual temperature across the entire region exceeds 14°C.
2.2. Data
Both the GPP and ET datasets were obtained from the GLASS product-generating system1 (Zhao et al., 2013; Liang et al., 2021). For estimating the monthly and yearly WUE, we utilized the GLASS GPP and ET data with a resolution of 0.05° and a temporal interval of 8 days, covering the period from 1982 to 2018. The monthly 0.05° precipitation (PRE) datasets from 1982 to 2018 were obtained from the Climate Hazards Group InfraRed Precipitation with Station (CHIRPS) data (version 2.0) (Funk et al., 2015). The monthly potential evapotranspiration (PET) data for 1982–2018 was obtained from the GLEAM2 (version 3.5a) (Martens et al., 2017). The PET datasets underwent uniform interpolation to a 0.05° grid and were subsequently aggregated to a monthly time scale for consistency with the resolution of the CHIRPS data.
In addition, the influencing factors of WUE in this study included leaf area index (LAI), photosynthetically active radiation (PAR), vapor pressure deficit (VPD), SM, PRE, TEM, and relative humidity (RH). Specifically, the LAI and PAR were obtained from MOD15A2H V6 level 4 and MCD18C2 Version 6.1, respectively (Knyazikhin et al., 1999; Myneni et al., 2015; Wang D. et al., 2020). The SM and RH were obtained from ERA5-Land and ERA5 reanalysis datasets, respectively (Muñoz Sabater, 2019; Hersbach et al., 2023). The VPD was calculated using RH and TEM (Jiao et al., 2019; Li et al., 2023). These datasets were processed into annual values with a spatial resolution of 0.05° for the period from 2003 to 2018.
Other ancillary data included land use type data procured from the MODIS MCD12C1 products3 (Broxton et al., 2014), the lasted global map of Köppen–Geiger climate types (Peel et al., 2007), and a digital elevation model (DEM) obtained from the Shuttle Radar Topography Mission (SRTM) data.4 The spatial distributions of the elevation, land use, and climate types are shown in Figure 1. Details about the definitions of land use and climate types are shown in Table 1.
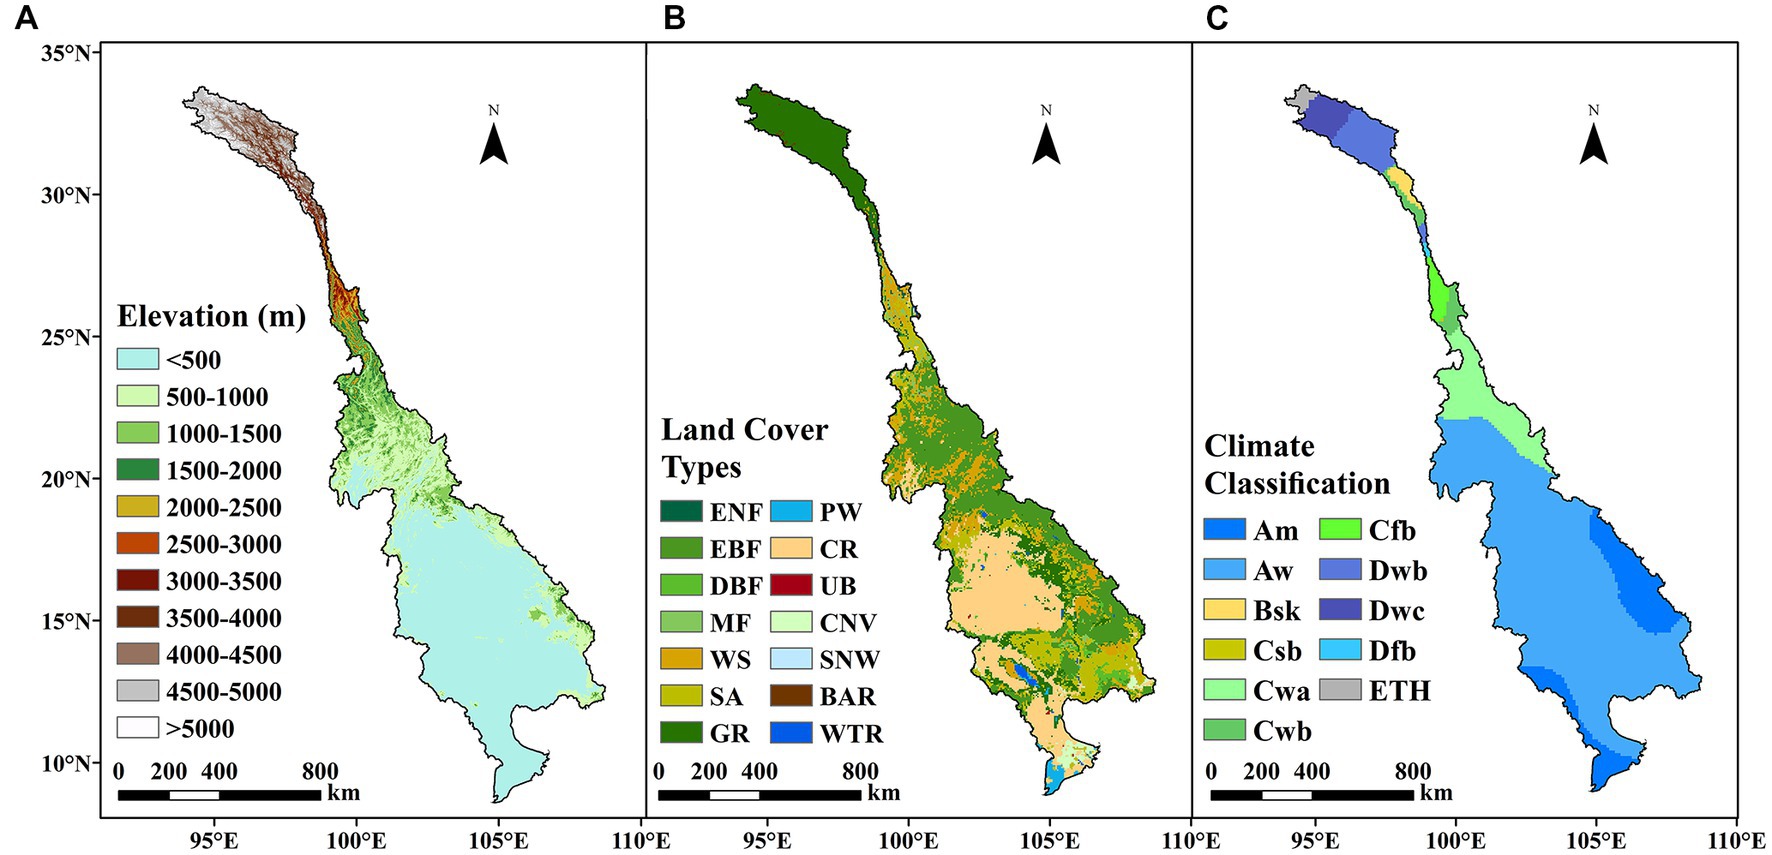
Figure 1. (A) Elevation, (B) land use types, and (C) climate types in the LMRB.
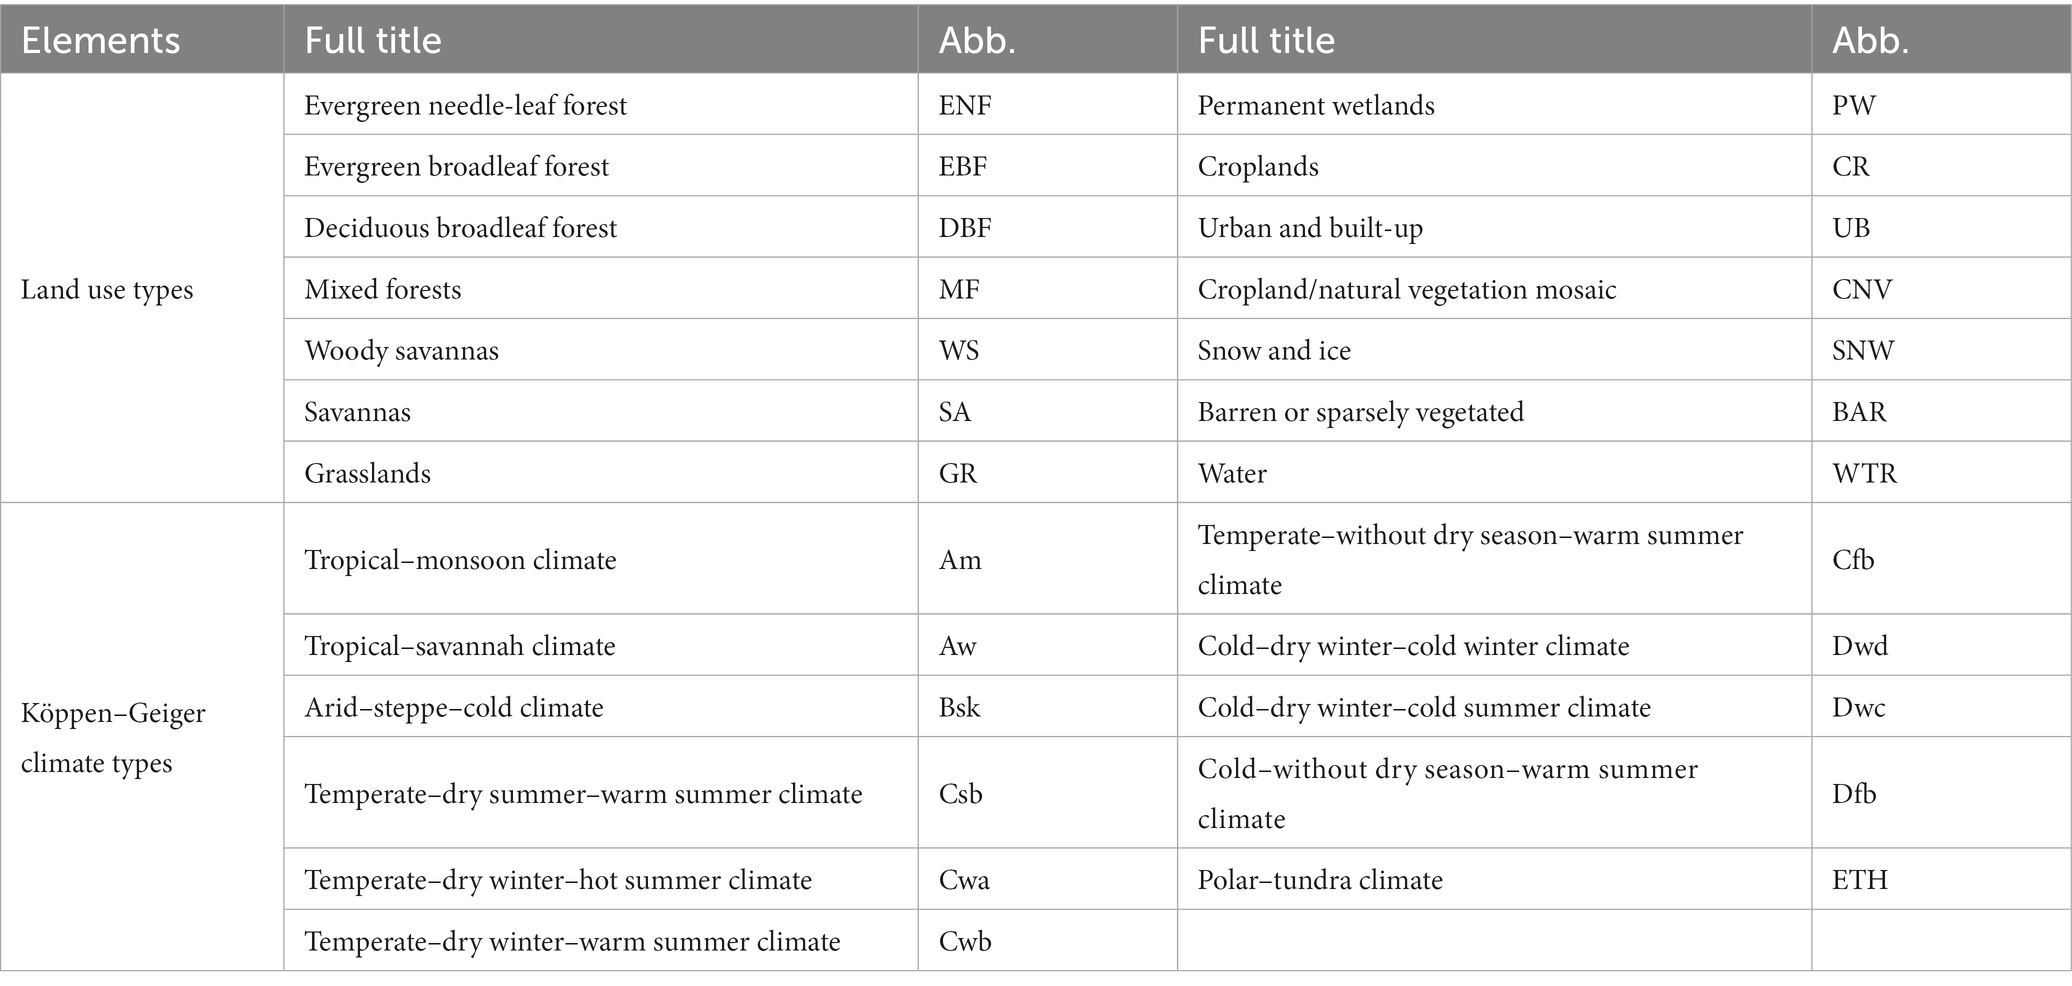
Table 1. List of land use types and Köppen–Geiger climate types over LMRB with their full title and abbreviation.
2.3. Methodology
2.3.1. WUE
At the ecosystem scale, the WUE can be calculated as follows (Yang et al., 2016):
where WUE stands for the water use efficiency (unit: g C kg−1 H2O); and GPP and ET represent the gross primary production (unit: g C m−2) and evapotranspiration (unit: mm), respectively.
2.3.2. Drought index
The SPEI is a commonly employed metric for assessing drought conditions and provides insights into the spatiotemporal variability of drought. The computation of the SPEI is founded upon the water balance approach, necessitating the utilization of PRE and PET as the primary input parameters (Vicente-Serrano et al., 2010). The distinct features across various time-scales can be characterized by the SPEI owing to its incorporation of the sensitivity of the Palmer drought severity index (PDSI) to alternations in the evaporation demand and the variable time-scale features of the standardized precipitation index (SPI) (Vicente-Serrano et al., 2010). The CHIRPS PRE and GLEAM PET data with 0.05° resolution and monthly resolutions from 1982 to 2018 were employed to calculate the SPEI (Jiang et al., 2021). We used the 1-month (January to December) and 12-month SPEI for December to represent the monthly and annual drought conditions, respectively. In addition, a threshold of −1 was selected to indicate drought conditions.
2.3.3. Ecosystem resilience index
The analysis of resilience was conducted utilizing the WUE as the metric for evaluating the ecosystem’s response to drought (Sharma and Goyal, 2018a,b). The identification of drought was initially conducted using the SPEI, with the selection of the worst drought year for the per pixel being determined using the SPEI-12. The ratio Rd of the WUE during the worst drought year (WUEd) to the average yearly WUE (WUEm) is defined as follows:
The non-dimensional parameter Rd provides an assessment of the ecosystem resilience based on the value categories (Table 2).
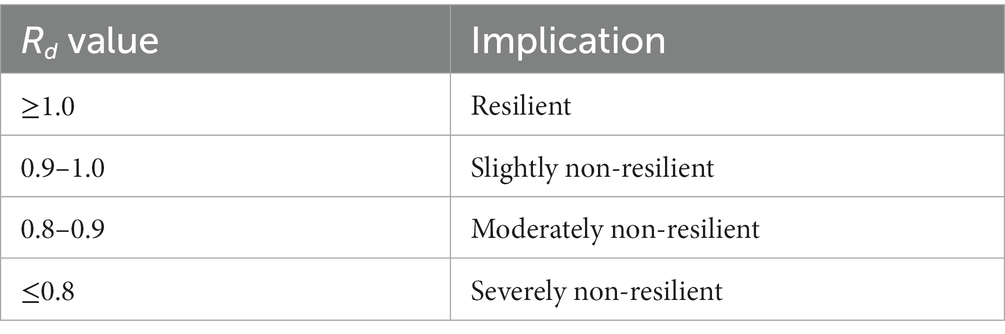
Table 2. The value categories of the Rd. and corresponding implications.
2.3.4. Statistical analysis
The Mann–Kendall (MK) trend analysis is commonly employed to test trends in climate and vegetation data as it does not necessitate adherence to normality assumptions of the data series (Kendall, 1948). In this study, the modified MK (Wang et al., 2019) was employed to ascertain the trends in the GPP, ET, and WUE during 1982–2018. The significant trends (5% level) were evaluated. In addition, Sen’s slope analysis was performed to detect any alterations in the trend of the time series (Sen, 1968). The GDM (Wang et al., 2010; Song et al., 2020), a tool for quantifying the heterogeneity of spatial stratification, was applied to quantitatively analyze the potential effects of different factors (i.e., PRE, TEM, SM, RH, VPD, PAR, and LAI) on the spatial distribution of WUE over the LMRB. The GDM includes factor, interaction, risk, and ecological detectors (Wang et al., 2010). In this study, we employ the factor detector to explore the contributions of different factors to WUE, and the interaction detector to reveal the joint contribution of two factors to WUE. Furthermore, we conducted Pearson correlation analysis to examine the relationship between the time series of the SPEI and WUE. To investigate the lagging impacts of drought on the WUE, the Pearson correlation coefficients (PCCs) between the SPEI-1 and monthly WUE for different lag windows (0–12 months) were calculated, and the lag window with the maximum Pearson correlation coefficient (MPCC) was taken as the lag time (LT) (Ji et al., 2021).
3. Results
3.1. Spatiotemporal variations in GPP, ET, and WUE
The fluctuations in the annual GPP, ET, and WUE during 1982–2018 are illustrated in Figure 2. The yearly GPP of the terrestrial ecosystems exhibited great variations, ranging from 1679.79 to 1883.58 g C m−2, and the mean value over multiple years was 1790.77 g C m−2 (Figure 2A). There was a slight upward trend in the yearly GPP with a rate of 0.65 g C m−2·yr−1. During the study period, the ET exhibited a significant upward trend with a rate of 1.98 mm·yr−1, and its multi-year mean annual value was approximately 1070.81 mm (Figure 2B). The annual WUE exhibited a non-significant decreasing trend with a rate of −0.0009 g C kg−1 H2O·yr−1 for the entire study period, with a mean rate of 1.63 g C kg−1 H2O and a variation range of 11.54–11.79 g C kg−1 H2O (Figure 2C).
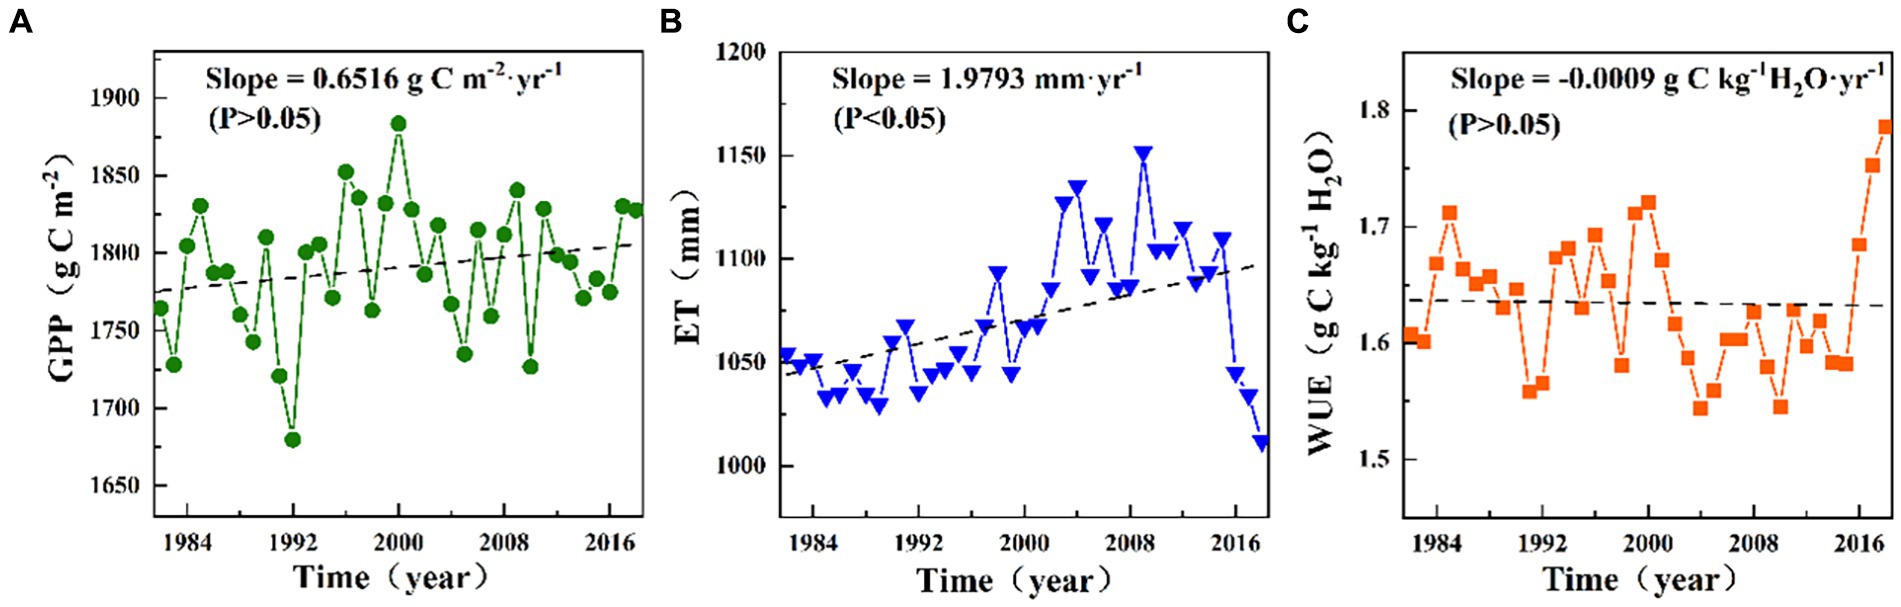
Figure 2. Variations in the mean yearly (A) GPP, (B) ET, and (C) WUE from 1982 to 2018.
Figures 3, 4 shows spatial distribution and temporal trends, respectively, of the yearly GPP, ET, and WUE over the study period across the LMRB. From 1982 to 2018, the average yearly GPP and ET of the terrestrial ecosystems in the LMRB exhibited large spatial variability, and this is attributed to the impacts of the soil, vegetation, and climate types, which exhibited considerable gradients throughout the basin. The high annual GPP values mainly occurred in Yunnan Province, Laos, and northeastern Cambodia, while the low value of annual GPP values primarily occurred in the source of the LMRB on the Qinghai–Tibet Plateau, the Khorat Plateau in Thailand, and the flood plain of Tonle Sap Lake in Cambodia, and the Mekong Delta in Vietnam (Figure 3A). Most of the areas in Laos and Cambodia exhibited significant decreasing trends in the annual GPP during 1982–2018, while the annual GPP exhibited significant increasing trends in the source of the basin on the Qinghai–Tibet Plateau, the southern Yunnan, the Khorat Plateau in Thailand, and the Mekong Delta in Vietnam (Figure 4A). The spatial pattern of the annual ET exhibited a clear decreasing trend from south to north. Higher ET values occurred in the downstream region with high temperatures and a humid climate. In contrast, lower ET values occurred in the upstream region with a cold and dry climate (Figure 3B). Approximately 94.76% of the total area exhibited an increasing ET trend (Figure 4B). The spatiotemporal variation pattern of the annual WUE basically agreed with that of the GPP (Figures 3C, 4C). The higher annual WUE values (2–3 g C kg−1 H2O) were principally distributed in Yunnan Province and Laos, while the low values (0–1 g C kg−1 H2O) primarily occurred in the river source region on the Qinghai–Tibet Plateau, the Khorat Plateau in Thailand, and the flood plain of the Tonle Sap Lake in Cambodia, and the Mekong Delta in Vietnam. Regarding the entire area, 18.26% of the study area exhibited a significant increase in the WUE, while 41.67% exhibited a significant decrease (Figure 4C). It should be noted that the highland area in northern Laos exhibited a significant decreasing trend in the yearly WUE, which was mainly due to the increase in the ET.
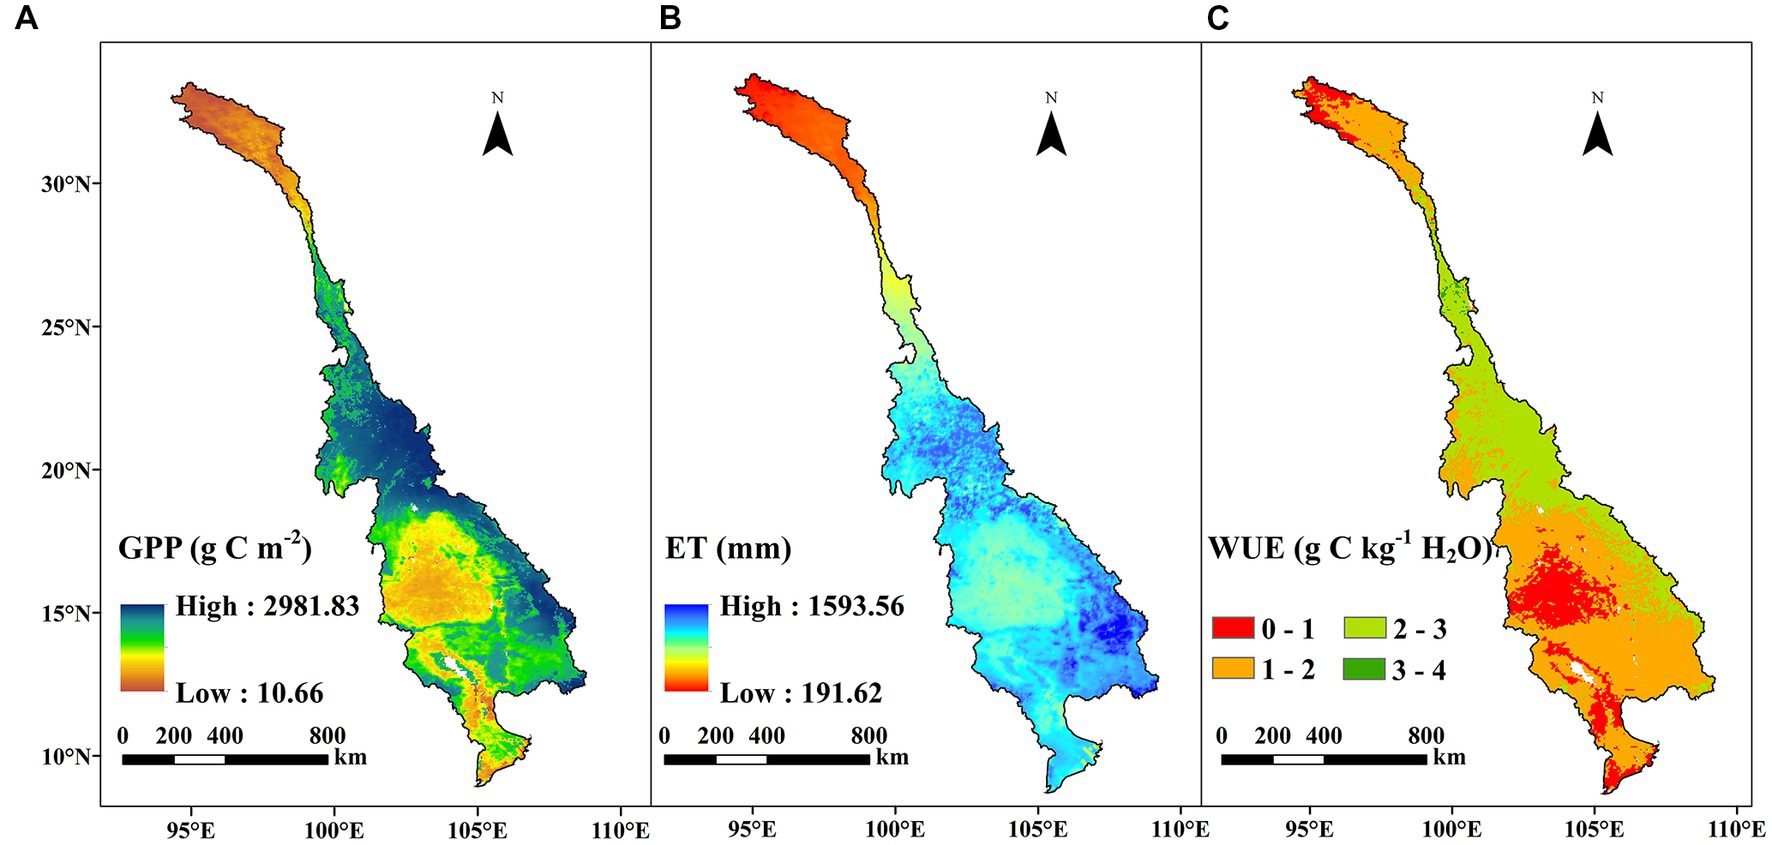
Figure 3. Spatial distributions of the mean yearly (A) GPP, (B) ET, and (C) WUE during 1982–2018 across the LMRB.
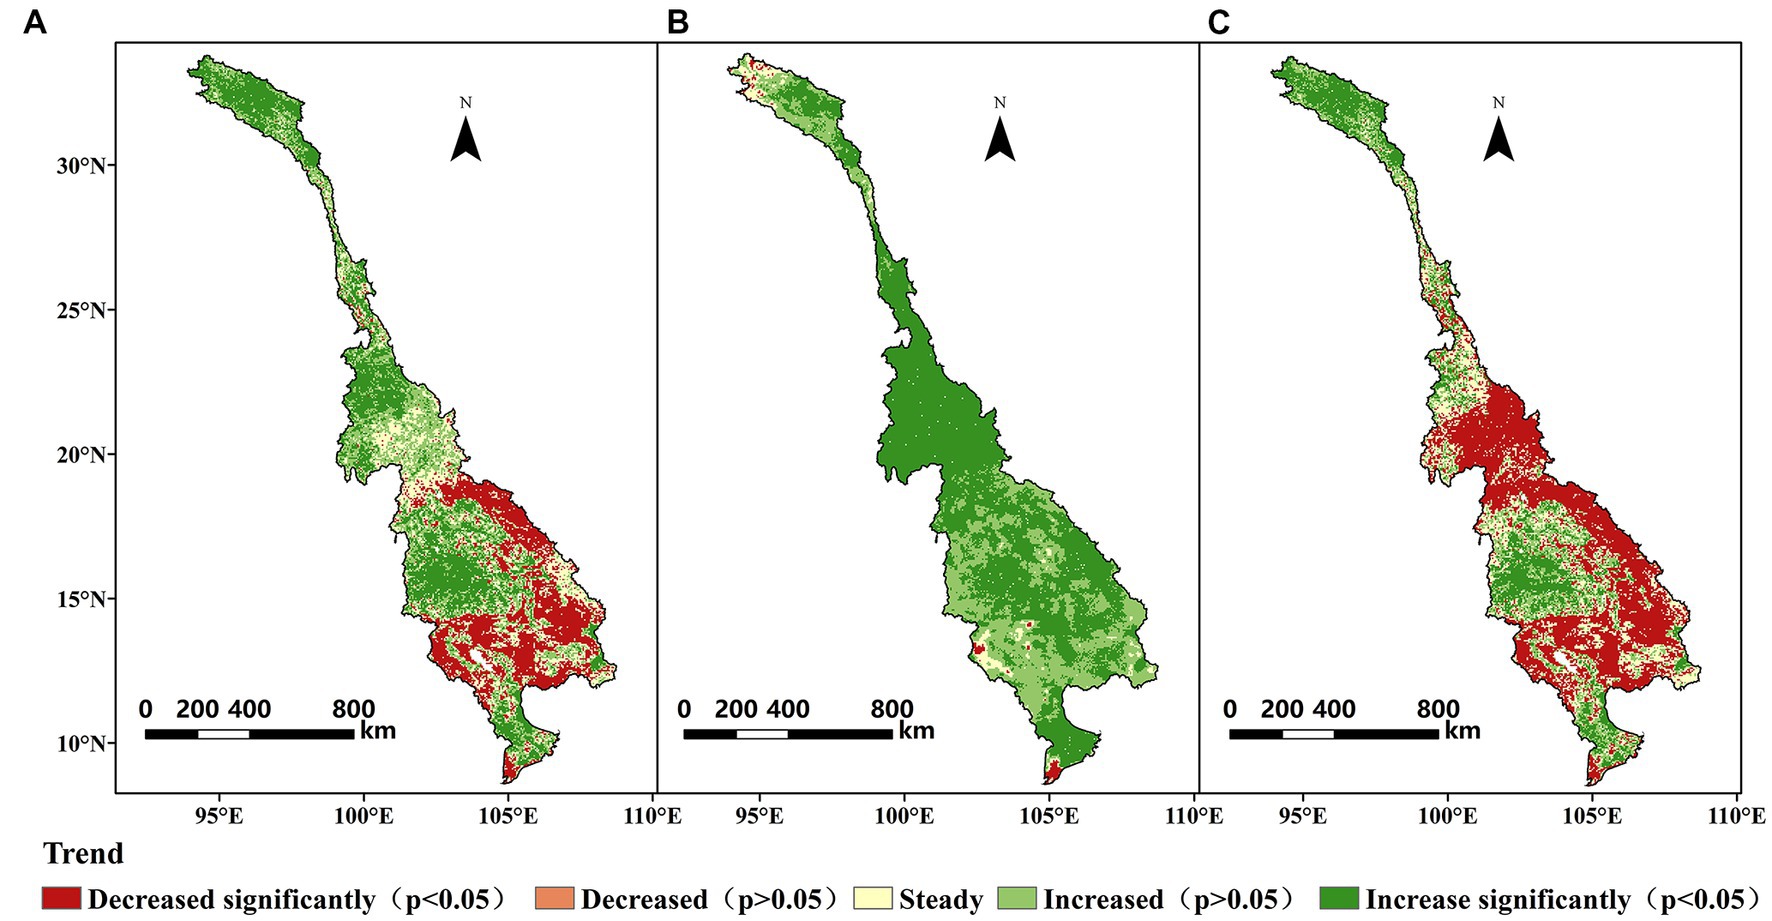
Figure 4. Temporal trends of the mean yearly (A) GPP, (B) ET, and (C) WUE during 1982–2018 across the LMRB.
The influencing factors of the spatial distribution of WUE were quantified by using GDM. All of the factors in Figure 5 have passed the significance test of 0.01. The larger the Q-value, the higher the contribution to WUE. Figure 5 indicates that TEM (Q = 0.80) was the most important factor affecting the spatial distribution of WUE in the LMRB, followed by VPD (Q = 0.78). In addition, TEM and LAI were the most significant interaction factors affecting WUE in the LMRB.
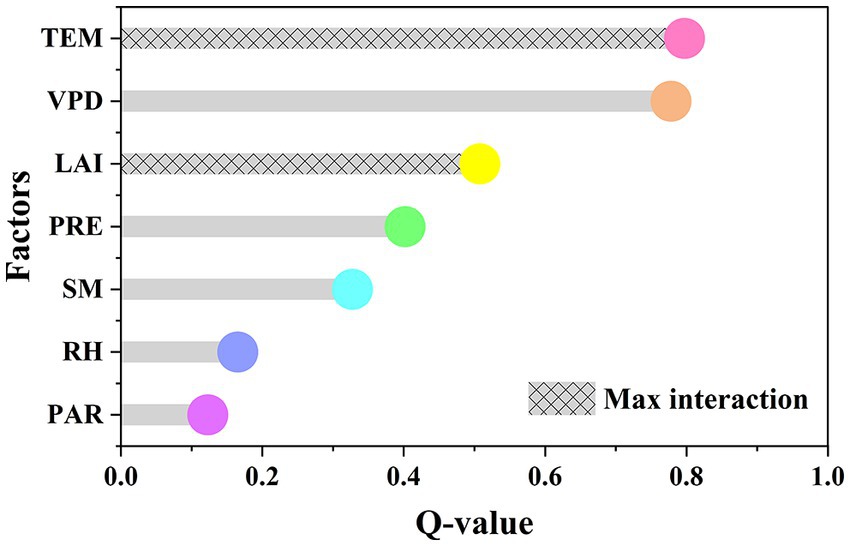
Figure 5. The extent of the impact of each factor driver on WUE across the LMRB.
3.2. Spatial and temporal variations in droughts
To investigate the temporal progression of droughts, a Hovmöller diagram of the SPEI was constructed for 1982–2018, using time scales ranging from 1- to 12-month (Figure 6A). Overall, the cumulative impacts of the SPEI became more visible with longer wet and dry periods as the time scale increased. The SPEI exhibited a discernible alternation between the periods of aridity and humidity. Several persistent drought episodes were identified in this study: 1982–1984, 1994–1996, 2004–2005, 2009–2010, and 2015–2016. Inter-annual variations in the extent of the drought-affected regions within the LMRB were observed between 1982 and 2018 (Figure 6B). In general, the area affected by drought accounted for more than 50% of the total area during 1983, 1994, 1998, and 2016. It is noteworthy that an impressive 75% of the region was affect during the drought event in 2015–2016. The drought areas were larger before 2000 than after 2000. During the 37-year study period, the drought frequency varied from 5.41 to 29.73% in the LMRB, with an average value of 17.31% (Figure 6C). In general, the drought prone areas were mainly distributed in the upstream and midstream region of the LRB, northern Laos, and eastern Cambodia, where the drought frequency was greater than 22%. In addition, compared with the lower Mekong River Basin (MRB), the LRB was more vulnerable to the droughts.
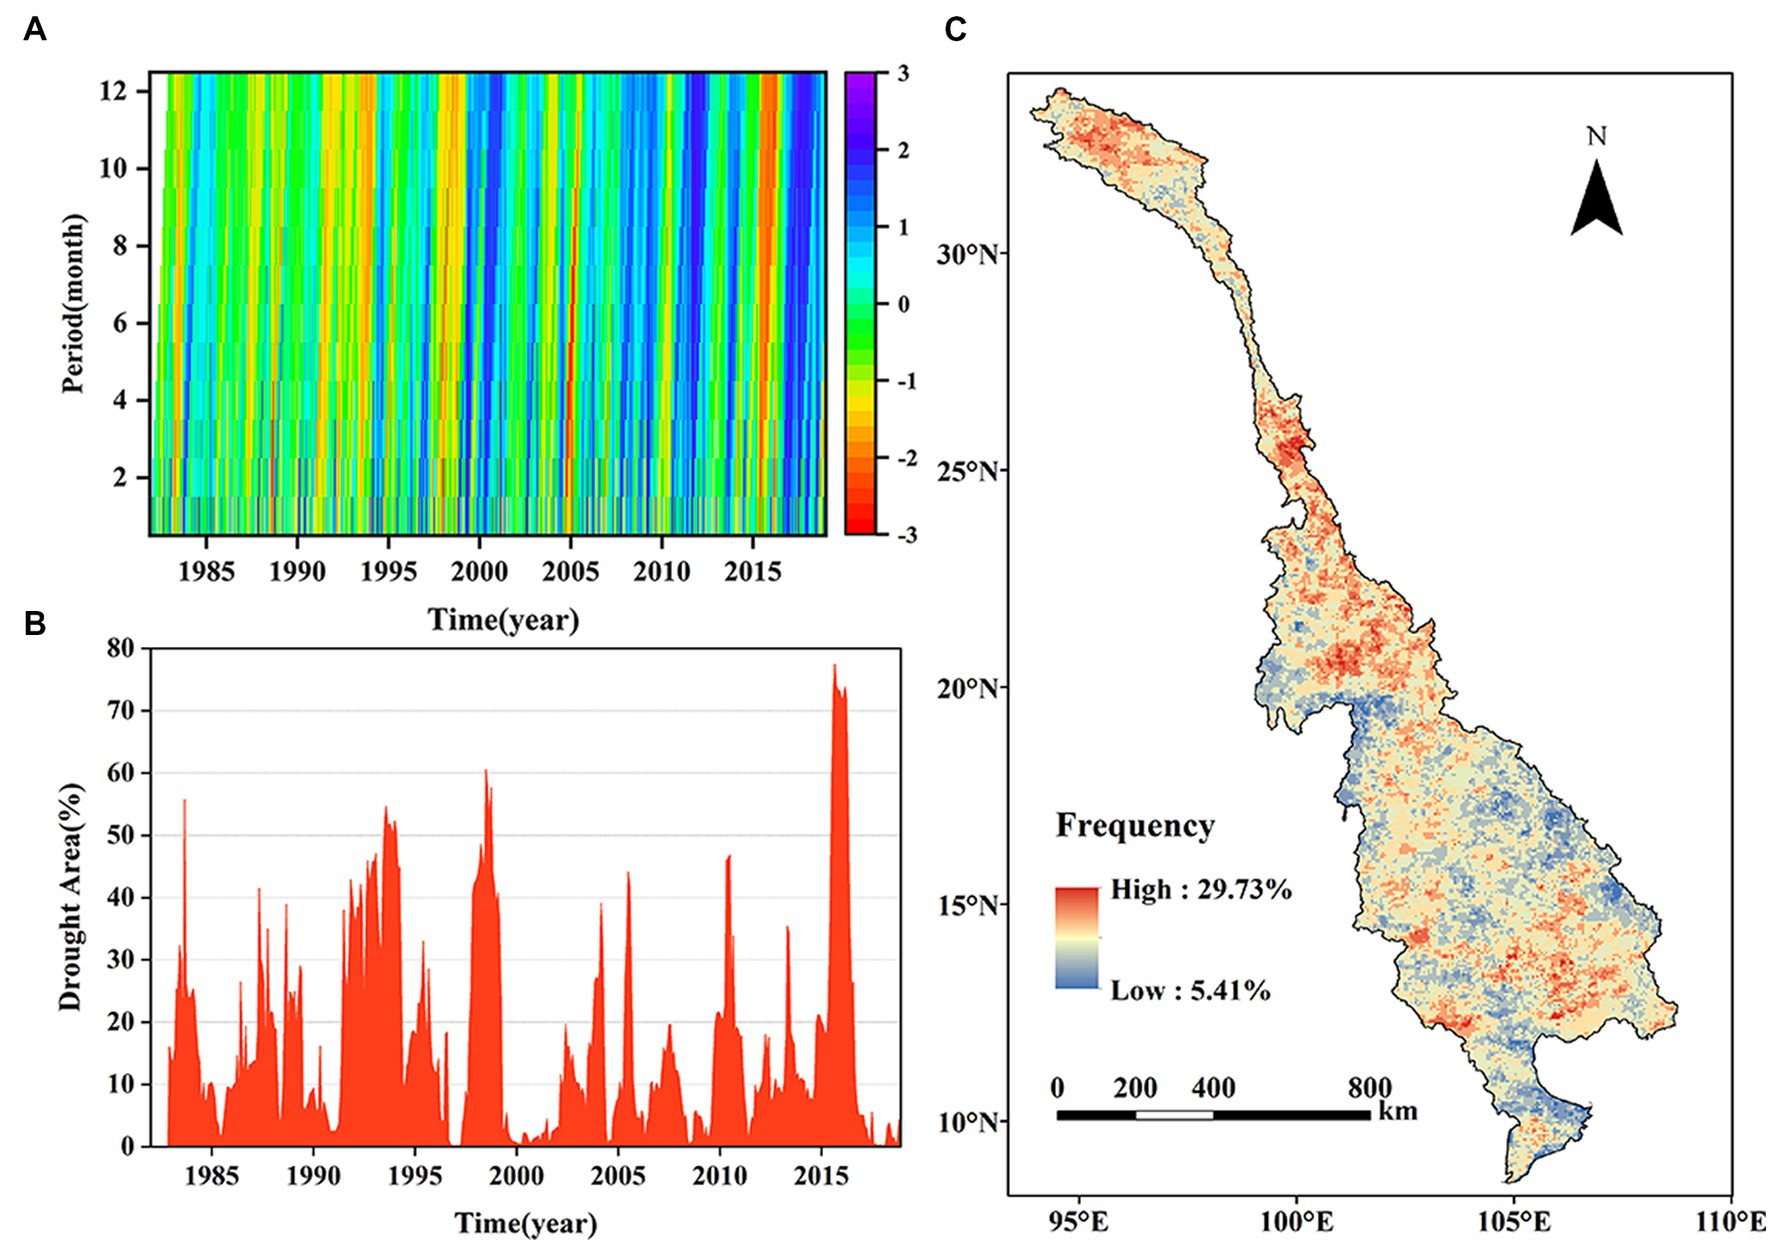
Figure 6. Spatial and temporal variations in droughts. (A) Hovmöller diagram of the SPEI at 1- to 12-month time scales. (B) Variations in the drought area. (C) Spatial distribution of the drought frequency.
3.3. Responses of the WUE to drought
In Figure 7A, the PCC between the annual WUE and SPEI is shown in terms of the spatial distribution. It can be seen that the PCC ranged from −0.7828 to 0.5818 across the LMRB, and approximately 10.39% of the entire area demonstrated a significant correlation, suggesting a robust response of the WUE to the drought. The negative correlations mainly occurred in the upstream region with a high-altitude cold climate, indicating that the WUE strengthened under drought conditions. The positive correlations were widely distributed in the lower LRB and the lower MRB with humid climates. The regions with significant positive correlations were concentrated in Laos, Thailand, and Cambodia, suggesting that drought weakened the WUE in these regions. Figure 7B shows the LT of the WUE’s response to drought. As shown in Figure 7B, drought had a significant lagged effect on the WUE in the LMRB. The LT was between 1 and 11 months, with clear spatial distribution patterns. In over 68.18% of the total study area, the WUE lagged behind the drought by 3 months. In the areas located upstream of the LRB and the Mekong Delta, the LT was relatively longer, indicating a slow response of the WUE to droughts.
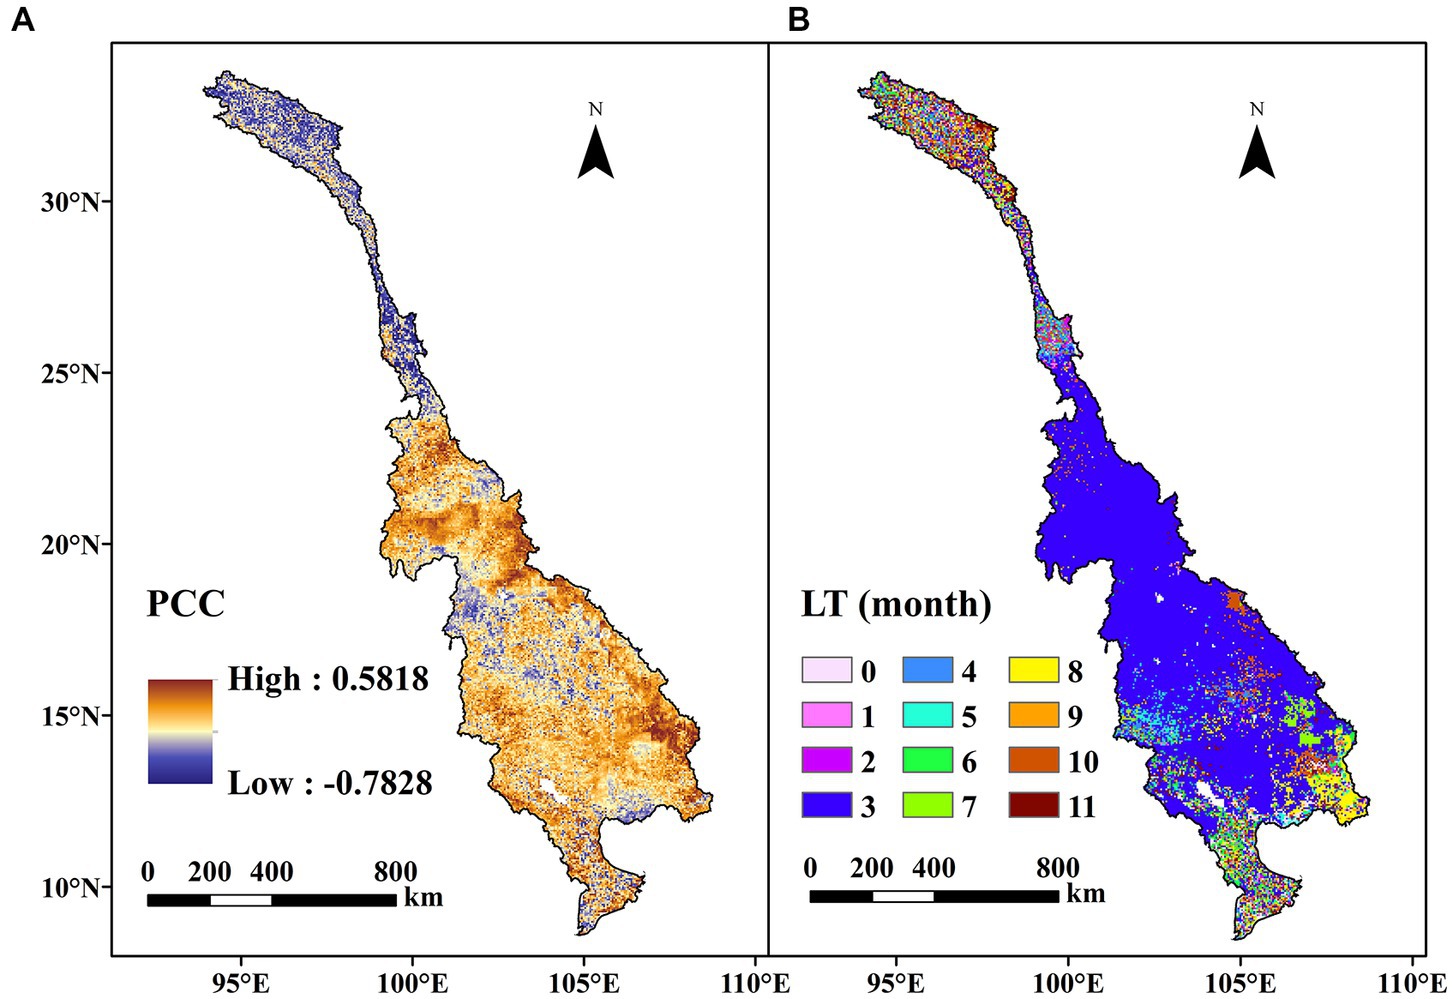
Figure 7. Spatial distributions of the (A) Pearson correlation coefficient (PCC) between the yearly WUE and SPEI, and (B) the lag time (LT) of the response of the WUE to drought.
The spatial distribution of the ecosystem resilience is shown in Figure 8. The concept of the ecosystem resilience index (Rd) pertains to the extent to which an ecosystem experiences the impact of drought stress and subsequently recuperates from it. The higher the Rd value is, the stronger the resilience of the ecosystem is. It can be seen that 38.90% of the total area was resilient to drought (Rd > 1). These regions were mainly found in Laos, suggesting that the ecosystems within this region were able to maintain their productivity by augmenting their WUE when water was scarce. Approximately 40.72 and 12.27% of the total area were slightly or moderately non-resilient, respectively, indicating that the productivity of the ecosystem was affected by drought disturbances. The severely non-resilient ecosystems were predominantly located in the upstream region and the Mekong Delta, accounting for 8.11% of the total area. These ecosystems were delicate and had a hard time adjusting to drought-related disturbances.
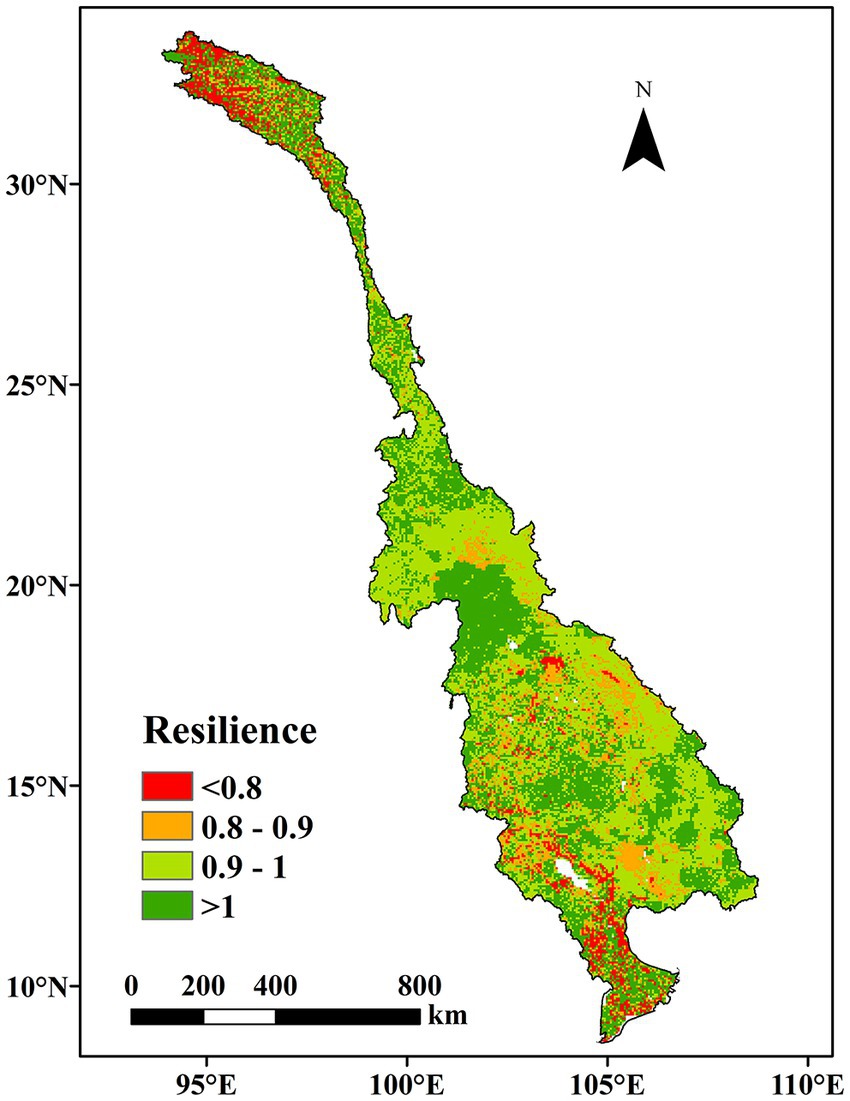
Figure 8. Spatial pattern of ecosystem resilience to drought based on the WUE.
3.4. Changes in the WUE and ecosystem resilience to the drought at different scales
Figure 9 shows the ET, GPP, WUE, and ecosystem resilience of the different land use types. In terms of the natural vegetation types, it was found that the mean yearly GPP and ET of the EBF (see abbreviations in Table 1) were higher than those of the other forest types, reaching 2575.71 g C m−2·yr−1 and 1257.51 mm·yr−1, respectively; however, the highest mean annual WUE values occurred in the ENF (2.53 g C kg−1 H2O). In contrast to the EBF, the ENF has a smaller leaf area and significantly smaller evaporation, and thus, it had a higher WUE. The mean yearly WUE of the GR (1.35 g C kg−1 H2O) was lower than all forest types. The mean yearly WUEs of the natural vegetation types were ranked as follows: ENF > MF > EBF > WS > SA > DBF > GR. For the other land use types, the mean annual WUE of the PW was low (less than 1 g C kg−1 H2O). This was because the PW had sufficient water and its evapotranspiration was relatively strong. The low values of the WUE observed in the context of the BAR can be attributed to the limited vegetation cover and high evaporation rates (Li G. et al., 2021). Moreover, the LMRB (especially the lower regions) exhibited a high proportion of CR (Figure 1), and its mean yearly WUE (1.09 g C kg−1 H2O) was only higher than that of the PW and the BAR, indicating that food production systems consume a lot of water in comparison to the carbon they gain. Non-productive phases with higher soil evaporation relative to permanent vegetation may also have an impact on CR’s lower annual WUE (Tang et al., 2014). The mean annual WUEs of the land use types were ranked as follows: CNV > UB > CR > BAR > PW. During the period of 1982–2018, the annual WUEs of the EBF, DBF, WS, SA, and PW exhibited significant downward trends; however, the GPP values remained largely unchanged, indicating that the decline in the WUE was due to an increase in ET. Additionally, the significant upward WUE trends of the GR, CNV, and BAR were primarily due to the increased GPP. Although the ET and the GPP of the CR both showed a significant increasing trend, WUE showed an insignificant increasing trend. This might be because the areas with more cropland in the lower LMRB tended to have higher air temperatures, which affected the photosynthesis and transpiration of crops at the same time and thus affected the WUE growth trend of crops. The ecosystem resilience of the CNV was greater than 1, indicating that it had a strong drought resistance. The other terrestrial ecosystems in the LMRB were found to be slightly non-resilient.
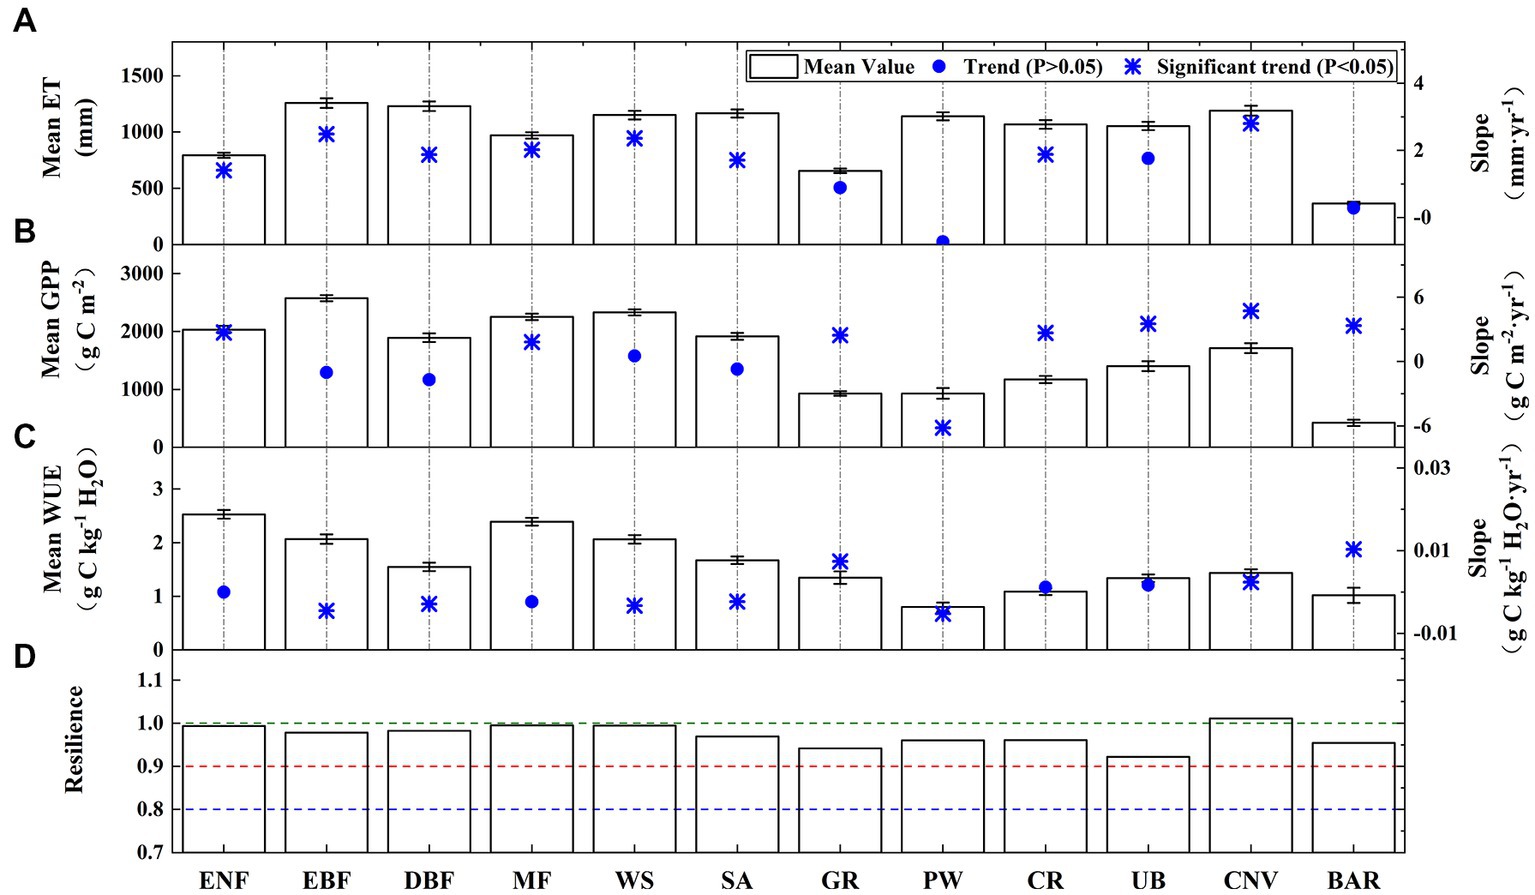
Figure 9. Means and trends of the (A) GPP, (B) ET, (C) WUE, and (D) ecosystem resilience for the different land use types.
Figure 10 shows the ET, GPP, WUE, and ecosystem resilience over the different climate types. The annual ET and GPP exhibited obvious differences in the various climate types. The highest ET occurred in the Am (see abbreviations in Table 1) (1246.16 mm), while the lowest ET was observed in the ETH (269.81 mm). The GPP was the highest in the Cwa (2592.82 g C m−2), while it was only 221.59 g C m−2 in the ETH. It was found that the yearly WUE was the highest in the Cfb zone (2.68 g C kg−1 H2O); however, the yearly WUE was low in the ETH (around 0.8 g C kg−1 H2O). The annual WUEs of the climate types were ranked as follows: Cfb > Dfb > Cwa > Cwb > Csb > Bsk > Am > Aw > Dwb > Dwc > ETH. Overall, the WUEs of the warm temperate climates (Cfb, Cwa, Cwb, and Csb) were higher than those of other climate types. The yearly WUE exhibited a significant decreasing trend in the Am, which was ascribed to a significant increase in the ET and a decrease in the GPP. In addition, the annual WUEs of the Bsk, Csb, Cwb, Dwb, Dwc, and ETH exhibited significant increasing trends, which was primarily attributed to the augmentation of the GPP. The ecosystem resilience of the Csb, Cwb, and Cfb was greater than 1, demonstrating the ecosystem’s resistance to the drought. However, the ecosystem resilience of the Dwc was only about 0.82, indicating that it was greatly affected by drought and had a poor resilience.
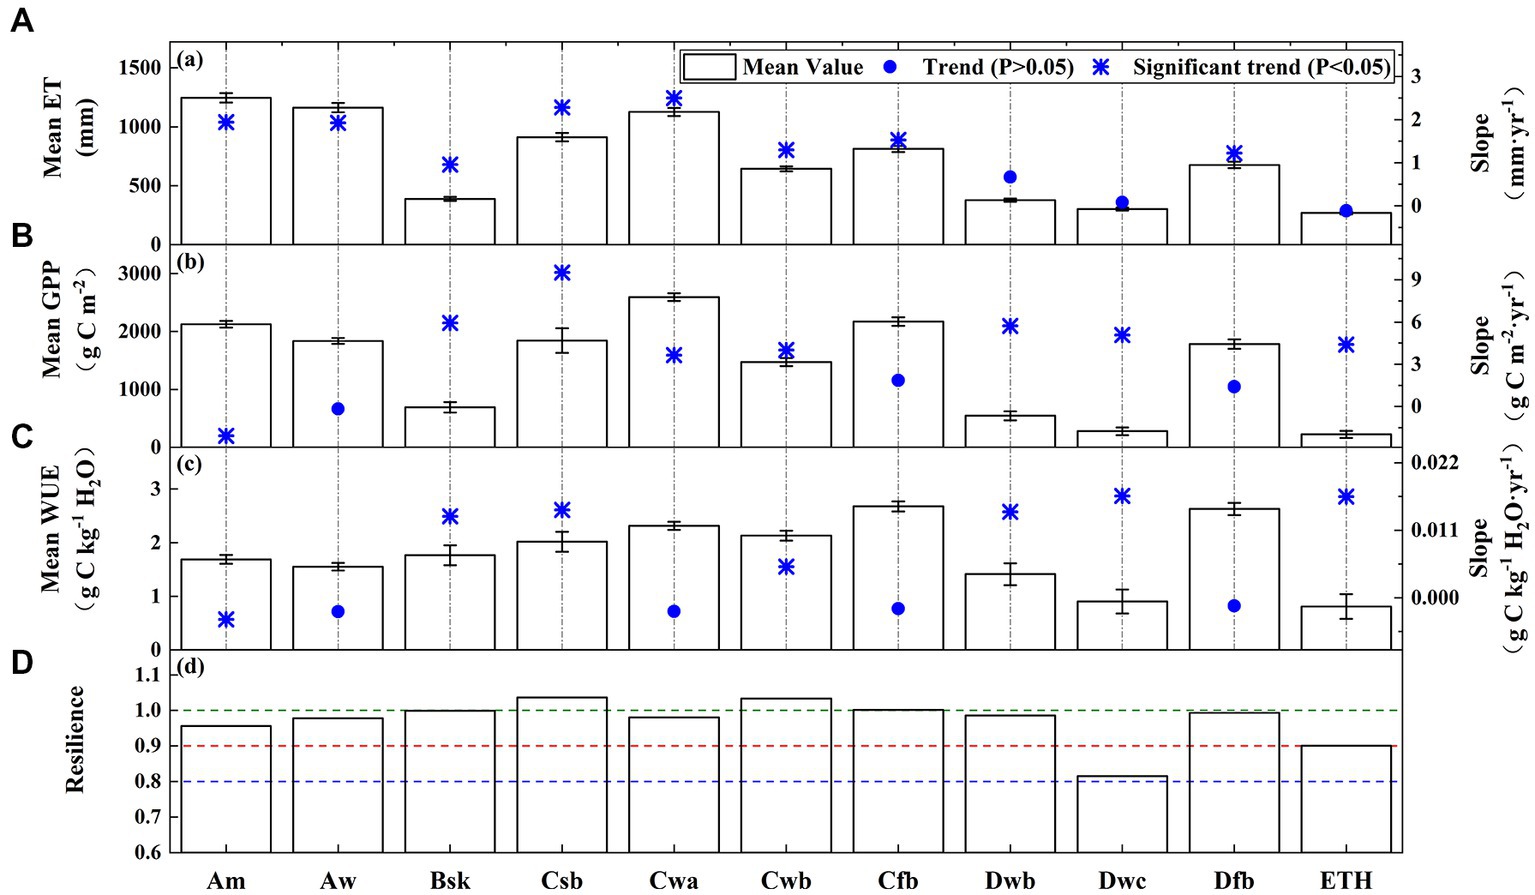
Figure 10. Means and trends of the (A) GPP, (B) ET, (C) WUE, and (D) ecosystem resilience for the different climate types.
Figure 11 shows the ET, GPP, WUE, and ecosystem resilience in different elevation gradients. Overall, the trends of the ET, GPP, and WUE initially increased and then decreased with increasing altitude. The regions below 2000 m had higher ET values (above 1,000 mm), while the regions above 3,500 m had smaller ET values (below 500 mm). The 1,000–1,500 m elevation areas had the highest yearly GPP (2612.84 g C m−2), whereas the areas above 5,000 m has the lowest annual GPP (219.89 g C m−2). The 500–3,500 m regions had relatively high WUEs (above 2.0 g C kg−1 H2O), and the lowest (0.69 g C kg−1 H2O) and highest (2.69 g C kg−1 H2O) values occurred in the >5,000 m and 2,500–3,000 m elevation gradient, respectively. The annual WUE in the <1,000 m elevation gradient exhibited a significant decreasing trend, which was primarily caused by the increase in the ET. In contrast, a significant increase in the WUE was occurred in the >3,500 m elevation gradients, which was mainly attributed to the increase in the GPP. With respect to the ecosystem resilience, the areas >5,000 m were severely non-resilient.
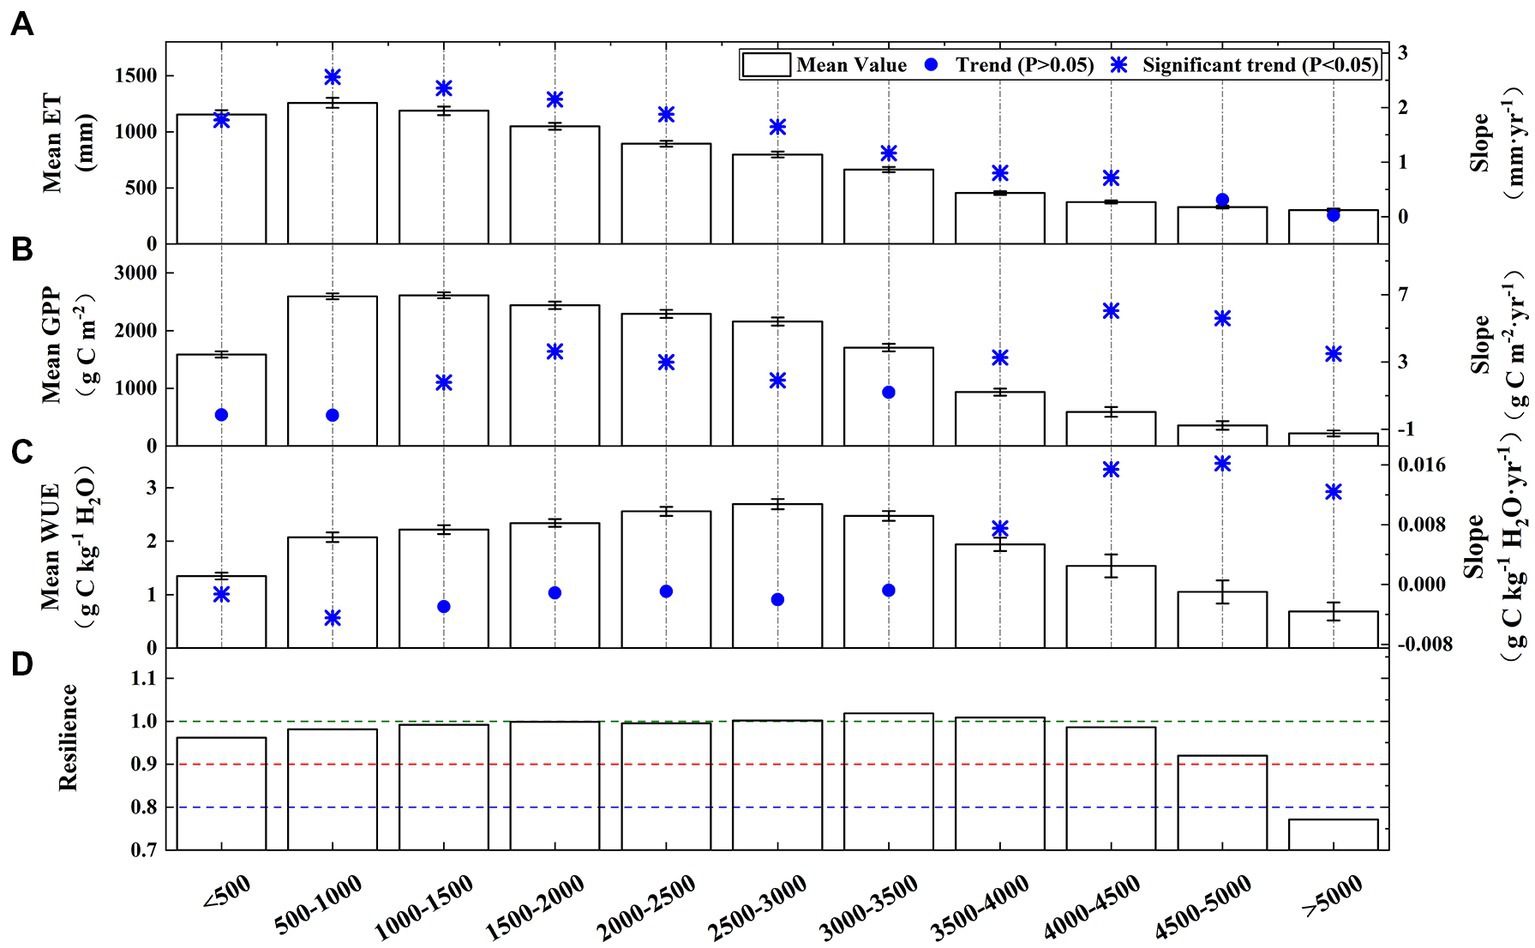
Figure 11. Means and trends of the (A) GPP, (B) ET, (C) WUE, and (D) ecosystem resilience for the different elevation gradients.
4. Discussion
On the basis of the GLASS GPP and ET, we estimated that the mean yearly WUE across the LMRB during 1982–2018 was 1.63 g C kg−1 H2O. Using a similar method, Wang L. et al. (2020) and Pokhrel et al. (2021) analyzed the ecosystem WUE of the surrounding regions and found that the multi-year averaged WUEs of Tibetan Plateau and China were 0.65 g C kg−1 H2O and 1.08 g C kg−1 H2O, respectively. They additionally reported an increase in the WUE over the study period in this region. Contrary to their findings, we found that the yearly WUE in the LMRB declined at a rate of −0.0009 g C kg−1 H2O·yr−1. The decline in the WUE in the LMRB was caused by an increase in the GPP, which was largely offset by an increase in ET under global warming.
The findings of our study indicate that TEM and VPD were important factors affecting the spatial distribution pattern of WUE in LMRB (Figure 5). Nandy et al. (2022) found similar results in India, where TEM was the most important driver of the WUE in forests. Jiang et al. (2019) also discovered that these two factors in the Pacific Northwest mainly controlled WUE on some short time scale. The mean yearly WUEs of the various types of vegetative cover differed, with forests having a greater WUE than grasslands and croplands having the lowest WUE (Figure 9). These findings are consistent with the global and Chinese trends of the average yearly WUE reported in prior scholarly works (Tang et al., 2014; Li G. et al., 2021). Nevertheless, other investigations conducted in China have reported that grasslands exhibited the lowest WUE values (Liu et al., 2015; Guo et al., 2019). The variation in the outcomes of these studies may be partially ascribed to the differences in the environmental circumstances, plant varieties, cultivation regions, and agronomic practices. In addition, the WUEs of the warm temperate climate types (Cfb, Cwa, Cwb, and Csb) were higher, while those of the cold and polar climate types (Dwe, Dwd, and EFH) were lower (Figure 10), which is consistent with previous finding at the global scale (Xia et al., 2015) and in India (Sharma and Goyal, 2018a). In arid ecosystems, the evaporation of water from bare soil, which is not necessarily linked to productivity, has a tendency to reduce the WUE in comparison to more humid regions (Sun et al., 2016). Overall, the WUE exhibited a decreasing trend that initially increased and then decreased with increasing elevation. The highest value occurred in the 2,500–3,000 m elevation gradient (2.69 g C kg−1 H2O) (Figure 11). These results are consistent with the results of Xue et al. (2015), that is, an inverse connection between the WUE and altitude across a global range of 1,150–5,000 m. Negative correlations were also discovered between the elevation gradient and the WUE in China (Zhu et al., 2015) and India (Nandy et al., 2022). The variations in the vegetation composition and climatic conditions with elevation gradients gave rise to distinct differences in the WUE at low and high elevations (Liu et al., 2020).
The spatial heterogeneity of the correlation between the WUE and drought was noteworthy and was attributable to the diverse vegetation, climate, and underlying surface properties. The positive correlations were mostly observed in the humid climate zones, while the negative correlations primarily occurred in the cold and dry regions (Figure 7). This result is in line with the findings of previous studies (Yang et al., 2016, 2021; Huang et al., 2017). In high-latitude regions and semi-arid/sub-humid zones, the correlation between the WUE and drought was influenced by the ET, while in tropical forests, it was mainly determined by the GPP (Yang et al., 2021). Plants in arid areas respond to moisture limitations more rapidly, with larger decreases in the ET than in the GPP, increasing the WUE (Guo et al., 2019). In contrast, plants in humid environments are less able to adjust to drought, so the dry conditions had a larger influence on the plant WUE (Zhao et al., 2021). Additionally, the lagged effect of drought on the WUE has been reported in previous studies (Liu et al., 2015; Yang et al., 2016; Huang et al., 2017; Ji et al., 2021). Our results indicate that the ecosystem WUE lagged behind the drought by 3 months in most regions of the LMRB. The lagged effect was more apparent in the grassland-dominated upstream region and cropland-dominated Mekong Delta. Comparable results were obtained by Liu et al. (2015), who revealed that the lagged influence of drought on the monthly WUE was relatively longer in regions in China that were dominated by farmland and grassland and shorter in regions that were predominantly forested.
Our results show that 38.90% of the total area was resilient to droughts (Figure 8). However, the ecosystem resilience varied with the land use, climate types, and elevation gradients. Regarding land use type, the ecosystem resilience of the CNV exhibited strong drought resistance, while the GR was less resistant to droughts (Figure 9), which is in line with the findings of Tian et al. (2011) and Guo et al. (2019), who reported that grassland is more vulnerable to drought in China and monsoonal Asia, and the main for this reason is that grassland has a low water storage capacity and shallow roots, so it is easily affected by fluctuations in the shallow soil water (Liu et al., 2021; Zhao et al., 2021). Regarding the climate type, the temperate climate types (Csb, Cwb, and Cfb) had a higher resilience, while the ecosystems in the cold and polar climate (Dwc) were severely non-resilient, which is consistent with the findings of Sharma and Goyal (2018a,b). Regarding elevation gradient, the areas above 4,500 m were less resistant to drought, and the vegetation composition and climate conditions in the high elevation area gave rise to poor resilience to drought.
In addition to climate change, previous studies have concluded that human activities also contribute to WUE changes. For example, Zheng et al. (2019) found that the main driver of the rising annual WUE of the ecosystem on the Chinese Loess Plateau is due to revegetation. According to Du et al. (2019), human activities, including afforestation, were responsible for around 16% of the WUE trends in northern China. On the basis of the findings of Wang L. et al. (2020), while human activities have had a negative impact on the WUE, with a reduction of 20.2%, the increase in the WUE on the Tibetan Plateau was primarily driven by climate change, with a contribution rate of 78.9%. Li G. et al. (2021) reported that the rise in the vegetation WUE in China from 2001 to 2014 was driven by human activities (66.75%) and climate change (33.25%). As a result, further investigation is warranted to examine how human activities and climate change will impact the WUE in the LMRB in the future.
It should be noted that our study still had several uncertainties. Even though the GLASS GPP and ET performed rather well in terms of spatial pattern and temporal dynamic (Zhao et al., 2013; Liang et al., 2021), the WUE trends calculated from GLASS had some discrepancies with other remote sensing-driven models (Yang et al., 2021). Additionally, high-resolution precipitation and PET information would surely aid in the monitoring of droughts. However, both satellite-based and model-based products were subject to inherent errors. For instance, the CHIRPS precipitation had high correlation coefficients with gauge observation, however, it tended to systematically overestimate precipitation in the upstream region and underestimate precipitation in the downstream region of the LMRB (Luo et al., 2019; Wu et al., 2019). The GLEAM-PET also was associated with errors due to the calculation methods and forcing data (Jiang et al., 2021). Moreover, the spatial interpolation of datasets with various spatial resolutions (e.g., the original spatial resolutions of GLASS, ERA5-land, and GLEAM are 0.05°, 0.1°, and 0.25°, respectively) may also cause uncertainties. To lessen uncertainty brought on by a single model or dataset, additional efforts must concentrate on integrating multiple datasets to better understand ecosystem WUE response to drought.
5. Conclusion
In this study, the spatiotemporal variations in the WUE and its response to drought in the LMRB from 1982 to 2018 were investigated. The changes in the WUE and ecosystem resilience to drought were then assessed in relation to land use types, climate types, and elevation gradient. The main findings of this study are as follows:
(1) The mean yearly WUE was 1.63 g C kg−1 H2O in the LMRB, and the forests and warm temperate climates had higher WUE values. The interaction of temperature and leaf area index were the main factor affecting the spatial distribution of WUE. The yearly WUE exhibited a decreasing trend with a rate of −0.0009 g C kg−1 H2O·yr−1 across the entire region, and 63.05% of the total area experienced a spatially decreasing WUE trend.
(2) The annual WUE was positively correlated with drought in the humid region, accounting for 66.55% of the total area, while it mainly exhibited a negative relationship in the high-altitude cold region.
(3) The ecosystem WUE lagged behind the drought by 3 months in most regions of the LMRB. The lagged effect was more apparent in the grassland-dominated upstream region and cropland-dominated Mekong Delta.
(4) The results of the resilience analysis suggest that the ecosystems in forests and temperate climates were strongly resistant to drought, while the grassland and high-altitude regions with dry and cold climates had a poor resilience.
Data availability statement
The original contributions presented in the study are included in the article/supplementary material, further inquiries can be directed to the corresponding author.
Author contributions
XL: investigation, methodology, formal analysis, and writing–review and editing. YW: data curation, software, and investigation and review. YL: supervision, conceptualization, writing–review and editing, project administration, and funding acquisition. All authors contributed to the article and approved the submitted version.
Funding
This work was sponsored by the National Natural Science Foundation of China (Grant No. 42067033) and Applied Basic Research Programs of Yunnan Province (Grant Nos. 202001BB050073 and 202101AT070075).
Conflict of interest
The authors declare that the research was conducted in the absence of any commercial or financial relationships that could be construed as a potential conflict of interest.
Publisher’s note
All claims expressed in this article are solely those of the authors and do not necessarily represent those of their affiliated organizations, or those of the publisher, the editors and the reviewers. Any product that may be evaluated in this article, or claim that may be made by its manufacturer, is not guaranteed or endorsed by the publisher.
Footnotes
References
Acuna, T. B., Lisson, S., Johnson, P., and Dean, G. (2015). Yield and water-use efficiency of wheat in a high-rainfall environment. Crop Pasture Sci. 66, 419–429. doi: 10.1071/cp14308
Broxton, P. D., Zeng, X., Sulla-Menashe, D., and Troch, P. A. (2014). A global land cover climatology using MODIS data. J. Appl. Meteorol. Climatol. 53, 1593–1605. doi: 10.1175/jamc-d-13-0270.1
Dai, A. (2012). Increasing drought under global warming in observations and models. Nat. Clim. Chang. 3, 52–58. doi: 10.1038/nclimate1633
du, X., Zhao, X., Zhou, T., Jiang, B., Xu, P., Wu, D., et al. (2019). Effects of climate factors and human activities on the ecosystem water use efficiency throughout northern China. Remote Sens. 11:2766. doi: 10.3390/rs11232766
Duan, Y., Ren, Z., and Sun, Y. (2020). Time-lay effects of climate on water use efficiency in the loess plateau of northern Shaanxi. Acta Ecol. Sin. 40, 3408–3419. doi: 10.5846/stxb201905110963
Funk, C., Peterson, P., Landsfeld, M., Pedreros, D., Verdin, J., Shukla, S., et al. (2015). The climate hazards infrared precipitation with stations--a new environmental record for monitoring extremes. Sci Data 2:150066. doi: 10.1038/sdata.2015.66
Gentine, P., Green, J. K., Guérin, M., Humphrey, V., Seneviratne, S. I., Zhang, Y., et al. (2019). Coupling between the terrestrial carbon and water cycles—a review. Environ. Res. Lett. 14:083003. doi: 10.1088/1748-9326/ab22d6
Guo, H., Bao, A., Liu, T., Ndayisaba, F., He, D., Kurban, A., et al. (2017). Meteorological drought analysis in the lower Mekong Basin using satellite-based long-term CHIRPS product. Sustainability 9:901. doi: 10.3390/su9060901
Guo, L., Sun, F., Liu, W., Zhang, Y., Wang, H., Cui, H., et al. (2019). Response of ecosystem water use efficiency to drought over China during 1982–2015: spatiotemporal variability and resilience. Forests 10:598. doi: 10.3390/f10070598
Hersbach, H., Bell, B., Berrisford, P., Biavati, G., Horányi, A., Muñoz Sabater, J., et al. (2023). ERA5 monthly averaged data on pressure levels from 1940 to present. Copernic. Clim. Change Serv. Clim. Data Store. doi: 10.24381/cds.6860a573
Huang, L., He, B., Han, L., Liu, J., Wang, H., and Chen, Z. (2017). A global examination of the response of ecosystem water-use efficiency to drought based on MODIS data. Sci. Total Environ. 601–602, 1097–1107. doi: 10.1016/j.scitotenv.2017.05.084
Huang, M., Piao, S., Zeng, Z., Peng, S., Ciais, P., Cheng, L., et al. (2016). Seasonal responses of terrestrial ecosystem water-use efficiency to climate change. Glob. Chang. Biol. 22, 2165–2177. doi: 10.1111/gcb.13180
Ingrisch, J., and Bahn, M. (2018). Towards a comparable quantification of resilience. Trends Ecol. Evol. 33, 251–259. doi: 10.1016/j.tree.2018.01.013
Ji, Y., Li, Y., Yao, N., Biswas, A., Zou, Y., Meng, Q., et al. (2021). The lagged effect and impact of soil moisture drought on terrestrial ecosystem water use efficiency. Ecol. Indic. 133:108349. doi: 10.1016/j.ecolind.2021.108349
Jiang, Y., Still, C. J., Rastogi, B., Page, G. F. M., Wharton, S., Meinzer, F. C., et al. (2019). Trends and controls on water-use efficiency of an old-growth coniferous forest in the Pacific northwest. Environ. Res. Lett. 14:074029. doi: 10.1088/1748-9326/ab2612
Jiang, S., Wei, L., Ren, L., Xu, C. Y., Zhong, F., Wang, M., et al. (2021). Utility of integrated IMERG precipitation and GLEAM potential evapotranspiration products for drought monitoring over mainland China. Atmos. Res. 247:105141. doi: 10.1016/j.atmosres.2020.105141
Jiao, X. C., Song, X. M., Zhang, D. L., Du, Q. J., and Li, J. M. (2019). Coordination between vapor pressure deficit and CO(2) on the regulation of photosynthesis and productivity in greenhouse tomato production. Sci. Rep. 9:8700. doi: 10.1038/s41598-019-45232-w
Kang, W., and Kang, S. (2019). On the use of alternative water use efficiency parameters in dryland ecosystems: a review. Journal of. Ecol. Environ. 43, 1–8. doi: 10.1186/s41610-019-0122-7
Knyazikhin, Y., Glassy, J., Privette, J. L., Tian, Y., Lotsch, A., Zhang, Y., et al. (1999). MODIS leaf area index (LAI) and fraction of Photosynthetically active radiation absorbed by vegetation (FPAR) product (MOD15) algorithm theoretical basis document. Available at: http://eospso.gsfc.nasa.gov/atbd/modistables.html.
Li, G., Chen, W., Li, R., Zhang, X., and Liu, J. (2021). Assessing the spatiotemporal dynamics of ecosystem water use efficiency across China and the response to natural and human activities. Ecol. Indic. 126:107680. doi: 10.1016/j.ecolind.2021.107680
Li, Y., Lu, H., Yang, K., Wang, W., Tang, Q., Khem, S., et al. (2021). Meteorological and hydrological droughts in Mekong River Basin and surrounding areas under climate change. J. Hydrol. Reg. Stud. 36:100873. doi: 10.1016/j.ejrh.2021.100873
Li, Y., Zhang, K., and Liu, L. (2023). Water use efficiency at multi-time scales and its response to episodic drought and wet periods in a typical subtropical evergreen forest of Southeast China. Ecol. Indic. 151:110254. doi: 10.1016/j.ecolind.2023.110254
Liang, S. L., Cheng, J., Jia, K., Jiang, B., Liu, Q., Xiao, Z., et al. (2021). The global land surface satellite (GLASS) product suite. Bull. Am. Meteorol. Soc. 102, E323–E337. doi: 10.1175/Bams-D-18-0341.1
Lin, Y., Grace, J., Zhao, W., Dong, Y., Zhang, X., Zhou, L., et al. (2018). Water-use efficiency and its relationship with environmental and biological factors in a rubber plantation. J. Hydrol. 563, 273–282. doi: 10.1016/j.jhydrol.2018.05.026
Liu, N., Sun, P., Caldwell, P. V., Harper, R., Liu, S., and Sun, G. (2020). Trade-off between watershed water yield and ecosystem productivity along elevation gradients on a complex terrain in southwestern China. J. Hydrol. 590:125449. doi: 10.1016/j.jhydrol.2020.125449
Liu, W., Sun, F., Sun, S., Guo, L., Wang, H., and Cui, H. (2019). Multi-scale assessment of eco-hydrological resilience to drought in China over the last three decades. Sci. Total Environ. 672, 201–211. doi: 10.1016/j.scitotenv.2019.03.408
Liu, Y., Xiao, J., Ju, W., Zhou, Y., Wang, S., and Wu, X. (2015). Water use efficiency of China's terrestrial ecosystems and responses to drought. Sci. Rep. 5:13799. doi: 10.1038/srep13799
Liu, Y., Zhou, R., Wen, Z., Khalifa, M., Zheng, C., Ren, H., et al. (2021). Assessing the impacts of drought on net primary productivity of global land biomes in different climate zones. Ecol. Indic. 130:108146. doi: 10.1016/j.ecolind.2021.108146
Luo, X., Wu, W., He, D., Li, Y., and Ji, X. (2019). Hydrological simulation using TRMM and CHIRPS precipitation estimates in the lower Lancang–Mekong River Basin. Chin. Geogr. Sci. 29, 13–25. doi: 10.1007/s11769-019-1014-6
Malone, S. L., Tulbure, M. G., Pérez-Luque, A. J., Assal, T., Bremer, L. L., Drucker, D. P., et al. (2016). Drought resistance across California ecosystems: evaluating changes in carbon dynamics using satellite imagery. Ecosphere 7:e01561. doi: 10.1002/ecs2.1561
Martens, B., Miralles, D., Lievens, H., van der Schalie, R., de Jeu, R. A. M., Fernández-Prieto, D., et al. (2017). GLEAM v3: satellite-based land evaporation and root-zone soil moisture. Geosci. Model Dev. 10, 1903–1925. doi: 10.5194/gmd-10-1903-2017
Measho, S., Chen, B., Pellikka, P., Guo, L., Zhang, H., Cai, D., et al. (2021). Assessment of vegetation dynamics and ecosystem resilience in the context of climate change and drought in the horn of Africa. Remote Sens. 13:1668. doi: 10.3390/rs13091668
Medrano, H., Tomás, M., Martorell, S., Flexas, J., Hernández, E., Rosselló, J., et al. (2015). From leaf to whole-plant water use efficiency (WUE) in complex canopies: limitations of leaf WUE as a selection target. Crop J 3, 220–228. doi: 10.1016/j.cj.2015.04.002
Mekong River Commission. (2005). Overview of the hydrology of the Mekong Basin. Vientiane: Mekong River Commission.
Mishra, A. K., and Singh, V. P. (2010). A review of drought concepts. J. Hydrol. 391, 202–216. doi: 10.1016/j.jhydrol.2010.07.012
Muñoz Sabater, J. (2019). ERA5-land monthly averaged data from 1950 to present. Coperni. Clim. Change Serv. Clim. Data Store. doi: 10.24381/cds.68d2bb30
Myneni, R., and Knyazikhin, Y., Taejin Park - Boston University and MODAPS SIPS - NASA (2015). MOD15A2 MODIS/Terra leaf area index/FPAR 8-day L4 global 1km SIN grid. NASA LP DAAC. doi: 10.5067/MODIS/MOD15A2.006
Nandy, S., Saranya, M., and Srinet, R. (2022). Spatio-temporal variability of water use efficiency and its drivers in major forest formations in India. Remote Sens. Environ. 269:112791. doi: 10.1016/j.rse.2021.112791
Peel, M. C., Finlayson, B. L., and McMahon, T. A. (2007). Updated world map of the Köppen-Geiger climate classification. Hydrol. Earth Syst. Sci. 11, 1633–1644. doi: 10.5194/hess-11-1633-2007
Pokhrel, Y., Felfelani, F., Satoh, Y., Boulange, J., Burek, P. A., Gädeke, A., et al. (2021). Global terrestrial water storage and drought severity under climate change. Nat. Clim. Chang. 11, 226–233. doi: 10.1038/s41558-020-00972-w
Qin, S., Ding, J., Ge, X., Wang, J., Wang, R., Zou, J., et al. (2023). Spatio-temporal changes in water use efficiency and its driving factors in Central Asia (2001–2021). Remote Sens. 15:767. doi: 10.3390/rs15030767
Sen, P. K. (1968). Estimates of the regression coefficient based on Kendall’s tau. J. Am. Stat. Assoc. 63, 1379–1389. doi: 10.2307/2285891
Sharma, A., and Goyal, M. K. (2018a). Assessment of ecosystem resilience to hydroclimatic disturbances in India. Glob. Chang. Biol. 24, e432–e441. doi: 10.1111/gcb.13874
Sharma, A., and Goyal, M. K. (2018b). District-level assessment of the ecohydrological resilience to hydroclimatic disturbances and its controlling factors in India. J. Hydrol. 564, 1048–1057. doi: 10.1016/j.jhydrol.2018.07.079
Song, Y., Wang, J., Ge, Y., and Xu, C. (2020). An optimal parameters-based geographical detector model enhances geographic characteristics of explanatory variables for spatial heterogeneity analysis: cases with different types of spatial data. GISci. Rem. Sens. 57, 593–610. doi: 10.1080/15481603.2020.1760434
Su, B., Huang, J., Mondal, S. K., and Tong, J. (2021). Insight from CMIP6 SSP-RCP scenarios for future drought characteristics in China. Atmos. Res. 250:105375. doi: 10.1016/j.atmosres.2020.105375
Sun, Y., Piao, S., Huang, M., Ciais, P., Zeng, Z., Cheng, L., et al. (2016). Global patterns and climate drivers of water-use efficiency in terrestrial ecosystems deduced from satellite-based datasets and carbon cycle models. Glob. Ecol. Biogeogr. 25, 311–323. doi: 10.1111/geb.12411
Tang, X., Li, H., Desai, A., Nagy, Z., Luo, J., Kolb, T. E., et al. (2014). How is water-use efficiency of terrestrial ecosystems distributed and changing on earth? Sci. Rep. 4:7483. doi: 10.1038/srep07483
Tian, H., Lu, C., Chen, G., Xu, X., Liu, M., Ren, W., et al. (2011). Climate and land use controls over terrestrial water use efficiency in monsoon Asia. Ecohydrology 4, 322–340. doi: 10.1002/eco.216
Tran, T. V., Tran, D., Myint, S., Latorre-Carmona, P., Ho, D. D., Tran, P. H., et al. (2019). Assessing spatiotemporal drought dynamics and its related environmental issues in the Mekong River Delta. Remote Sens. 11:2742. doi: 10.3390/rs11232742
Vicente-Serrano, S. M., Beguería, S., and López-Moreno, J. I. (2010). A multiscalar drought index sensitive to global warming: the standardized precipitation evapotranspiration index. J. Clim. 23, 1696–1718. doi: 10.1175/2009jcli2909.1
Vicente-Serrano, S. M., Quiring, S. M., Peña-Gallardo, M., Yuan, S., and Domínguez-Castro, F. (2020). A review of environmental droughts: increased risk under global warming? Earth Sci. Rev. 201:102953. doi: 10.1016/j.earscirev.2019.102953
Wang, J. F., Li, X. H., Christakos, G., Liao, Y. S., Zhang, T., Gu, X., et al. (2010). Geographical detectors-based health risk assessment and its application in the neural tube defects study of the Heshun region, China. Int. J. Geogr. Inf. Sci. 24, 107–127. doi: 10.1080/13658810802443457
Wang, L., Li, M., Wang, J., Li, X., and Wang, L. (2020). An analytical reductionist framework to separate the effects of climate change and human activities on variation in water use efficiency. Sci. Total Environ. 727:138306. doi: 10.1016/j.scitotenv.2020.138306
Wang, D., Liang, S., Zhang, Y., Gao, X., Brown, M. G. L., and Jia, A. (2020). A new set of MODIS land products (MCD18): downward shortwave radiation and photosynthetically active radiation. Remote Sens. 12:168. doi: 10.3390/rs12010168
Wang, F., Yang, H., Wang, Z., Zhang, Z., and Li, Z. (2019). Drought evaluation with CMORPH satellite precipitation data in the Yellow River Basin by using gridded standardized precipitation evapotranspiration index. Remote Sens. 11:485. doi: 10.3390/rs11050485
Wei, J., Chen, Y., Gu, Q., Jiang, C., Ma, M., Song, L., et al. (2019). Potential of the remotely-derived products in monitoring ecosystem water use efficiency across grasslands in northern China. Int. J. Remote Sens. 40, 6203–6223. doi: 10.1080/01431161.2019.1587208
Wu, W., Li, Y., Luo, X., Zhang, Y., Ji, X., and Li, X. (2019). Performance evaluation of the CHIRPS precipitation dataset and its utility in drought monitoring over Yunnan Province, China. Geomat. Nat. Haz. Risk 10, 2145–2162. doi: 10.1080/19475705.2019.1683082
Xia, L., Wang, F., Mu, X., Jin, K., Sun, W., Gao, P., et al. (2015). Water use efficiency of net primary production in global terrestrial ecosystems. J. Earth Syst. Sci. 124, 921–931. doi: 10.1007/s12040-015-0587-4
Xu, H., Wang, X., Zhao, C., and Zhang, X. (2019). Responses of ecosystem water use efficiency to meteorological drought under different biomes and drought magnitudes in northern China. Agric. For. Meteorol. 278:107660. doi: 10.1016/j.agrformet.2019.107660
Xue, B., Guo, Q., Otto, A., Xiao, J., Tao, S., and Li, L. (2015). Global patterns, trends, and drivers of water use efficiency from 2000 to 2013. Ecosphere 6:art174. doi: 10.1890/es14-00416.1
Yang, Y., Guan, H., Batelaan, O., McVicar, T. R., Long, D., Piao, S., et al. (2016). Contrasting responses of water use efficiency to drought across global terrestrial ecosystems. Sci. Rep. 6:23284. doi: 10.1038/srep23284
Yang, S., Zhang, J., Han, J., Wang, J., Zhang, S., Bai, Y., et al. (2021). Evaluating global ecosystem water use efficiency response to drought based on multi-model analysis. Sci. Total Environ. 778:146356. doi: 10.1016/j.scitotenv.2021.146356
Yang, S., Zhang, J., Zhang, S., Wang, J., Bai, Y., Yao, F., et al. (2020). The potential of remote sensing-based models on global water-use efficiency estimation: an evaluation and intercomparison of an ecosystem model (BESS) and algorithm (MODIS) using site level and upscaled eddy covariance data. Agric. For. Meteorol. 287:107959. doi: 10.1016/j.agrformet.2020.107959
Yi, C., and Jackson, N. (2021). A review of measuring ecosystem resilience to disturbance. Environ. Res. Lett. 16:053008. doi: 10.1088/1748-9326/abdf09
Zhang, M., Yuan, X., and Otkin, J. A. (2020). Remote sensing of the impact of flash drought events on terrestrial carbon dynamics over China. Carbon Balance Manag. 15:20. doi: 10.1186/s13021-020-00156-1
Zhao, J., Feng, H., Xu, T., Xiao, J., Guerrieri, R., Liu, S., et al. (2021). Physiological and environmental control on ecosystem water use efficiency in response to drought across the northern hemisphere. Sci. Total Environ. 758:143599. doi: 10.1016/j.scitotenv.2020.143599
Zhao, X., Liang, S., Liu, S., Yuan, W., Xiao, Z., Liu, Q., et al. (2013). The global land surface satellite (GLASS) remote sensing data processing system and products. Remote Sens. 5, 2436–2450. doi: 10.3390/rs5052436
Zhao, J., Xu, T., Xiao, J., Liu, S., Mao, K., Song, L., et al. (2020). Responses of water use efficiency to drought in Southwest China. Remote Sens. 12:199. doi: 10.3390/rs12010199
Zhao, A., Zhang, A., Cao, S., Feng, L., and Pei, T. (2020). Spatiotemporal patterns of water use efficiency in China and responses to multi-scale drought. Theor. Appl. Climatol. 140, 559–570. doi: 10.1007/s00704-020-03103-9
Zheng, H., Lin, H., Zhou, W., Bao, H., Zhu, X., Jin, Z., et al. (2019). Revegetation has increased ecosystem water-use efficiency during 2000–2014 in the Chinese loess plateau: evidence from satellite data. Ecol. Indic. 102, 507–518. doi: 10.1016/j.ecolind.2019.02.049
Zhou, R., Wang, H., Duan, K., and Liu, B. (2021). Diverse responses of vegetation to hydroclimate across temporal scales in a humid subtropical region. J. Hydrol. 33:100775. doi: 10.1016/j.ejrh.2021.100775
Keywords: water use efficiency, drought, lagged effect, ecosystem resilience, Lancang–Mekong River Basin
Citation: Luo X, Wang Y and Li Y (2023) Responses of ecosystem water use efficiency to drought in the Lancang–Mekong River Basin. Front. Ecol. Evol. 11:1203725. doi: 10.3389/fevo.2023.1203725
Edited by:
Jiefeng Wu, Nanjing University of Information Science and Technology, ChinaCopyright © 2023 Luo, Wang and Li. This is an open-access article distributed under the terms of the Creative Commons Attribution License (CC BY). The use, distribution or reproduction in other forums is permitted, provided the original author(s) and the copyright owner(s) are credited and that the original publication in this journal is cited, in accordance with accepted academic practice. No use, distribution or reproduction is permitted which does not comply with these terms.
*Correspondence: Yungang Li, eWdsaUB5bnUuZWR1LmNu