 Peter D. Billman
 Erik A. Beever
 Marie L. Westover4
- 1Department of Ecology and Evolutionary Biology, University of Connecticut, Storrs, CT, United States
- 2U.S. Geological Survey Northern Rocky Mountain Science Center, Bozeman, MT, United States
- 3Department of Ecology, Montana State University, Bozeman, MT, United States
- 4Department of Biological Sciences, Los Rios Community College District, Sacramento, CA, United States
- 5Department of Entomology, Purdue University, West Lafayette, IN, United States
Species distribution models (SDMs) have been widely employed to evaluate species–environment relationships. However, when extrapolated over broad spatial scales or through time, these models decline in their predictive ability due to variation in how species respond to their environment. Many models assume species–environment relationships remain constant over space and time, hindering their ability to accurately forecast distributions. Therefore, there is growing recognition that models could be improved by accounting for spatio-temporal nonstationarity – a phenomenon wherein the factors governing ecological processes change over space or time. Here, we investigated nonstationarity in American pika (Ochotona princeps) relationships with climatic variables in the Rocky Mountains (USA). We first compared broad-scale differences in pika–climate patterns for occupancy and population density across the Southern, Central, and Northern Rockies. Next, we investigated within-ecoregion variation across four mountain ranges nested within the Northern Rockies. Lastly, we tested whether species–climate relationships changed over time within the Central Rockies ecoregion. Across all analyses, we found varying levels of nonstationarity among the climate metrics for both occupancy and density. Although we found general congruence in temperature metrics, which consistently had negative coefficients, and moisture metrics (e.g., relative humidity), which had positive coefficients, nonstationarity was greatest for summer and winter precipitation over both space and time. These results suggest that interpretations from one ecoregion should not be applied to other regions universally – especially when using precipitation metrics. The within-ecoregion analysis found much greater variation in the strength-of-relationship coefficients among the four mountain ranges, relative to the inter-regional analysis, possibly attributable to smaller sample sizes per mountain range. Lastly, the importance of several variables shifted through time from significant to insignificant in the temporal analysis. Our results collectively reveal the overall complexity underlying species–environment relationships. With rapidly shifting conditions globally, this work adds to the growing body of literature highlighting how issues of spatio-temporal nonstationarity can limit the accuracy, transferability, and reliability of models and that interpretations will likely be most robust at local to regional scales. Diagnosing, describing, and incorporating nonstationarity of species–climate relationships into models over space and time could serve as a pivotal step in creating more informative models.
1 Introduction
Contemporary climate change continues to shape species’ distributions and biological communities globally. Observational and experimental studies have now documented responses spanning shifts in distributions, abundance, body size, phenology, behavior, and biotic interactions, among many others (Eastman et al., 2012; Thurman and Garcia, 2019; Goodman et al., 2022; Calabrese and Pfennig, 2023; Kerner et al., 2023). Shifts in distributions and declines in abundance have caused particular concern, given that both indicate species may not be evolving rapidly enough to cope with the impacts of recent climate change, thereby increasing risks of extirpation and extinction (Radchuk et al., 2019). Accordingly, understanding the underlying biological processes (i.e., mechanisms) that influence species responses remains a priority for management decision-making and species-distribution modeling efforts (Urban et al., 2016).
Pinpointing the factors that limit distributions, and how these factors vary in importance over space and time, has long been of interest in ecology (Darwin, 1859). To understand and model multidimensional niche spaces, species-specific life histories should be well understood; simultaneously, investigators should also consider how factors constraining populations might vary across temporal and spatial scales. For example, Brown (1984), emphasized that the abiotic factors constraining distributions differ between cool- and warm-edge range limits. Although rising temperatures may cause declines in occupancy at warm limits, they may concurrently allow greater survival and expansion beyond current cold-edge range limits (e.g., Sultaire et al., 2022). Given the recent motivation to identify evolutionary “winners’’ and “losers” under climate change based on biological traits, a binary classification of species’ vulnerability would be an oversimplification, considering that species often simultaneously benefit and suffer from climate shifts, depending on populations’ range position and numerous other factors (Somero, 2010). This, along with spatial variability in local adaptation, microrefugia, disturbances, and biotic interactions, may partially explain why species–climate relationships tend to be markedly heterogeneous over space and, thus, difficult to predict.
Given the large variability in the relative importance of environmental constraints across species ranges, species distribution models (SDMs) have recently sought to account for some of this heterogeneity (Peterson et al., 2011; Guisan et al., 2017; Martínez-Minaya et al., 2018). Broadly, correlative SDMs aim to statistically and spatially model distributions using known or suspected relationships between organisms and environmental conditions. One recent meta-analysis concluded that SDMs generally perform best when predicting species occurrences, but sequentially decline in predictive ability for population abundance, fitness, and genetic diversity (Lee-Yaw et al., 2022). Although SDMs have had increasing success (i.e., predictive accuracy) in recent years, one major limitation is they generally cannot be applied elsewhere in a species’ range other than where the training data originated (Charney et al., 2021; Rousseau and Betts, 2022). Mechanistic modeling offers an alternative to correlative approaches by modeling distributions based on individual-level, physiological processes that are hypothesized to constrain species (Riddell et al., 2017; Briscoe et al., 2022), such as water requirements necessary to dissipate heat (Riddell et al., 2019). Nonetheless, mechanistic models require high-quality biological data that explain how species experience their environment and are therefore limited by our understanding of how environmental factors actually constrain species (Kearney et al., 2010; Urban et al., 2016).
Both correlative and mechanistic modeling approaches currently struggle with accommodating nonstationarity, a phenomenon wherein ecological processes and relationships vary in strength, direction, and relative importance over space and time (Rollinson et al., 2021). Nonstationarity can arise from shifts in species’ relationships with environmental variables both spatially and temporally, as well as from shifts in environmental conditions. For example, one recent study found that snowshoe hares (Lepus americanus) are primarily constrained in their distribution by snow-cover duration, but the degree of the snow’s importance interacts strongly with maximum temperature across the species’ range (Sultaire et al., 2022). Mounting evidence suggests that due to widespread nonstationarity in ecological relationships, inferences from one time period and region should not be used to infer or predict range dynamics elsewhere or in other time periods (Pardi et al., 2020); accordingly, heavy reliance on range-wide distribution models could create the possibility of overgeneralizations and inaccurate models for more-localized climate-adaptation management and decision-making. Collectively, these observations raise the following questions: 1) What are the most appropriate scales to investigate to best understand species–environment relationships (e.g., Guisan et al., 2007), especially to be most useful for resource managers (Carroll et al., 2022)?; 2) Should future monitoring efforts ideally focus on local, regional, or continental scales?, and, accordingly, 3) Where should model training and validation data be acquired from (e.g., Scherrer et al., 2021)?; 4) When are SDMs transferable over time in a reliable manner (e.g., Smith et al., 2013)?; and 5) What range of environmental conditions are necessary to survey to ensure models are robust (e.g., Thuiller et al., 2004)? Ecological forecasts remain limited today by our overall nascent understanding of varying degrees of nonstationarity across both space and time, and climate is only one niche component that makes SDM transferability difficult (e.g., these models often ignore biotic interactions and habitat fragmentation and loss, Díaz et al., 2019).
Further complicating advances in forecasting climate-driven responses, rates of warming are remarkably heterogeneous over earth, with high-elevation and high-latitude regions generally experiencing much faster rates than elsewhere (Wang Q et al., 2016). For example, warming across four of earth’s largest mountain chains (the Alps, Andes, Himalayas, and Rockies) has been notably faster than surrounding lowlands, whereas differences in precipitation have been less consistent (Pepin et al., 2022). The variable rates of warming may therefore leave mountain-dwelling populations at greater risk relative to their low-elevation counterparts under shifting conditions. Complex topography in mountains provides a high diversity of local climates for species to exploit, highlighting how mountain systems may now act as exceptional testing grounds for questions related to ecological nonstationarity in species responses to climate over local and regional scales, as well as through time.
Here, we evaluate species–climate relationships using occupancy and population density data to evaluate the degree of spatiotemporal nonstationarity in a small mammal. To do so, we tested relationships at several scales including within ecoregions, across ecoregions, and over time, using the American pika (Ochotona princeps, Richardson, 1828) as our focal species. American pikas (“pikas,” hereafter) are small, climate-sensitive lagomorphs that occupy patchily distributed, broken-rock (e.g., talus) habitats in western North America, predominantly in mountainous areas (Hafner and Sullivan, 1995). We used a newly integrated dataset of occupied and historically occupied patches that were surveyed between 2011 and 2021. These data cover three expansive ecoregions, and all field surveys used identical sampling protocols. Because shifts in climate often cause contrasting demographic responses across seasons (e.g., Cordes et al., 2020), we examined both summer and winter metrics that we hypothesized act as proxies of specific, mechanism-based pathways that shape population dynamics (SI, Table 1). Accordingly, we incorporated seasonal metrics for temperature, precipitation, and moisture. In this study, we specifically predicted the following:
1. Across ecoregions, the strength and direction of climate relationships of both response metrics (occupancy and density) will exhibit high spatial nonstationarity, with coefficients displaying large variability within each climate metric.
2. Within an ecoregion, species–climate relationships will show higher congruence in strength and directionality among mountain ranges that are in close geographic proximity, compared to those further away.
3. Between two closely spaced time periods, the strength and direction of species–climate relationships will not change within each climate metric. In other words, such relationships will exhibit relative temporal stationarity.
2 Methods
2.1 Model organism
We focus on American pikas here given their often-high detectability (p > 0.90, Beever et al., 2010; Ray et al., 2016) as well as our ability to quantify population density from patch-level surveys using visual and auditory detections. Due to their limited physiological thermoregulation, pikas occupy broken-rock features, like talus fields and lavascapes, that buffer against fluctuating ambient temperatures (Benedict et al., 2020). This habitat is also readily delineated using satellite imagery prior to field surveys and persists over centuries to millennia with little structural change. Studies that have incorporated mechanistically-informed variables suggest that heat and cold stress are often the best predictors of pika distribution and density across various ecoregions (e.g., Beever et al., 2003; Wilkening et al., 2011; Johnston et al., 2019; Billman et al., 2021), and abundance has often been linked strongly to precipitation and water-balance (Beever et al., 2013; Johnston et al., 2019), highlighting the species’ overall responsiveness to the direct effects of weather and climate. In addition to direct exposure, the indirect effects of climate have also been found to shape occupancy and/or population density, such as precipitation’s role on the quality, diversity, and availability of forage (e.g., Erb et al., 2014; Ray et al., 2016; Varner et al., 2023). Although temperate mountain regions exhibit high seasonality throughout the year, pikas do not hibernate, which can leave them vulnerable to both winter conditions, such as low snowpack, and summer conditions. Due to numerous life-history characteristics, pikas appear to have a comparatively lower adaptative capacity in the face of climate change than many other montane mammals in western North America, making them an ideal model organism for testing climate-responsiveness theory and questions (Beever et al., 2023).
2.2 Field surveys: occupancy and population density
We surveyed for evidence of current or historical pika occupancy in talus patches across the Rocky Mountains (USA) between 2011 and 2021. Patches – each defined as a contiguous area of broken-rock habitat separated from all other such areas by >25 m – were identified using satellite imagery on the online mapping platform CalTopo.com prior to fieldwork. Field surveys occurred from June to September and were restricted to crepuscular hours, to achieve the highest detectability (few surveys between 12:00 and 16:00; these occurred only when conditions were cooler, with fully overcast skies). To survey, we walked 50-m transects across each talus patch, spaced 15 m apart elevationally, to obtain estimates of population density while avoiding double-counting individuals (# of pikas/50 m, sensu Beever et al., 2011). We considered a patch occupied if we unequivocally detected pikas visually, aurally, or if we found fresh haypiles with at least 10 fresh sprigs (green with chlorophyll) of herbaceous vegetation in them. A patch was considered historically occupied or extirpated if we only found old evidence such as old fecal pellets or degrading haypiles with no fresh vegetation present. Patches that appeared unoccupied were sampled with additional time and effort to be confident in their unoccupied classification. Additional information regarding field-survey protocol can be found in Beever et al. (2011; 2013) and Billman et al. (2021).
Our surveys spanned three scales to assess variability in species-climate relationships: inter-regional (among ecoregions), intra-regional (i.e., among mountain ranges within a single ecoregion), and between two sampling periods. The inter-regional comparison included data from the Southern Rockies (New Mexico), Central Rockies (Wyoming and Montana), and the Northern Rockies (Montana and Idaho) which represent three of six recognized lineages of O. princeps (Schmidt et al., in prep, Galbreath et al., 2010). Site-selection protocol differed slightly among ecoregions (e.g., elevational-transect design in Northern Rockies vs a near-census in Southern Rockies), so we provide an in-depth description of each region’s site-selection protocol in the Supplemental Information. The intra-regional dataset covers the Beaverhead Mountains, Italian Peaks, Lemhi Range, and the Tobacco Root Mountains nested within the Northern Rockies, which were surveyed in 2018–19. The temporal-analysis data were collected in the Central Rockies, with the “historical sampling period” spanning 2011–2016 and a “recent sampling period” from 2019–2021. These sites were all located within the Greater Yellowstone Ecosystem, including Yellowstone and Grand Teton National Park. All sites included in the temporal analysis were surveyed in both periods. However, several fewer sites were occupied in the latter period and excluded from the density analysis but retained (marked as unoccupied) in the occupancy analysis. Although these time periods seem relatively short when examining changes in occupancy, interannual patch turnover has been documented to be high for pikas in response to weather variability (e.g., Rodhouse et al., 2018). We excluded all talus patches without evidence of current or past pika occupancy, as these sites may not always have been structurally or otherwise suitable (following Billman et al., 2021). However, this may create minor differences between our study and others that have retained such no-evidence sites.
2.3 Climate data
Seasonal climate data were extracted from the standalone program, ClimateNA (Wang T et al., 2016). These data are locally downscaled from PRISM climate rasters using bilinear interpolation and account for site-specific elevation, latitude, and longitude. Summer (JJA) and winter conditions (DJF) are hypothesized to be the most stressful to pikas, so we extracted Summer: minimum, mean, and maximum temperature (respectively, Tmin, Tmean, Tmax), precipitation, relative humidity (RH), and climate moisture index (CMI), and Winter: Tmean and precipitation. We hypothesized each of these variables represents a mechanistic pathway of climatic influence on pikas. For example, winter precipitation (i.e., snowfall) has been shown to have a positive effect on site occupancy as higher snowpacks buffer pikas from sub-zero temperatures that occur above the snow (Beever et al., 2010; Johnston et al., 2019). Similarly, snowfall may be associated with higher population densities as heavy snowpacks provide a water source for high-quality forage in spring and summer in montane systems (Yandow et al., 2015). Full descriptions of the hypothesized mechanisms tied to each climate stressor can be found in Table 1 of the SI appendix.
For occupancy, we calculated the average climate conditions over the four years’ seasons prior to surveying. Winter metrics included the winter immediately preceding surveys and the previous three winters, whereas summer metrics comprised the previous four summers. The 4-year window minimized overlap in the temporal dataset in the Central Rockies (i.e., ~95% resurveys were 4+ years after initial surveys, mean = 5.2 years). We excluded current summer conditions for occupancy because a large proportion of surveys occurred in June, so current-season metrics would therefore represent future conditions (after surveys occurred) in many instances. For density predictors, we included only the winter conditions immediately preceding surveys, as well the previous year’s summer conditions (to avoid using data from after the date when a survey occurred in early summer).
2.4 Data analysis
For each region separately, climate metrics were scaled and centered using Z-scores to evaluate the relative importance of metrics that often differed by one to several orders of magnitude. Numerous studies have already sought to identify the top models and predictors of pika occupancy and density using multivariate modeling and AIC (e.g., Beever et al., 2011; Johnston et al., 2019; Billman et al., 2021), so we explicitly did not include that objective in this study. Rather, we examined the univariate effects of each climate variable on both responses. We used simple linear regression modeling for population density and logistic regression modeling for occupancy. As expected, density estimates showed a strong positive skew, so estimates were log-transformed to better meet the assumptions of parametric testing. We excluded unoccupied patches in the density analyses to differentiate the possible divergent drivers of occupancy and density. Given the species’ consistently high detectability (p ≥ 0.90, Beever et al., 2013; Ray et al., 2016), we used naive logistic regression models for occupancy, which assume perfect detectability (p = 1); naive models for this species have already been shown to be robust against parameter estimate bias in previous investigations (e.g., Rodhouse et al., 2010). We used the lm() function in base R for density analyses, and the glm() function in the lme4 package (Bates et al., 2015). All plots were created using ggplot2 (Wickham, 2011). Effect sizes and 95% confidence intervals were extracted from all model summaries. Coefficients for the logistic regression models are on the log-odds scale. Principal component analysis (PCA) plots were created using the ggfortify package (Tang et al., 2016), more specifically the prcomp() and autoplot() functions which scaled the eight climate variables prior to plotting (Figure 1). All analyses were conducted in R Statistical Software (v.4.2.2; R Core Team, 2021). Overall, we evaluated effect size strength (i.e., magnitude), directionality (+/−/non-significant if 95% CI included zero), and relative importance compared to other variables.

Figure 1 PCA plot illustrating the climate space of all sites across the three ecoregions. This PCA included all eight climate variables and explains 83.75% of the variance on the first two axes. For the Central Rockies cluster, we excluded the historical survey period to be more consistent with the timing of the surveying in the other two periods (~2016–2021).
3 Results
There was marked heterogeneity in species–climate relationships across space and time. We surveyed and included a total of 1,867 talus patches for the inter-ecoregional dataset, 734 patches for the intra-regional dataset in the Northern Rockies, and 264 patches for the temporal dataset in the Central Rockies. Inter-regionally, approximately 30% of sites (N = 565) were historically occupied (i.e., possibly extirpated). Patches were distributed between 1,381 and 3,884 m above sea level, and breakdowns of patch occupancy by region and mountain range can be found in Table 2 of the SI Appendix. Patch sizes ranged from 1 pika home range (~315 m2, ~20-m-diameter circle) to patches in Grand Teton NP that spanned >1 km2. Lastly, patch-level population densities ranged from 0.23 to 4.0 pikas/50 m surveyed.
3.1 Inter-regional analysis
Across the three ecoregions, occupancy and density were all significantly negatively associated with the four temperatures metrics (mean β coefficient ± 1 SD; occupancy: −0.90 ± 0.21, density: −0.23 ± 0.08) and positively associated with the two moisture metrics (RH and CMI, mean β coefficient ± SD; occupancy: 0.62 ± 0.25; density: 0.25 ± 0.11). However, there was more nonstationarity in precipitation metrics across space than other metrics (Figure 2). Winter precipitation (i.e., snowfall) was positively associated with both responses in the Northern and Central Rockies, but unexpectedly not in the Southern Rockies. On the other hand, summer precipitation was only positively associated with both response metrics in the Northern Rockies, as well as occupancy in the Southern Rockies, but there were no relationships between summer precipitation and density in the Southern Rockies and both responses in the Central Rockies. The overall strength of species–climate relationships was stronger in the Northern and Central Rockies relative to the Southern Rockies. Notably, the precision of coefficient estimates did not consistently increase with greater sample sizes across regions.
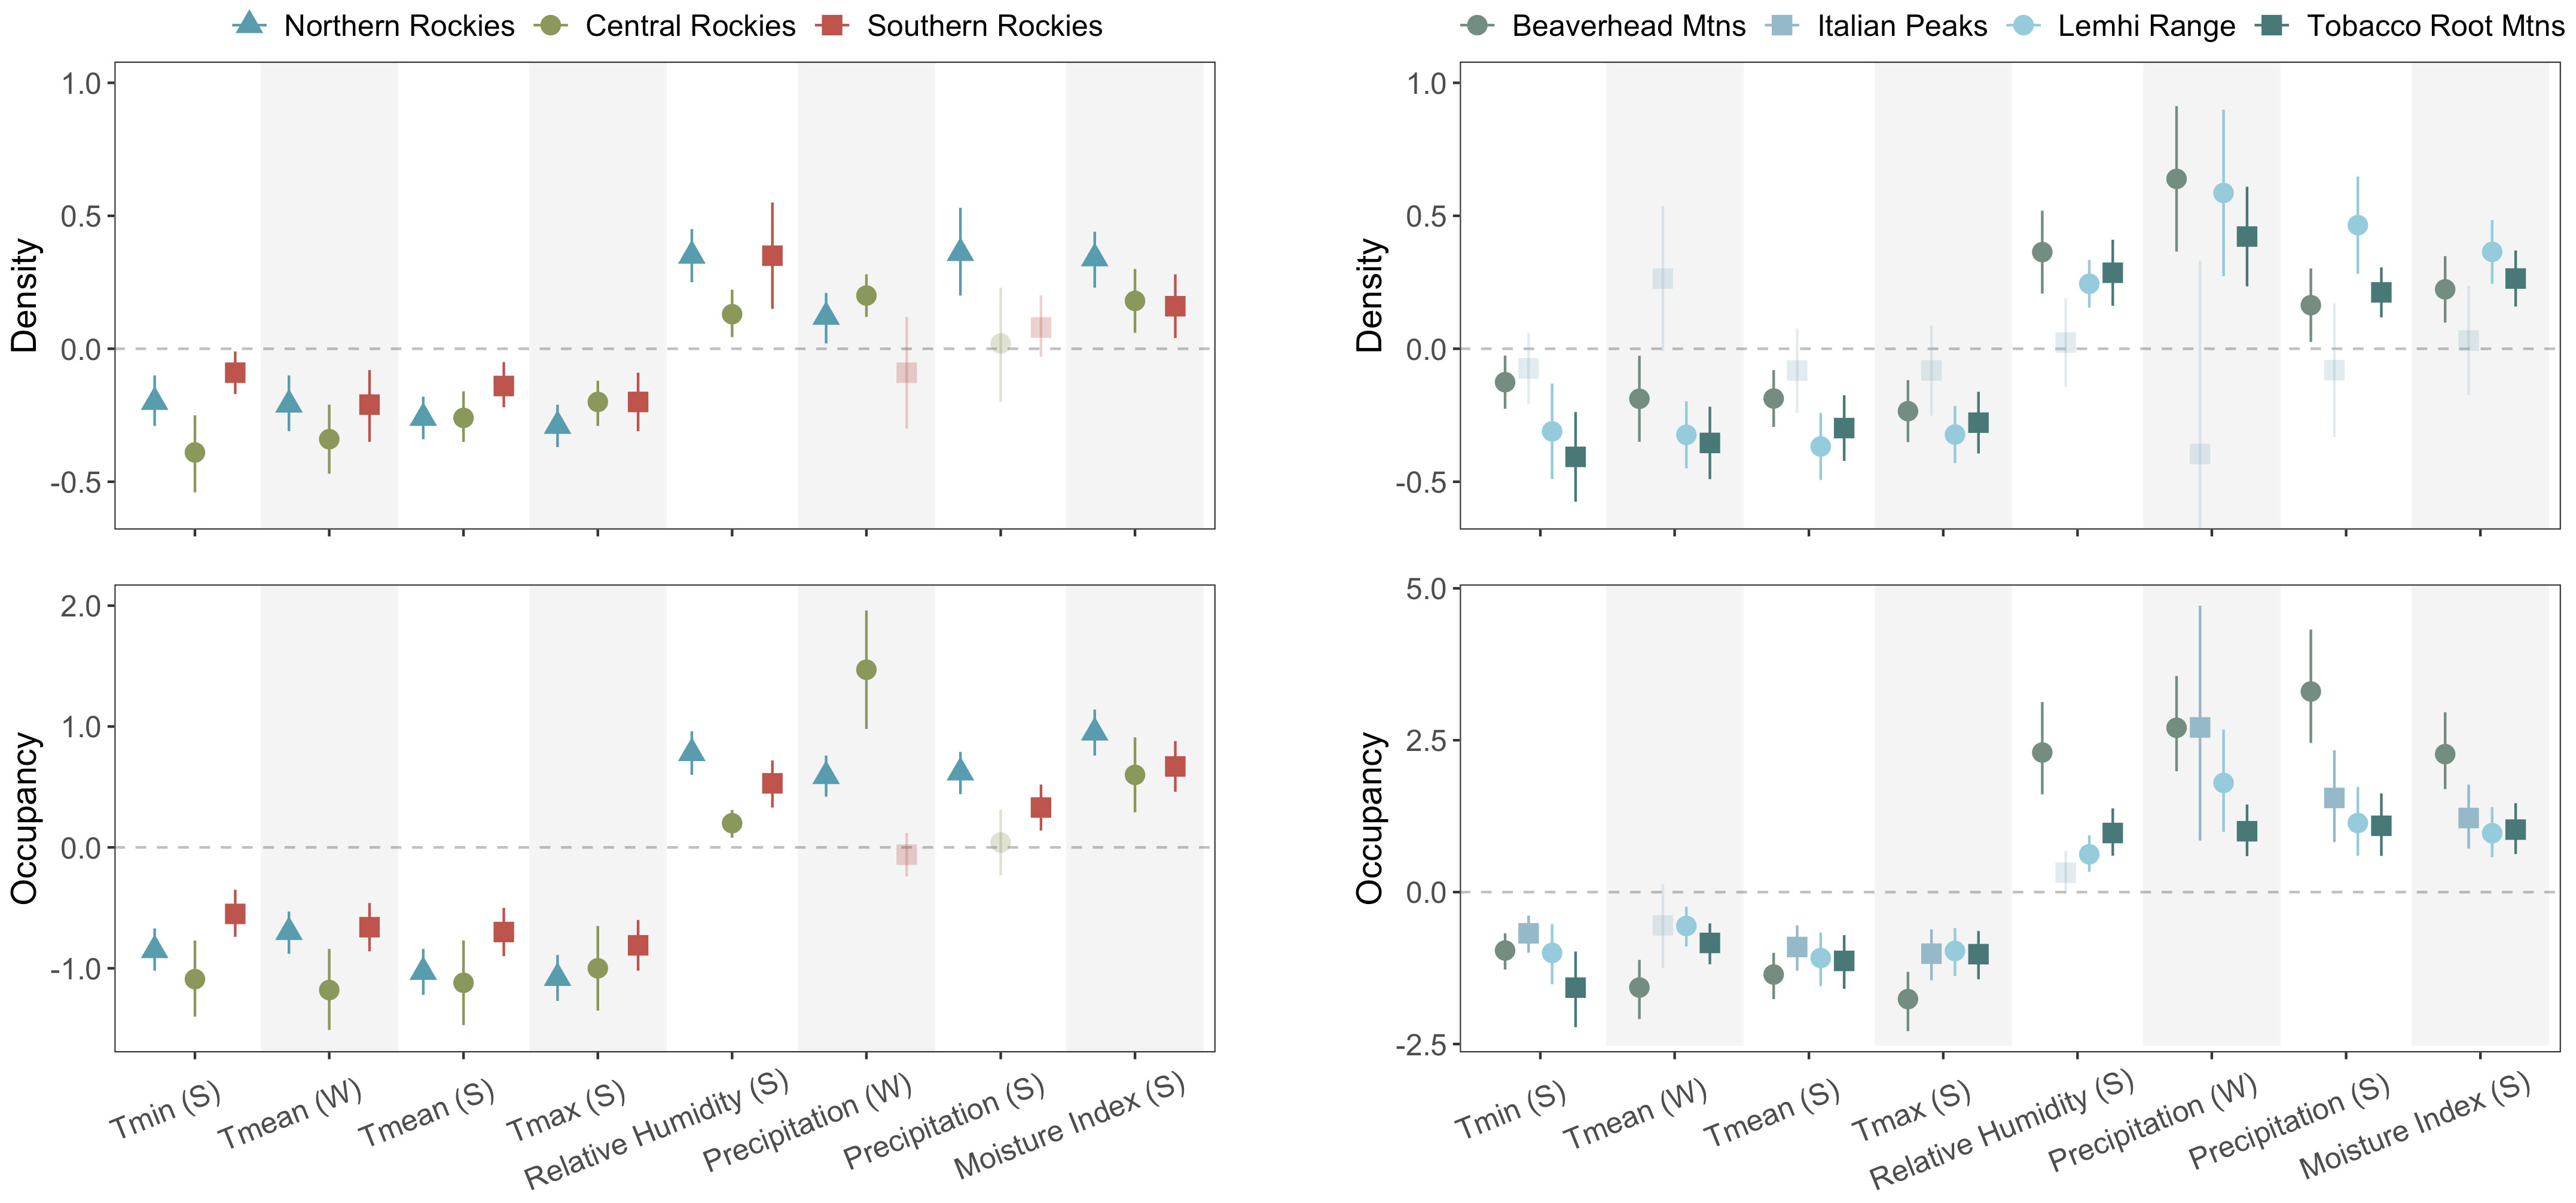
Figure 2 Coefficient estimates from univariate parameter estimates by climate metric and season in parentheses (S = summer, W = winter) for inter- and intra-regional analyses. Significant relationships between each response and climate variable (CIs do not overlap 0) are colored and opaque, whereas insignificant relationships (CIs overlap 0) are partially transparent. Coefficient estimates above the horizontal zero line suggest that variable has a positive effect on occupancy and density, and vice versa for estimates below the line. The cropped lower CI limit for the Italian Peaks’ winter precipitation for density extends down to −1.12.
3.2 Intra-regional analysis
All relationships coefficients were significant and consistent in directionality (within variables) across mountain ranges, with the exception of all Italian Peaks density variables, and Tmean in winter and relative humidity in summer for occupancy (Figure 2). Temperature was, again, consistently negative for both response metrics (when excluding the Italian Peaks, for density). Moisture and precipitation metrics were all positively associated with occupancy and density, as hypothesized (when excluding the Italian Peaks). For occupancy, the Beaverhead Mountains overwhelmingly displayed stronger species–climate relationships (i.e., larger coefficients) than did the other three mountain ranges, with only a few exceptions (Figure 2). Overall, coefficients showed a greater range across the various climate metrics in the intra-regional analysis relative to the inter-regional analysis (occupancy: inter-regional range = −1.18 to 1.47, intra-regional range = −1.76 to 3.30; density: inter-regional range = −0.39 to 0.36, intra-regional range = −0.41 to 0.64).
3.3 Temporal analysis
Similar to the inter- and intra-regional analyses, temperature consistently had a negative effect on both occupancy and density over time, with the exception of Tmax in summer for density (Figure 3). Variability in the strength of relationships to temperature was notably greater for density than for occupancy. Relative humidity was significant only in the historical sampling period for both response metrics. Climate moisture index was positively associated with occupancy in both periods and density in the historical period, but negatively associated with density in the current period. Winter precipitation (i.e., snowfall) consistently had a positive effect on both responses in both periods, whereas summer precipitation had no effect on occupancy in either period, and was only significant for density in the current period. However, this summer-precipitation effect on density was surprisingly negative (β = −0.38, 95% CI: −0.52 to −0.23). Overall, there was lower congruency in the strength and directionality than expected between the two time periods that were only several years apart (e.g., only ~69% of cases showed consistent directionality).
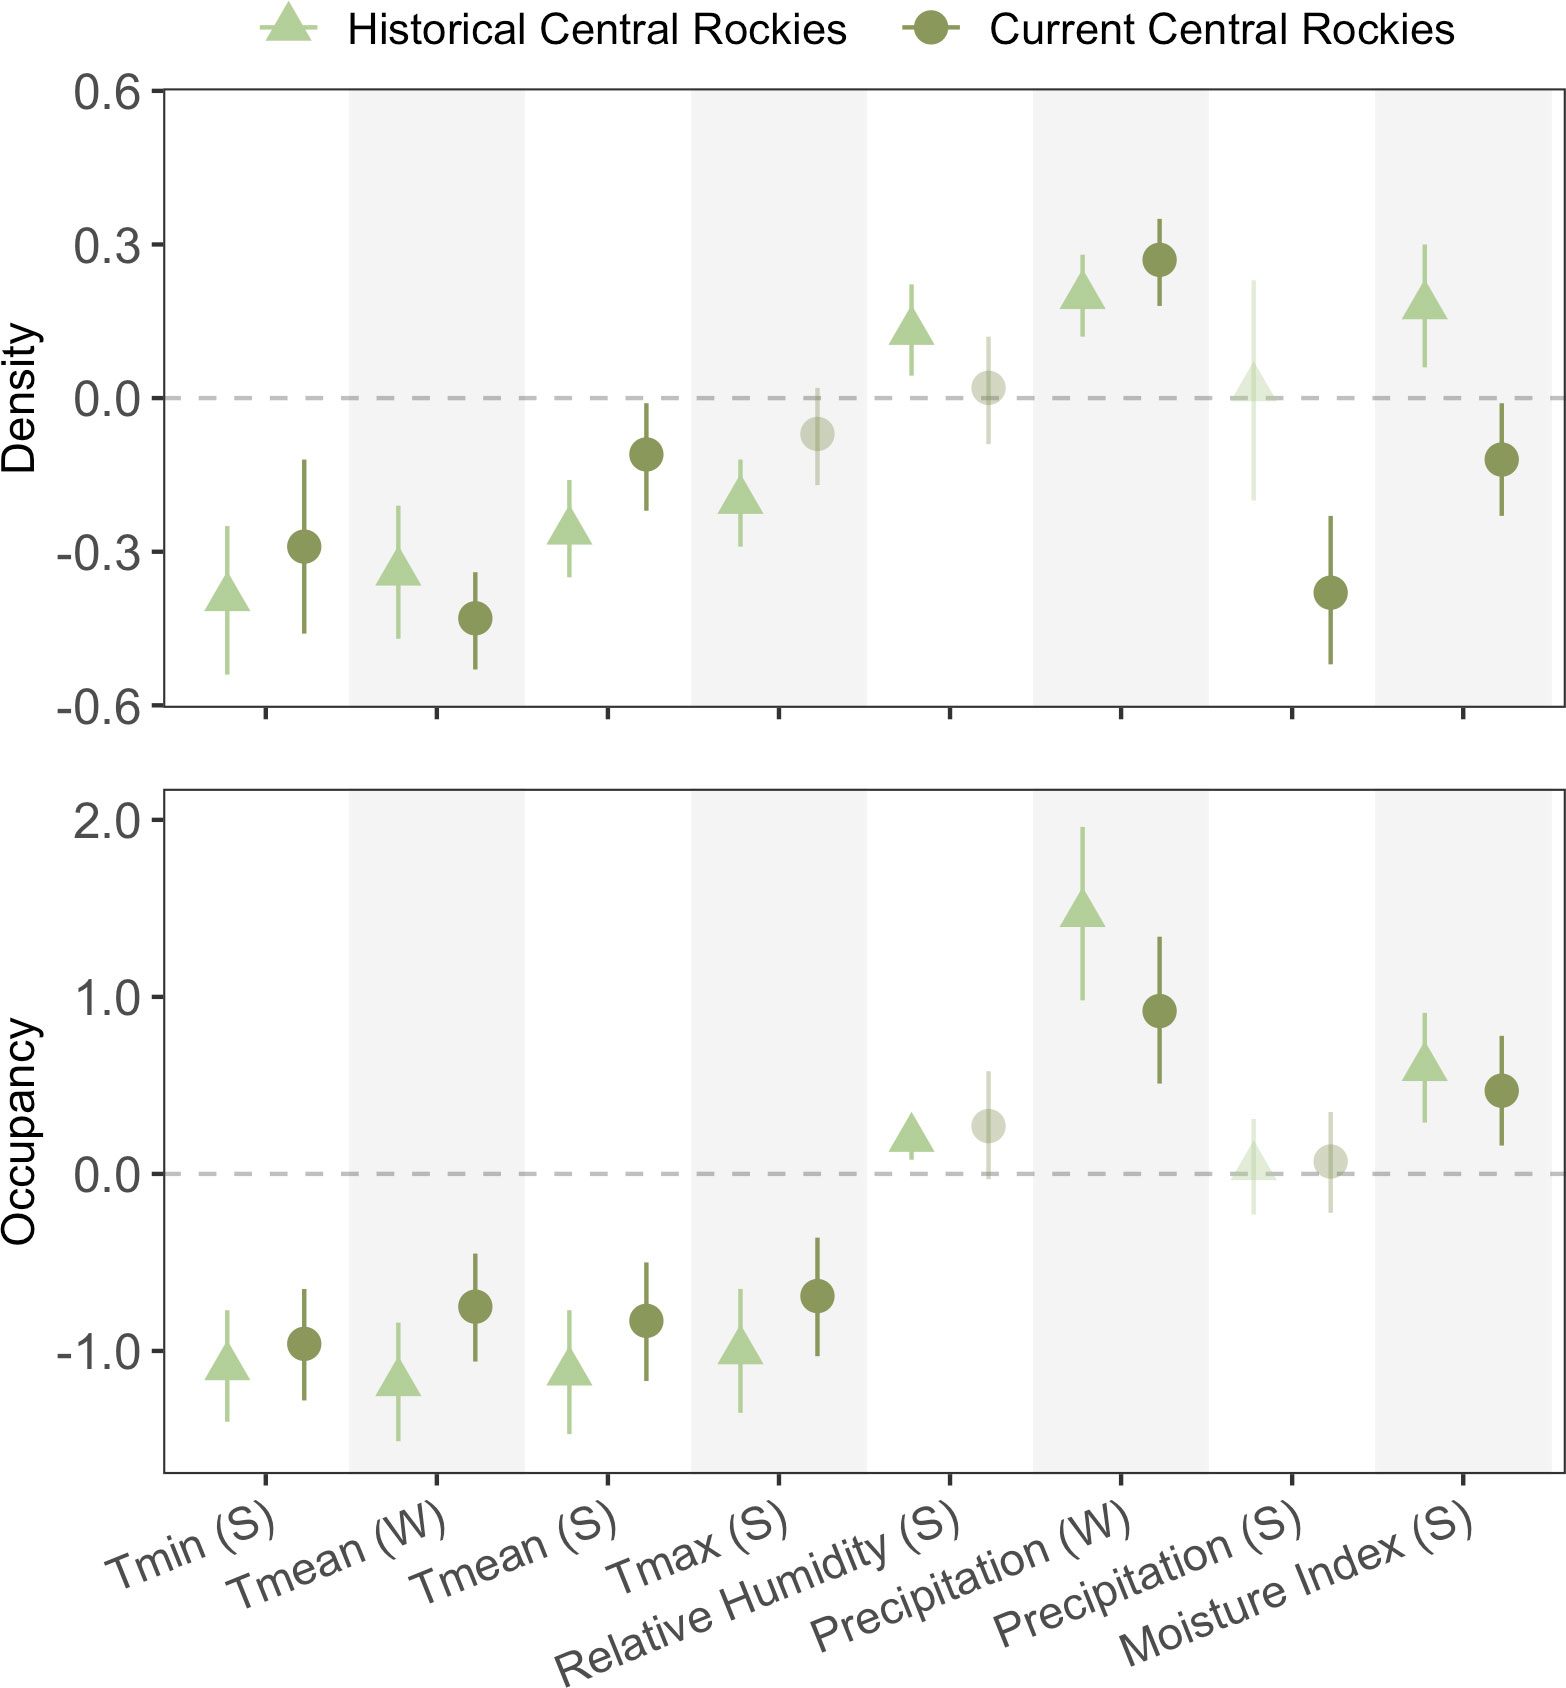
Figure 3 Coefficient estimates for univariate parameter estimates by climate metric and season for the Central Rockies temporal analysis. The light green triangle points represent the historical-period sampling (2011–2016), whereas the dark green circle points represent the recent-period sampling (2019–2021).
4 Discussion
Here, we examined how species–climate relationships vary across spatial and temporal scales using a readily detectable small mammal whose range spans approximately one-third of North America. Overarchingly, we found higher temperatures consistently had a negative effect on both pika occupancy and densities, while moisture metrics mostly had positive effects on both responses. However, the importance of precipitation in summer and winter showed the highest nonstationarity across space, with winter snowpack having no effect on either response in the Southern Rockies, and summer precipitation having no effect on either response in the Central Rockies. Moreover, the precision of effect sizes was generally the lowest for precipitation metrics, both at inter- and intra-regional scales. Our findings illustrate the existence of some nonstationarity of biotic responses to certain climate factors, cautioning extrapolation beyond single regions or time periods.
4.1 Among-ecoregion variability
At the inter-regional scale, which spans over twelve degrees of latitude and nearly ten degrees of longitude, there was general congruence in approximate coefficient size and directionality of temperature metrics for both responses. Overwhelmingly, warmer temperatures had a negative effect on both pika occupancy and density across the three vast ecoregions. In winter, warmer temperatures are typically correlated with lower snowpack, followed by lower snow retention into summer, which may explain why warmer winters have a negative effect. These results corroborate numerous other studies that highlight the sensitivity of pikas to warmer temperatures across seasons (Beever et al., 2003; Wilkening et al., 2011; Stewart et al., 2015). In contrast, several other investigations have found the effect of temperature on pikas to vary across study areas (Jeffress et al., 2013; Rodhouse et al., 2018). Nevertheless, high summertime temperatures have also been implicated in constraining dispersal abilities and corridors used by pikas (Henry et al., 2012; Castillo et al., 2014), suggesting that the previously occupied sites in hotter areas may be less likely to be recolonized. Given that all three ecoregions have warmed in recent decades, our results indicate that further temperature-related patch-level extirpations seem likely for the species, unless increases in precipitation possibly ameliorate thermal stress.
In addition to temperature, we found full congruence in the directionality of the two moisture metrics across ecoregions, suggesting that water balance constitutes a predictable selective pressure on pikas. However, the two seasonal-precipitation metrics were less consistently significant, showing several insignificant relationships depending on the ecoregion and response metric. Such differences appear to align with the amount of snowfall received and its duration, across our study regions. Downscaled data from ClimateNA are tightly correlated with weather-station measurements for temperature metrics (R2 ≥ 0.99) but not as much with precipitation metrics (R2 ≥ 0.64), leading to substantially lower predictive power for precipitation metrics (Wang T et al., 2016). Therefore, we cannot rule out possible climate-downscaling discrepancies as a contributor to insignificant relationships with precipitation. Still, we suspect the lack of consistent relationships with precipitation may be due to unaccounted-for interactions with temperature that may be biologically relevant. For example, another study found that high temperatures were indeed more influential on pika occupancy in drier national parks (Jeffress et al., 2013). Whereas Erb et al. (2011) found that annual precipitation best predicted pika occupancy across 69 sites in the Southern Rockies, we found that only precipitation in summer had a small positive effect on occupancy, whereas winter precipitation surprisingly had no effect in the Southern Rockies. West of the Rocky Mountains, in the Great Basin ecoregion, Millar et al. (2018) described the climate envelope of pika-extant sites as ranging from 7–83 mm for summer precipitation, whereas our pika-occupied sites had consistently more summer precipitation (Southern Rockies: 137–392 mm, Central: 68–247 mm, and Northern: 82–203 mm). Millar et al. (2018) suggested that Great Basin pikas can accommodate substantially more-arid summer conditions than what we have found in the Rocky Mountains, indicating that thresholds of pika sensitivity may vary across ecoregions. For example, 99.4% of our historically occupied (possibly extirpated) sites in the Rockies were still wetter in term of summer precipitation (Southern Rockies: 135–387 mm, Central: 57–239 mm, and Northern: 75–208 mm) than pika-occupied sites in the Great Basin (Millar et al., 2018). For summer Tmax, Millar et al. (2018) reported their pika-extant sites ranged from 11.4 to 29.9°C; our extant sites fell entirely within their ranges (14.4–26.8°C). However, our warmest (Tmax) historically occupied sites across our three regions only reached 27.4–29.1°C, suggesting a possible lower threshold for summer heat tolerance in the Rocky Mountains relative to the Great Basin.
Across temperature and precipitation metrics, our results continue to illustrate how climate-envelope thresholds may differ substantially across species’ ranges. Such differences may also, in part, reflect genetic, behavioral, habitat (e.g., microrefugia, forage quality), or other differences among populations that remain difficult to model. Our findings reiterate other studies’ calls for consideration of the context-dependencies of scale prior to formulating range-wide generalities (Schwalm et al., 2016). Nonstationarity in precipitation metrics especially warrants caution of their inclusion in broad-scale modeling, whereas temperature and moisture metrics appeared to play a more predictable role in shaping occupancy and population densities, herein. For precipitation metrics, the use of spatially varying coefficients (SVCs) in distribution modeling may be one effective solution to account for this large spatial variation in the relative and absolute importance of these metrics.
Investigations into spatial nonstationarity in species-environment relationships have been growing in recent years, with studies often documenting the greatest spatial nonstationarity in climate metrics specifically (Pease et al., 2022b). Identifying the key drivers of variability in these relationships is especially important for management decision-making and policy. Given that management actions are generally implemented at local- to regional-scales, results from one region applied elsewhere should be evaluated with particular care since species–climate relationships vary across spatial and temporal extents, over which environmental stressors can differ (Pease et al., 2022a). Yet, species-specific data limitations may constrain robust modeling efforts at local scales when resources and data are limited. This may be especially pronounced in rural areas, where species occurrence records are less common than near urban settings (Bowler et al., 2022). One solution to fill spatial gaps at local scales may involve heavier reliance on citizen-science data for additional occurrence and density records in some instances, but experts may still need to determine true absences for presence-absence models. In addition, there are widespread biases in occurrence records across species due to various reasons (e.g., body size, rarity, and group size, Callaghan et al., 2021), but intraspecific species–environment relationships often do not correlate to patterns with heterospecifics in the same community or in closely related species (e.g., Rossi et al., 2023). Accordingly, considerations may be necessary at the species level. Our results show that the level of species-specific nonstationarity depends on which climate metrics are evaluated in modeling (i.e., some metrics, like temperature, exhibited surprising levels of stationarity over large spatial domains), a pattern that is likely prevalent across taxa. We therefore caution that community-scale modeling that does not account for species-specific relationships with climate may be ineffective for predicting the future distributions of species, especially when extrapolating into novel conditions and the distant future.
4.2 Within-ecoregion variability
Relative to the inter-regional comparison, intra-regional coefficients were more variable, showing a larger range of strengths (occupancy: within-region: −1.76 to 3.30, among-regions: −1.18 to 1.47; density: within-region: −0.41 to 0.64, among-regions: −0.39 to 0.36). However, this may partially be due to smaller sample sizes within mountain ranges relative to across mountain ranges (Table 2, SI Appendix). Excluding the Italian Peaks, responses in the other three mountain ranges showed consistent directionality of each response to climate, with both summer and winter precipitation and moisture-related metrics having reliably positive effects. For these four variables, coefficients still varied widely in most cases (e.g., relative humidity for occupancy, coefficient range: 0.32–2.3 on the log-odds scale). Temperature had consistently negative effects on both occupancy and abundance, in alignment with the inter-regional analyses. The general consistency of response directionality among the three mountain ranges provides some promise that within ecoregions, results from one mountain range may be relevant (to some extent) to other nearby mountain ranges for both occupancy and density in a given time period.
Results from the Italian Peaks diverged from the other three ranges, whereby all climate relationships were insignificant for density, and winter Tmean and summer relative humidity were insignificant for occupancy. To note, the Italians Peaks were the only mountain range where pika population densities decreased slightly with elevation (see Figure S2 in Billman et al., 2021). The underlying geology of the Italian Peaks is predominantly limestone. Unlike the larger metamorphic and igneous talus found throughout the other mountain ranges, limestone talus in this mountain range was typically smaller in size (10- to 50-cm-diameter rocks, on average) and, consequently, shallower than larger-clast talus slopes. Although numerous studies have promoted optimism for the microclimate buffering capacity of talus as a long-term refugia for pikas (e.g., Millar et al., 2013), one recent study found that deep, subsurface temperatures in talus in Colorado (USA) had still warmed substantially between 1963–64 and 2009–21 (Monk and Ray, 2022). Accordingly, we suspect that the lack of pika–climate relationships for density in the Italian Peaks may largely be due to poor thermal buffering of the small, limestone talus; smaller rock diameters and shallower talus depth likely translate to warmer interstitial temperatures at low elevations and colder temperatures at high elevations. Thermally stressful conditions at the lowest and highest elevations in this mountain range would suggest a linear relationship for density would have no detectable effect; instead, the relationships may be quadratic, with the most favorable conditions for population densities at the mid elevations. On the contrary, the Beaverhead Mountains generally showed the strongest effect sizes, particularly for occupancy (Figure 2), which may have been due to topographic similarity of sampled watersheds in this mountain range. This range is especially linear and all watersheds on the west have comparable elevational spans of habitat and minimum elevations of occupancy, whereas the east-side watersheds retracted very little and also have comparable minimum elevations of current occupancy to one another (Billman et al., 2021). These elevational patterns of occupancy (vs extirpation) likely explain why the pika-climate relationships there were often the strongest compared to the other ranges. Lastly, the Beaverhead sites exhibited the broadest climate space in a PCA that included all eight climate variables (Figure S1). Overall, these context-dependencies highlight necessary caution when applying interpretations among mountain ranges with differing topography and geology, for example.
Although some empirical studies found that species–climate relationships become more stationary, and predictable, at broader scales (e.g., Miller and Hanham, 2011), others have found stationarity decreases at larger scales, such as when study regions are spaced far apart (e.g., McAlpine et al., 2008). Discrepancies here likely arise because far-apart study domains may or may not be similar in terms of climate, vegetation, and species composition, among other factors. Because the four mountain ranges in our Northern Rockies intra-regional analysis had similar climatic conditions and other similarities, like vegetation, we predicted that stationarity would be higher in terms of coefficient directionality and magnitude relative to the inter-regional analysis. However, we surprisingly found less congruence in effect-size magnitude and more consistency in climate-relationship directionality (when excluding the Italian Peaks). Interestingly, pika–climate relationships for precipitation and moisture metrics were consistently stronger (i.e., larger magnitudes) at local scales relative to the inter-regional analysis, suggesting that variability in range-wide modeling datasets may dampen the overall strength of species–climate relationships at local scales, which are more relevant to managers.
On the contrary, we found comparable coefficients for temperature metrics between intra- and inter-regional analyses for density (mean temperature β coefficient: −0.22 vs. −0.23, respectively), and occupancy (−1.06 vs. −0.90, respectively). Because eco-evolutionary processes are hierarchically structured in nature, patterns found at local scales often do not align with those at much broader scales (Osborne et al., 2007), making these findings particularly surprising. For species with large distributions that span immense climate gradients, species–climate relationships should generally be examined at the ecoregional scale when possible due to comparable topography, geology, vegetation, and climatic conditions (Smith et al., 2019). Within said ecoregions, we advise sampling efforts span the largest gradient of environmental conditions possible to evaluate variability in relationships over space. Given what we found intra-regionally, anomalous conditions in select mountain ranges (within an ecoregion) may warrant their exclusion from regional models, but they should also receive additional sampling efforts in the future would be beneficial to better understand and predict species–climate relationships therewithin.
In this case, pika–climate relationships for temperature metrics may be more practical than precipitation and moisture metrics for extrapolating to new regions or at different scales if necessary, but further exploration seem warranted. Our findings overall have important implications for species distribution modeling in the face of climate change, given that temperatures are rising across most of the planet, but changes in precipitation vary considerably and are less predictable (IPCC, 2022). Yet, precipitation and moisture are predicted to grow increasingly important for terrestrial species moving forward to maintain body cooling requirements with rising temperatures (Riddell et al., 2019). Provided that extirpations often occur at the hottest and driest sites within a species range, understanding spatial nonstationarity in precipitation and moisture metrics are critical for informing and modeling extinction risks.
4.3 Temporal variability
In general, we found high agreement of directionality within climate metrics over time, but less so for climate-density relationships than for climate-occupancy. For both responses, we identified only one case where the directionality of an effect changed sign through time; density was positively influenced by climate moisture index in the historical period, but CMI had a negative effect in the more-recent survey period. In contrast, the results from the occupancy analysis suggested moisture had a consistently positive effect in both periods, highlighting how the drivers of occupancy and density may not always align, a result documented in other studies as well (e.g., Dibner et al., 2017). Climate-density relationships are often less predictable than occupancy, since shorter-term processes generally drive population densities whereas changes in occupancy occur over longer periods and are often influenced by larger-scale processes like macroclimate (Beever et al., 2013; Schulz et al., 2019).
There were several cases where species–climate relationships were significant in one period but not the other in our analysis. This temporal nonstationarity appeared unpredictable and was found in temperature, moisture, and precipitation metrics (density: Tmax, relative humidity, and summer precipitation; occupancy: relative humidity). One possible explanation for temporal divergence is that correlations among climate metrics are often nonstationary themselves over time, whereby changes in temperature do not always correlate with changes in precipitation, for example (e.g., Bueno de Mesquita et al., 2021). In our case, summer relative humidity had a positive effect on occupancy in the historical period but not the more-recent period, whereas all other relationships with occupancy and climate were significant (except summer precipitation in both periods). This may indicate that temperature, winter precipitation, and CMI were more limiting in the more-recent survey period than relative humidity. Similarly, the relative importance of climate variables may have changed over time (Marcinkowski et al., 2015). Our mixed results regarding temporal nonstationarity somewhat stand in contrast to another pika study that found relatively high temporal transferability of SDMs in California (Stewart et al., 2015). Although the ecological explanations discussed above may indeed account for this change in variable importance over time, the range of climate values could differ between periods, where conditions may never have reached some stress threshold in the more-recent period. However, this possibility is unlikely in the case of relative humidity, given that the historical-period range was 44.5–70.5% and the recent-period range was 44.5–71.6% – nearly identical. In fact, the overall climate space of surveyed sites between periods had remarkable overlap when using a PCA that included all eight climate metrics (Figure S2). Overall, these patterns caution interpretations of results from single-time period surveys, including those in the two spatial analyses above. While biological interpretations of nonstationarity in species–climate relationships remain important, mathematical evaluation of whether the range of predictor values (prior to scaling and centering) might vary substantially over time over time would provide a valuable complement; this, in turn, could strongly alter the magnitude and directionality of predictors on the response across time periods.
A majority of studies on temporal stationarity in ecology thus far have focused on tree rings. These studies have frequently found that correlations between ring growth and climate fluctuate between significant and non-significant; such fluctuations have been attributed to changes in weather patterns through time. For example, one study found that the effect of winter precipitation on ring growth has decreased over time and become insignificant, whereas the effects of spring temperature and prior-year summer temperatures have become significant recently (Marcinkowski et al., 2015). This often unpredictable de-coupling of species–climate relationships on interannual and interdecadal timescales has wide-ranging implications for SDMs, which typically assume temporal stationarity (i.e., mean and variance change do not over time). However, assuming stationarity is unlikely to capture the complexity of underlying ecological processes and how variable they can be through time. Similar to previous tree-ring studies, our temporal-scale results highlight how assuming stationarity, even over a short time span, could also be misleading and generate incorrect interpretations of animal–climate relationships as well (Bueno de Mesquita et al., 2021). Accordingly, recent studies have recommended that temporal nonstationarity (rather than stationarity) should be the baseline assumption when modeling species–climate relationships through time (Tumajer et al., 2023).
Responses to weather and climate conditions are also highly variable across species (Rossi et al., 2023). Therefore, the degree of nonstationarity can be expected to differ markedly among species within the same community and site (Hereş et al., 2022). This adds an additional layer of complexity when modeling but must be considered prior to applying interpretations from one species to another. Collectively, a stronger emphasis should be placed on understanding temporal nonstationarity in animals to more effectively inform future SDMs, as well as management strategies that rely on timely, near-term forecasts. More broadly, in the face of deterministic climate change, directional selection across species may be an important evolutionary process for many populations over time (decades to centuries); however, increased frequency of extreme events may instead lead to destabilizing selection as well.
4.4 Important considerations and caveats
The primary goal of this study was not to identify top models for predicting occupancy and density, but rather to evaluate variability in species–climate relationships over space and time using univariate climatic factors. Accordingly, there are key interactions among climate factors that likely also explain important mechanisms of stress in this species. We only modeled linear relationships for density, which may or may not be the most descriptive model structure. We acknowledge these simple models constitute a great over-simplification of the full dynamics governing species occupancy and abundance. However, given 1) particular questions that we and our management partners sought to address in the various regions, and 2) our primary objective in this study to assess nonstationarity in species–climate relationships across space and time, we believe our current approach most directly addresses this objective. In addition, our study did not model relationships with non-climatic factors that are also important for occupancy and density, such as habitat suitability and connectivity, forage quality and abundance, interspecific interactions, microclimate temperatures, among others. As described elsewhere, metapopulation dynamics, Allee effects, human disturbances, and other transient processes also cloud the relationship between species and their environment (Holt, 2020). We acknowledge that, particularly relevant for our analyses of density, error and uncertainties are not propagated in other ways through our analysis; Bayesian approaches may better account for this noisiness, explicitly.
Given that American pikas have been considered a sentinel species for understanding metapopulation dynamics and the impact of climate change on alpine species, our findings of consistently strong species–climate relationships for most variables and scales are particularly exciting and highlight how strongly macro-climate appears to influence this species along with micro-climate conditions. Although our sampling design differed slightly among the Southern, Central, and Northern Rockies, we found many consistent relationships among regions (i.e., stationarity, see Tmax in summer) which suggests that methodological differences in study design may not always lead to divergent results and interpretations. Nevertheless, we do not encourage applying different survey designs over space when it’s possible to avoid. The presence of local adaptation across regions and the two pika lineage here was also beyond the scope of this study but may well be an important factor in species–climate relationships when comparing multiple ecoregions that have long had vastly different climatic conditions. These considerations are important when evaluating the applicability of SDMs for any given species, or otherwise projecting results from one study region or timescale to another. However, further studies examining species’ relationships with univariate climate factors would be beneficial to improving our understanding of species’ ecology, physiology, and conservation.
Nonstationarity, if unaccounted for, decreases model performance and reliability, but so does climate novelty when models aim to predict species’ responses beyond the range of the calibration data. Nonstationarity can reflect true biological or mechanistic changes in species–environment relationships over space or time; in contrast, model error can emerge simply due to inappropriate extrapolation into novel conditions. Whereas the focus of our investigation was to examine issues related to nonstationarity, ignoring climate novelty during SDM creation and application will also provide biologically unrealistic inferences and deteriorate model predictability. In addition, novel conditions and nonstationarity may act synergistically in influencing model performance and thus, overall utility. The development of increasingly flexible model structures should seek to account for both ecological nonstationarity and novel conditions when possible, as both are predicted to increase under continuing contemporary climate change (Radeloff et al., 2015).
5 Implications
The impending loss of global biodiversity underscores the need to evaluate species’ vulnerabilities to further shifts in climate, overexploitation, invasive species, and land-use patterns (Díaz et al., 2019). Species’ exposure and adaptive capacities are now recognized to vary widely across spatial scales (Beever et al., 2023) but given that ecological relationships are notoriously variable over multiple spatial and temporal dimensions, understanding patterns in new places, time periods, and under no-analog conditions can be difficult. However, there are growing opportunities to now capitalize on “big-data” systems that span many disciplines to better evaluate the importance of scale. Growing recognition of nonstationarity in ecological processes has highlighted remaining questions related to the appropriate scales for investigations, the limits of extrapolation, and the overall usefulness of spatially explicit models. Although our results were mostly comparable across three of the four ranges within the single ecoregion, range-wide modeling using climate envelopes from one region and time period would provide inaccurate and unrealistic results in most cases – particularly for precipitation, according to our results. Holistically, our results stress how a better understanding of the appropriate spatial and temporal scales of species–climate responses could create more effective, tailored climate-adaptation strategies under shifting conditions.
Analyses in recent years have begun exploring new mathematical methods in their models, like spatially varying coefficients (SVCs), to account for nonstationarity in species–climate relationships over space and time (e.g., Humphreys et al., 2022; Sultaire et al., 2022), justification for which is further supported by our analyses. Similarly, geographically and temporally weighted regression and machine learning in ecology should be considered in more instances, given their often-superior performance relative to other methods in forecasting processes in cases where nonstationarity is high (Feng et al., 2021). Nevertheless, model structure choice should ultimately be motivated by the study question at hand (Segurado et al., 2006). While we encourage additional investigations into nonstationarity in species–climate relationships across spatial domains, we anticipate future investigations into how these relationships change through time will yield the greatest insights in a rapidly changing world. Although the full complexity of ecological networks can never be fully modeled, we hope the results here provide further motivation to continue discussions surrounding the relationships of patterns and scale in order to improve biodiversity management and forecasts moving forward.
Data availability statement
The original contributions presented in the study are publicly available. This data can be found here: USGS Science Data Catalog (SDC), https://doi.org/10.5066/P9WB1EWC.
Ethics statement
Ethical review and approval was not required for the animal study because this study only included observational data.
Author contributions
PB, conceptualization, methodology, data collection and curation, formal analysis, investigation, writing–original draft, writing–review and editing, visualization, and supervision. EB, conceptualization, methodology, data collection and curation, investigation, writing–original draft, writing–review, and editing. MW and DR, data collection and curation, writing–original draft, and writing–review and editing. All authors contributed to the article and approved the submitted version.
Funding
This work was funded by numerous organizations and grants, including the American Society of Mammalogists GIAR (PB, MW), Northwest Scientific Association (PB), Sigma Xi (PB), American Alpine Club (PB), Western National Parks Association (EB), U.S. Geological Survey (EB), University of New Mexico Joseph Gaudin Scholarship (MW), and the New Mexico Research Grant (MW). Any use of trade, firm, or product names is for descriptive purposes only and does not imply endorsement by the U.S. Government.
Conflict of interest
The authors declare that the research was conducted in the absence of any commercial or financial relationships that could be construed as a potential conflict of interest.
Publisher’s note
All claims expressed in this article are solely those of the authors and do not necessarily represent those of their affiliated organizations, or those of the publisher, the editors and the reviewers. Any product that may be evaluated in this article, or claim that may be made by its manufacturer, is not guaranteed or endorsed by the publisher.
Supplementary material
The Supplementary Material for this article can be found online at: https://www.frontiersin.org/articles/10.3389/fevo.2023.1202610/full#supplementary-material
References
Bates D., Maechler M., Bolker B., Walker S. (2015). Fitting linear mixed-effects model using lme4. J. Stat. Softw. 67 (1), 1–48. doi: 10.18637/jss.v067.i01
Beever E., Brussard P. E., Berger J. (2003). Patterns of apparent extirpation among isolated populations of pikas (Ochotona princeps) in the great basin. J. Mammal. 84 (1), 37–54. doi: 10.1644/1545-1542(2003)084<0037:POAEAI>2.0.CO;2
Beever E. A., Dobrowski S. Z., Long J., Mynsberge A. R., Piekielek N. B. (2013). Understanding relationships among abundance, extirpation, and climate at ecoregional scales. Ecology 94 (7), 1563–1571. doi: 10.1890/12-2174.1
Beever E. A., Ray C., Mote P. W., Wilkening J. L. (2010). Testing alternative models of climate-mediated extirpations. Ecol. Appl. 20 (1), 164–178. doi: 10.1890/08-1011.1
Beever E. A., Ray C., Wilkening J. L., Brussard P. F., Mote P. W. (2011). Contemporary climate change alters the pace and drivers of extinction. Global Change Biol. 17 (6), 2054–2070. doi: 10.1111/j.1365-2486.2010.02389.x
Beever E. A., Wilkening J. L., Billman P. D., Thurman L. L., Ernest K. A., Wright D. H., et al. (2023). Geographic and taxonomic variation in adaptive capacity among mountain-dwelling small mammals: implications for conservation status and actions. Biol. Conserv. 282, 109942. doi: 10.1016/j.biocon.2023.109942
Benedict L. M., Wiebe M., Plichta M., Batts H., Johnson J., Monk E., et al. (2020). Microclimate and summer surface activity in the American pika (Ochotona princeps). Western North Am. Nat. 80 (3), 316–329. doi: 10.3398/064.080.0303
Billman P. D., Beever E. A., McWethy D. B., Thurman L. L., Wilson K. C. (2021). Factors influencing distributional shifts and abundance at the range core of a climate-sensitive mammal. Glob. Chang. Biol. 27 (19), 4498–4515. doi: 10.1111/gcb.15793
Bowler D. E., Callaghan C. T., Bhandari N., Henle K., Benjamin Barth M., Koppitz C., et al. (2022). Temporal trends in the spatial bias of species occurrence records. Ecography 2022 (8), e06219. doi: 10.1111/ecog.06219
Briscoe N. J., Morris S. D., Mathewson P. D., Buckley L. B., Jusup M., Levy O., et al. (2022). Mechanistic forecasts of species responses to climate change: the promise of biophysical ecology. Global Change Biol. 1451-1470. doi: 10.1111/gcb.16557
Brown J. H. (1984). On the relationship between abundance and distribution of species. Am. Nat. 124 (2), 255–279. doi: 10.1086/284267
Bueno de Mesquita C. P., White C. T., Farrer E. C., Hallett L. M., Suding K. N. (2021). Taking climate change into account: non-stationarity in climate drivers of ecological response. J. Ecol. 109 (3), 1491–1500. doi: 10.1111/1365-2745.13572
Calabrese G. M., Pfennig K. S. (2023). Climate change alters sexual signaling in a desert-adapted frog. Am. Nat. 201 (1), 91–105. doi: 10.1086/722174
Callaghan C. T., Poore A. G., Hofmann M., Roberts C. J., Pereira H. M. (2021). Large-Bodied birds are over-represented in unstructured citizen science data. Sci. Rep. 11 (1), 19073. doi: 10.1038/s41598-021-98584-7
Carroll K. A., Farwell L. S., Pidgeon A. M., Razenkova E., Gudex-Cross D., Helmers D. P., et al. (2022). Mapping breeding bird species richness at management-relevant resolutions across the united states. Ecol. Appl. 32 (6), e2624. doi: 10.1002/eap.2624
Castillo J. A., Epps C. W., Davis A. R., Cushman S. A. (2014). Landscape effects on gene flow for a climate-sensitive montane species, the American pika. Mol. Ecol. 23 (4), 843–856. doi: 10.1111/mec.12650
Charney N. D., Record S., Gerstner B. E., Merow C., Zarnetske P. L., Enquist B. J. (2021). A test of species distribution model transferability across environmental and geographic space for 108 western north American tree species. Front. Ecol. Evol. 9, 689295. doi: 10.3389/fevo.2021.689295
Cordes L. S., Blumstein D. T., Armitage K. B., CaraDonna P. J., Childs D. Z., Gerber B. D., et al. (2020). Contrasting effects of climate change on seasonal survival of a hibernating mammal. Proc. Natl. Acad. Sci. U. S. A. 18119-18126. doi: 10.1073/pnas.1918584117
Díaz S. M., Settele J., Brondízio E., Ngo H., Guèze M., Agard J., et al. (2019). The global assessment report on biodiversity and ecosystem services: summary for policy makers.
Dibner R. R., Doak D. F., Murphy M. (2017). Discrepancies in occupancy and abundance approaches to identifying and protecting habitat for an at-risk species. Ecol. Evol. 7 (15), 5692–5702. doi: 10.1002/ece3.3131
Eastman L. M., Morelli T. L., Rowe K. C., Conroy C. J., Moritz C. (2012). Size increase in high elevation ground squirrels over the last century. Global Change Biol. 18 (5), 1499–1508. doi: 10.1111/j.1365-2486.2012.02644.x
Erb L. P., Ray C., Guralnick R. (2011). On the generality of a climate-mediated shift in the distribution of the American pika (Ochotona princeps). Ecology 92 (9), 1730–1735. doi: 10.1890/11-0175.1
Erb L. P., Ray C., Guralnick R. (2014). Determinants of pika population density vs. occupancy in the southern rocky mountains. Ecol. Appl. 24 (3), 429–435. doi: 10.1890/13-1072.1
Feng L., Wang Y., Zhang Z., Du Q. (2021). Geographically and temporally weighted neural network for winter wheat yield prediction. Remote Sens. Environ. 262, 112514. doi: 10.1016/j.rse.2021.112514
Galbreath K. E., Hafner D. J., Zamudio K. R., Agnew K. (2010). Isolation and introgression in the intermountain West: contrasting gene genealogies reveal the complex biogeographic history of the American pika (Ochotona princeps). J. Biogeogr. 37 (2), 344–362. doi: 10.1111/j.1365-2699.2009.02201.x
Goodman M. C., Carroll G., Brodie S., Grüss A., Thorson J. T., Kotwicki S., et al. (2022). Shifting fish distributions impact predation intensity in a sub-Arctic ecosystem. Ecography 2022 (9), e06084. doi: 10.1111/ecog.06084
Guisan A., Graham C. H., Elith J., Huettmann F., Group N. S. D. M. (2007). Sensitivity of predictive species distribution models to change in grain size. Diversity Distrib. 13 (3), 332–340. doi: 10.1111/j.1472-4642.2007.00342.x
Guisan A., Thuiller W., Zimmermann N. E. (2017). Habitat suitability and distribution models: with applications in r (Cambridge, UK: Cambridge University Press).
Hafner D. J., Sullivan R. M. (1995). Historical and ecological biogeography of nearctic pikas (Lagomorpha, ochotonidae). J. Mammal. 76 (2), 302–321. doi: 10.2307/1382343
Henry P., Sim Z. J., Russello M. A. (2012). Genetic evidence for restricted dispersal along continuous altitudinal gradients in a climate change-sensitive mammal: the American pika. PloS One 7 (6), 10. doi: 10.1371/journal.pone.0039077
Hereş A.-M., Polanco-Martínez J. M., Petritan I. C., Petritan A. M., Yuste J. C. (2022). The stationary and non-stationary character of the silver fir, black pine and scots pine tree-growth-climate relationships. Agric. For. Meteorol. 325, 109146. doi: 10.1016/j.agrformet.2022.109146
Holt R. D. (2020). Reflections on niches and numbers. Ecography 43 (3), 387–390. doi: 10.1111/ecog.04828
Humphreys J. M., Srygley R. B., Lawton D., Hudson A. R., Branson D. H. (2022). Grasshoppers exhibit asynchrony and spatial non-stationarity in response to the El Niño/Southern and pacific decadal oscillations. Ecol. Model. 471, 110043. doi: 10.1016/j.ecolmodel.2022.110043
IPCC. (2022). Climate Change 2022: Impacts, Adaptation, and Vulnerability. Contribution of Working Group II to the Sixth Assessment Report of the Intergovernmental Panel on Climate Change. [Pörtner H.-O., Roberts D. C., Tignor M., Poloczanska E. S., Mintenbeck K., Alegría A., Craig M., Langsdorf S., Löschke S., Möller A., Okem A., Rama B. (Eds.)] (Cambridge University Press. Cambridge University Press, Cambridge, UK and New York, NY, USA) 3056 pp. doi: 10.1017/9781009325844
Jeffress M. R., Rodhouse T. J., Ray C., Wolff S., Epps C. (2013). The idiosyncrasies of place: geographic variation in the climate-distribution relationships of the American pika. Ecol. Appl. 23 (4), 864–878. doi: 10.1890/12-0979.1
Johnston A. N., Bruggerman J., Beers A. T., Beever E. A., Christopherson R. G., Ransom J. I. (2019). Ecological consequences of anomalies in atmospheric moisture and snowpack. Ecology 100 (4), e02638. doi: 10.1002/ecy.2638
Kearney M. R., Wintle B. A., Porter W. P. (2010). Correlative and mechanistic models of species distribution provide congruent forecasts under climate change. Conserv. Lett. 3 (3), 203–213. doi: 10.1111/j.1755-263X.2010.00097.x
Kerner J. M., Krauss J., Maihoff F., Bofinger L., Classen A. (2023). Alpine butterflies want to fly high: species and communities shift upwards faster than their host plants. Ecology 104 (1), e3848. doi: 10.1002/ecy.3848
Lee-Yaw J. A., McCune L., Pironon S., Sheth S. N. (2022). Species distribution models rarely predict the biology of real populations. Ecography 2022 (6), e05877. doi: 10.1111/ecog.05877
Marcinkowski K., Peterson D. L., Ettl G. J. (2015). Nonstationary temporal response of mountain hemlock growth to climatic variability in the north cascade range, Washington, USA. Can. J. For. Res. 45 (6), 676–688. doi: 10.1139/cjfr-2014-0231
Martínez-Minaya J., Cameletti M., Conesa D., Pennino M. G. (2018). Species distribution modeling: a statistical review with focus in spatio-temporal issues. Stoch. Environ. Res. Risk Assess. 32, 3227–3244. doi: 10.1007/s00477-018-1548-7
McAlpine C., Rhodes J., Bowen M., Lunney D., Callaghan J., Mitchell D., et al. (2008). Can multiscale models of species’ distribution be generalized from region to region? a case study of the koala. J. Appl. Ecol. 45 (2), 558–567. doi: 10.1111/j.1365-2664.2007.01431.x
Millar C. I., Delany D. L., Hersey K. A., Jeffress M. R., Smith A. T., Van Gunst K. J., et al. (2018). Distribution, climatic relationships, and status of American pikas (Ochotona princeps) in the great basin, USA. Arctic Antarctic Alpine Res. 50 (1). doi: 10.1080/15230430.2018.1436296
Millar C. I., Westfall R. D., Delany D. L. (2013). Thermal and hydrologic attributes of rock glaciers and periglacial talus landforms: Sierra Nevada, California, USA. Quat. Int. 310, 169–180. doi: 10.1016/j.quaint.2012.07.019
Miller J. A., Hanham R. Q. (2011). Spatial nonstationarity and the scale of species–environment relationships in the Mojave desert, California, USA. Int. J. Geographical Inf. Sci. 25 (3), 423–438. doi: 10.1080/13658816.2010.518147
Monk E. M., Ray C. (2022). Revisiting talus and free-air temperatures after 50 years of change at an American pika (Ochotona princeps) study site in the southern Rockies. PloS Climate 1 (7), e0000049. doi: 10.1371/journal.pclm.0000049
Osborne P. E., Foody G. M., Suárez-Seoane S. (2007). Non-stationarity and local approaches to modelling the distributions of wildlife. Diversity Distrib. 13 (3), 313–323. doi: 10.1111/j.1472-4642.2007.00344.x
Pardi M. I., Terry R. C., Rickart E. A., Rowe R. J. (2020). Testing climate tracking of montane rodent distributions over the past century within the great basin ecoregion. Global Ecol. Conserv. 24, e01238. doi: 10.1016/j.gecco.2020.e01238
Pease B. S., Pacifici K., Kays R. (2022a). Exploring spatial nonstationarity for four mammal species reveals regional variation in environmental relationships. Ecosphere 13 (8), e4166. doi: 10.1002/ecs2.4166
Pease B. S., Pacifici K., Kays R., Reich B. (2022b). What drives spatially varying ecological relationships in a wide-ranging species? Diversity Distrib. 28 (9), 1752–1768. doi: 10.1111/ddi.13594
Pepin N. C., Arnone E., Gobiet A., Haslinger K., Kotlarski S., Notarnicola C., et al. (2022). Climate changes and their elevational patterns in the mountains of the world. Rev. Geophys. 60 (1), 1-40. doi: 10.1029/2020rg000730
Peterson A. T., Soberon J., Pearson R. G., Anderson R. P., Martinez-Meyer E., Nakamura M., et al. (2011). Ecological niches and geographic distributions Vol. Vol. 49) (Princeton, NJ: Princeton University Press).
Radchuk V., Reed T., Teplitsky C., van de Pol M., Charmantier A., Hassall C., et al. (2019). Adaptive responses of animals to climate change are most likely insufficient. Nat. Commun. 10 (1), 3109. doi: 10.1038/s41467-019-10924-4
Radeloff V. C., Williams J. W., Bateman B. L., Burke K. D., Carter S. K., Childress E. S., et al. (2015). The rise of novelty in ecosystems. Ecol. Appl. 25 (8), 2051–2068. doi: 10.1890/14-1781.1
Ray C., Beever E. A., Rodhouse T. J. (2016). Distribution of a climate-sensitive species at an interior range margin. Ecosphere 7 (6), e01379. doi: 10.1002/ecs2.1379
R Core Team (2021). R: A Language and Environment for Statistical Computing. R Foundation for Statistical Computing. Vienna, Austria. Available at: https://www.R-project.org .
Riddell E. A., Apanovitch E. K., Odom J. P., Sears M. W. (2017). Physical calculations of resistance to water loss improve predictions of species range models. Ecol. Monogr. 87 (1), 21–33. doi: 10.1002/ecm.1240
Riddell E. A., Iknayan K. J., Wolf B. O., Sinervo B., Beissinger S. R. (2019). Cooling requirements fueled the collapse of a desert bird community from climate change. Proc. Natl. Acad. Sci. U. S. A. 116 (43), 21609–21615. doi: 10.1073/pnas.1908791116
Rodhouse T. J., Beever E. A., Garrett L. K., Irvine K. M., Jeffress M. R., Munts M., et al. (2010). Distribution of American pikas in a low-elevation lava landscape: conservation implications from the range periphery. J. Mammal. 91 (5), 1287–1299. doi: 10.1644/09-mamm-a-334.1
Rodhouse T. J., Jeffress M. R., Sherrill K. R., Mohren S. R., Nordensten N. J., Magnuson M. L., et al. (2018). Geographical variation in the influence of habitat and climate on site occupancy turnover in American pika (Ochotona princeps). Diversity Distrib. 24 (11), 1506–1520. doi: 10.1111/ddi.12791
Rollinson C. R., Finley A. O., Alexander M. R., Banerjee S., Dixon Hamil K.-A., Koenig L. E., et al. (2021). Working across space and time: nonstationarity in ecological research and application. Front. Ecol. Environ. 19 (1), 66–72. doi: 10.1002/fee.2298
Rossi A. J., Klinger R. C., Hellwig E. C., Van Vuren D. H. (2023). Niches of three sympatric montane ground-dwelling squirrels: relative importance of climate, topography, and landcover. Ecol. Evol. 13 (4), e9949. doi: 10.1002/ece3.9949
Rousseau J. S., Betts M. G. (2022). Factors influencing transferability in species distribution models. Ecography 2022 (7), e06060. doi: 10.1111/ecog.06060
Scherrer D., Esperon-Rodriguez M., Beaumont L. J., Barradas V. L., Guisan A. (2021). National assessments of species vulnerability to climate change strongly depend on selected data sources. Diversity Distrib. 27 (8), 1367–1382. doi: 10.1111/ddi.13275
Schulz T., Vanhatalo J., Saastamoinen M. (2019). Long-term demographic surveys reveal a consistent relationship between average occupancy and abundance within local populations of a butterfly metapopulation. Ecography 43 (2), 306–317. doi: 10.1111/ecog.04799
Schwalm D., Epps C. W., Rodhouse T. J., Monahan W. B., Castillo J. A., Ray C., et al. (2016). Habitat availability and gene flow influence diverging local population trajectories under scenarios of climate change: a place-based approach. Global Change Biol. 22 (4), 1572–1584. doi: 10.1111/gcb.13189
Segurado P., Araujo M. B., Kunin W. (2006). Consequences of spatial autocorrelation for niche-based models. J. Appl. Ecol. 43 (3), 433–444. doi: 10.1111/j.1365-2664.2006.01162.x
Smith A., Beever E. A., Kessler A. E., Johnston A. N., Ray C., Epps C. W., et al. (2019). Alternatives to genetic affinity as a context for within-species response to climate. Nat. Climate Change 9 (10), 787–794. doi: 10.1038/s41558-019-0584-8
Smith A. B., Santos M. J., Koo M. S., Rowe K. M., Rowe K. C., Patton J. L., et al. (2013). Evaluation of species distribution models by resampling of sites surveyed a century ago by Joseph grinnell. Ecography 36 (9), 1017–1031. doi: 10.1111/j.1600-0587.2013.00107.x
Somero G. (2010). The physiology of climate change: how potentials for acclimatization and genetic adaptation will determine ‘winners’ and ‘losers’. J. Exp. Biol. 213 (6), 912–920. doi: 10.1242/jeb.037473
Stewart J. A. E., Perrine J. D., Nichols L. B., Thorne J. H., Millar C. I., Goehring K. E., et al. (2015). Revisiting the past to foretell the future: summer temperature and habitat area predict pika extirpations in California. J. Biogeogr. 42 (5), 880–890. doi: 10.1111/jbi.12466
Sultaire S. M., Humphreys J. M., Zuckerberg B., Pauli J. N., Roloff G. J. (2022). Spatial variation in bioclimatic relationships for a snow-adapted species along a discontinuous southern range boundary. J. Biogeogr. 49 (1), 66–78. doi: 10.1111/jbi.14279
Tang Y., Horikoshi M., Li W. (2016). ggfortify: unified interface to visualize statistical result of popular r packages. R J. 8 (2), 474–485. doi: 10.32614/RJ-2016-060
Thuiller W., Brotons L., Araújo M. B., Lavorel S. (2004). Effects of restricting environmental range of data to project current and future species distributions. Ecography 27 (2), 165–172. doi: 10.1111/j.0906-7590.2004.03673.x
Thurman L. L., Garcia T. S. (2019). Asymmetric competition shapes amphibian response to rapid environmental change. Ecosphere 10 (12), e02950. doi: 10.1002/ecs2.2950
Tumajer J., Begović K., Čada V., Jenicek M., Lange J., Mašek J., et al. (2023). Ecological and methodological drivers of non-stationarity in tree growth response to climate. Global Change Biol. 29 (2), 462–476. doi: 10.1111/gcb.16470
Urban M. C., Bocedi G., Hendry A. P., Mihoub J.-B., Pe’er G., Singer A., et al. (2016). Improving the forecast for biodiversity under climate change. Science 353 (6304). doi: 10.1126/science.aad8466
Varner J., Carnes-Douglas Z. J., Monk E., Benedict L. M., Whipple A., Dearing M. D., et al. (2023). Sampling a pika's pantry: temporal shifts in nutritional quality and winter preservation of American pika food caches. Ecosphere 14 (5), e4494. doi: 10.1002/ecs2.4494
Wang Q., Fan X., Wang M. (2016). Evidence of high-elevation amplification versus Arctic amplification. Sci. Rep. 6 (1), 19219.
Wang T., Hamann A., Spittlehouse D., Carroll C. (2016). Locally downscaled and spatially customizable climate data for historical and future periods for north America. PloS One 11 (6), e0156720. doi: 10.1371/journal.pone.0156720
Wickham H. (2011). "ggplot2." Wiley interdisciplinary reviews: computational statistics 3.2. 180-185.
Wilkening J. L., Ray C., Beever E. A., Brussard P. F. (2011). Modeling contemporary range retraction in great basin pikas (Ochotona princeps) using data on microclimate and microhabitat. Quat. Int. 235, 77–88. doi: 10.1016/j.quaint.2010.05.004
Keywords: nonstationarity, spatio-temporal analysis, Rocky Mountains, species–climate relationships, distribution models, density, American pikas
Citation: Billman PD, Beever EA, Westover ML and Ryals DK (2023) Spatio-temporal variability in the strength, directionality, and relative importance of climate on occupancy and population densities in a philopatric mammal, the American pika (Ochotona princeps). Front. Ecol. Evol. 11:1202610. doi: 10.3389/fevo.2023.1202610
Received: 08 April 2023; Accepted: 14 June 2023;
Published: 25 July 2023.
Edited by:
Robert Klinger, United States Department of the Interior, United StatesReviewed by:
Charles Krebs, University of British Columbia, CanadaDaniel Scherrer, Swiss Federal Institute for Forest, Snow and Landscape Research (WSL), Switzerland
Copyright © 2023 Billman, Beever, Westover and Ryals. This is an open-access article distributed under the terms of the Creative Commons Attribution License (CC BY). The use, distribution or reproduction in other forums is permitted, provided the original author(s) and the copyright owner(s) are credited and that the original publication in this journal is cited, in accordance with accepted academic practice. No use, distribution or reproduction is permitted which does not comply with these terms.
*Correspondence: Peter D. Billman, cGV0ZXIuYmlsbG1hbkB1Y29ubi5lZHU=