
95% of researchers rate our articles as excellent or good
Learn more about the work of our research integrity team to safeguard the quality of each article we publish.
Find out more
ORIGINAL RESEARCH article
Front. Ecol. Evol. , 13 September 2023
Sec. Interdisciplinary Climate Studies
Volume 11 - 2023 | https://doi.org/10.3389/fevo.2023.1201748
This article is part of the Research Topic Hydrological and Hydrochemical Processes in Fragile Ecosystems View all 9 articles
 Brahim Ait Said1*†
 El-Mostafa Mili1El Mati El Faleh1Radouan Mehdaoui1Abderrahmane Mahboub2Fatima Ezzahra Hamid2Jihane Tlemcani2Rabia El Fakir1
The Palm Grove ecosystems situated in the southeastern region of Morocco are highly vulnerable to compromise, encountering significant challenges due to insufficient precipitation and limited availability of groundwater. The objective of this study is to evaluate the groundwater quality of the Tinejdad-Touroug aquifer for domestic and irrigation purposes. Groundwater flows from southwest to northeast mostly in Quaternary conglomerate-lacustrine facies in the Rheris basin. The results show that the domination of the major ions is in the following order: Cl−>HCO3−>SO42−>Na+>Ca2+>Mg2+>NO3−>K+>NO2−>NH4+. Piper diagram showed the predominance of a single mixed chemical facies Cl-SO4-Ca-Mg, as well as the presence of exceptions of some samples that showed other facies variations. The water quality index (WQI) assessments of the campaigns that were examined demonstrate that the recorded percentages of poor quality water ranged from 40% to 90% while the percentages of good quality water varied from 7.7% to 54.5%. The remaining samples reveal different classes with varying percentages. Most of the sites in all campaigns had drinking water parameters that exceeded the values established by the World Health Organization (WHO) and Moroccan standards. Nevertheless, the parameters of Temperature, pH, TH, DO, Ca2+, SO42−, K+, NH4+, and bacteriological parameters were within the required limits. The results of the assessment based on electrical conductivity suggest a significant increase in salinity levels, with an average of 2744.75 µS/cm in 2000, 3248.58 µS/cm in 2007, and 2957.84 µS/cm in 2021. The findings of the study reveal a positive assessment regarding the quality of the water samples examined during the eight sampling campaigns, as indicated by the PI and KR indices. However, additional investigation of the SAR, Na%, and MH indices revealed that three water samples acquired from separate surveys are not appropriate for irrigation purposes, showing that groundwater must be controlled until it can be properly used. The outcomes accentuate the necessity of consistent monitoring and evaluation of water quality parameters to establish the safe and sustainable exploitation of water resources for domestic and agricultural purposes. Elevated salinity levels in Quaternary aquifers resulting from natural mechanisms such as increased rates of evaporation and geological factors may have contributed to the degradation of groundwater quality.
Water scarcity is a pressing issue that needs immediate attention on a global scale. Demographic growth and the development of irrigated agricultural areas have all contributed to increasing global water demands (Viviroli et al., 2020). Groundwater has become the most commonly used natural resource globally due to developments in pumping technology over the last several decades (Li et al., 2021), which currently contributes almost half of the world’s drinking water (Ouarani et al., 2020). The problem becomes more serious in arid areas where groundwater is the primary source of water provision for households, agriculture, and industry (Mukherjee and Singh, 2018).
Morocco, a country with a semi-arid climate, is one of the most sensitive countries to the impacts of climate change (Ouhamdouch et al., 2016; Dahan et al., 2017). It is characterized by the spatiotemporal irregularity of precipitation, which decreases whenever it approaches southward (Salhi et al., 2019). Groundwater depletion occurs when the aquifer’s discharge rate exceeds the rate of recharge, resulting in an imbalance between water resources and recharge demand (Masoud et al., 2019). Approximately 4 billion cubic meters of groundwater, which can be utilized, are extracted annually. Agriculture is the primary recipient of this resource, receiving 86%, followed by industry with 5.5% and human consumption with 8.5% (Sarti et al., 2021).
The country’s southeast is subject to the warning of overexploitation as a result of climate change and increased agricultural pumping. The Tinejdad-Touroug’s prospective groundwater resources are the quaternary aquifer, which borders the Ferkla Valley and is near the Wadi’s alluvium. The piezometric level appears to be dropped more to the east of the nappe, where pumping is more prominent (Baki et al., 2017). To resolve the current water consumption, the hydraulic basin agency has made significant investments in developing artificial recharge systems to promote the recharging of subsurface aquifers through infiltration and support renewable water resources.
Groundwater quality evaluation and management are critical in arid and semi-arid environments for water resource preservation and sustainable development (Ismail et al., 2021). Due to a shortage of precipitation and a scarcity of groundwater, the Tinejdad region has more exposed environments and has additional challenges in combining current prosperity with long-term development objectives. Comprehensive assessment and analysis of water quality data may contribute to identifying interactions between different contaminants and climate-related stresses accumulating in groundwater. Unfortunately, substantial data deficiencies currently exist especially in countries with low incomes, making predictive detection of water quality issues complicated. In general, the physical characteristics, chemical composition, and usage requirements of water influence its quality for various applications (AlSuhaimi et al., 2019). Groundwater composition reflects the nature of recharge, water–rock interaction, and weather conditions all influence groundwater quality (Qureshi et al., 2021).
Consequently, regular groundwater resource monitoring is crucial for sustainability, and water resource managers can evaluate the proper use of water for drinking or agricultural purposes depending on groundwater quality (Al-Asadi et al., 2020). Considering the importance of groundwater resources in southern Morocco, scientists have recently conducted a considerable amount of research to study the hydrogeological and hydrogeochemical features of the adjacent regions. These include papers on the Ziz basin by (Lgourna et al., 2015; Roubil et al., 2022), Guir basin by (Abdelfadel et al., 2020) the Middle Ziz aquifer by (Mehdaoui et al., 2019), and the Tafilalet plain by (Bouaamlat et al., 2016; El Ouali et al., 2023). Therefore, the quality of groundwater in the Tinejdad-Touroug region was investigated in this study in order to assess its suitability for domestic and irrigation purposes. The objectives of this paper are to (i) investigate the hydrochemical characterization of the groundwater resources of the alluvium aquifer in the Tinejdad-Touroug area, (ii) compare the results of the physicochemical analyses and the groundwater quality state to other studied areas, and (iii) provide a preliminary assessment of its suitability for domestic and agricultural uses.
The study area is located in the southeast of Morocco and is administered by the province of Errachidia. It is located within the downstream part of the Rheris watershed (Figure 1). This region, which is part of the southeast Moroccan oases, has typical morphology, an east–west plain surrounded on both sides by mountains and traversed by a major stream, the Ferkla Wadi, which joins the Rheris Wadi in the area’s east at Touroug. The majority of it takes the form of a plain in a depression, covered with alluvial soils, with a high potential for restoring the surface water table (Masoud et al., 2019).
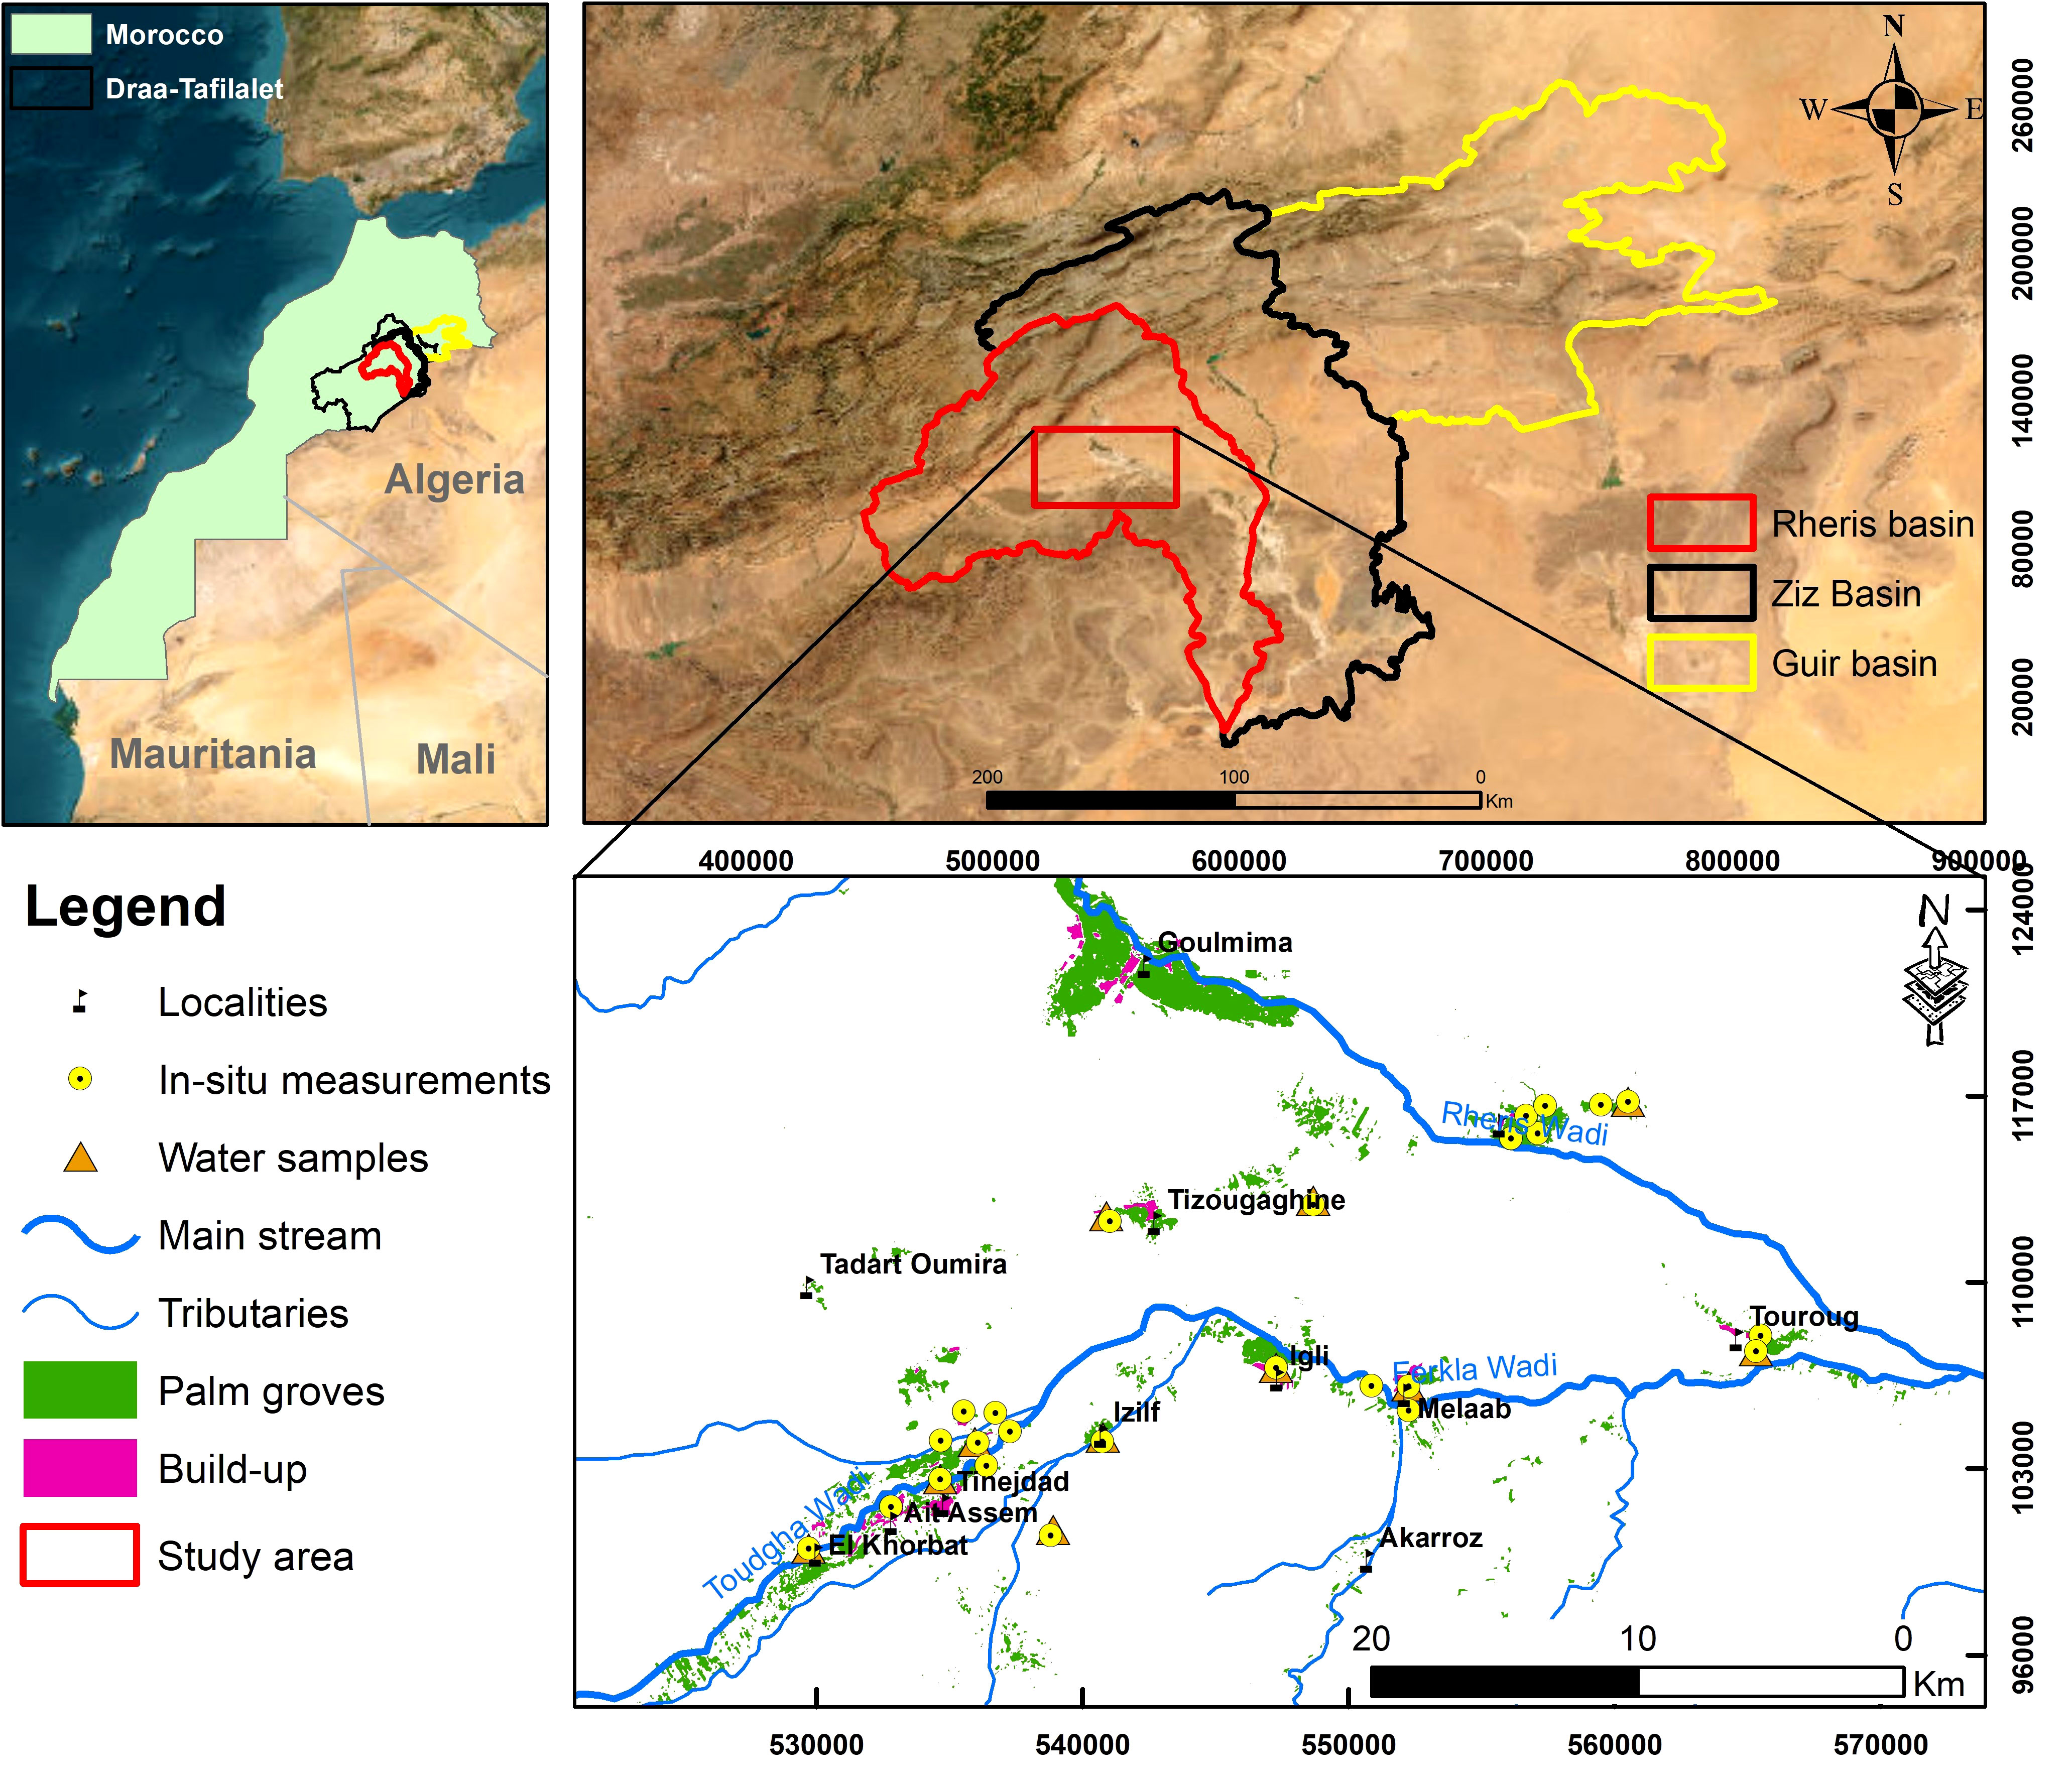
Figure 1 Geographical location of the study area.
The investigated outcrops of the area date from the Mesoproterozoic to the current Quaternary (Figure 2). The Ougnate massif, which includes sedimentary, volcanic, and detrital volcanic outcrops as well as Proterozoic inhabit the southern half of the area and Paleozoic eruptive rocks subject of several studies (Abia, 1991; Soualhine et al., 2003; Soulaimani et al., 2003; Raddi, 2014; Michard et al., 2017; Soulaimani and Hefferan, 2017). The rocks that make up the Neoproterozoic complexes are calc-alkaline and highly potassic in composition, with the characteristic of a subcontinental lithospheric mantle percolated by potassium-rich silicate liquids (El Boukhari et al., 2007). The Paleozoic, consisting mainly of shales, forms the substratum of the entire nappe. The Mesozoic appears to the northwest of the Cretaceous unit, where it is restricted to anomalous contact with the calcareous High Atlas through the South-Atlasic fault. The Anti-Atlas reliefs in the area’s south represent the hardest basement due to their ancient age and eruptive character. These mountains have been substantially eroded, allowing quaternary terraces to build on both sides of the Wadis.
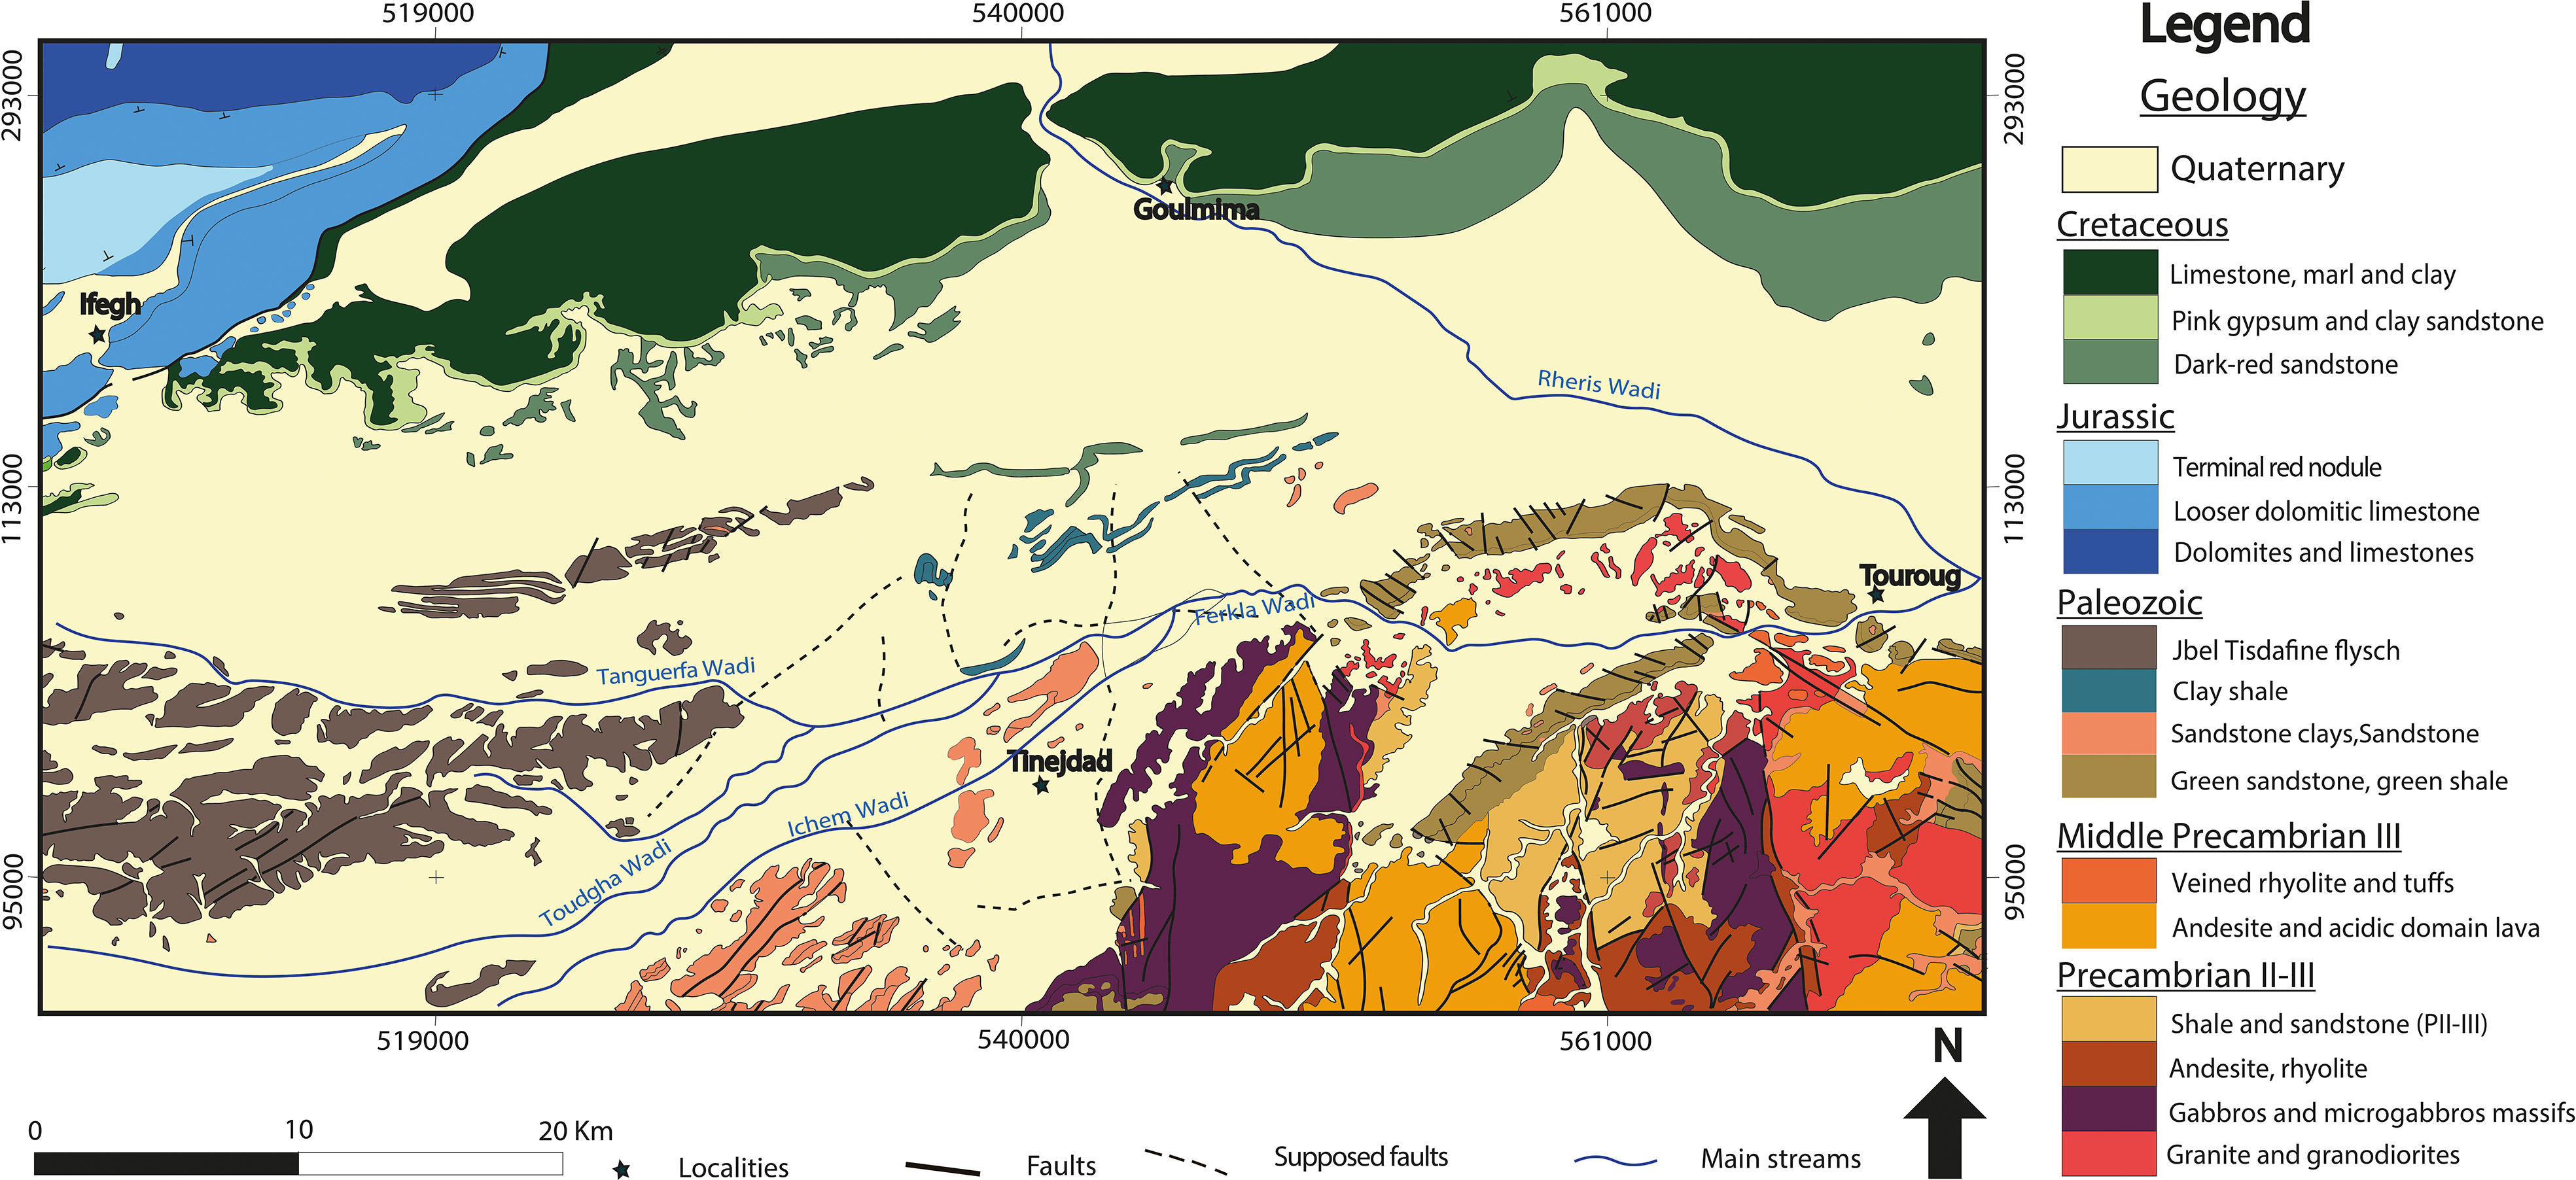
Figure 2 Geological map of the study area.
Quaternary alluvial deposits cover the plain, primarily sand, silt, coarse pebbles, and conglomerates (Margat et al., 1962). Groundwater is the principal source of irrigation in the region. Tinejdad-Touroug groundwater is a free water table primarily composed of conglomerates and lacustrine limestone (Ruhard, 1977).
The region has an arid-continental climate with a severe drought and an increase in temperature. The yearly average temperature is rather high. The hottest maximum temperature reach approximately 47°C was recorded in August, and the lowest drop even as low around −4°C in January. The annual precipitation regime is distinguished by two rainy seasons, autumn and spring, which are separated by a brief winter season with a low relative minimum and a prolonged summer season characterized by droughts (Figure 3). The area under consideration is characterized by a pervasive insufficiency of precipitation. Over the time span of 1982 to 2023, the Tadighoust station has recorded a mean annual rainfall of 138.26 mm, with a substantial majority of precipitation, amounting to more than 90%, occurring between the months of September and April. This data highlights the aridity of the region, which has significant implications for the water supply and ecological balance of the area.
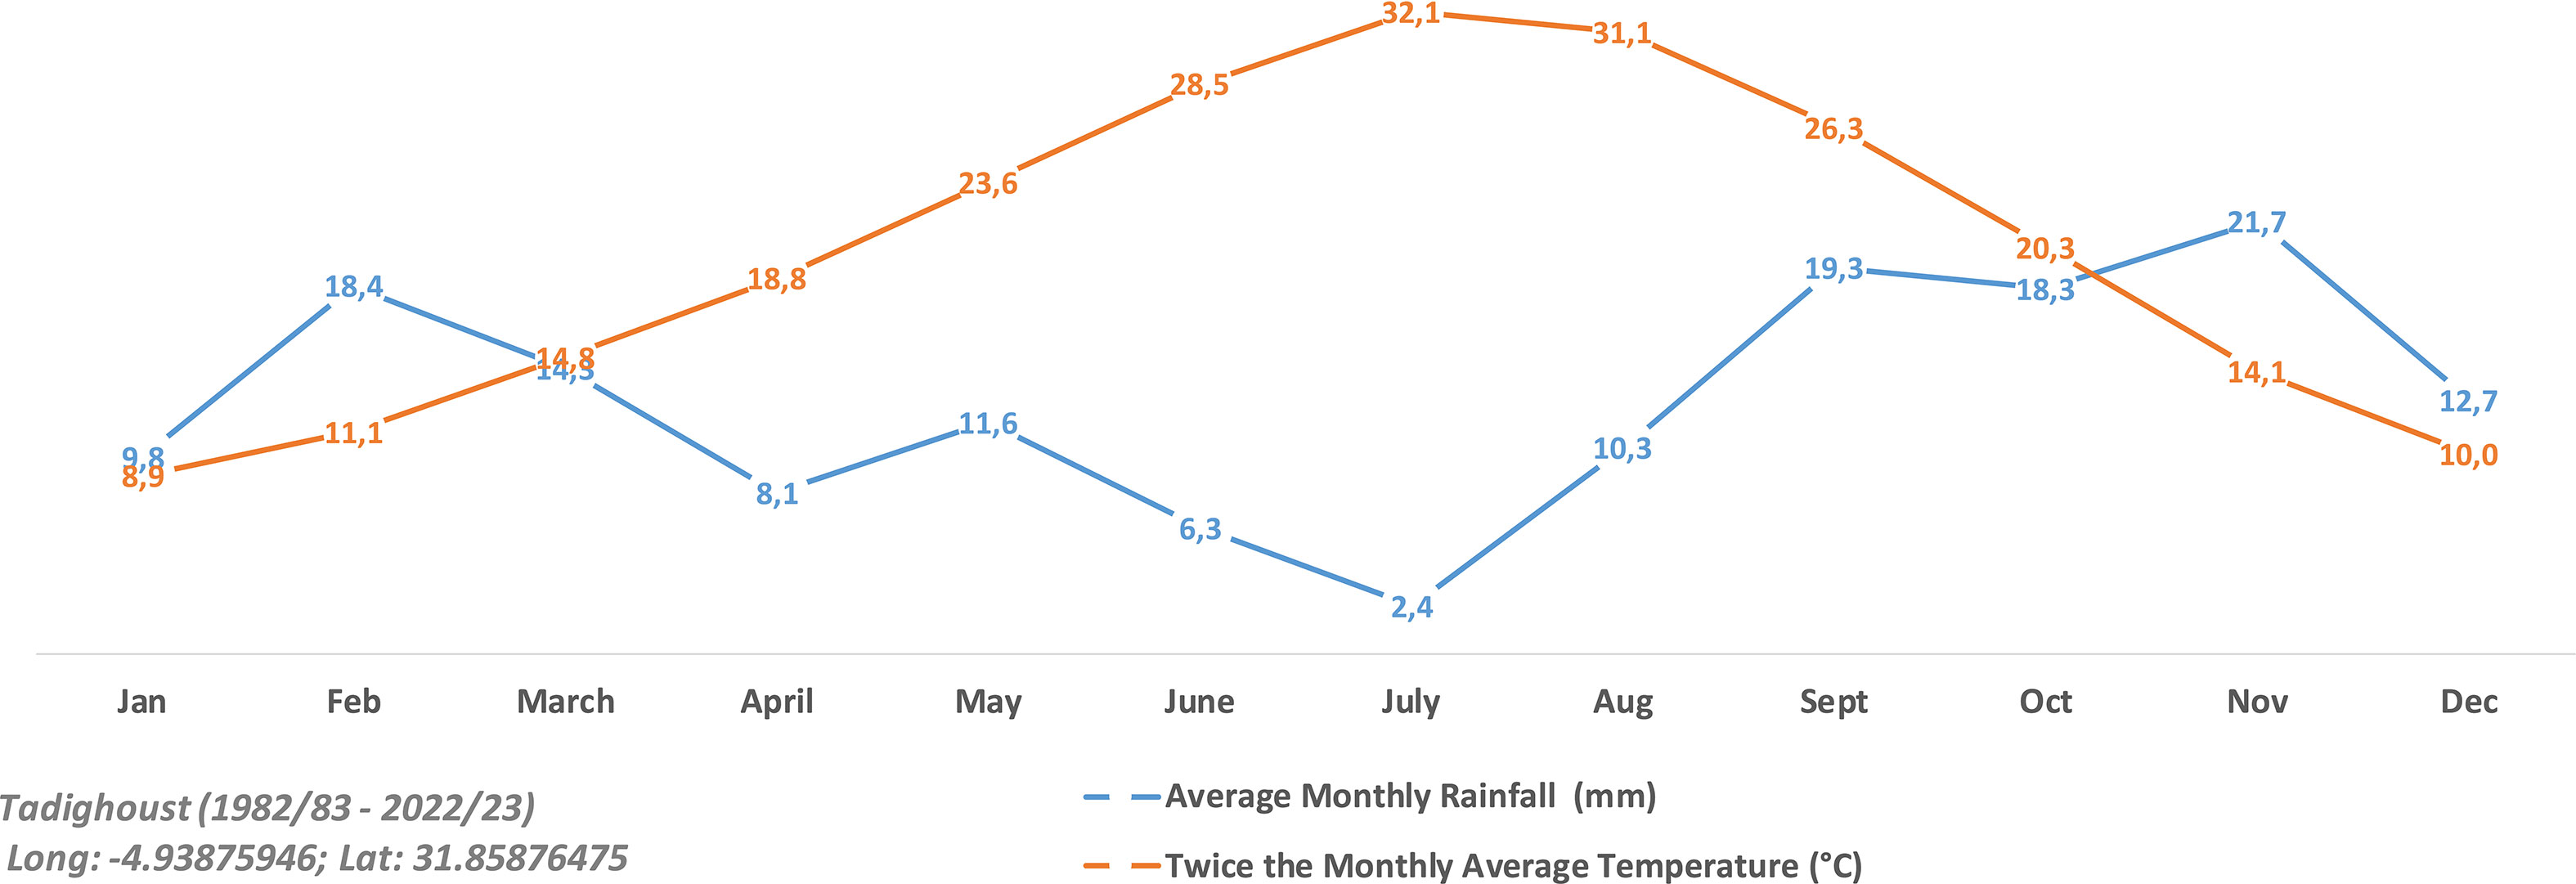
Figure 3 Ombrothermic diagram for Tadighoust weather station.
The Tinejdad-Touroug water table runs the length of Ferkla Wadi. The piezometric history of the water table normally indicates an increase in level throughout the months of September, January, and February, followed by a period of stability. Except for the downstream portion of Touroug, where the flow direction is from East to West (Kabiri, 2005), the piezometric map (Figure 4) reveals that the flow is from north-east to south-west. The observations of water level indicate that the magnitude of depth fluctuates from 8 meters to 28 meters, whereas the water table exhibits a limited depth ranging between 8 and 11 meters, which gradually reduces towards the southern region at the junction of Anti-Atlas formations and downstream of the aquifer.
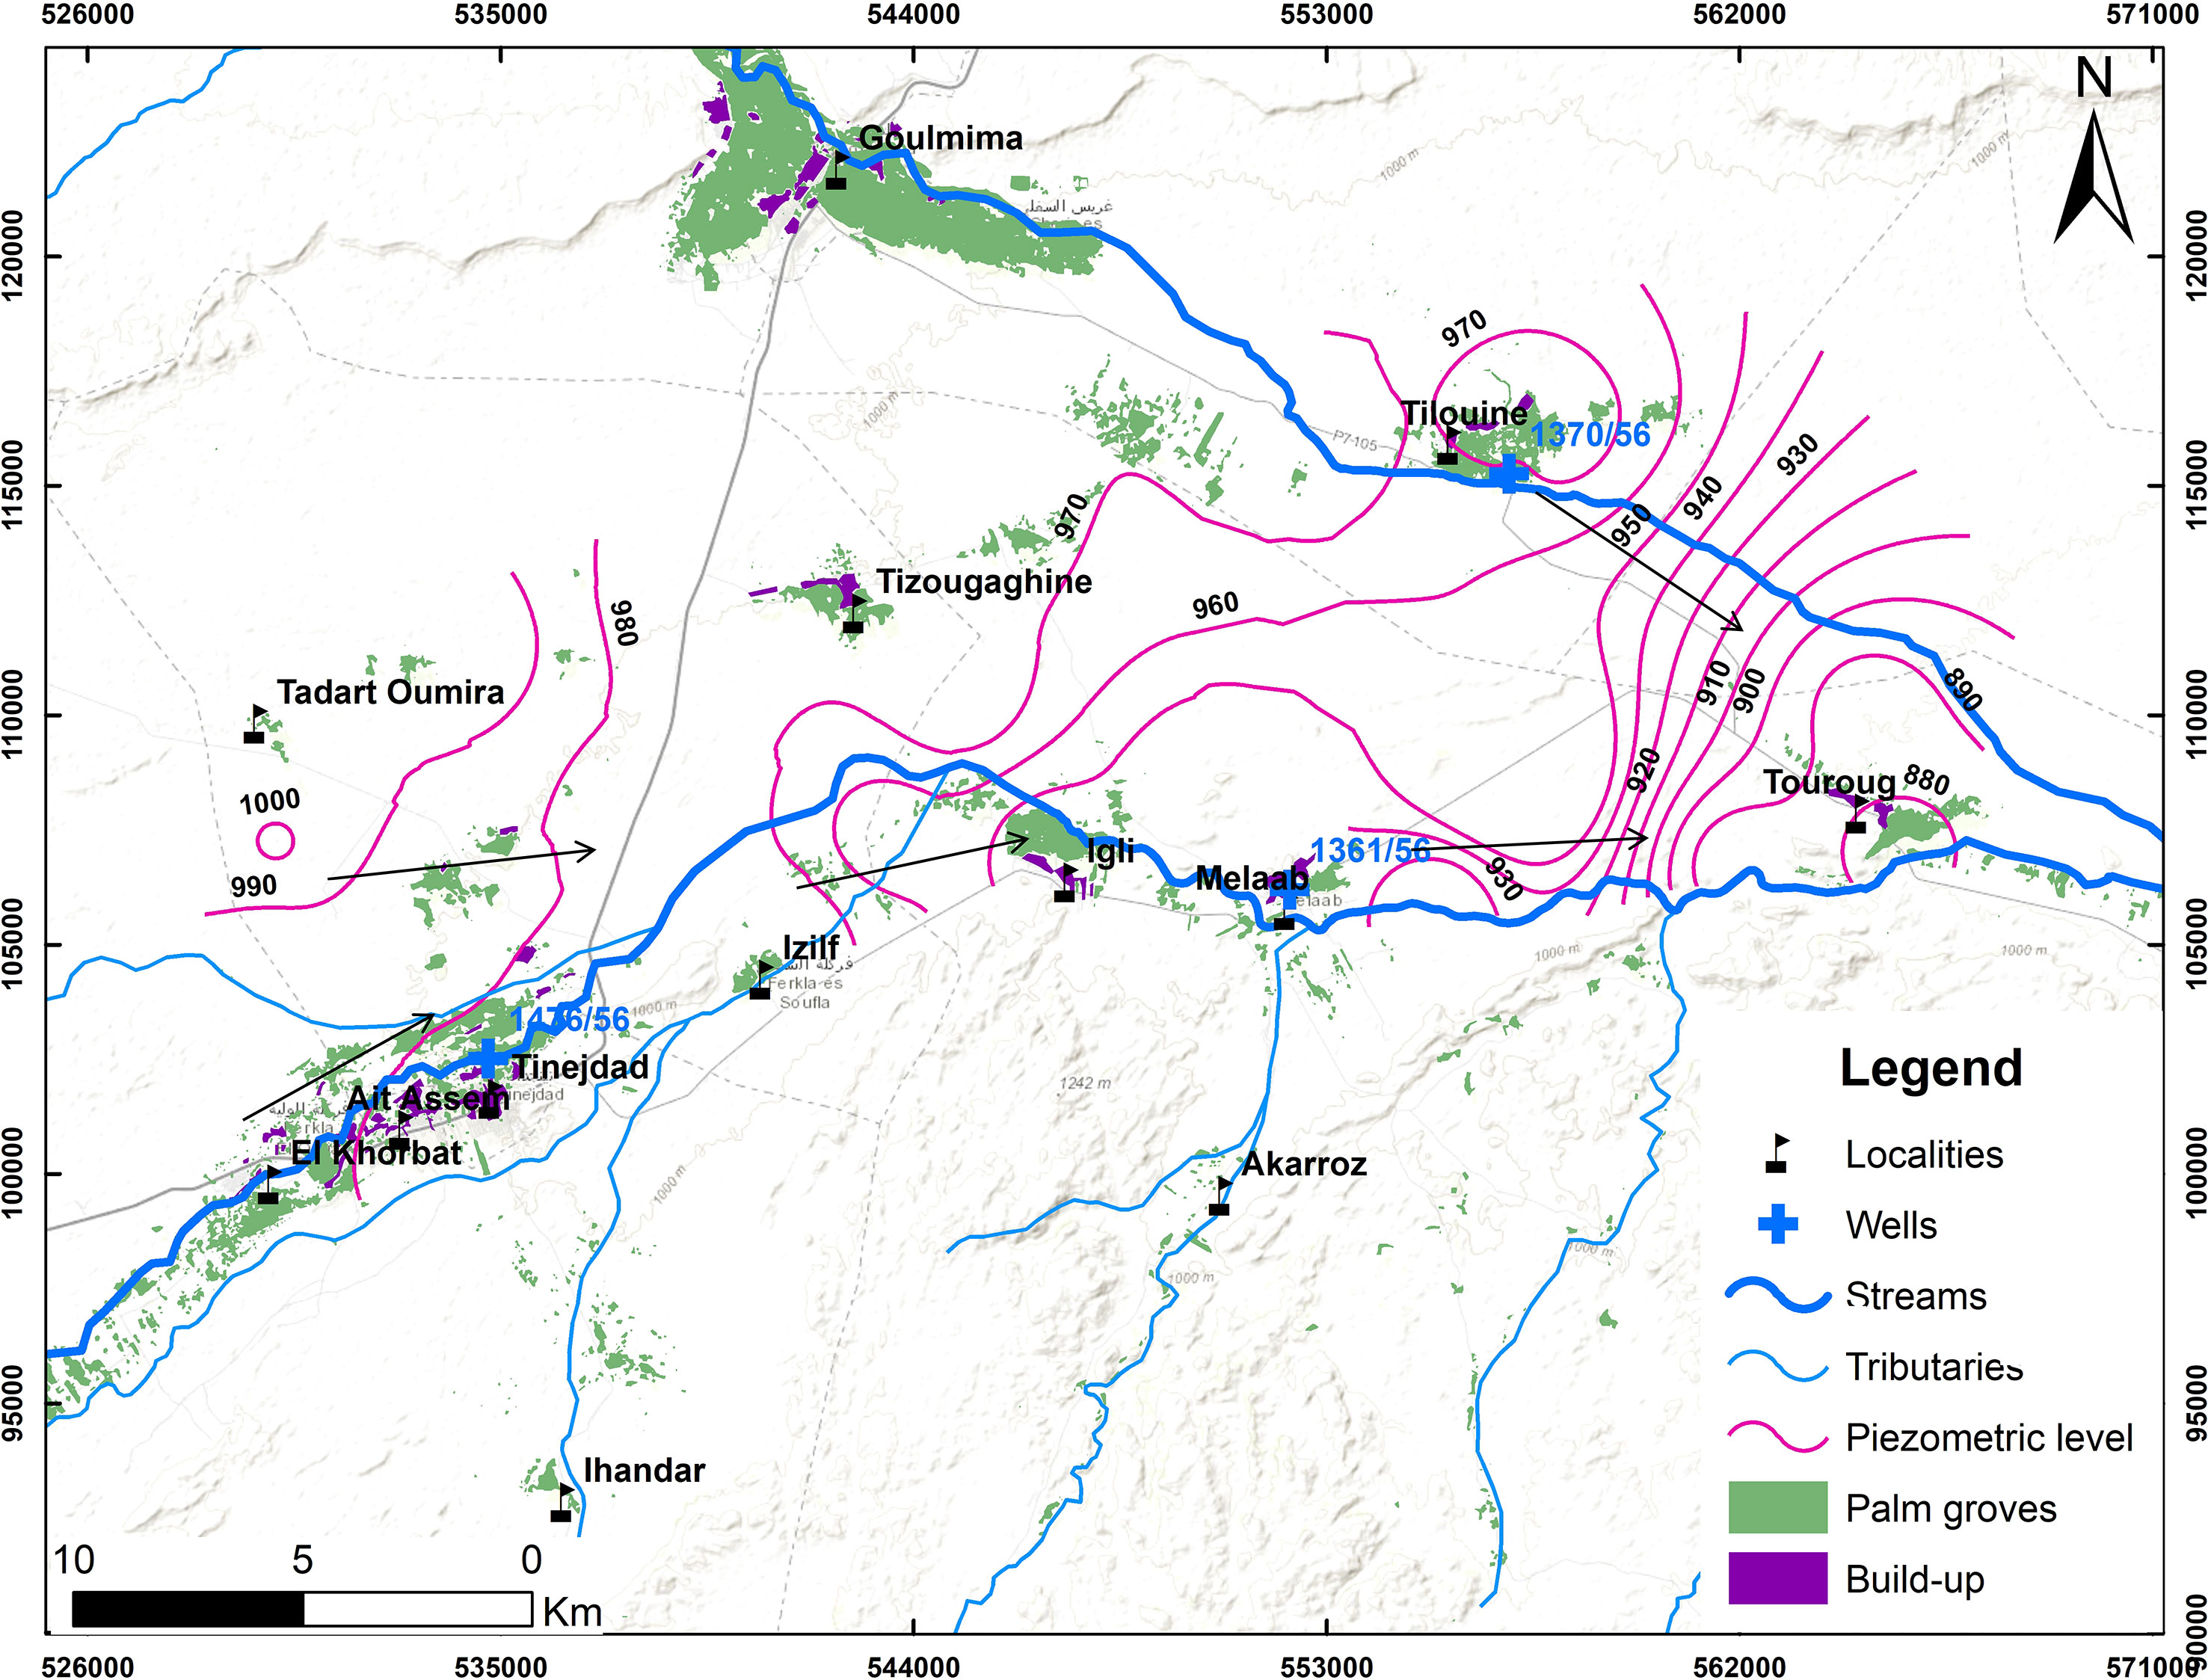
Figure 4 Piezometric level in the Tinejdad-Touroug area.
The return of surface water in the Wadis and streams following the extra rainfall amplified the rise in the piezometric level in 2015 (Figure 5). On the other hand, the drop in the piezometric level was initiated by the overuse of groundwater for irrigation following the succession of dry years and the growth of irrigated regions, as well as the irrigation style dominant in the region (gravity irrigation). Indeed, the over-pumping of groundwater for irrigation is the major reason for drought stress (Foster and Garduño, 2013).
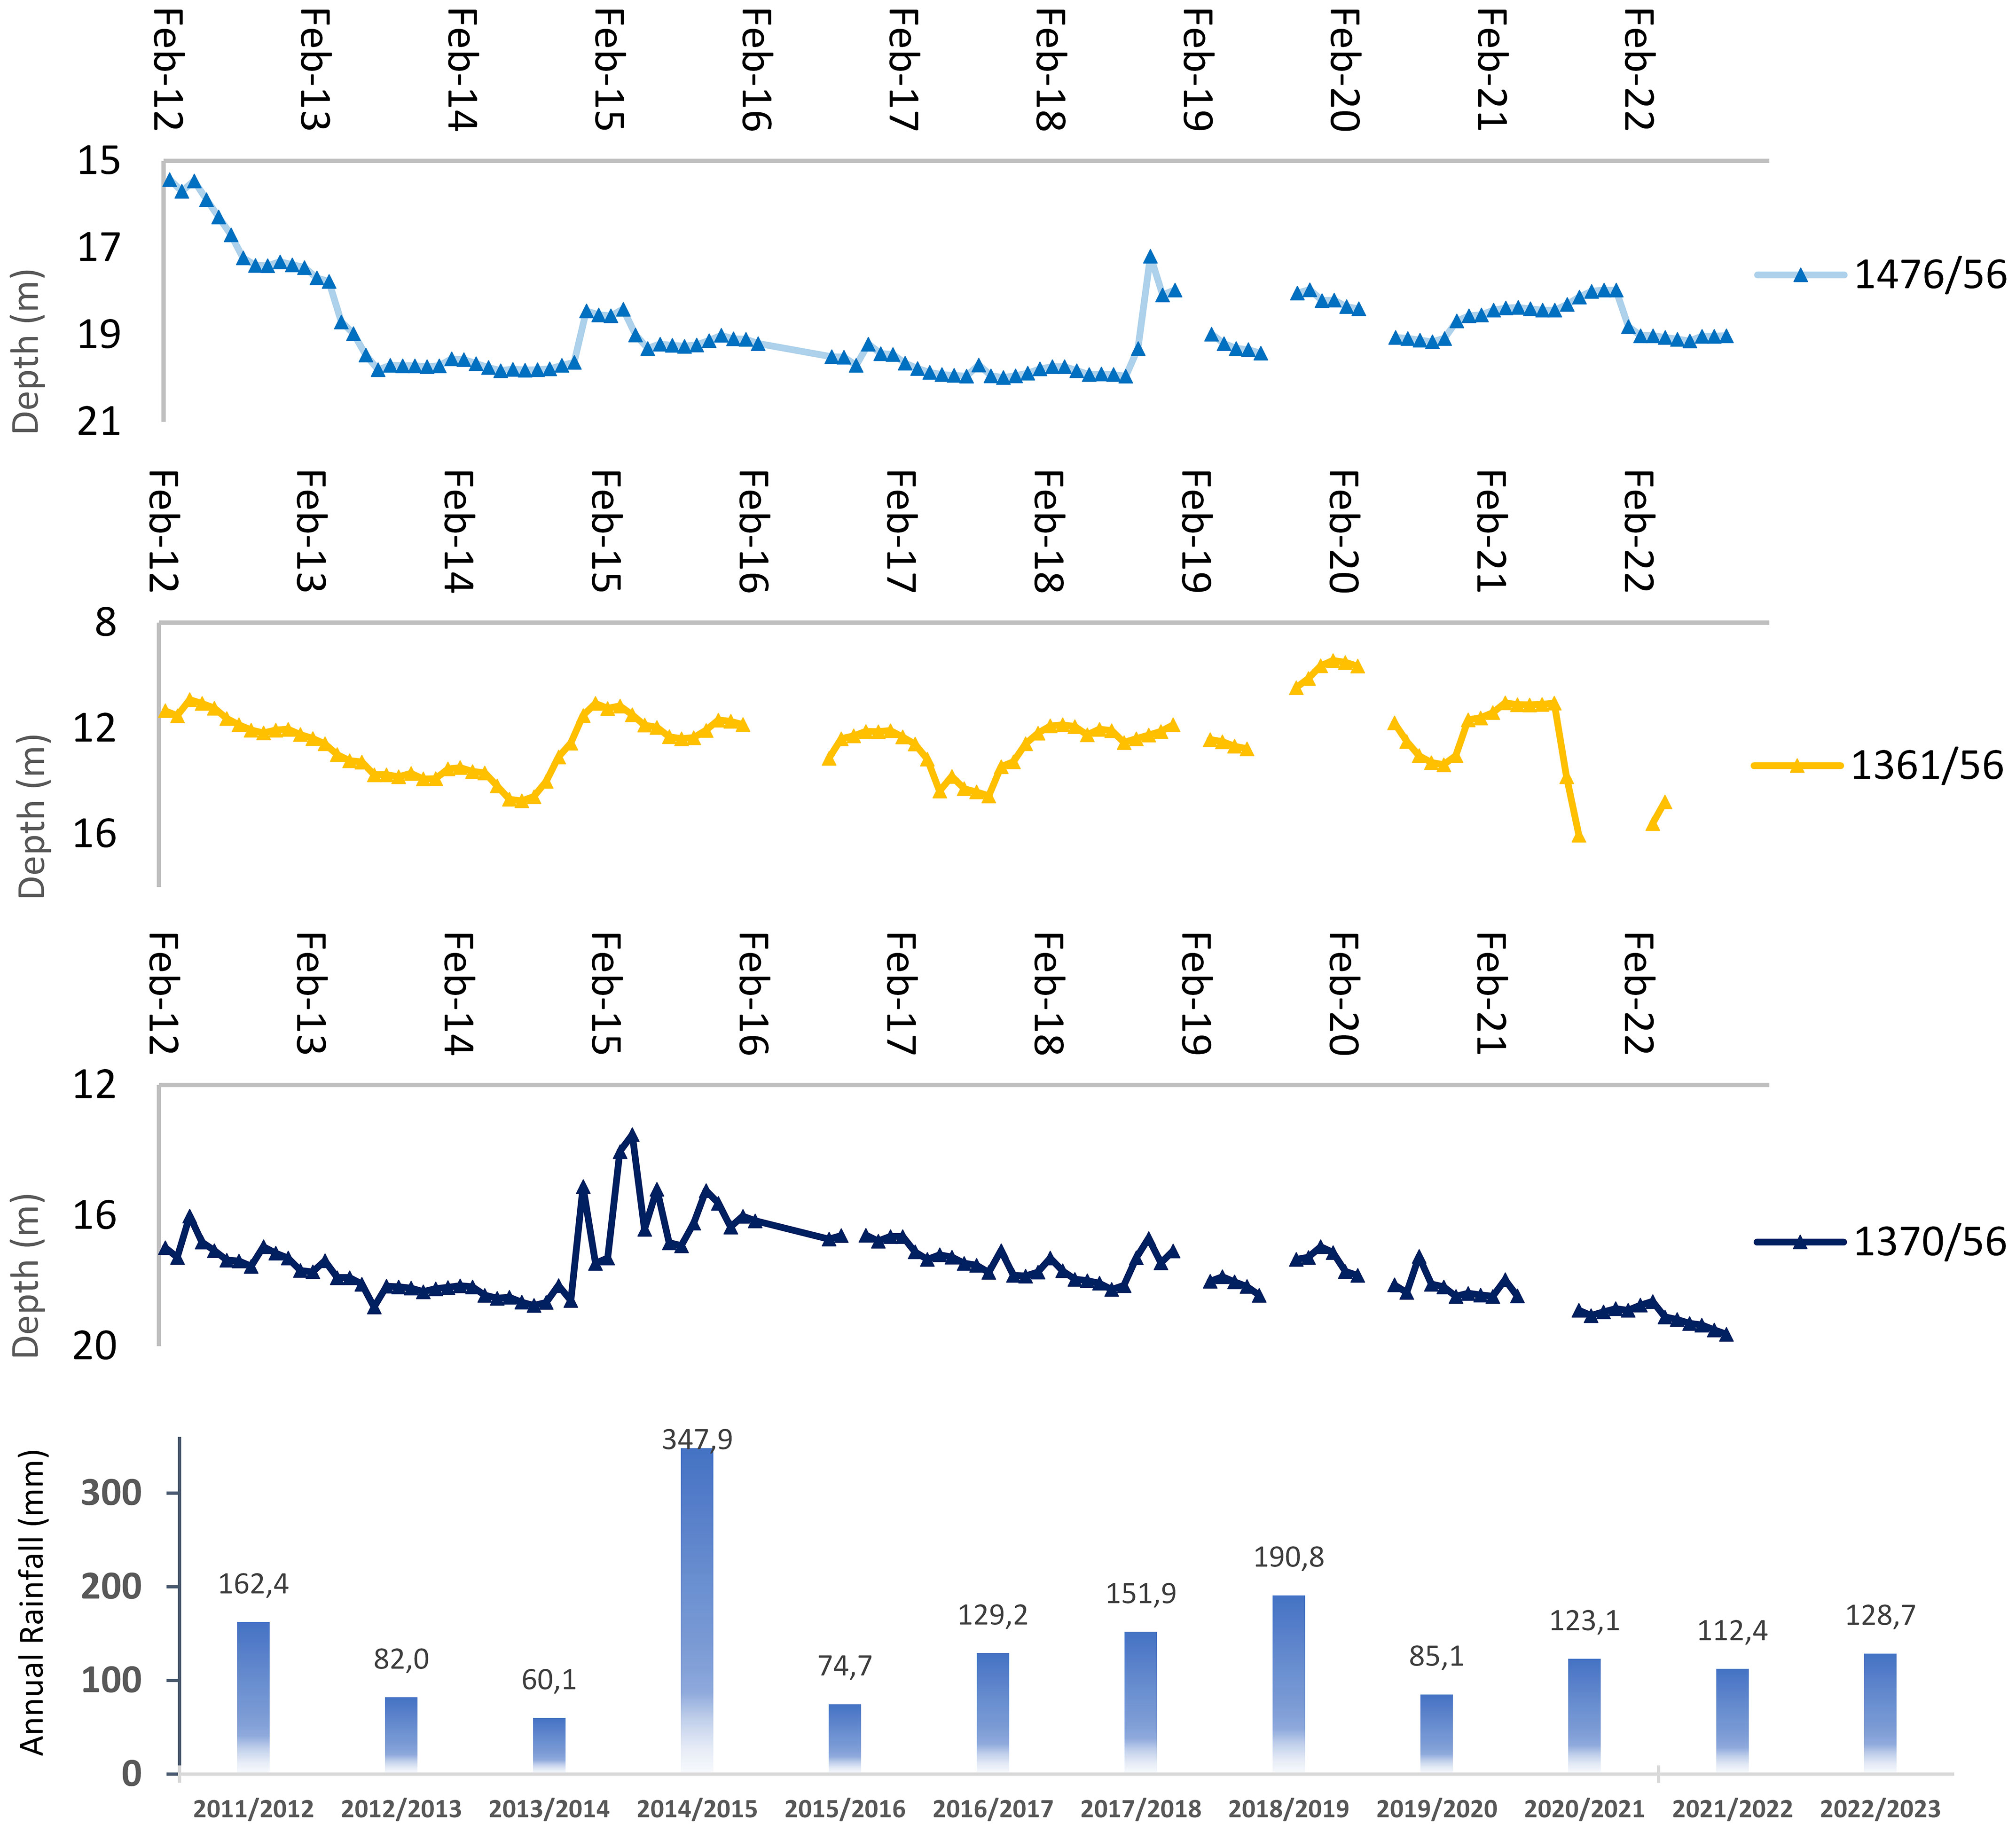
Figure 5 Variations of water level in particular wells in terms of rainfall.
A total of 27 wells were selected to provide representative samples from various locations. The wells under investigation are also part of the Guir-Ziz-Rheris Hydraulic Basin Agency’s controlled network (Supplementary Material: Table 2). The probe HI 9829 was employed in the field to measure physical parameters such as pH, turbidity, dissolved oxygen, electrical conductivity, total dissolved solids, and temperature, and 11 water points were sampled and stored in sanitized polyethylene bottles for analysis of major ions using the methods described by Rodier (2009). Furthermore, biological parameters such as total coliforms, faecal coliforms, and faecal streptococci were examined using the Most Probable Number (MPN) approach. These 11 water points were accurately sampled based on data provided by the Guir-Ziz-Rheris Hydraulic Basin Agency on physicochemical and biological parameters from 2000 to 2020 thus allowing the investigation of the spatiotemporal variations of the aquifer’s hydrochemical properties.
The Ionic Balance (IB) was used to verify the results of the analysis. Within an acceptable error range, the total of cations concentrations equals the sum of anions concentrations, usually 5% nonetheless up to 10% is allowed (Şen, 2014). The ionic balance was calculated as follows:
The ionic balance of all examined samples is within the tolerance value. Table 1 summarizes the hydrochemical water results of all samples analyzed. The remaining parameters not listed in Table 1 are given in the Supplementary Material: Table 3.
Table 1 Range, average, and median of the physicochemical parameters of the analyzed samples in the Tinejdad-Touroug aquifer.
The OriginPro software version 10.0.0.154 (Learning Edition) was used to perform the Piper diagram projection, Gibbs diagrams, multivariate analysis, essentially the Principal Component Analysis (PCA) commonly applied when assessing hydrochemical data, and box plots. The relevant Geographic Information System (GIS) was employed to create thematic maps for exploring the spatial variations of the parameters.
The critical aspects and indicators of water quality are typically employed to derive the WQI, which serves as a comprehensive metric for evaluating the suitability of water for specific uses and identifying any potential risks linked with its consumption. The current investigation employs a methodology that is widely used by scientists all over the world, highlighting the commonality of study approaches (Akter et al., 2016; Satish Kumar et al., 2016; El-Zeiny and Elbeih, 2019; Asadi et al., 2020; Chakravarty and Gupta, 2021; Afshan et al., 2022; Alshehri and Abdelrahman, 2023; Diédhiou et al., 2023). In order to accommodate the specific requirements of local water quality monitoring and evaluation, it is possible for the factors and weightages utilized in the computation of the water quality index to vary from one region to another. This study utilized a method that selected thirteen parameters associated with water quality, such as EC, pH, TDS, Ca2+, Mg2+, Na+, K+, HCO3−, SO42−, Cl−, NO3−, NO2− and NH4− in order to determine the water quality index. For the present investigation, the Water Quality Index (WQI) was computed using the World Health Organization (WHO, 2022) standards presented in Table 2 and the subsequent equations:
Table 2 Simplified grid for assessing groundwater quality (Moroccan standards, 2002; WHO, 2022).
Wi defines the weight of each parameter, n is for the number of parameters, wi refers to the relative weight of each parameter. The weight (wi) of each parameter and the resulting relative weight value (Wi) are shown in Supplementary Material: Table 5. Qi represents the quality assessment, Ci is for the concentration of a single physicochemical parameter in each water sample, and Si serves to the WHO drinking water standard for each physicochemical parameter. The pH standard is between 6.5 and 8.5 (WHO, 2022), and the assessment method was thus obtained using the following equation:
The irrigation suitability indicators often used for analyzing water relevance include Sodium Absorption Rate (SAR), Sodium Percent (Na%), Kelly’s Ratio (KR), Magnesium Hazard (MH), and Permeability Index (PI), which have been estimated using the formulas shown in Table 3.
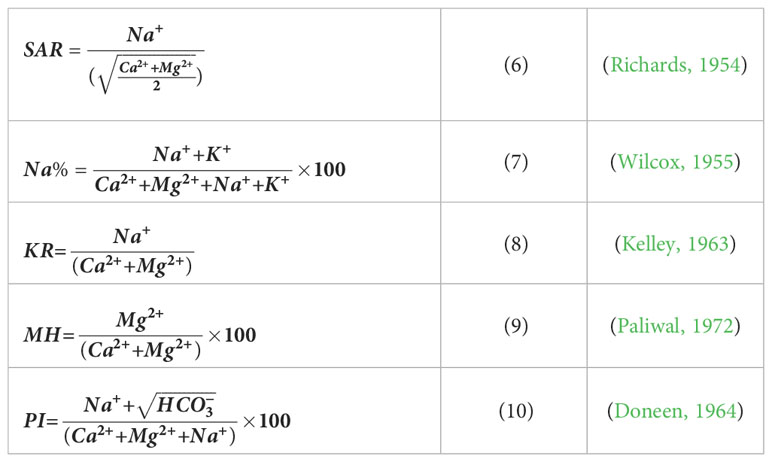
Table 3 Irrigation quality indices.
The Pearson coefficient of correlation values for variable pairs at all sampling sites were used to estimate the relations between the parameters, as well as the probable origin of each group (Supplementary Material: Table 4). The results show a negative correlation between electrical conductivity and pH (r = −0,65), NO2− (r = −0.14), and the permanganate index (r = −0.16). pH has a negative correlation with K+ (r = −0.03), Na+ (r = −0.61), Ca2+ (r = −0.66), Cl− (r = −0.72), Mg2+ (r = −0.71), SO42− (r = −0.61) and HCO3− showed a strong positive correlation with K+ (r = 0.97), but no other parameters revealed any correlation. This implies that HCO3− and K+ have the same origin due to mineral dissolution from adjacent rocks. A strong positive correlation has been found between EC and Cl− (r = 0.97), Ca2+ (r = 0.95), Na+ (r = 0.94), Mg2+ (r = 0.95), SO42− (r = 0.85), and NO3− (r = 0.76), suggesting that these elements are the primary cause of salinity. Ca2+ and Cl− have a positive significant correlation (r = 0.98), Mg2+ (r = 0.90), SO42− (r = 0.86), and Na+ (r = 0.84), K+, on the other hand, displays an opposite correlation (r = −0.06). Except for HCO3−, as shown before, there was a very low correlation between K+ and the other elements where r was in the range of −0.03 to 0.3. The same thing is noticeable in the NO2− and permanganate index values, which are not correlative to other elements, implying that their source is independent.
The results demonstrate high correlations between the major elements, particularly Na+ vs Mg2+, Ca2+ vs Cl−, Mg2+ vs Cl−, HCO3− vs K+, and Mg2+ vs SO42−. This remarkable association between all of these essential elements reveals their common origin in groundwater, which is most probably due to geological origins such as calcareous rocks in the northern Atlas Mountains and Paleozoic bedrock from the Anti-Atlas Mountains. On the other hand, there is a robust correlation between EC and the primary components, which can offer valuable insights into the role of these elements in both procuring and managing saline charge in groundwater.
PCA is a descriptive statistical approach for identifying the association of variables and classifying them into families of similar origin. These new variables, known as principle components, indicate the fundamental determinants influencing groundwater chemistry (Panneerselvam et al., 2023b). The results show that the first two factors (F1, F2) explain the majority of the information sought and significantly represent the clustering of water samples, providing around 68.66% to 79.55% of the total variance explained, which can be considered sufficient to analyze the approach of variables and individuals to identify the main sources of hydrochemical variation. Figure 6 illustrates the PCA loading results for the physicochemical parameters using correlation circles.
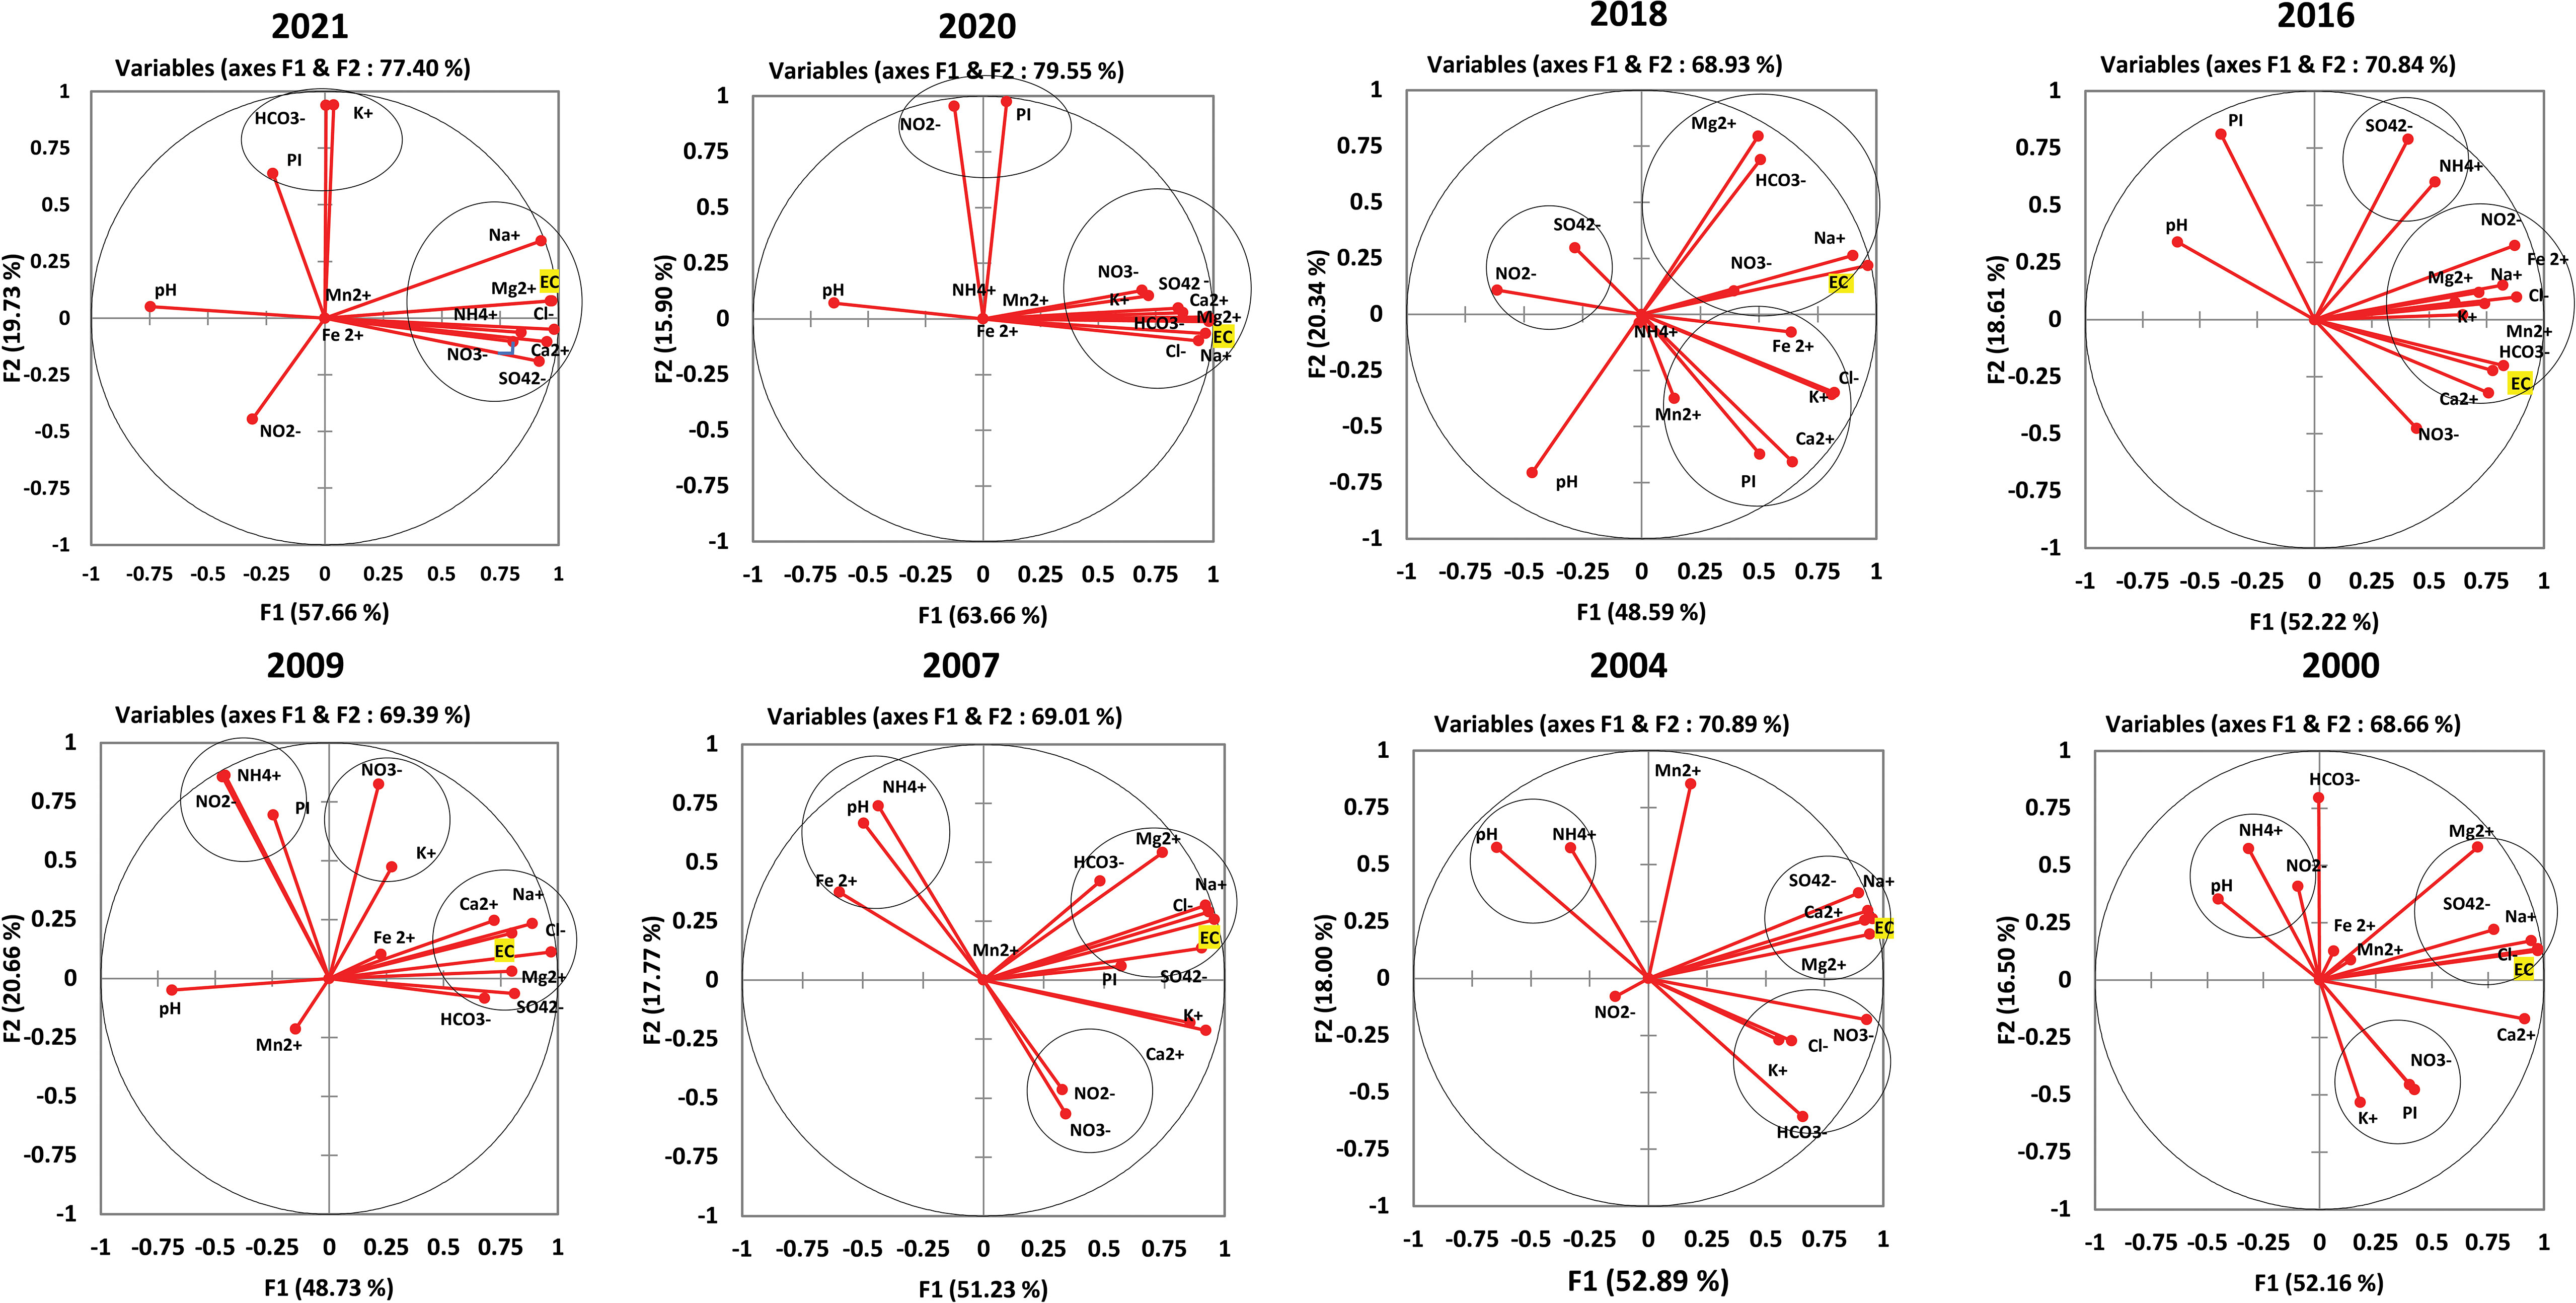
Figure 6 Correlation circle of groundwater samples based on physicochemical parameters.
The first component (F1) explains 48.59% to 63.66% of the overall variation, with strong positive assembling for EC, Cl−, Ca2+, Mg2+, and SO42−, and moderate positivity for HCO3−. This component controls the hydrogeochemical process resulting in significant elements influencing the acquisition of increased salt content in groundwater. Indeed, rising levels of EC in groundwater result in a higher level of ion concentration (Omer, 2019). Even though EC is frequently attributed to geological factors, the role of anthropogenic activities cannot be ignored. The substantial negative pH charge towards this component appears to be indicative of the parameter’s stability in groundwater throughout all surveys, with an affinity to be in arrangement with NH4+ in 2000, 2004, and 2007 campaigns. This shows the presence of quasi-stable concentrations in the investigated area.
The second component (F2) accounts for 15.90% to 20.66% of the variability, alongside the elements shown on this axis displaying random fluctuations in either the positive or negative direction during all of the periods studied. In general, HCO3−, K+, and the permanganate index are highly positively charged, however, NO3− and NO2− are somewhat negative in charge.
The hydrochemical study reveals that the major ions of the quaternary groundwater are dominated in the following order: Cl−>HCO3−>SO42−>Na+>Ca2+>Mg2+>K+>NO3−>NO2−>NH4+. The large range of physicochemical parameter variability shows varying amounts of water salinization and mineralization as illustrated with the box plots (Supplementary Material: Figure 1) that may result from various mechanisms such as natural sources like ion exchange processes between groundwater and geologic strata. As well as the climate of the region which is characterized by high temperatures and a high evaporation rate, palm grove soil lessening (Baki et al., 2016) or anthropogenic sources related to human activities. Piper diagram (Piper, 1944) allows us to estimate the percentage of chemical elements and classify them (Figure 7). The significant proportion of samples obtained throughout the eight sampling campaigns is of mixed Cl-SO4-Ca-Mg type (67% in the 2000 campaign, 80% in 2004, 83% in 2007, 84.6% in 2009, 72.7% in 2016, 81.8% in 2018, 90.9% in 2020, and 92.3% in 2021). Other samples from the previous campaigns have minor amounts of additional chemical facies such as HCO3-Ca-Mg, and mixed SO4-Cl-Na type.
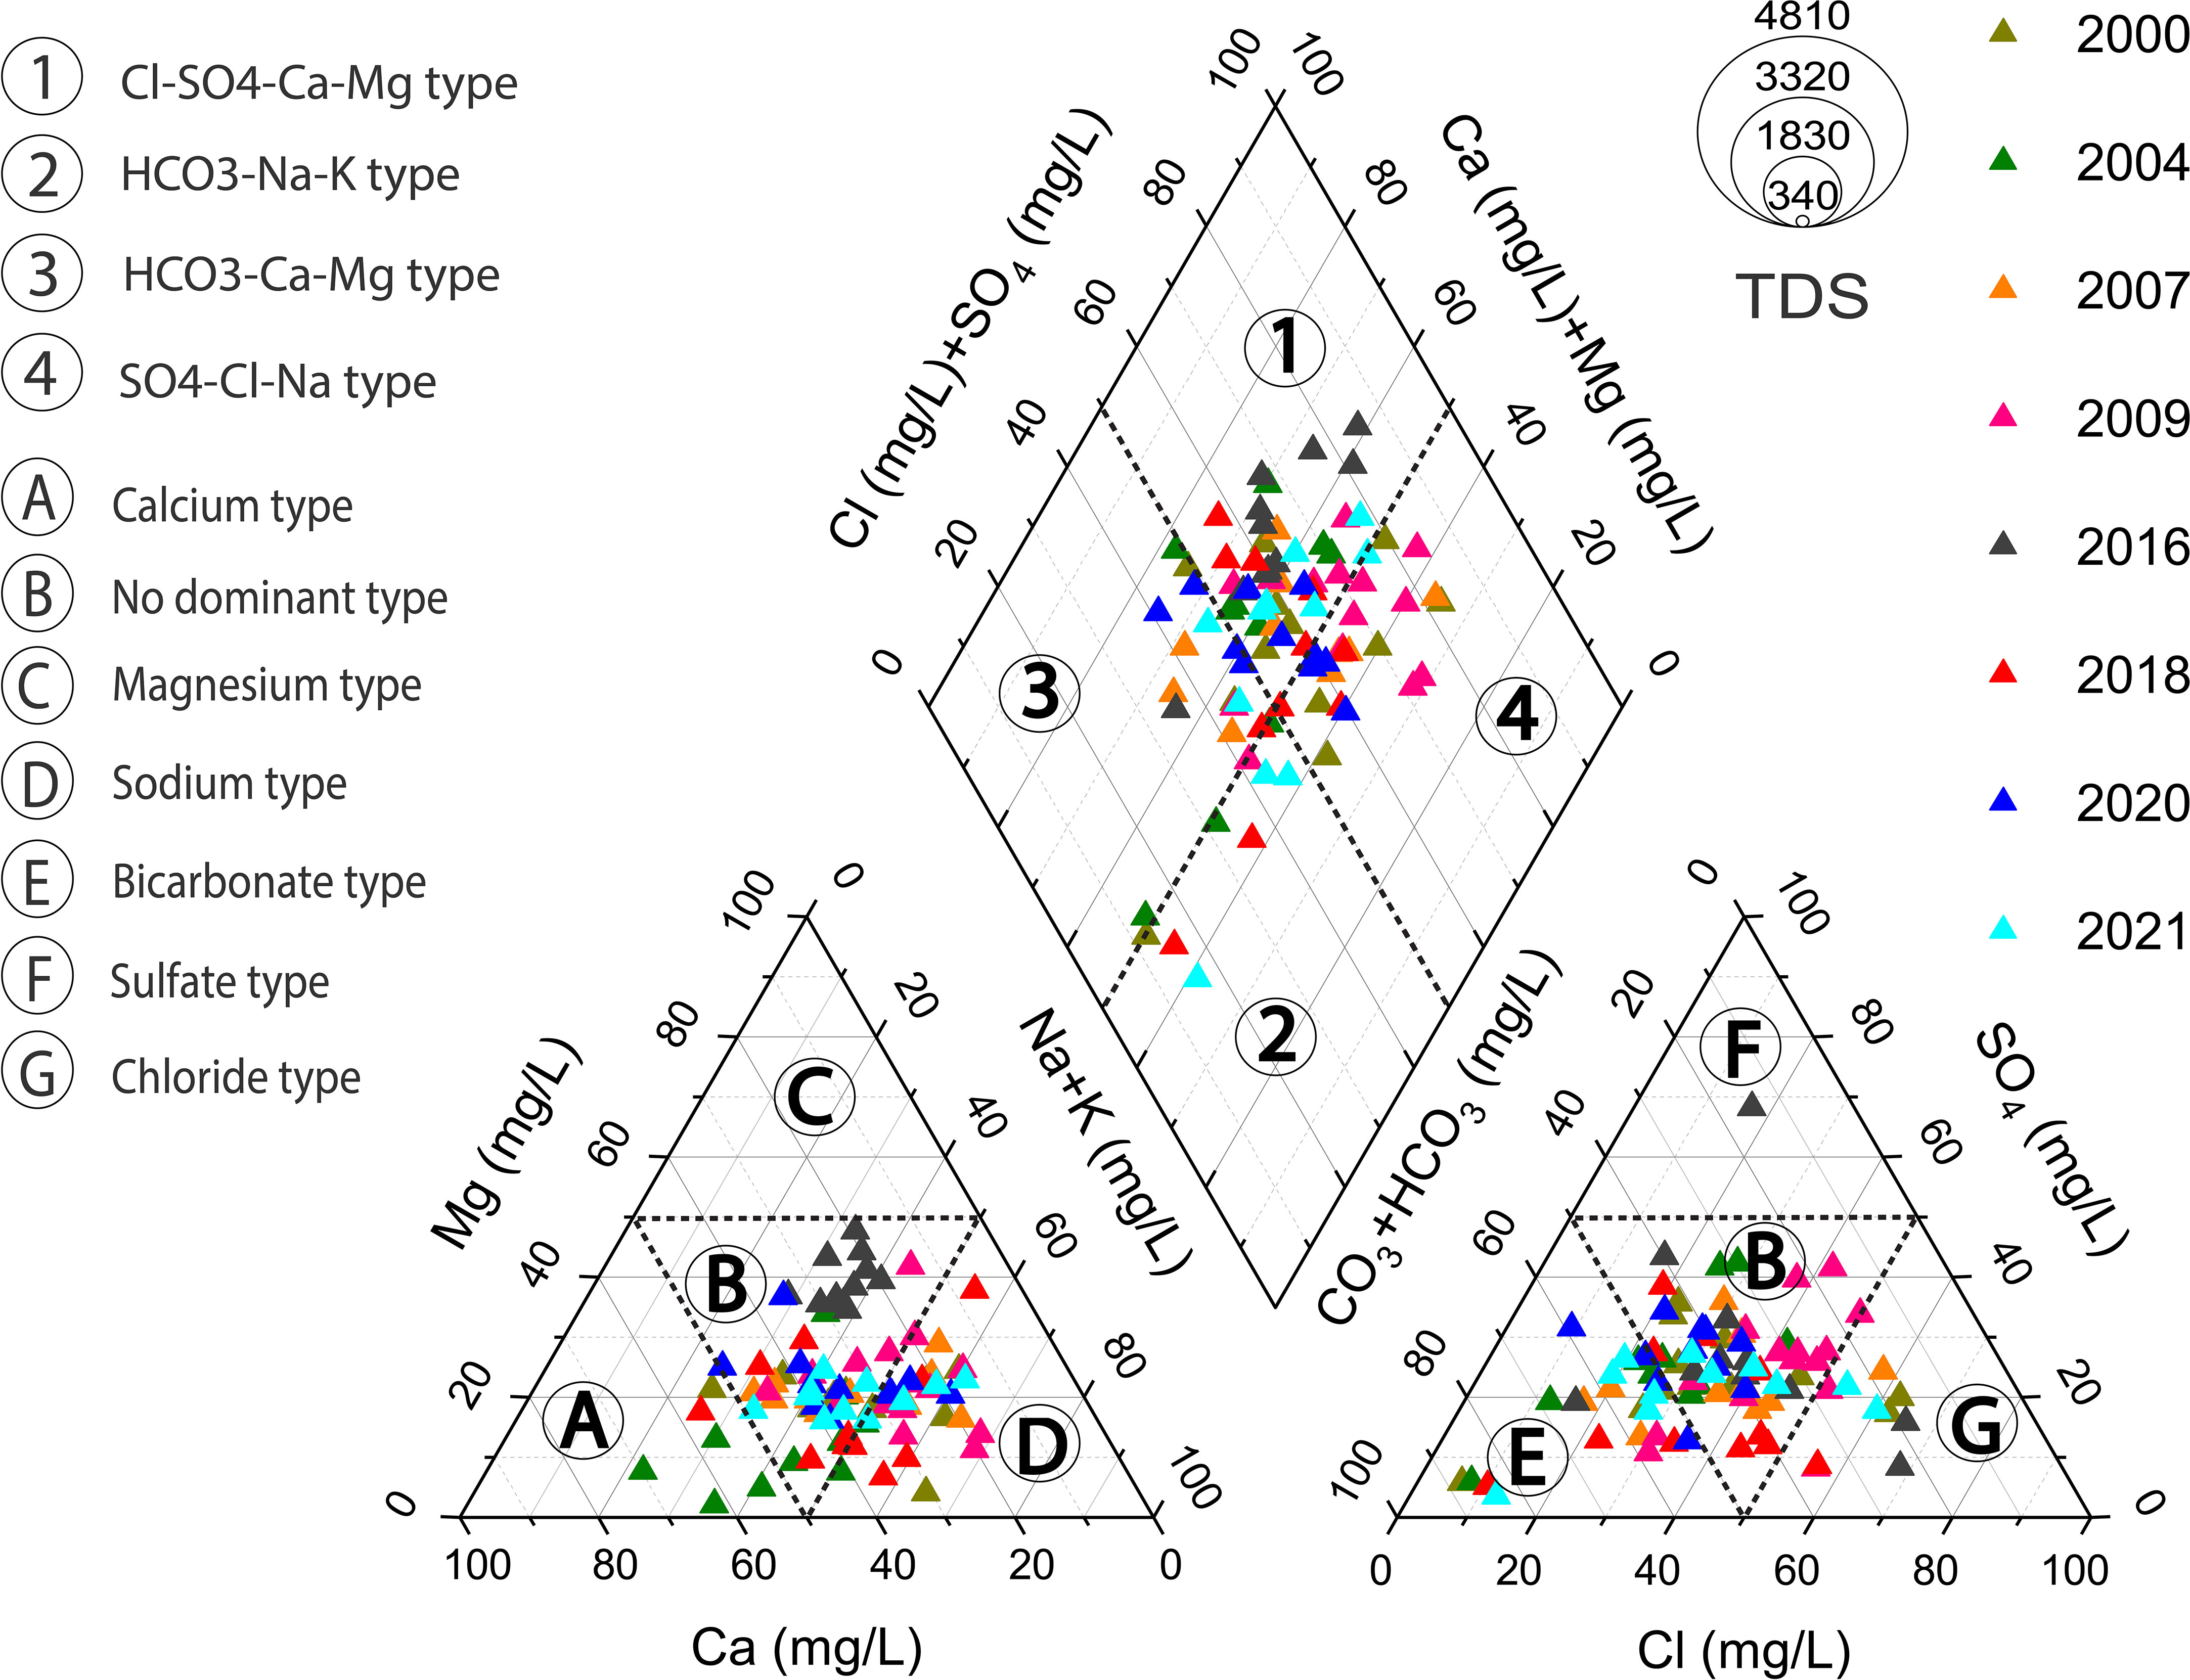
Figure 7 Piper diagram of different campaigns controlled.
Gibbs diagrams are frequently used to investigate the essential components influencing hydrochemical composition (Gibbs, 1970). The diagram shows three independent domains: zones dominated by precipitation, evaporation, and rock weathering. The Gibbs ratios can be calculated as follows:
The designed ratios versus TDS were used to construct the Gibbs diagrams. The water samples are placed in the upper right zone with high values of TDS and ratio I, indicating that the chemical compositions were influenced by evaporation. Samples with high TDS but low ratio II values, on the other hand, fall in the middle zone, indicating that the rock weathering process is dominant. Based on the findings reported in Figure 8, the majority of the groundwater samples are located in a zone dominated by the evaporation process principally and rock weathering to a minor extent.
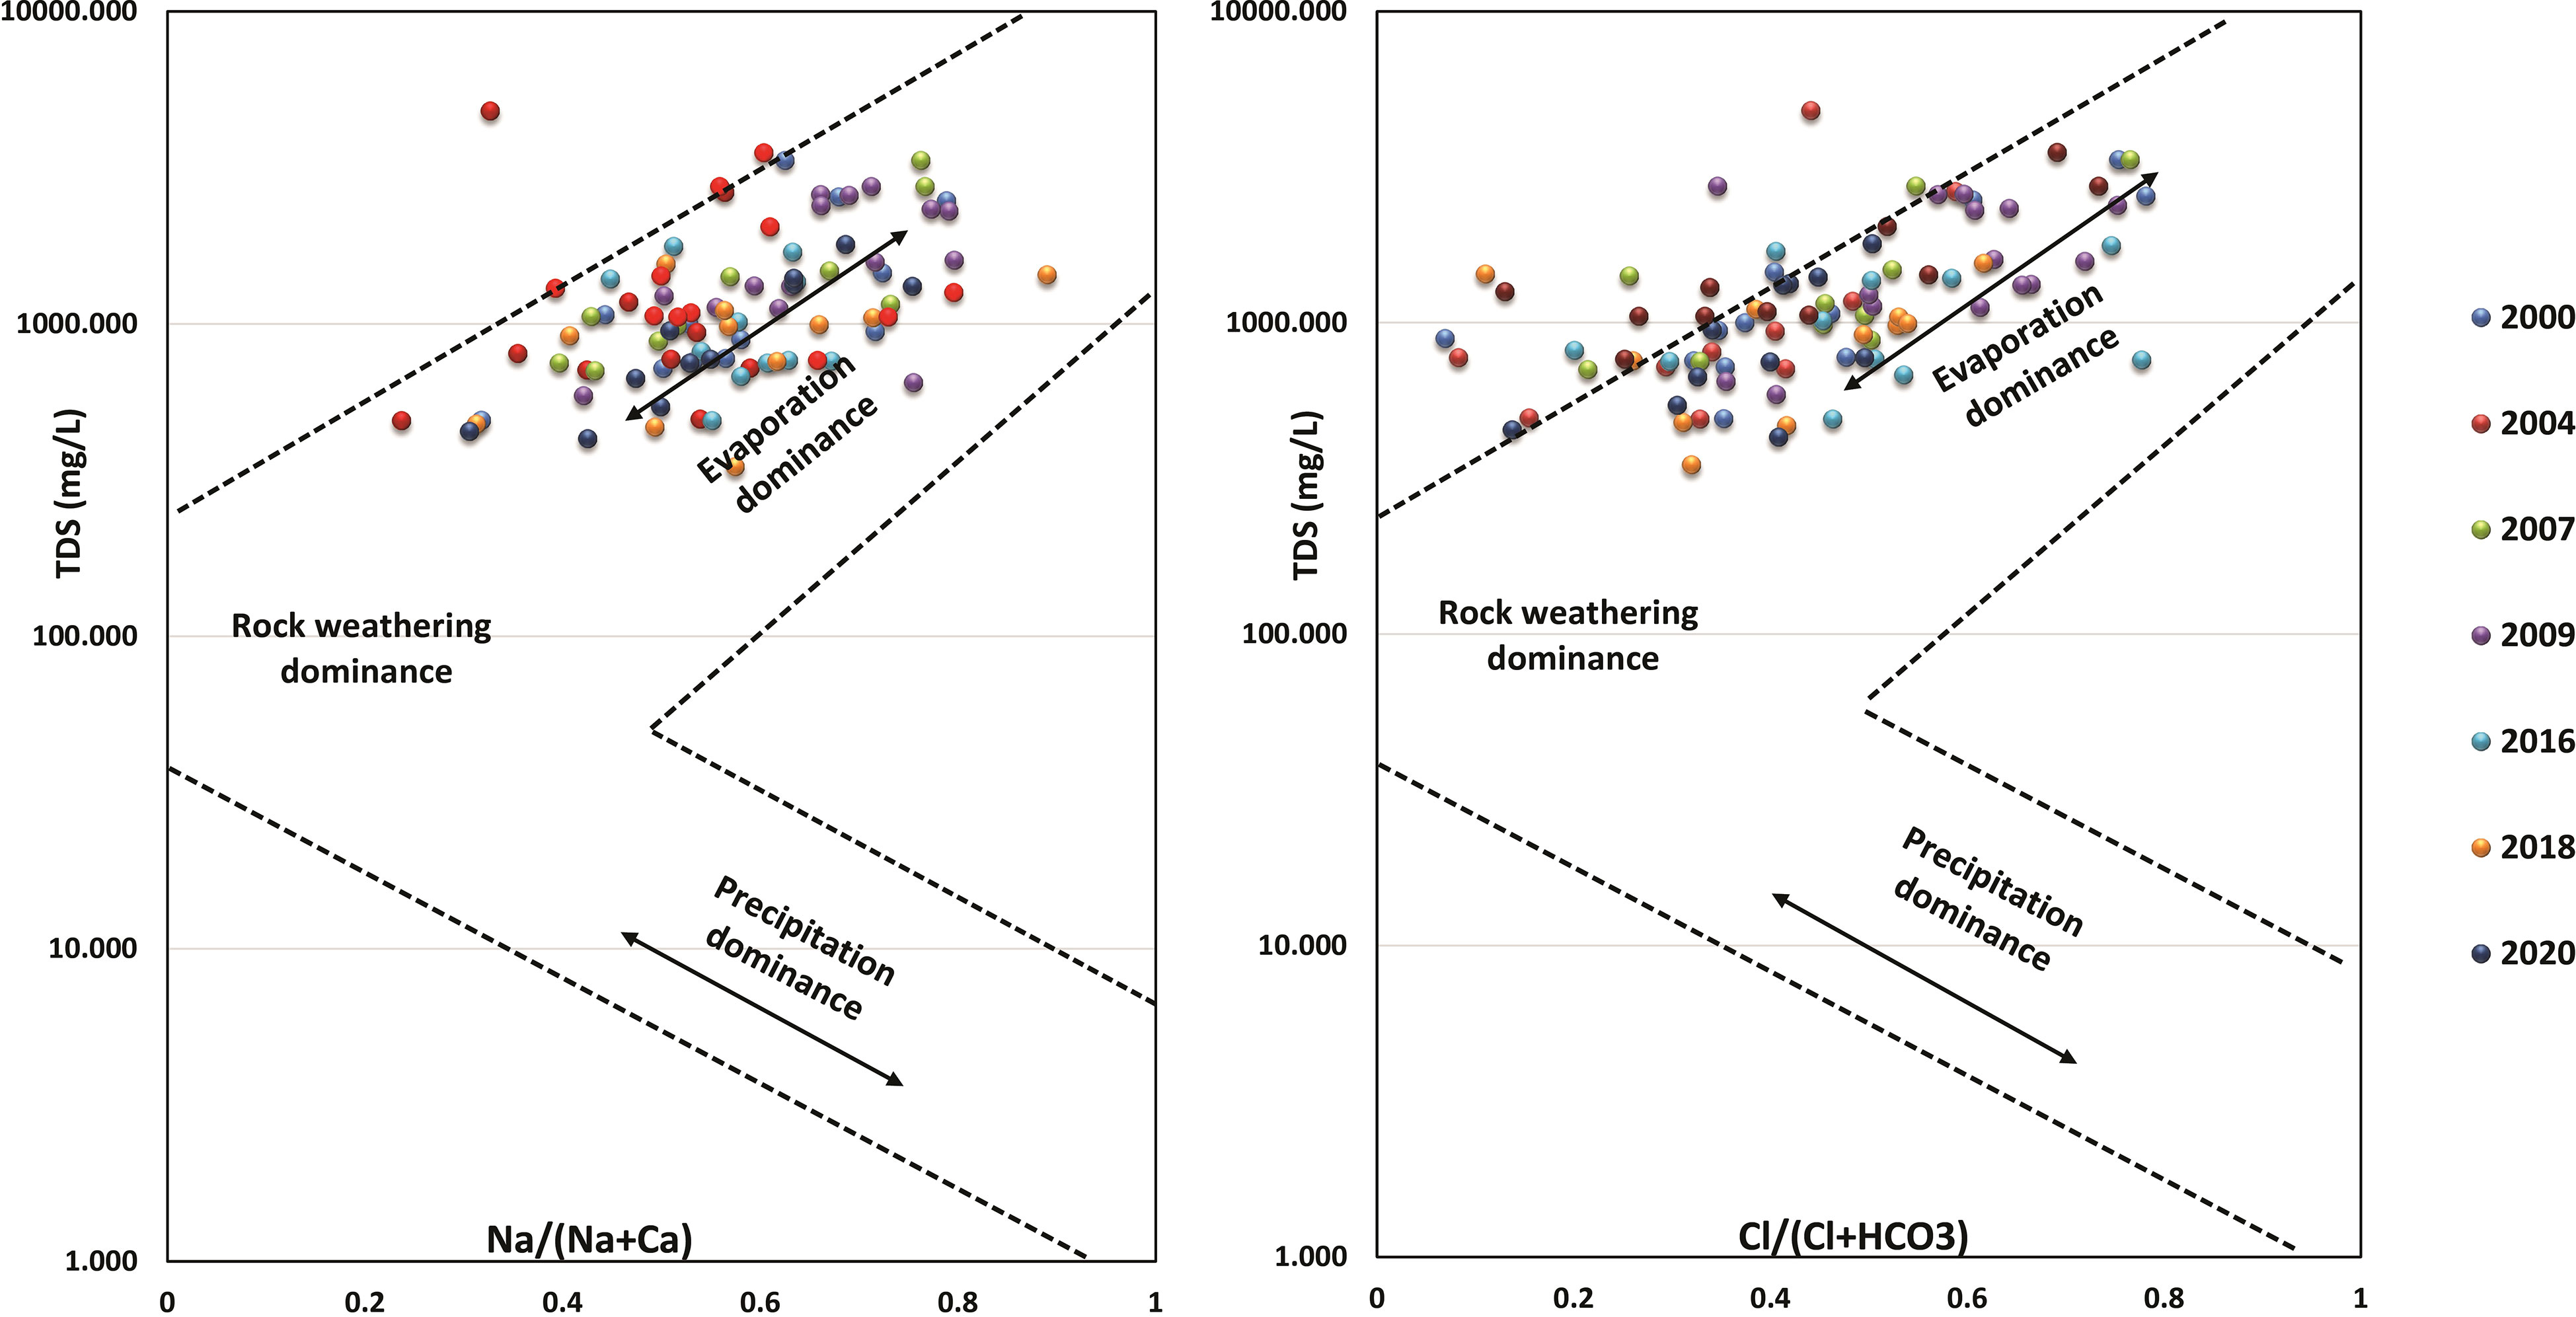
Figure 8 Gibbs diagram shows the dominant process of groundwater quality in the study area.
The statistics indicate that some physicochemical parameters in some locations do not satisfy the WHO and Moroccan requirements for safe drinking water. However, it has been revealed that the concentration of the parameters in certain samples is within the suggested limits.
The temperature shows a moderate variation from one place to another with a minimum of 16.2°C and a maximum of 26°C in the year 2021. For the other years, the minimum varies from 12°C to 22°C while the maximum is always around 25°C (Figure 9A). The observed temperatures may be comparable to the surface temperature, which is explained by the time of sampling, which was performed during the first hours of the day when temperatures were relatively low in comparison to the climate of the region, where the maximum temperature can reach 38°C. However, the observed temperature did not exceed the recommended 25°C for drinkable water.
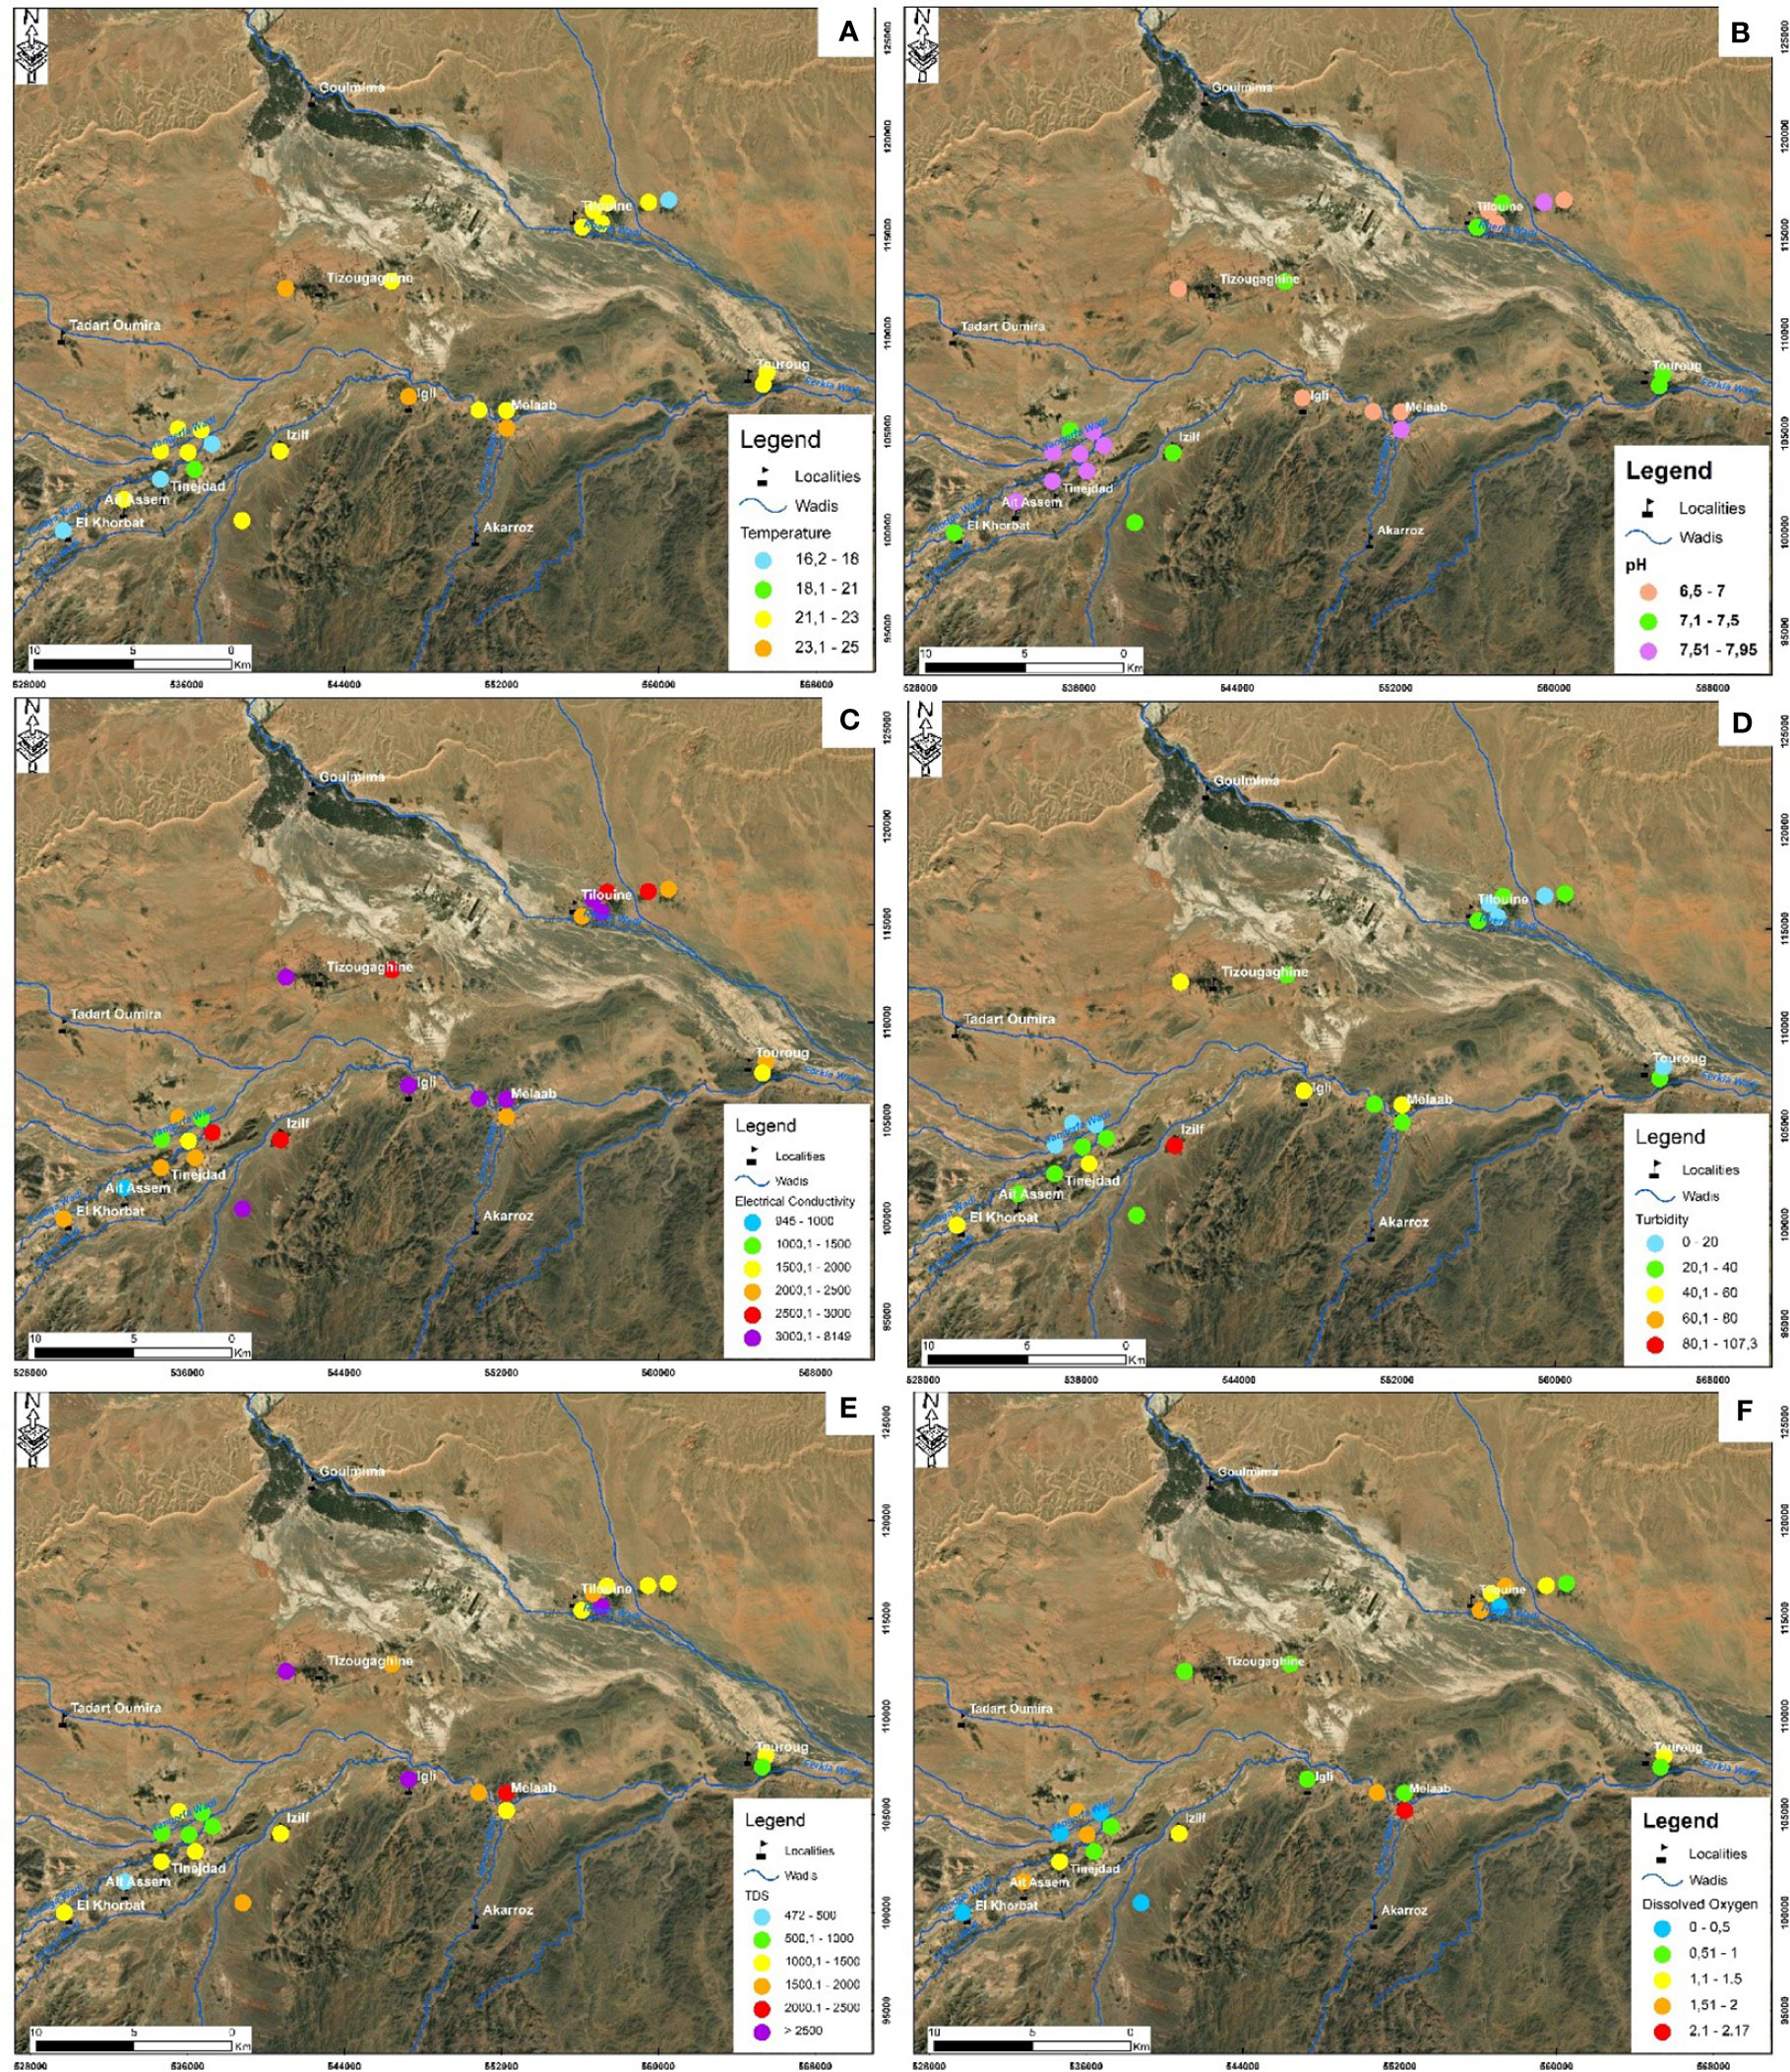
Figure 9 Spatial variation map of groundwater quality parameters, (A) Temperature, (B) pH, (C) Electrical Conductivity, (D) Turbidity, (E) Total Dissolved Solids, and (F) Dissolved Oxygen measured on site.
The pH ranges from neutral to slightly alkaline, with values ranging from 6.5 to 7.9 (Figure 9B), this interval is relatively constant throughout all years studied. The basic pH is located in the upstream part, while the acidic pH is located in the center of the study zone, and the pH in the downstream part is neutral. There was a minor difference in pH between each sample, which might be explained by the nature of the surrounding rocks crossed. The WHO pH recommendation for drinkable water is between 6.5 and 8, while the Moroccan Standard is between 6.5 and 9. The pH values of all samples are generally within the recommended range.
Electrical Conductivity (EC) defines the levels of soluble salts in the water (Dandge and Patil, 2021; Mahammad et al., 2022). The EC varies significantly across the places examined in the study area (Figure 9C), with a mean of 2957.84 µS/cm (campaign of 2021). The maximum EC value of around 9605 µS/cm (campaign of 2004) was discovered in the Tizougaghine sample, and the lowest value of 699 µS/cm (campaign of 2018) was discovered in the Gardmit sample (Figure 10). In contrast to the other years, the saline charge is decreasing in the campaign samples from 2009, 2016, and 2018. The values range from 699 to 980 µS/cm as minimum and 3111 to 3590 µS/cm as maximum, with the average being 1833 µS/cm. The EC measurements taken at various locations are generally within a range that exceeds the guidelines described in Table 2.
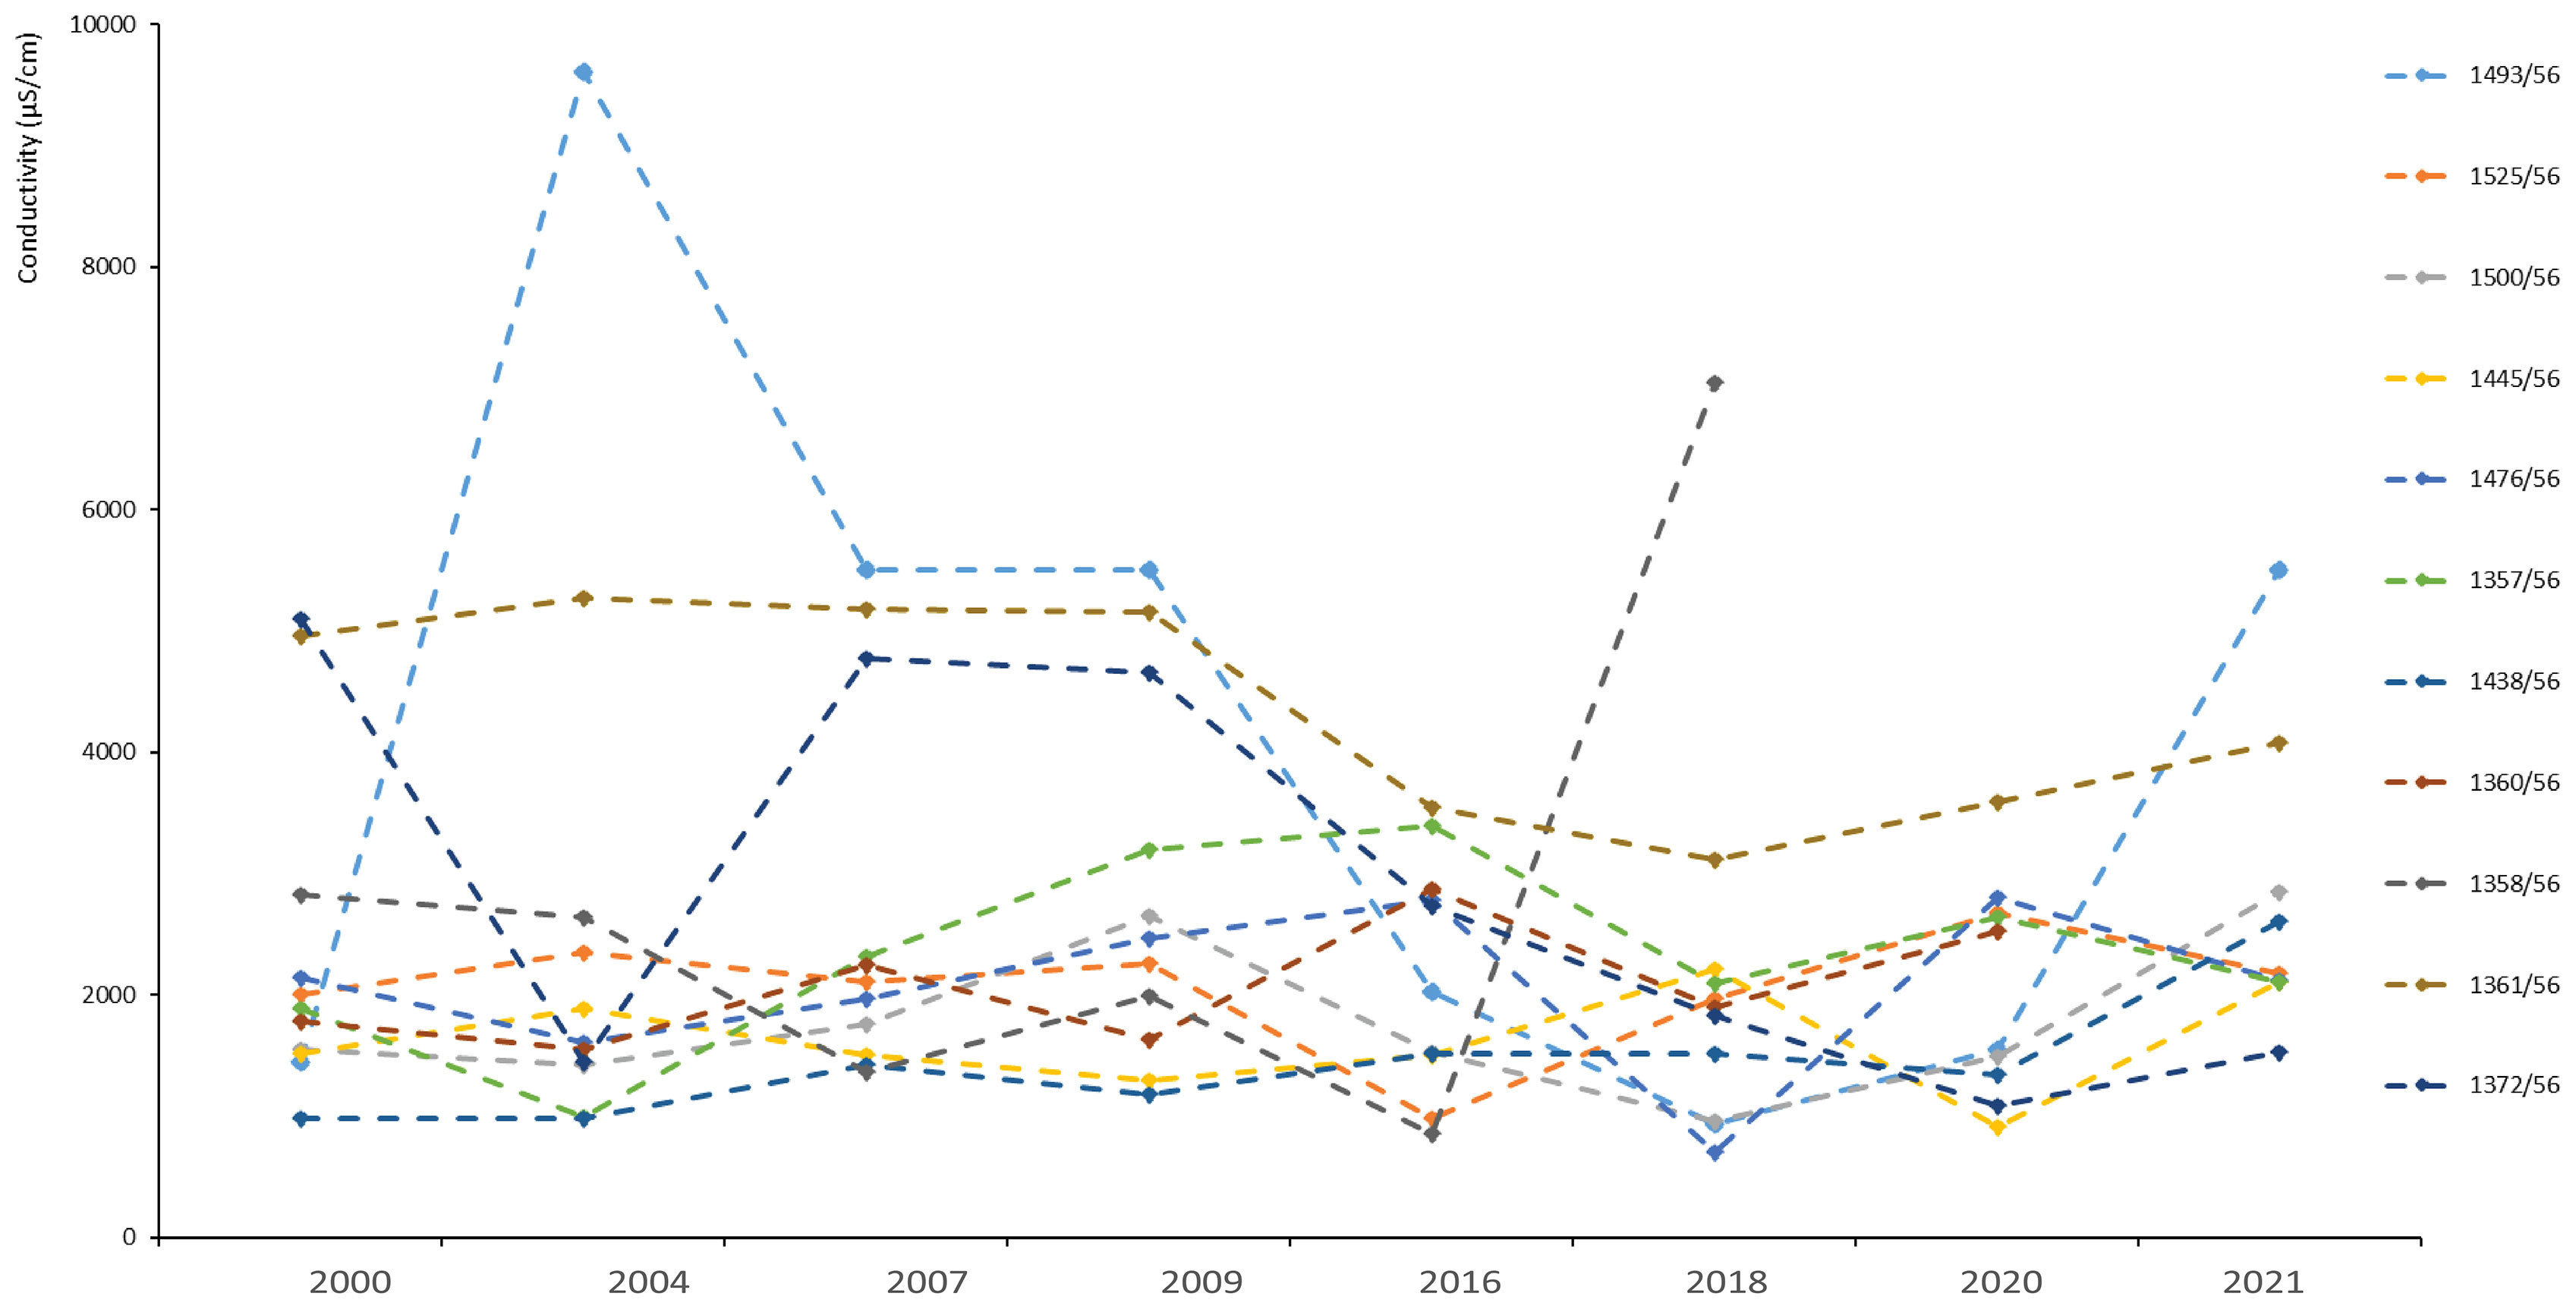
Figure 10 Temporal variation of electrical conductivity at monitored water sites.
Turbidity is a measure of the clarity or cloudiness of water (Çako et al., 2013). Turbidity can be caused by the movement of specific materials such as sediments, mineral precipitations, and biomass, and its presence can be permanent or seasonal (Nduka et al., 2008). The permissible level for drinking purposes is 5 FNU. The observed turbidity values range from 17.7 to 107.3 FNU with an overall average of 36.94 FNU (Figure 9D). According to Moroccan and WHO standards, all samples have turbidity levels that exceed the maximum tolerable portability limits.
The range of TDS in Tinejdad-Touroug groundwater is 472 to 4416 mg/L, the average is about 1599.6 mg/L. The distribution of high values is closely related to EC, turbidity, and pH values. The highest value is always recorded in Tizougaghine and Igli samples (central part and groundwater’s borders). However, the samples from the margins had low concentrations. The values observed in the TDS spatial distribution map (Figure 9E) clearly show that 82% of samples of the study area contain concentrations overhead of the drinking water guidelines indicated in Table 2.
Dissolved oxygen is a measure of the concentration of available oxygen in water used by microorganisms in the biological oxidation of organic matter. The concentration of oxygen that is dissolved in water can be affected by various factors, including the origin of the water, the temperature of the water, the methods used to treat the water, and the chemical or biological reactions that take place within the distribution system, as stated by the (WHO, 2022). Its value provides information on the degree of contamination and hence the degree of auto-purification of water (Al-Asadi et al., 2020). In this study, oxygen concentrations ranged between 0.5 mg/L and 2 mg/L on average (Figure 9F).
The total hardness of groundwater is caused by the presence of calcium and magnesium ions (Das et al., 2019; Ram et al., 2021), the World Health Organization’s guideline value for TH in drinking water is about 120 mg/L. The TH readings in all locations respect the WHO’s limit. The maximum TH value is observed in Igli sample at about 200 mg/L, and average total hardness levels range from 81.81 mg/L in 2000 to 92.02 mg/L in 2021with an increase of 10.21 mg/L.
Ca concentrations are within the guidelines mentioned in Table 2, with averages ranging from 168.27 mg/L (2000 campaign) to 189.66 mg/L (2021 campaign). Some exceptions are observed for concentrations that do not meet the required standards such as in Melaab sample (385 mg/L, 489 mg/L, 309 mg/L, 206 mg/L, and 371 mg/L consecutively for 2000, 2004, 2007, 2009, and 2021 campaigns).
Mg concentrations for 2004, 2016, and 2018, and more than half of the samples in 2020 are within the allowable range for drinking water with minimum levels ranging from 8.50 to 56.5 mg/L. The campaigns 2000, 2007, 2009, and 2021 show values that exceed 70 mg/L the tolerated limit with maximums that reach 355 mg/L.
Bicarbonate levels in Tinejdad-Touroug differ considerably from 111.02 to 1485 mg/L, with an overall average of 495.06 mg/L. Calcium and magnesium are two essential minerals that can be obtained from various sources. The presence of ferromagnesium minerals in the natural surroundings, dolomite weathering and dissolution of calcite are some of the processes to acquire these essential minerals (Gautam et al., 2022; Goswami et al., 2022; Gugulothu et al., 2022). The Palaeozoic substratum of the Anti-Atlas, as well as the limestone and dolomitic rocks of the Jurassic Mountains in the High-Atlas region, are considered potential sources of calcium and magnesium minerals.
Chloride, a common element, is found in groundwater from various sources, including surrounding rocks, salt is transported through rainwater, seawater intrusion, and pollution caused by domestic sewage and industrial waste (Goswami et al., 2022; Alshehri and Abdelrahman, 2023; Elkhalki et al., 2023). Water that contains a significant amount of chloride tends to emanate an unpleasant odor (Honig et al., 2020). Furthermore, such water also demonstrates heightened levels of electrical conductivity (Solangi et al., 2020). Cl ranges between 79.4 and 1761 mg/L for the 2000 campaign, 76.6 and 1111 mg/L for the 2004 campaign, 123 and 1868 mg/L for the 2007 campaign, 198 and 1163 mg/L for the 2009 campaign, 127.8 and 901.7 mg/L for the 2016 campaign, 89.41 and 721.4 mg/L for the 2018 campaign, 46.15 and 621.3 mg/L for the 2020 campaign and 145.6 and 1527 mg/L for the 2021 campaign (Supplementary Material: Figure 1). The recommended chloride concentration in drinking water is 250 mg/L. Except for specific cases, this water surpasses the 250 mg/L limits for domestic purposes. In our study area, the levels of chloride are commonly associated with a range of geological rocks.
Sulfate refers to a type of salt, a sulfate excess will often add salt to the water and degrade its taste. The high content of sulfate in groundwater might cause dehydration, catharsis, and gastrointestinal problems (Nduka et al., 2008; Qureshi et al., 2021). The WHO recommended value for sulfate is 250 mg/L, although according to Moroccan standards, concentrations as high as 400 mg/L are permitted. Sulfate concentrations are greatest in Igli samples, 1893 mg/L for the 2004 campaign, 1187 mg/L for the 2007 campaign, and 656 mg/L for the 2009 campaign. However, the content of sulfate in water is usually lower than the threshold amount.
Nitrate, which has a considerable impact on agricultural and drinking water usage, has been recognized as the primary groundwater contaminant (Panneerselvam et al., 2023a). The WHO recommends a nitrate concentration of 50 mg/L. The upstream segment of the examined region exhibited considerable levels of nitrates. Furthermore, the levels of nitrates found in the Igli and Tizougaghine samples were higher than in the other specimens. However, the average nitrate content ranges between 27.38 for the 2000 campaign and 31.22 mg/L for the 2021 campaign. The Sat sample found the lowest nitrate content at 0.30 mg/L.
The sodium content is high, ranging from 95 to 670 mg/L. The maximum value was recorded in the central part, the average ranges from 284.04 mg/L in 2000 to 268.64 mg/L in 2021 with a decrease of 15.4 mg/L. Although potassium showed very low values which are within the permissible range for drinking water. Ammonia is a high-level indicator of organic-substance contamination (Wiatkowski and Paul, 2009). The WHO has mandated a limit of 0.5 mg/L for potable water provisioning. All samples in different years controlled are within acceptable limits for potable water purposes.
Microbial indicators may be quantified to determine the amount of organic contamination in groundwater (Szekeres et al., 2018; Hubbard et al., 2020; Khadra et al., 2022; Stupar et al., 2022; Li et al., 2023). The results of bacteriological parameters in the samples obtained throughout five sampling campaigns are moderate. Faecal Coliform ranges between 0 and 400/100ml, 0 and 160/100ml, 0 and 800/100ml, 1 and 248/100ml, and 7 and 44/100ml during 2000, 2004, 2007, 2016, and 2020 campaigns, consecutively. Samples taken during the 2000 campaign ranged between 0 and 800/100ml for Total Coliform and between 0 and 330/100ml for Faecal Spectroscopy.
The studies for the 2004 campaign showed a decrease compared to the previous campaign, with an average of 34.36 instead of 255 for the Faecal Coliform and 15 instead of 43 for the Faecal Spectroscopy. However, analyses for the 2007 campaign indicate an increase, with an average of 340 for Faecal Coliform and 325 for Faecal Spectroscopy. Total Coliform readings for the 2016 campaign ranged from 5 to 298/100ml, with an average of 99/100ml, and for the 2020 campaign ranged from 18 to 102/100ml, with an average of 41/100ml. Faecal Spectroscopy rates range from 1 to 34/100ml, with an average of 6/100ml in the 2016 campaign, and 2 to 22/100ml in the 2020 campaign, with an average of 14/100ml.
The majority of samples indicate null values for the examination of bacteriological parameters for the campaigns 2009, 2018, and 2021, except for a few sampling sites where the values are positive but always remain below the prescribed limits for drinking water.
Horton et al., 1965 and Brown et al., 1970 proposed a water quality index to facilitate water assessment and interpretation. The index is calculated by assigning a weight to each parameter based on its relative contribution to the intended or optimal values. Individual values are then weighted depending on their importance (Supplementary Material: Table 5), and the weighted values are used to generate the overall water quality index. The calculated WQI values are classified into five categories, as indicated in Supplementary Material: Table 6, which vary from “excellent water” to “water unsuitable” for consumption. In general, a higher index implies potentially higher levels of pollution or contamination, however, a lower index suggests improved water quality. Several studies related to the assessment of groundwater quality within the adoption of the WQI have been carried out in Morocco (Bahir et al., 2020; El Mountassir et al., 2020; Jamaa et al., 2020; Bahir et al., 2021a; Bahir et al., 2021b; Sarti et al., 2021; Bahir et al., 2022; Ouhamdouch et al., 2022; Rafik et al., 2022; Benaissa et al., 2023; Boudellah et al., 2023; El Moustaine et al., 2023; El Yousfi et al., 2023).
In the current study, 54.5% of samples from the 2021 campaign had poor quality (class III), with WQI values ranging from 100 to 200, and 27.3% have very poor quality (class IV), with values varying between 207 and 250. Class II and Class V both have one sample, making up 9.1% of the total number of samples (Figure 11A). In the 2020 campaign, 54.5% of samples are categorized as class II, while 45.5% are classified as class III (Figure 11B). For the 2018 campaign, 9.1% of water points are in class I, 36.4% in class II, 45.4% in class III, and one sample in class IV, accounting for 9.1% of total samples (Figure 11C).
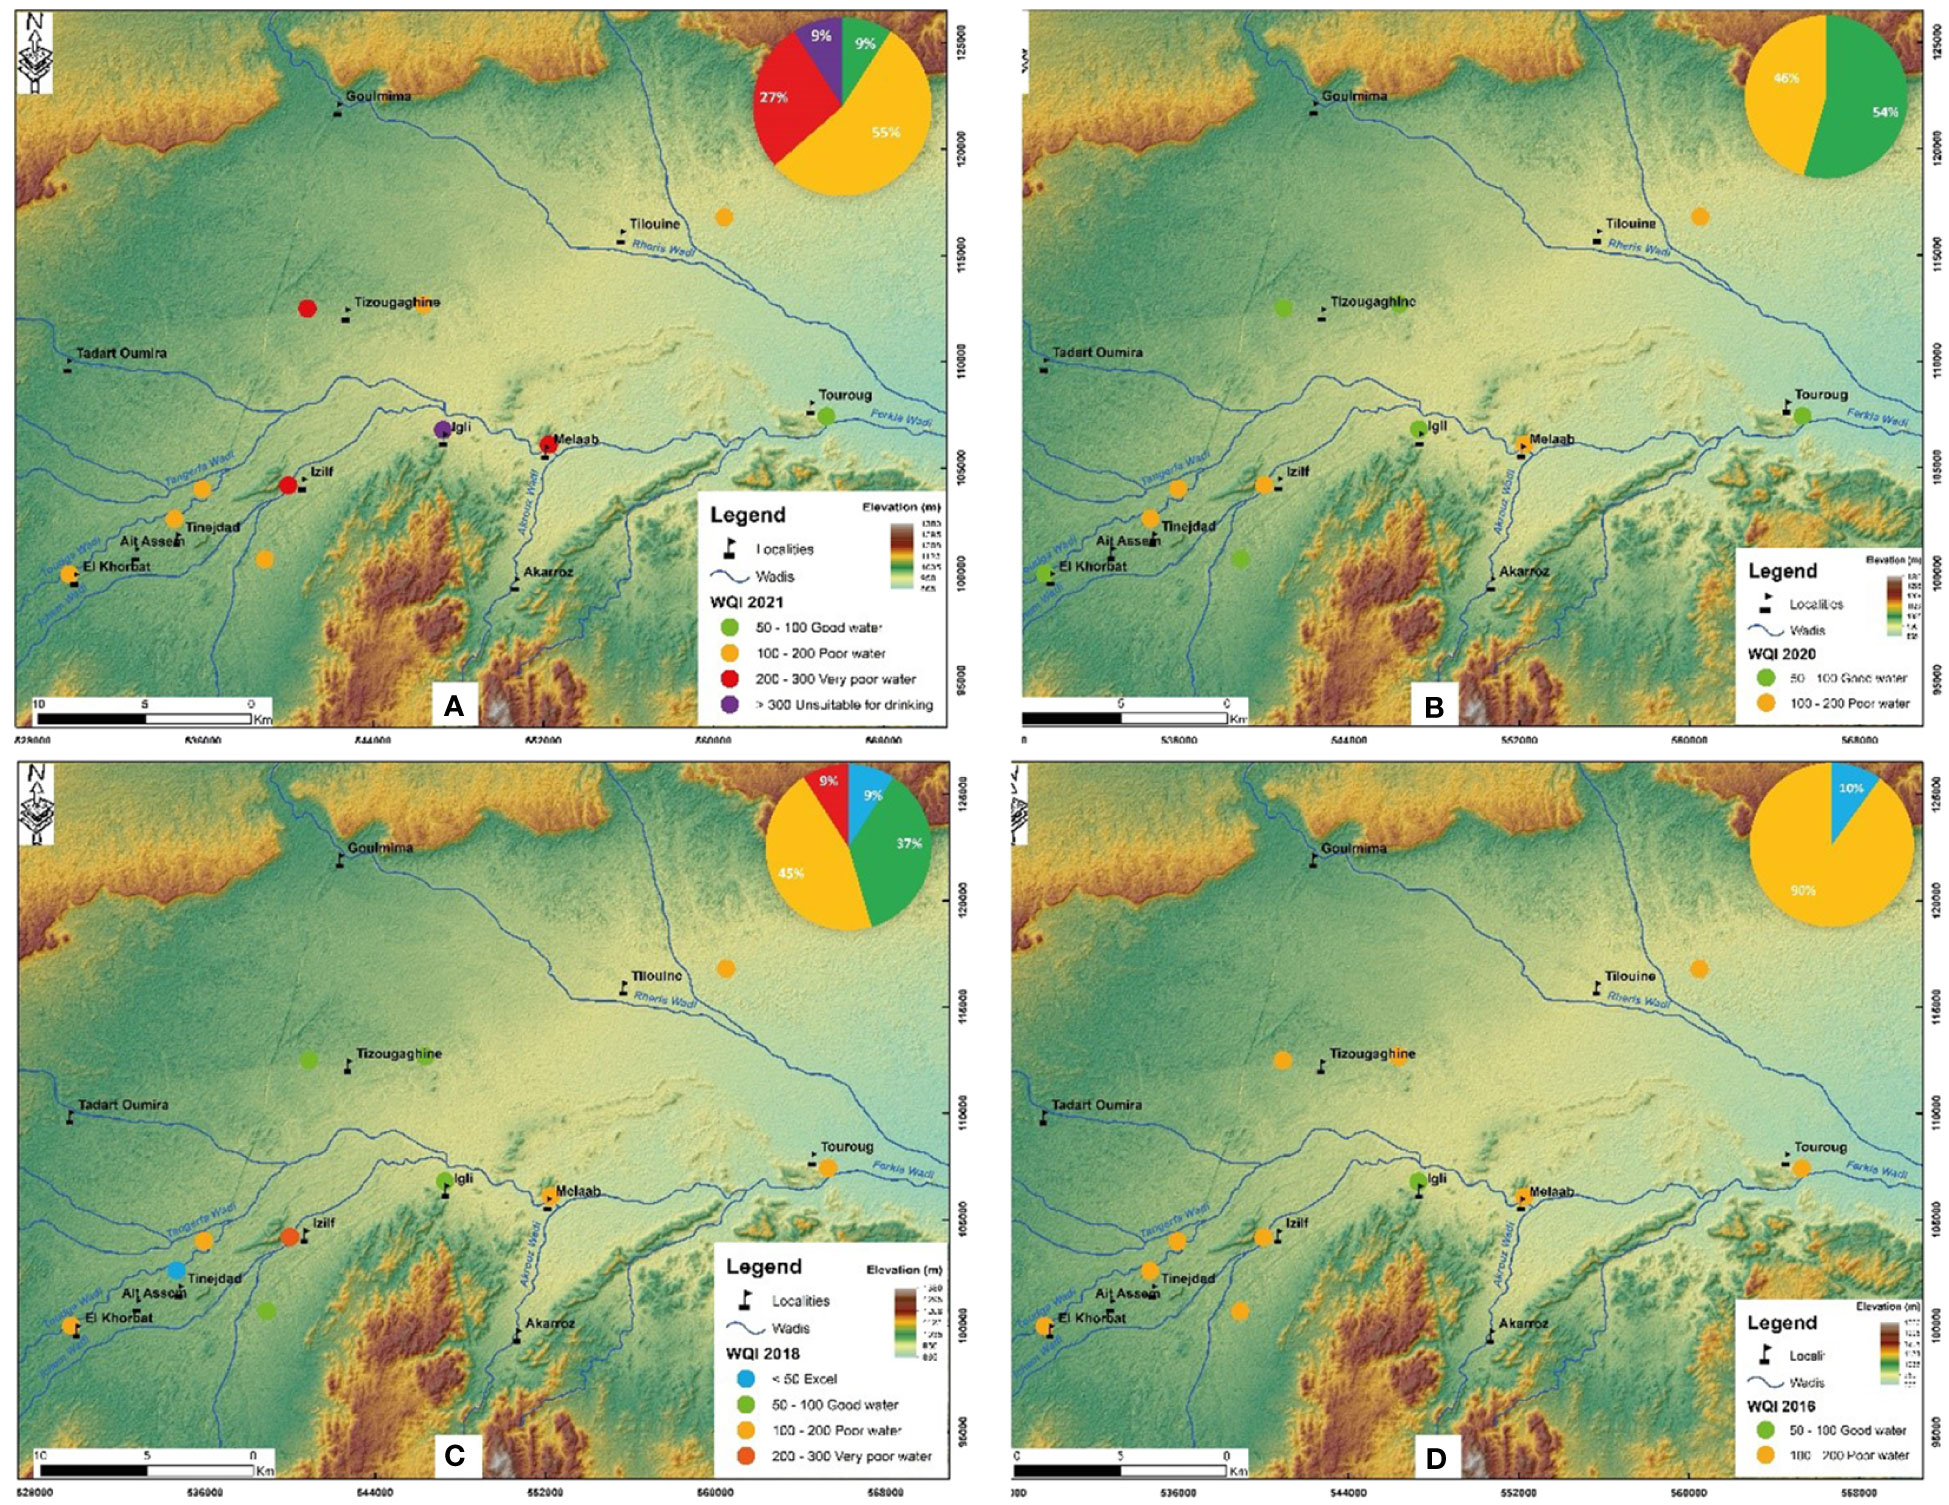
Figure 11 Spatial distribution of WQI within the Quaternary aquifer of Tinejdad-Touroug: 2021 (A), 2020 (B), 2018 (C), 2016 (D).
For 2016 samples, 10% are regarded as class I, while 90% are classified as class III (Figure 11D). 7.7% of samples in the 2009 campaign were classified as class II, 69.2% as class III, 15.4% as class IV, and 7.7% as class V (Figure 12A). For the 2007 campaign, 50% of water sites occurred in class III, 25% remained in class V, and 16.7% and 8.3% were in class IV and II, respectively (Figure 12B). Class III accounted for 40% of all samples collected during the 2004 campaign, whereas classes II and IV accounted for 40% and 20%, respectively (Figure 12C). Regarding the case of the samples from the 2000 campaign, 58% qualify as class III, 25.4% as class II, and 8.3% as class IV and V (Figure 12D).
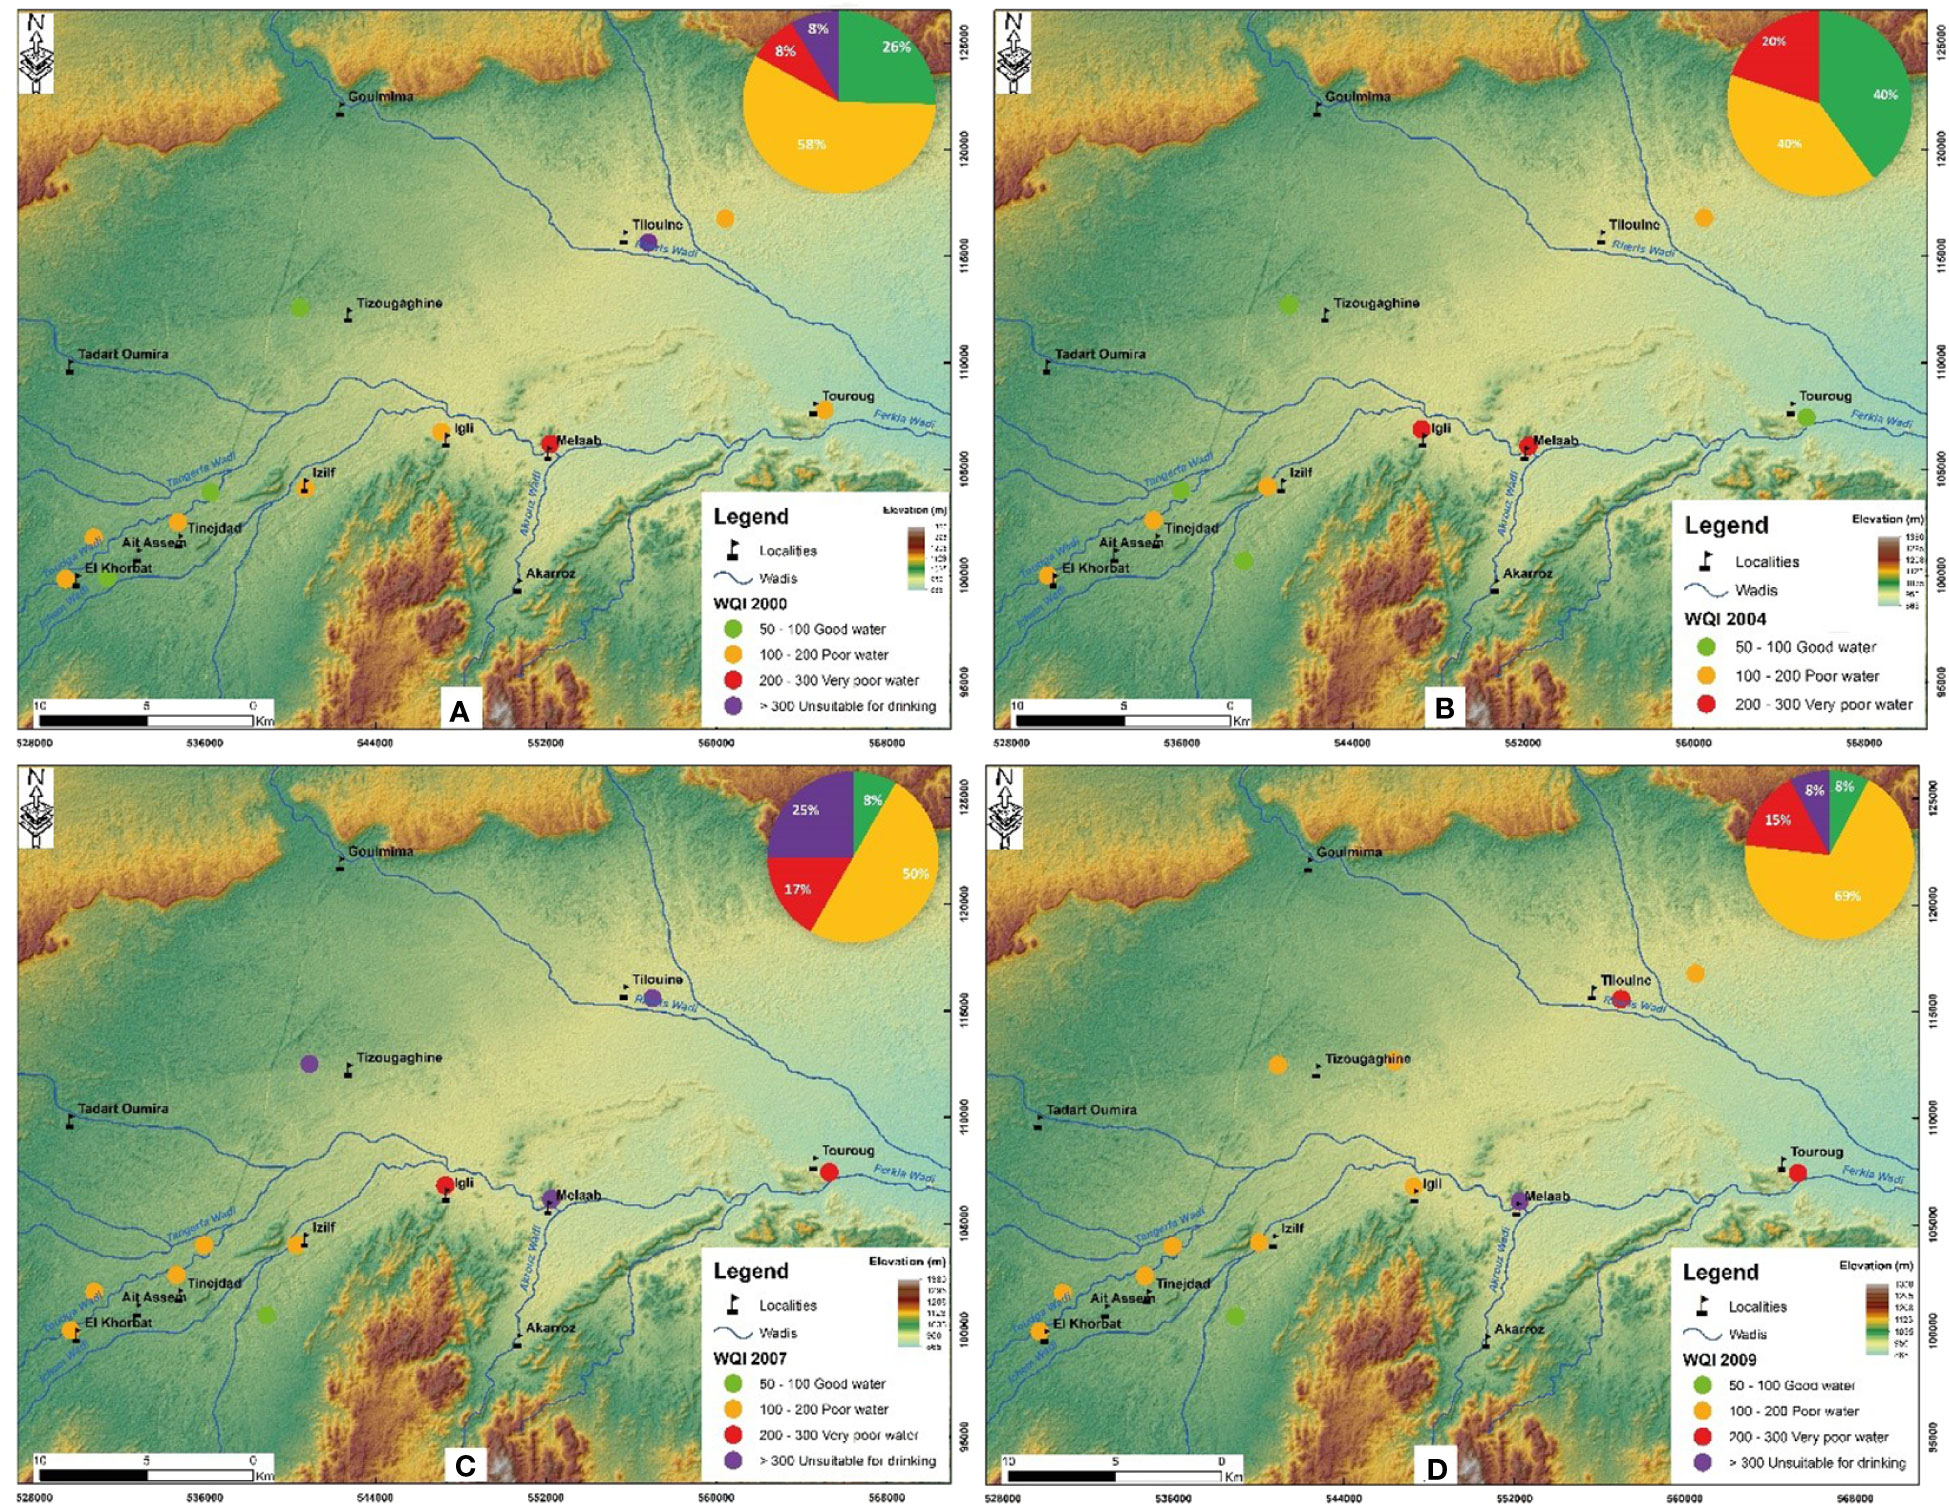
Figure 12 Spatial distribution of WQI within the Quaternary aquifer of Tinejdad-Touroug: 2009 (A), 2007 (B), 2004 (C), 2000 (D).
The local difference of the WQI metric shows that groundwater quality varies periodically as illustrated in Figures 11, 12, and the variability of the matrix properties of the bedrock in the region examined might explain this discrepancy. The Tizougaghine, Izilf and Igli locations present a very poor quality. This weakness could also be explained by the decreasing thickness of the aquifer towards the boundaries, where the water table is easily attenuated by surface water, and by the region’s rainfall deficit caused by climate change. In fact, the decreasing trend in the piezometric level is followed by an increasing tendency in the EC levels, giving rise to a deterioration of the quality of the groundwater. Nonetheless, groundwater quality in the study region is negatively impacted periodically due to the combined effects of climate change and human activities.
Minerals found in significant amounts in water have negative effects on the soil and plants. As a result, the parameters that define irrigation water must be studied. The evaluation of groundwater waters for agricultural use is being studied using several indicators (Table 3). The results were evaluated using recommended quality standards and classifications determined by the authors who established the index for the first time.
The sodium risk increases the sodium adsorption ratio. Careful regulation and monitoring of sodium concentrations in irrigation water is imperative as the amount of residual sodium left in the soil after absorption has the potential to decrease soil permeability and deteriorate its structure, highlighting the significance of the SAR value (Kaur et al., 2017; Roy et al., 2018). According to the classification of Richard, 1954 (Table 4), the majority of the analyzed samples in the eight sampling campaigns have good to permissible quality regarding irrigation uses (Figures 13A, B). With exception of four samples located in the center part and boundary of the study area, Tizougaghine, Izilf, Melaab, and Igli, which fall in the unsuitable class based on SAR classification.
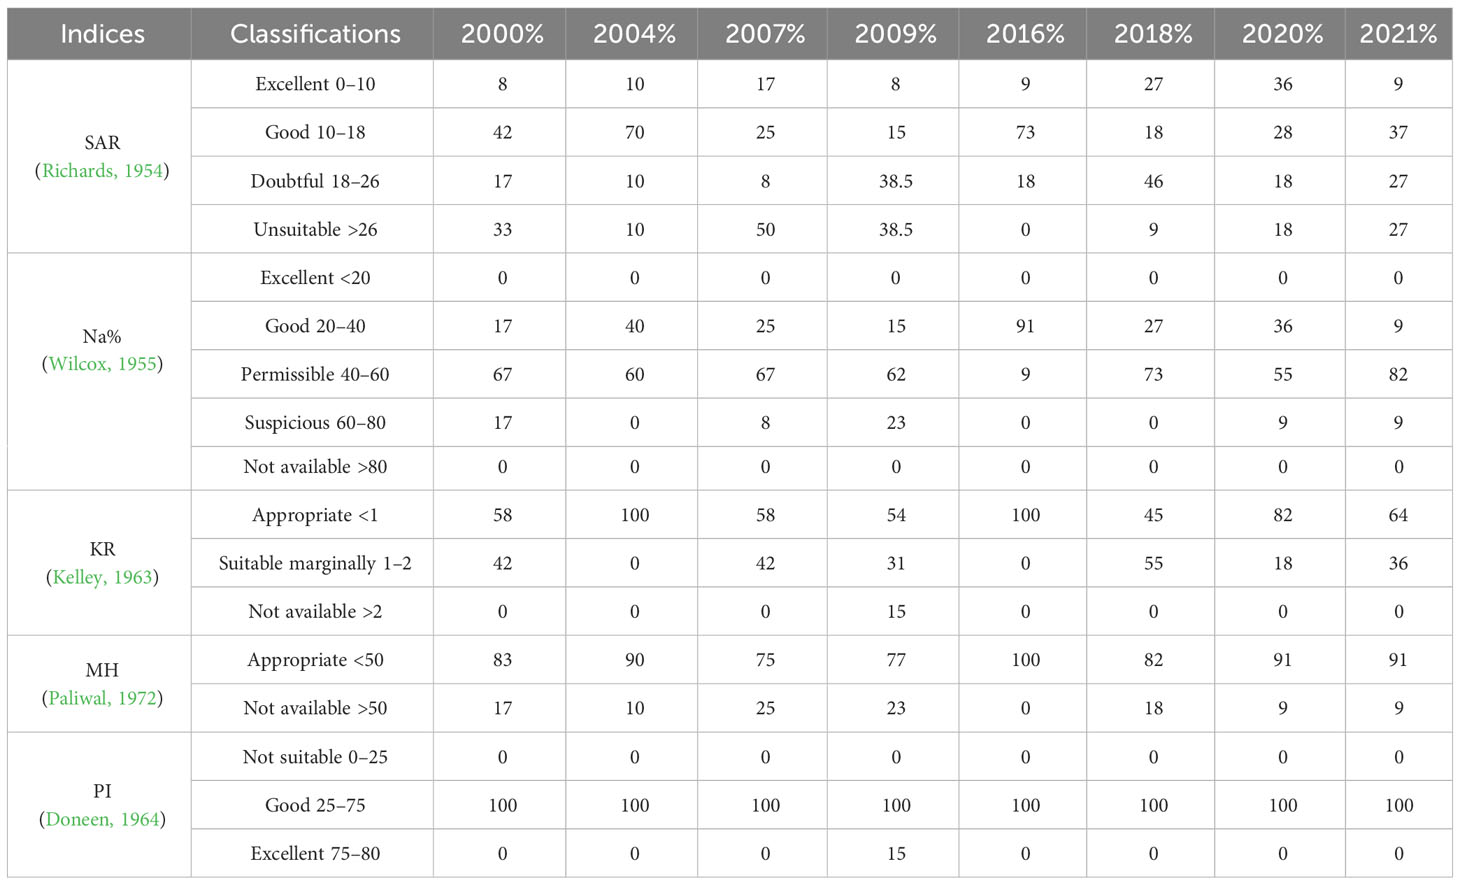
Table 4 Assessment quality using irrigation indices for different campaigns.
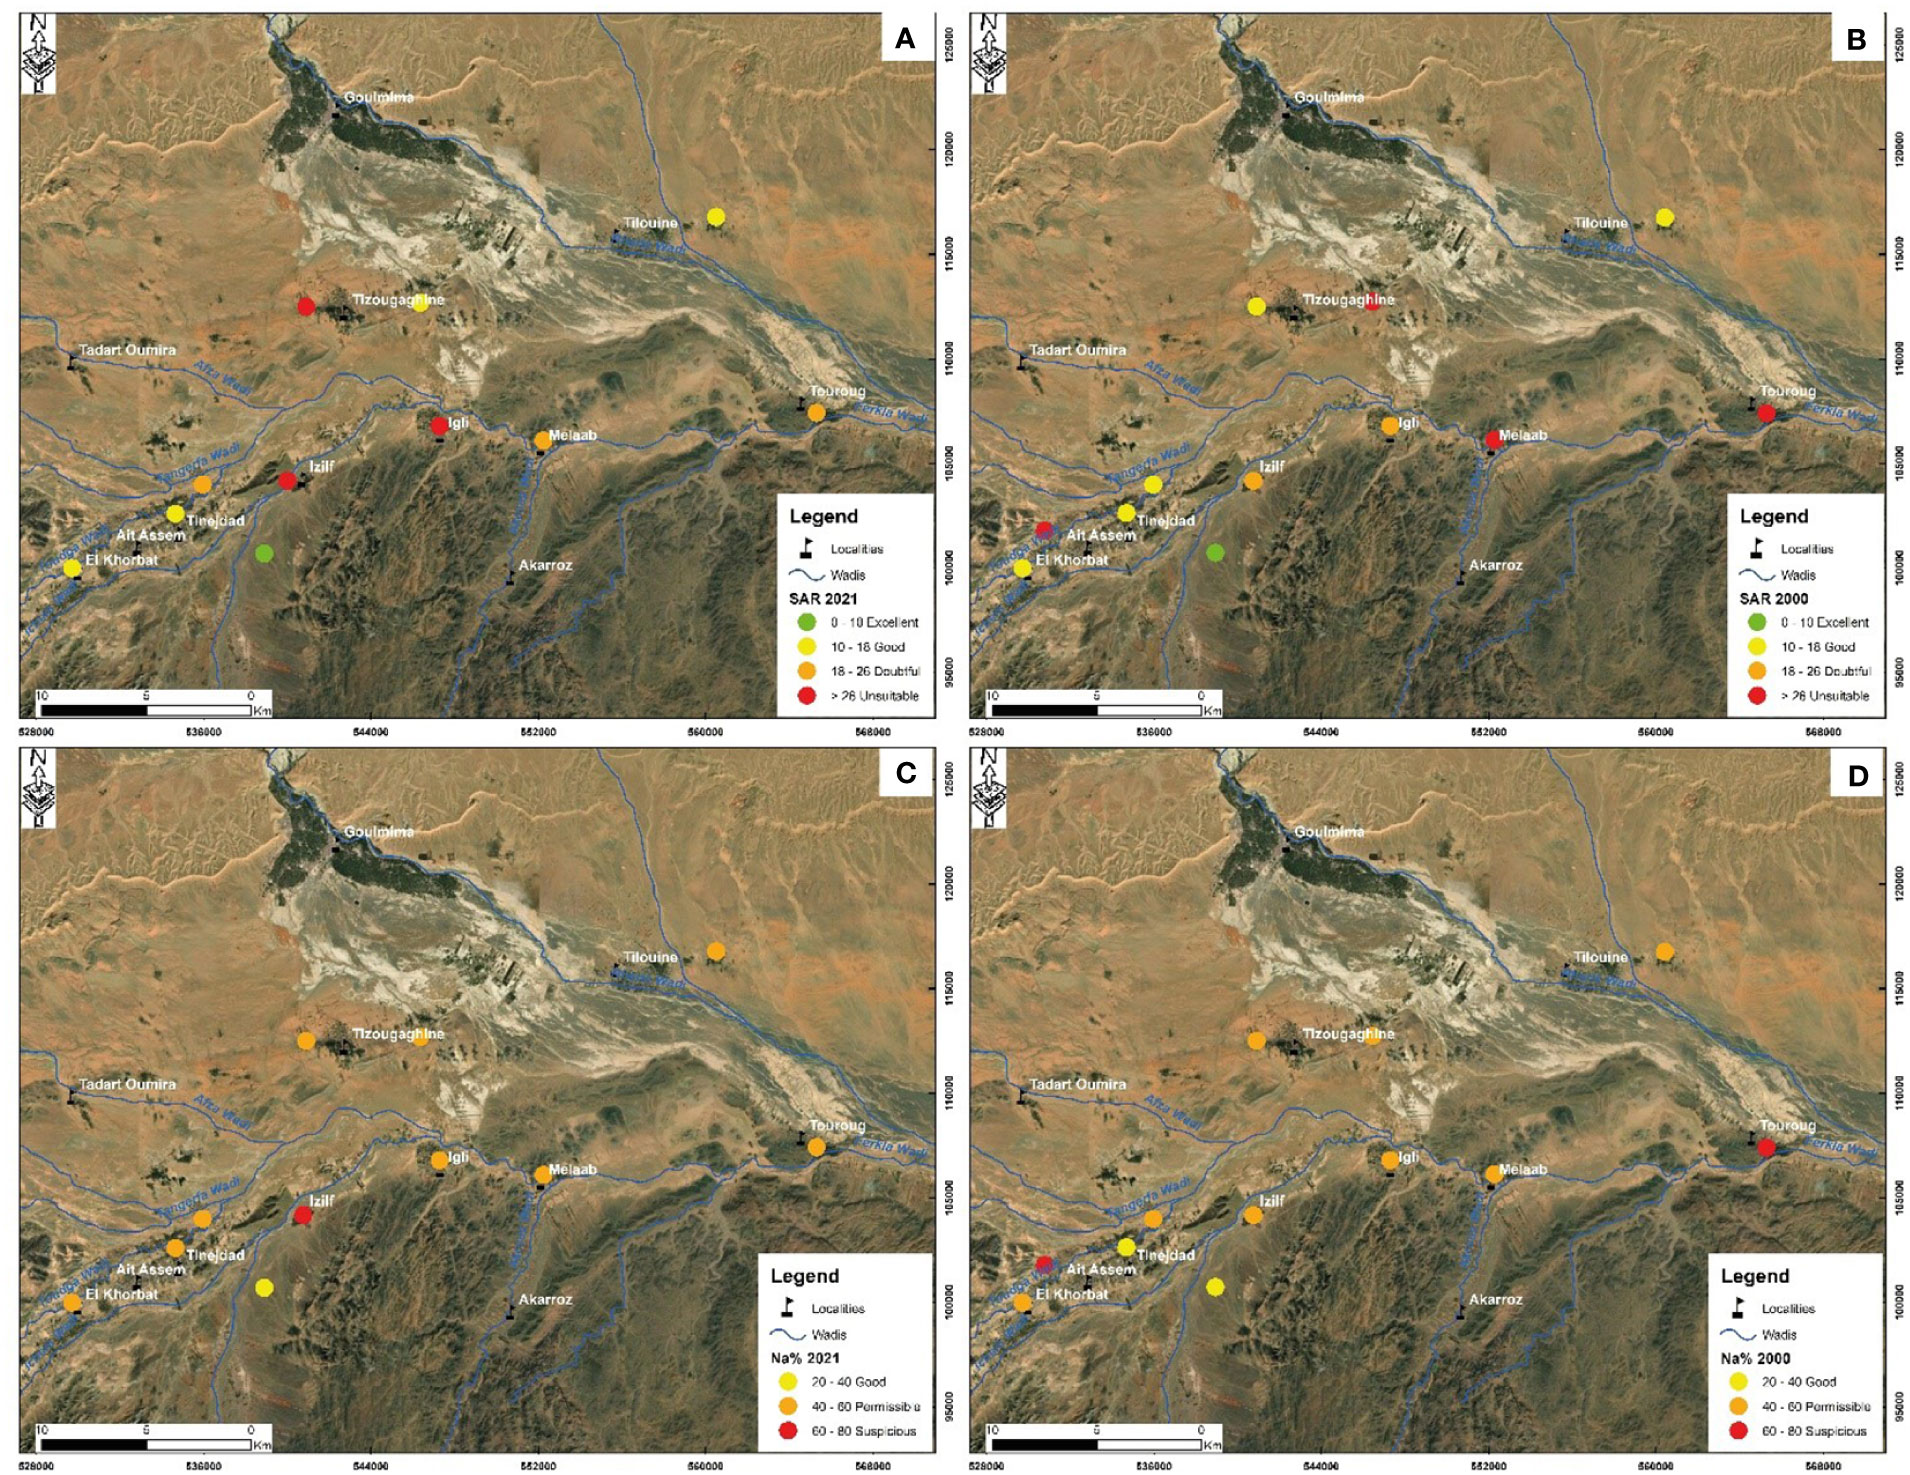
Figure 13 Groundwater classification for irrigation purposes based on SAR and Na%: (A) and (C) 2021 campaign, (B) and (D) 2000 campaign.
The USSL diagram shows that they are divided into three major categories (Figure 14): class C3S1 corresponds to low SAR hazard and high salinity risk. This category includes the amount waters of the study area located at the upstream part covered by the oasis. Class C4S1 indicate low SAR hazard with salinity values that must be controlled, water in this category should only be used on soils with good leaching capacities (Zaman et al., 2018). Finally, class C4S2 indicate very poor water quality, as represented by the waters of the Tizougaghine in the center part of the study area, Izilf, and Igli toward the contact with the Anti-Atlas bedrocks.
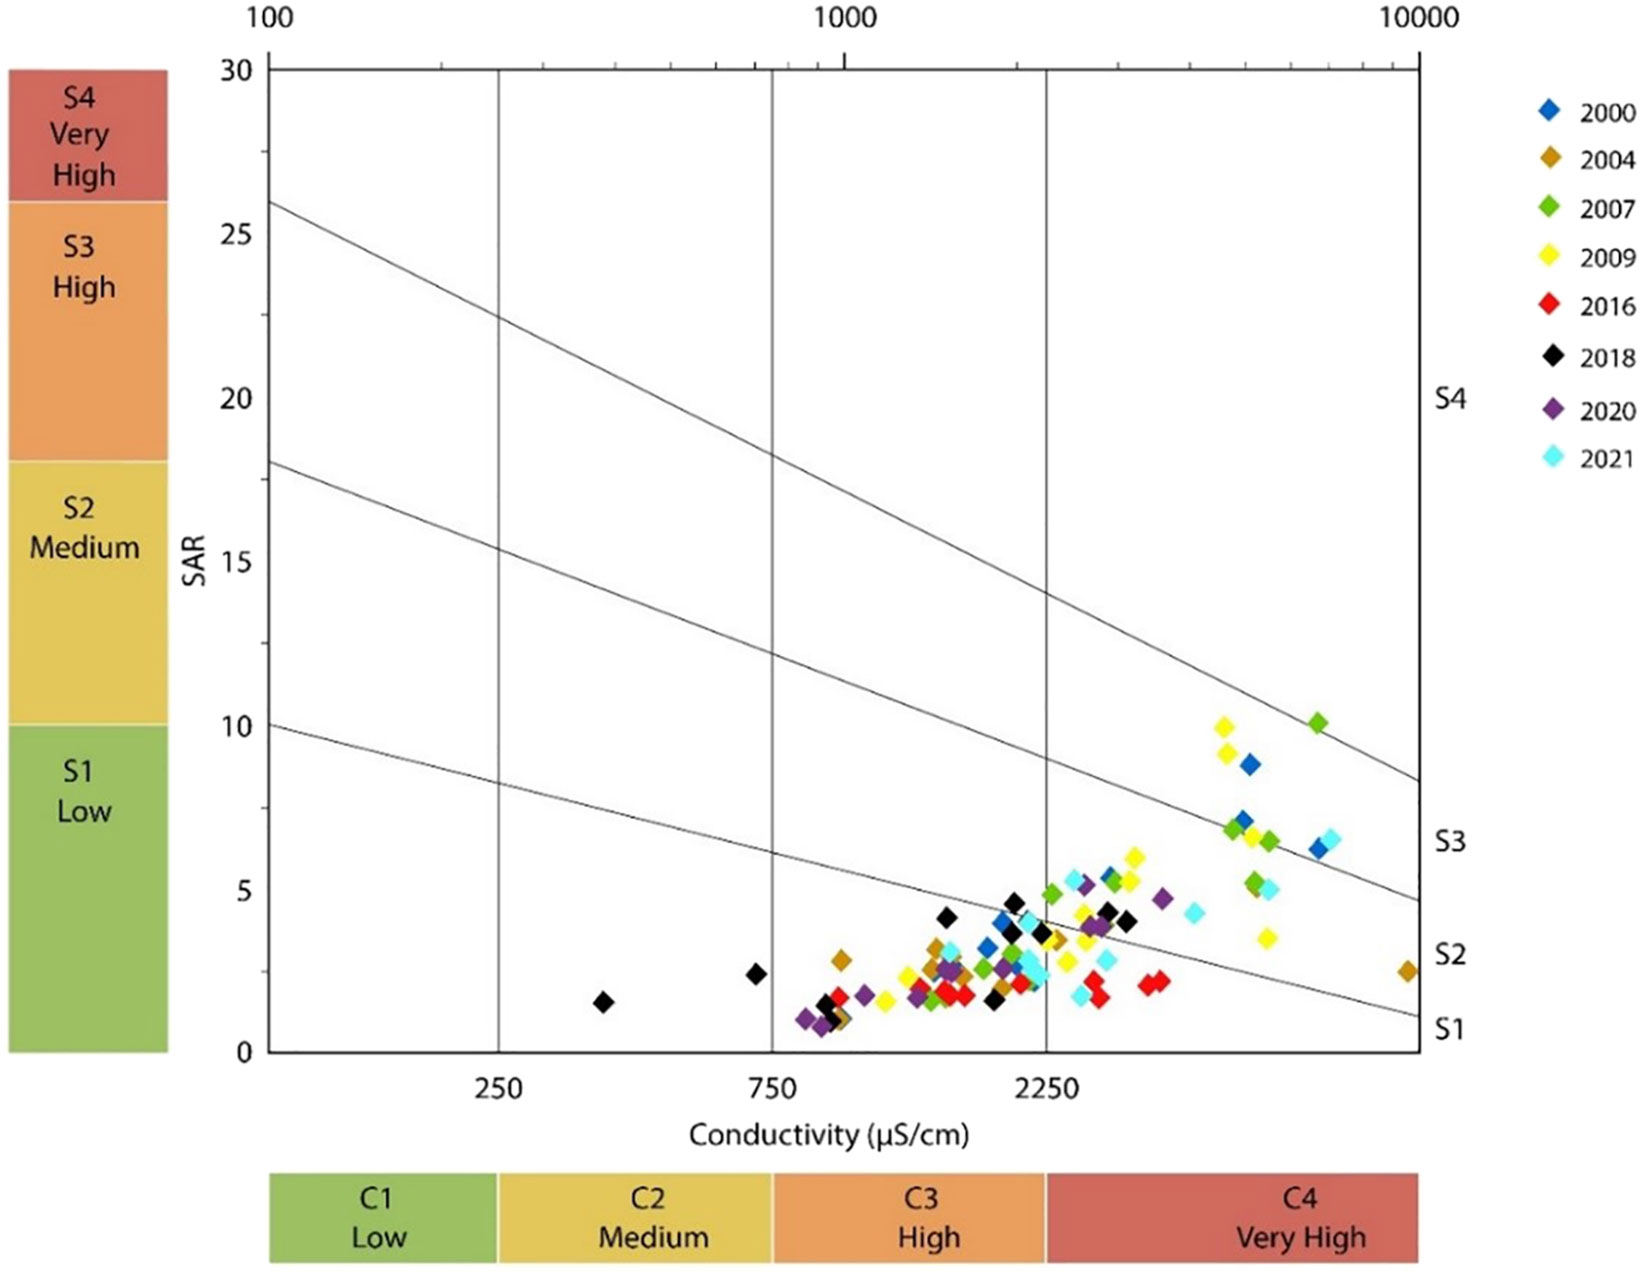
Figure 14 United States Salinity Laboratory diagram for irrigation water classiffication (US Salinity Laboratory S, 1954).
The sodium percentage is a common factor in irrigation water evaluation. The Na% values in the water samples studied range from (33.4) to (70.9). Classification revealed that 82% of samples had acceptable irrigation quality, 9% had good irrigation quality, and 9% had poor irrigation quality for the campaign 2021 (Table 4). One of the samples has an excellent quality class in the 2004 campaign. The remains of the samples for the other years indicate quality ranging from good to permissible, with relatively comparable percentages for the year 2021 (Figures 13C, D).
Another measure mostly used to obtain information on groundwater quality is the ratio described by (Kelley, 1963), which considers the amounts of Na+ associated with Ca2+ and Mg2+. Equation 8 in Table 3 was used to compute Kelly’s ratio. A Kelly ratio of more than 2 is judged undesirable for irrigation. When the Kelly index is between 1 and 2, the water is suitable marginally, however, an index below 1 is regarded as appropriate. The values obtained in the study area show that one of the samples in the campaigns 2000, 2009, and 2021 is unsuitable for irrigation (Figures 15A, B). For the rest of the samples, more than 50% are appropriate for irrigation in most cases, and less than 40% are marginally suitable (Table 4).
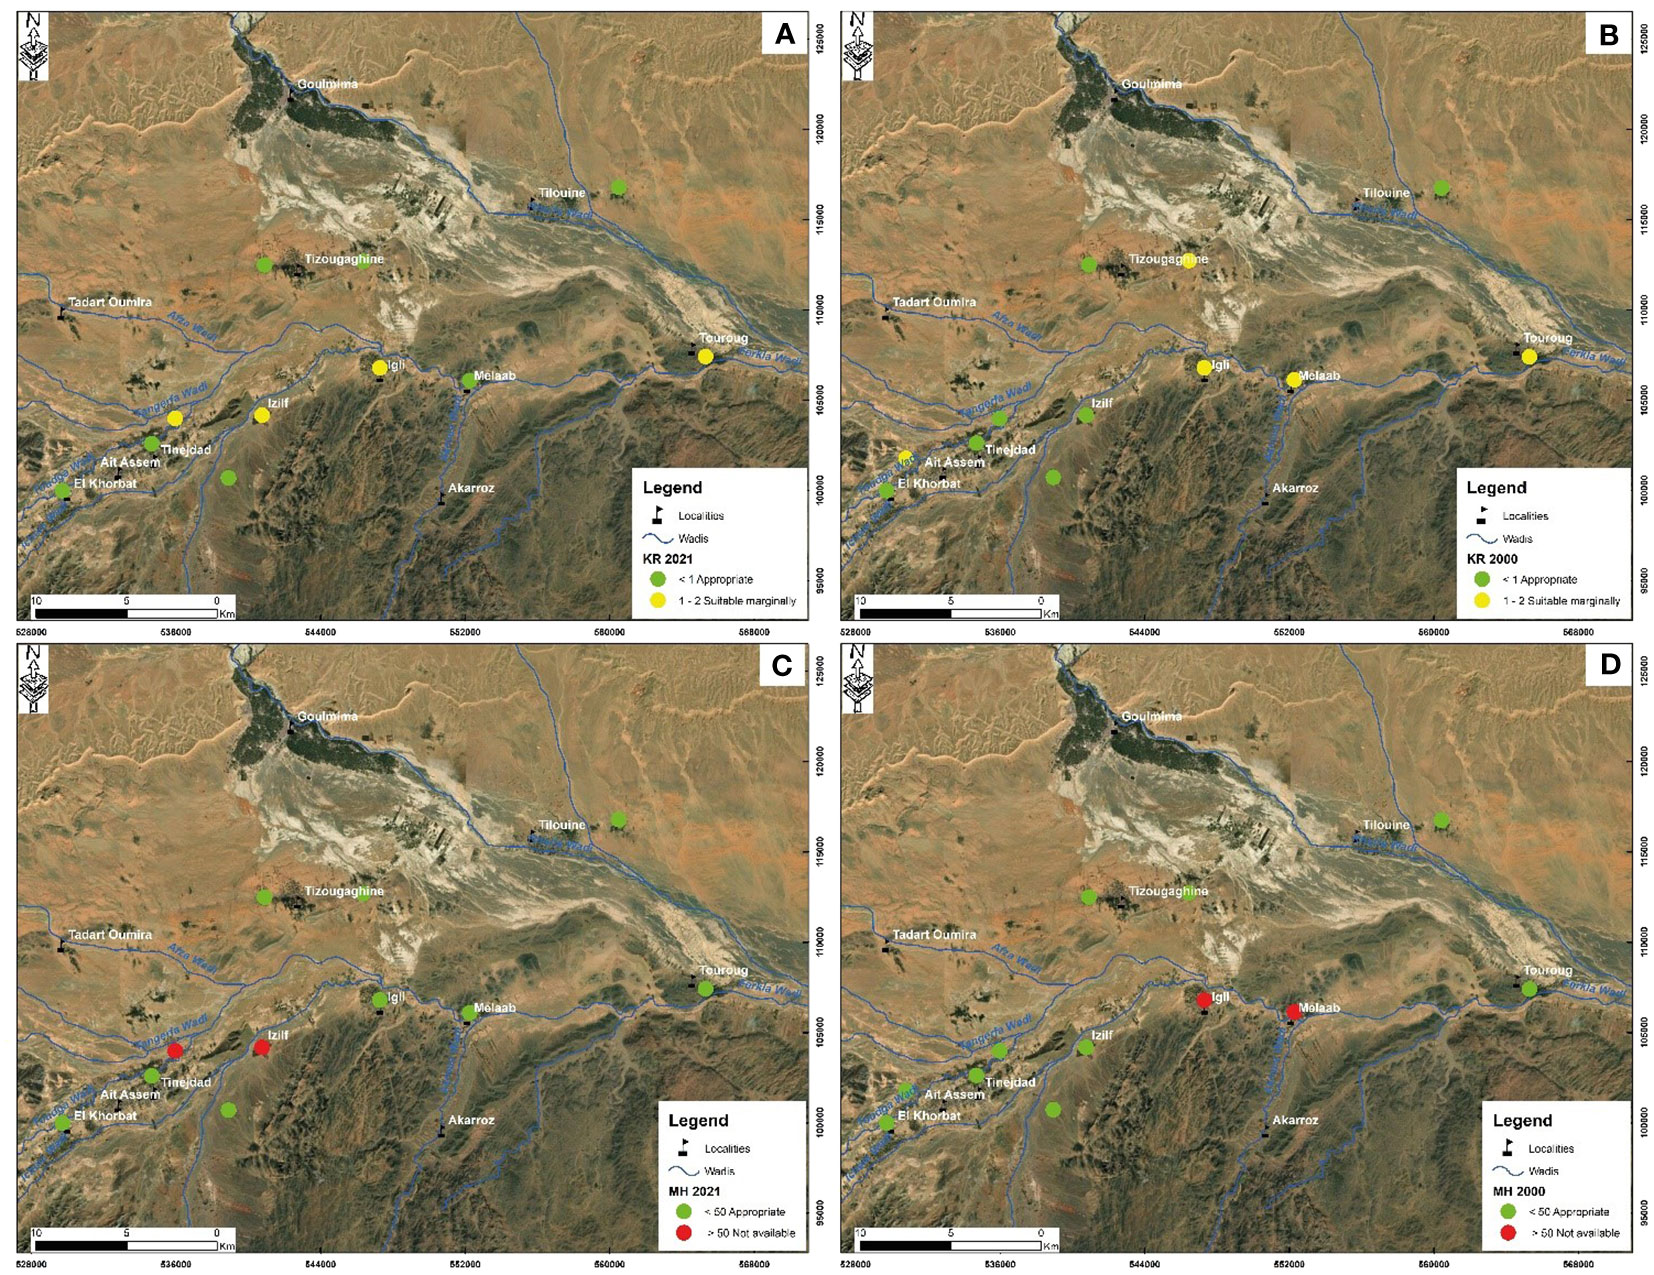
Figure 15 Groundwater quality variation for irrigation purposes based on KR (A) and (C), and MH (B) and (D).
Groundwater quality is also influenced by the concentrations of magnesium and calcium in the water. When the magnesium hazard (MH) in irrigation water surpasses 50%, the soil becomes more alkaline, reducing agricultural yields (Karunanidhi et al., 2013). Paliwal (1972) established a formula for calculating the MH (Table 3). In this approach, the estimated values are classified as suitable or inappropriate (Figures 15C, D). Values less than 50 are regarded as appropriate for irrigation, although values greater than 50 are deemed unsuitable. According to the calculated magnesium ratios for all monitored years shown in Table 4, more than 75% of groundwater samples were appropriate for irrigation and fewer than 25% were unsuitable.
This index indicates that the samples are evenly distributed around the mean. The increase in Na content causes a decrease in soil permeability (Bahir et al., 2019; Xu et al., 2019). The permeability of the soil is a significant factor in allowing groundwater water infiltration. The evaluation of groundwater suitability for irrigation purposes was conducted utilizing the permeability index (PI) parameter, as calculated through the formula presented in Table 3. As described by Doneen (1964), PI values are divided into three distinct categories, namely excellent, good, and unsuitable (Table 4). This classification system allows for a comprehensive assessment of the quantity and quality of groundwater resources, thus facilitating informed decision-making processes related to agricultural practices. Waters of classes 1 and 2 are considered good for irrigation, with a maximum permeability of 75% or greater, but the water of class 3 is not desirable, with a maximum permeability of 25%. The calculated values of the permeability index in the study area show that all samples of different campaigns were good quality for irrigation.
The obtained water quality indicators were compared to values reported in chosen cases of comparable Quaternary aquifer investigations conducted in different parts of the country (Table 5).
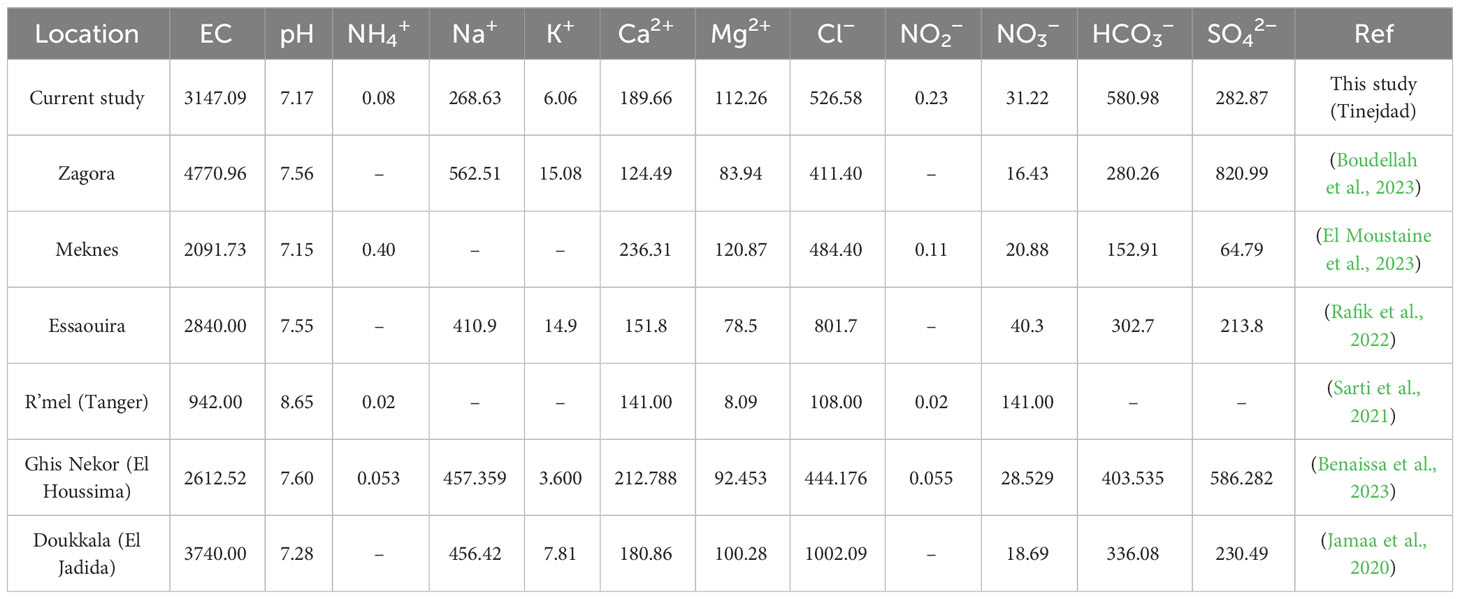
Table 5 Comparison of average values for the studied area of the primary groundwater quality parameters with previous studies of different quaternary aquifers in Morocco.
According to the table, EC values in the study area were lower than those reported in Zagora and Doukkala, nonetheless higher than those recorded in the remaining localities. Acidity levels in the samples were mainly neutral and similar to those recorded in Meknes, Zagora, Essaouira, and Ghis Nekor. Major cation concentrations in the Tinejdad region were notably higher than those reported in Essaouira and Zagora, with the exception of Na+, which had the lowest concentration compared to the other studies. Major cation concentrations, on the other hand, are comparable to those recorded in Doukkala and Ghis Nekor, and are less than those found in Meknes.
Tinejdad has considerably higher concentrations of anions such as HCO3− and NO2− than the other locations. Nonetheless, Cl− levels in R’mel and Essaouira were above those in Tinejdad, in contrast to Meknes, Zagora, and Ghis Nekor, Cl− levels were lower than those measured in the present investigation. SO42− levels are similar to those observed in Doukkala and Essaouira, although lower compared to Ghis Nekor and Zagora. While Meknes continues to have the lowest level. NO3− values are comparable to those found in Ghis Nekor, but higher in Zagora, Meknes, and Doukkala, and considerably less in R’mel and Essaouira.
South-east Morocco is characterized by several palm groves and oases, which are rich in ecosystems. Even though their fragility, the oasis are the region’s treasures due to their distinctive geographical location and groundwater supplies. The Tinejdad area (Ferkla oasis) belongs to the UNESCO Biosphere Reserve in the Southern Moroccan Oases (United Nations Educational, Scientific, and Cultural Organization). The present study approved the potential benefits of combining hydrogeochemical methods with GIS tools to investigate groundwater degradation mechanisms, describe spatiotemporal groundwater variations, and assess groundwater quality for domestic and irrigation purposes.
Hydrogeochemical investigations found that the groundwater in the investigated region belongs of the mixed Cl-SO4-Ca-Mg type. Principal component analysis (PCA) and correlation matrices illustrating chemical element association suggested that evaporation and ion exchange with surrounding rocks are the primary factors influencing groundwater deterioration. The majority of wells investigated fulfilled WHO and Moroccan water quality requirements for temperature, pH, DO, TH, Ca2+, SO42−, K+, NH4+, and the bacteriological indicators evaluated, including TF, FS, and FC. For one or more parameters like as EC, Turbidity, TDS, Cl−, Mg2+, NO3−, and Na+, less than 40% of samples surpassed the reference value. Less than 40% of samples exceeded the standard value for one or more parameters, including EC, Turbidity, TDS, Cl−, Mg2+, NO3−, and Na+. However, salt concentrations can be significant in specific locations, particularly along the Paleozoic and Precambrian shale contact zones. Two additional variables could be contributing to this downstream increase in salinity, notably increased evaporation as temperatures rise towards the south and the low porosity that specifies the type of lithological deposit forming the aquifer on a plain-wide scale. Nitrate levels differ most likely as a result of human activities like septic tanks, agricultural activities, or possible interactions with Paleozoic rocks.
Approximately 50% of the wells in the examined aquifer do not meet the quality guidelines set forth by WHO, as determined by the Water Quality Index (WQI). Despite this, most of the wells can quiet be used for human consumption, although it is not recommended. Given this scenario, it is advisable to equip several of the wells with preliminary processing systems. Additionally, the study reveals that the groundwater in the Tinejdad-Touroug region is generally suitable for irrigation purposes. However, the presence of excessive salt, sodium, and magnesium levels raises concerns. To address this, when using aquifer water for irrigation, it is important to implement specific soil management techniques and choose plants that can tolerate high Na and Mg concentrations.
The geospatial distributions of the quality and suitability of controlled wells improved the benefits of the current study’s findings, as the spatial distribution of physicochemical elements in the study area shows a general downward gradient from the center to the nearby aquifer and from northwest to southeast with increasing slope and significant soil permeability. The research’s findings show groundwater deterioration in the studied region. As a result, measures that reduce the pressure on this resource are essential. Groundwater extraction should be regulated, especially from wells to the southeast of the study area. Furthermore, we recommend longer-term groundwater quality monitoring in the region for understanding the periodicity of fluctuations in groundwater quality.
The raw data supporting the conclusions of this article will be made available by the authors, without undue reservation.
Conceptualization: BS, E-MM, RM, and EF; Methodology: BS, E-MM, EF, and RF; Formal analysis and investigation: BS, AM, FH, and JT; Writing – original draft preparation: BS, E-MM, RM; Writing – review and editing: BS, E-MM, EF, RM; Supervision: E-MM and EF. All authors contributed to the article and approved the submitted version.
The authors would like to express their gratitude to the staff of the Guir-Ziz-Rheris Hydraulic Basin Agency for supplying relevant data and cooperation during field missions. The authors are also very grateful for the comments and suggestions of the reviewers, and the journal editor’s careful reading of the article, who facilitated the author’s work.
The authors declare that the research was conducted in the absence of any commercial or financial relationships that could be construed as a potential conflict of interest.
All claims expressed in this article are solely those of the authors and do not necessarily represent those of their affiliated organizations, or those of the publisher, the editors and the reviewers. Any product that may be evaluated in this article, or claim that may be made by its manufacturer, is not guaranteed or endorsed by the publisher.
The Supplementary Material for this article can be found online at: https://www.frontiersin.org/articles/10.3389/fevo.2023.1201748/full#supplementary-material
Abdelfadel F., Hilali M., Fontaine C., El Albani A., Mahboub A., Eloy L., et al. (2020). Hydrogeology of a complex aquifer system in semi-arid mountainous region: the eastern upper guir basin in the high atlas (Morocco). Water 12 (10), 2849. doi: 10.3390/w12102849
Abia E. H. (1991). Cartographie, pétrographie et métallogénie du Protérozoıque du district Pb, Zn, Cu et Ba de Mellab (massif de l’Ougnat, Anti-Atlas, Maroc). Third Cycle Thesis (Morocco: Marrakech University).
Afshan N., Nagaraju D., Bhanuprakash H. M., Deep P. G. (2022). Seasonal analysis of groundwater samples to identify water quality index and comparative statistical analysis of Hunsur Taluk, Mysuru, Karnataka, India. SN Appl. Sci. 4 (8). doi: 10.1007/s42452-022-05102-z
Akter T., Jhohura F. T., Akter F., Chowdhury T. R., Mistry S. K., Dey D., et al. (2016). Water Quality Index for measuring drinking water quality in rural Bangladesh: A cross-sectional study. J. Health Population Nutr. 35 (1), 4. doi: 10.1186/s41043-016-0041-5
Al-Asadi S. A. R., Al-Qurnawi W. S., Al Hawash A. B., Ghalib H. B., Alkhlifa N.-H. A. (2020). Water quality and impacting factors on heavy metals levels in Shatt Al-Arab River, Basra, Iraq. Appl. Water Sci. 10 (5), 103. doi: 10.1007/s13201-020-01196-1
Alshehri F., Abdelrahman K. (2023). Integrated approach for the investigation of groundwater quality using hydrochemical and geostatistical analyses in Wadi Fatimah, western Saudi Arabia. Front. Earth Sci. 11. doi: 10.3389/feart.2023.1166153
AlSuhaimi A. O., AlMohaimidi K. M., MOmani K. A. (2019). Preliminary assessment for physicochemical quality parameters of groundwater in Oqdus Area, Saudi Arabia. J. Saudi Soc. Agric. Sci. 18 (1), 22−31. doi: 10.1016/j.jssas.2016.12.002
Asadi E., Isazadeh M., Samadianfard S., Ramli M. F., Mosavi A., Nabipour N., et al. (2020). Groundwater quality assessment for sustainable drinking and irrigation. Sustainability 12 (1). doi: 10.3390/su12010177
Bahir M., El Mountassir O., Dhiba D., Chehbouni A., Carreira P. M., Elbiar H. (2022). Combining stable isotope and WQI methods to study the groundwater quality: A case study in Essaouira city, Morocco. SN Appl. Sci. 4 (11), 317. doi: 10.1007/s42452-022-05165-y
Bahir M., Ouazar D., Ouhamdouch S. (2019). Hydrogeochemical investigation and groundwater quality in Essaouira region, Morocco. Mar. Freshw. Res. 70 (9), 1317. doi: 10.1071/MF18319
Bahir M., Ouhamdouch S., Ouazar D. (2021a). An assessment of the changes in the behavior of the groundwater resources in arid environment with global warming in Morocco. Groundwater Sustain. Dev. 12, 100541. doi: 10.1016/j.gsd.2020.100541
Bahir M., Ouhamdouch S., Ouazar D., Chehbouni A. (2020). Assessment of groundwater quality from semi-arid area for drinking purpose using statistical, water quality index (WQI) and GIS technique. Carbonates Evaporites 35 (1), 27. doi: 10.1007/s13146-020-00564-x
Bahir M., Ouhamdouch S., Ouazar D., Rafik A., Chehbouni A. (2021b). An assessment of groundwater from semi-arid environment of Morocco for drinking and agricultural uses with reference to water quality indices technique. Carbonates Evaporites 36 (3), 62. doi: 10.1007/s13146-021-00731-8
Baki S., Hilali M., Kacimi I., Kassou N., Nouiyti N., Bahassi A. (2017). Assessment of groundwater intrinsic vulnerability to pollution in the pre-saharan areas—The case of the tafilalet plain (Southeast Morocco). Proc. Earth Planetary Sci. 17, 590−593. doi: 10.1016/j.proeps.2016.12.151
Baki S., Hilali M., Kacimi I., Mahboub A., Kassou N., Nouiyti N. (2016). Etude de la vulnérabilité intrinsèque à la pollution et qualité des eaux de surface dans les zones arides: Cas du bassin versant de l’oued Rhéris (Sud-Est du Maroc) Study of intrinsic vulnerability to the pollution and quality of surface water in the Saharan zones: Example of wadi Rheris basin (Southeast Morocco). J. Mater. Environ. Sci. 7 (11), 3961–3972.
Benaissa C., Bouhmadi B., Rossi A. (2023). An assessment of the physicochemical, bacteriological quality of groundwater and the water quality index (WQI) used GIS in Ghis Nekor, Northern Morocco. Sci. Afr. 20, e01623. doi: 10.1016/j.sciaf.2023.e01623
Bouaamlat I., Larabi A., Faouzi M. (2016). Hydrogeological investigation of an oasis-system aquifer in arid southeastern Morocco by development of a groundwater flow model. Hydrogeology J. 24 (6), 1479−1496. doi: 10.1007/s10040-016-1409-8
Boudellah A., Moustaine R. E., GharMali A. E., Maliki A., Moutaouakil S., Bouriqi A., et al. (2023). Groundwater quality in Zagora southeast of Morocco by using physicochemical analysis and geospatial techniques. Environ. Monit. Assess. 195 (5), 624. doi: 10.1007/s10661-023-11163-3
Brown R. M., McClelland N. I., Deininger R. A., Tozer R. G. (1970). A water quality index-do we dare. Water sewage works 117 (10).
Çako V., Baci S., Shena M. (2013). Water turbidity as one of the trophic state indices in butrinti lake. J. Water Resource Prot. 05 (12), 1144−1148. doi: 10.4236/jwarp.2013.512120
Chakravarty T., Gupta S. (2021). Assessment of water quality of a hilly river of south Assam, north east India using water quality index and multivariate statistical analysis. Environ. Challenges 5, 100392. doi: 10.1016/j.envc.2021.100392
Dahan S., Johan G., Anouar K., Bekhechi M., Jalil M., Abdulnour R., et al. (2017). Gestion de la Rareté de l’Eau en Milieu Urbain au Maroc (Washington, DC: Banque mondiale).
Dandge K. P., Patil S. S. (2021). Spatial distribution of ground water quality index using remote sensing and GIS techniques. Appl. Water Sci. 12 (1), 7. doi: 10.1007/s13201-021-01546-7
Das N., Mondal P., Ghosh R., Sutradhar S. (2019). Groundwater quality assessment using multivariate statistical technique and hydro-chemical facies in Birbhum District, West Bengal, India. SN Appl. Sci. 1 (8), 825. doi: 10.1007/s42452-019-0841-5
Diédhiou M., Ndoye S., Celle H., Faye S., Wohnlich S., Le Coustumer P. (2023). Hydrogeochemical appraisal of groundwater quality and its suitability for drinking and irrigation purposes in the west central Senegal. Water 15 (9). doi: 10.3390/w15091772
Doneen L. D. (1964). Notes on water quality in agriculture (Davis, CA: Department of Water Science and Engineering, University of California, Davis).
Elkhalki S., Hamed R., Jodeh S., Ghalit M., Elbarghmi R., Azzaoui K., et al. (2023). Study of the quality index of groundwater (GWQI) and its use for irrigation purposes using the techniques of the geographic information system (GIS) of the plain Nekor-Ghiss (Morocco). Front. Environ. Sci. 11. doi: 10.3389/fenvs.2023.1179283
El Boukhari A., Ottria G., Ahmed A., Cerrina Feroni A., Dal Piaz G., Ellero A. F. G., et al. (2007). Notice Explicative de la Carte Géologique du Maroc au 1/50.000, feuille Taroucht. Notes et Mémoires du Service Géologique du Maroc.
El Mountassir O., Bahir M., Ouazar D., Ouhamdouch S., Chehbouni A., Ouarani M. (2020). The use of GIS and water quality index to assess groundwater quality of krimat aquifer (Essaouira; Morocco). SN Appl. Sci. 2 (5), 871. doi: 10.1007/s42452-020-2653-z
El Moustaine R., Chahlaoui A., Maliki A., Boudellah A. (2023). Assessment and modeling of groundwater quality by using water quality index (WQI) and GIS technique in meknes aquifer (Morocco). Geology Ecology Landscapes 7 (2), 126−138. doi: 10.1080/24749508.2021.1944797
El Ouali A., Roubil A., Lahrach A., Moudden F., Ouzerbane Z., Hammani O., et al. (2023). Assessment of groundwater quality and its recharge mechanisms using hydrogeochemical and isotopic data in the Tafilalet plain (south-eastern Morocco). Mediterr. Geosci. Rev. 5 (1), 1−14. doi: 10.1007/s42990-023-00096-1
El Yousfi Y., Himi M., El Ouarghi H., Aqnouy M., Benyoussef S., Gueddari H., et al. (2023). Assessment and prediction of the water quality index for the groundwater of the ghiss-nekkor (Al hoceima, northeastern Morocco). Sustainability 15 (1). doi: 10.3390/su15010402
El-Zeiny A. M., Elbeih S. F. (2019). GIS-based evaluation of groundwater quality and suitability in dakhla oases, Egypt. Earth Syst. Environ. 3 (3), 507−523. doi: 10.1007/s41748-019-00112-1
Foster S., Garduño H. (2013). Irrigated agriculture and groundwater resources – towards an integrated vision and sustainable relationship. Water Sci. Technol. 67 (6), 1165−1172. doi: 10.2166/wst.2013.654
Gautam A., Rai S. C., Rai S. P., Ram K., Sanny (2022). Impact of anthropogenic and geological factors on groundwater hydrochemistry in the unconfined aquifers of Indo-Gangetic plain. Phys. Chem. Earth Parts A/B/C 126, 103109. doi: 10.1016/j.pce.2022.103109
Gibbs R. J. (1970). Mechanisms controlling world water chemistry. Science 170 (3962), 1088−1090. doi: 10.1126/science.170.3962.1088
Goswami R., Neog N., Thakur R. (2022). Hydrogeochemical assessment of groundwater quality for drinking and irrigation in Biswanath and Sonitpur district of the Central Brahmaputra Plain, India. Front. Water 4. doi: 10.3389/frwa.2022.889128
Gugulothu S., Subbarao N., Das R., Dhakate R. (2022). Geochemical evaluation of groundwater and suitability of groundwater quality for irrigation purpose in an agricultural region of South India. Appl. Water Sci. 12 (6), 142. doi: 10.1007/s13201-022-01583-w
Honig V., Procházka P., Obergruber M., Roubík H. (2020). Nutrient effect on the taste of mineral waters: evidence from Europe. Foods 9 (12). doi: 10.3390/foods9121875
Horton R. K., Lyon W. A., Hubbard E. C., McCallum G. E. (1965). Water quality criteria-stream vs. Effluent standards. J. (Water pollut. Control Federation) 37 (3), 292−315.
Hubbard L. E., Givens C. E., Griffin D. W., Iwanowicz L. R., Meyer M. T., Kolpin D. W. (2020). Poultry litter as potential source of pathogens and other contaminants in groundwater and surface water proximal to large-scale confined poultry feeding operations. Sci. Total Environ. 735, 139459. doi: 10.1016/j.scitotenv.2020.139459
Ismail E., Abdelhalim A., Heleika M. A. (2021). Hydrochemical characteristics and quality assessment of groundwater aquifers northwest of Assiut district, Egypt. J. Afr. Earth Sci. 181, 104260. doi: 10.1016/j.jafrearsci.2021.104260
Jamaa H., El Achheb A., Ibno Namr K. (2020). Spatial variation of groundwater quality and assessment of water table fluctuations in Plio-Quaternary aquifer formations in Doukkala Plain, Morocco. Groundwater Sustain. Dev. 11, 100398. doi: 10.1016/j.gsd.2020.100398
Kabiri L. (2005). Impact des changements climatiques et anthropiques sur les ressources en eau dans l’Oasis de Ferkla (Tinjdad, Goulmima, Errachidia, Maroc) (Cambridge, MA: Academic Press).
Karunanidhi D., Vennila G., Suresh M., Subramanian S. K. (2013). Evaluation of the groundwater quality feasibility zones for irrigational purposes through GIS in Omalur Taluk, Salem District, South India. Environ. Sci. pollut. Res. 20 (10), 7320–7333. doi: 10.1007/s11356-013-1746-2
Kaur T., Bhardwaj R., Arora S. (2017). Assessment of groundwater quality for drinking and irrigation purposes using hydrochemical studies in Malwa region, southwestern part of Punjab, India. Appl. Water Sci. 7 (6), 3301–3316. doi: 10.1007/s13201-016-0476-2
Kelley W. P. (1963). USE OF SALINE IRRIGATION WATER. Soil Sci. 95 (6), 385–391. doi: 10.1097/00010694-196306000-00003
Khadra W. M., Elias A. R., Majdalani M. A. (2022). A systematic approach to derive natural background levels in groundwater: Application to an aquifer in North Lebanon perturbed by various pollution sources. Sci. Total Environ. 847, 157586. doi: 10.1016/j.scitotenv.2022.157586
Lgourna Z., Warner N., Bouchaou L., Boutaleb S., Hssaisoune M., Tagma T., et al. (2015). Elucidating the sources and mechanisms of groundwater salinization in the Ziz Basin of southeastern Morocco. Environ. Earth Sci. 73 (1), 77−93. doi: 10.1007/s12665-014-3396-1
Li Y., Li P., Cui X., He S. (2021). Groundwater quality, health risk, and major influencing factors in the lower Beiluo River watershed of northwest China. Hum. Ecol. Risk Assessment: Int. J. 27 (7), 1987−2013. doi: 10.1080/10807039.2021.1940834
Li J., Yu S., Liu Q., Wang D., Yang L., Wang J., et al. (2023). Screening of hazardous groundwater pollutants responsible for microbial ecological consequences by integrated nontargeted analysis and high-throughput sequencing technologies. J. Hazardous Materials 445, 130516. doi: 10.1016/j.jhazmat.2022.130516
Mahammad S., Islam A., Shit P. K. (2022). Geospatial assessment of groundwater quality using entropy-based irrigation water quality index and heavy metal pollution indices. Environ. Sci. pollut. Res. doi: 10.1007/s11356-022-20665-5
Margat J., Destombes J., Hollard H. (1962). Mémoire explicatif de la carte hydrogéologique au 1/50000 de la plaine du Tafilalt: Géologie. Kingdom of Morocco: Ministry of Commerce, Mining Industry and Merchant Marine, Directorate of Mines and Geology, Geology Division.
Masoud M. H. Z., Basahi J. M., Zaidi F. K. (2019). Assessment of artificial groundwater recharge potential through estimation of permeability values from infiltration and aquifer tests in unconsolidated alluvial formations in coastal areas. Environ. Monit. Assess. 191 (1), 31. doi: 10.1007/s10661-018-7173-6
Mehdaoui R., Mili E. M., Mahboub A. (2019). Caractérisations physico-chimiques et bactériologiques pour l’évaluation de la qualité des eaux souterraines de la vallée du moyen Ziz (Errachidia Sud-Est du Maroc). La Houille Blanche 105 (5−6), 5−15. doi: 10.1051/lhb/2019054
Michard A., Soulaimani A., Ouanaimi H., Raddi Y., Aït Brahim L., Rjimati E.-C., et al. (2017). Saghro Group in the Ougnat Massif (Morocco), an evidence for a continuous Cadomian basin along the northern West African Craton. Comptes Rendus Geosci. 349 (2), 81−90. doi: 10.1016/j.crte.2017.01.001
Mukherjee I., Singh U. K. (2018). Groundwater fluoride contamination, probable release, and containment mechanisms: A review on Indian context. Environ. Geochemistry Health 40 (6), 2259−2301. doi: 10.1007/s10653-018-0096-x
Nduka J. K., Orisakwe O. E., Ezenweke L. O. (2008). Some physicochemical parameters of potable water supply in Warri, Niger Delta area of Nigeria. Sci. Res. Essays 5.
Omer N. H. (2019). “Water quality parameters,” in Water quality-science, assessments and policy. Ed. Summers K. (London: Intech Open).
Ouarani M., Bahir M., Mulla D. J., Ouazar D., Chehbouni A., Dhiba D., et al. (2020). Groundwater quality characterization in an overallocated semi-arid coastal area using an integrated approach: case of the essaouira basin, Morocco. Water 12 (11), 3202. doi: 10.3390/w12113202
Ouhamdouch S., Bahir M., Ouazar D., Rafik A. (2022). Hydrochemical characteristics of aquifers from the coastal zone of the Essaouira basin (Morocco) and their suitability for domestic and agricultural uses. Sustain. Water Resour. Manage. 8 (6), 171. doi: 10.1007/s40899-022-00754-6
Ouhamdouch S., Bahir M., Souhel A., Paula C. (2016). “Vulnerability and Impact of Climate Change Processes on Water Resource in Semi-Arid Areas,” in Energy, Transportation and Global Warming. Ed. Grammelis P. (Essaouira Basin (Morocco: Springer International Publishing), 719−736. doi: 10.1007/978-3-319-30127-3_53
Paliwal K. V. (1972). Irrigation with saline water. New Delhi: Water Technology Centre, Indian Agriculture Research Institute.
Panneerselvam B., Muniraj K., Duraisamy K., Pande C., Karuppannan S., Thomas M. (2023a). An integrated approach to explore the suitability of nitrate-contaminated groundwater for drinking purposes in a semiarid region of India. Environ. Geochemistry Health 45 (3), 647−663. doi: 10.1007/s10653-022-01237-5
Panneerselvam B., Ravichandran N., Kaliyappan S. P., Karuppannan S., Bidorn B. (2023b). Quality and health risk assessment of groundwater for drinking and irrigation purpose in semi-arid region of India using entropy water quality and statistical techniques. Water 15 (3), 601. doi: 10.3390/w15030601
Piper A. M. (1944). A graphic procedure in the geochemical interpretation of water-analyses. Transactions Am. Geophysical Union 25 (6), 914. doi: 10.1029/TR025i006p00914
Qureshi S. S., Channa A., Memon S. A., Khan Q., JaMali G. A., Panhwar A., et al. (2021). Assessment of physicochemical characteristics in groundwater quality parameters. Environ. Technol. Innovation 24, 101877. doi: 10.1016/j.eti.2021.101877
Raddi Y. (2014). Evolution tectonique polycyclique à la marge du Craton ouestafricain: Le Massif de l’Ougnat (Anti-Atlas oriental, Maroc) (Rabat, Morocco: Mohamed V University).
Rafik A., Bahir M., Beljadid A., Chehbouni A., Dhiba D., Ouhamdouch S. (2022). The combination of the quality index, isotopic, and GIS techniques to assess water resources in a semi-arid context (Essaouira watershed in Morocco). Groundwater Sustain. Dev. 17, 100768. doi: 10.1016/j.gsd.2022.100768
Ram A., Tiwari S. K., Pandey H. K., Chaurasia A. K., Singh S., Singh Y. V. (2021). Groundwater quality assessment using water quality index (WQI) under GIS framework. Appl. Water Sci. 11 (2), 46. doi: 10.1007/s13201-021-01376-7
Richards R. S. (1954). Diagnosis and Improvement of Saline and Alkali Soils (Washington, DC: U.S. Department of Agriculture).
Rodier J. (2009). L’analyse de l’eau/Jean Rodier, Bernard Legube, Nicole Merlet et coll. (9e édition entièrement mise à jour) (Paris: Dunod).
Roubil A., El Ouali A., Bülbül A., Lahrach A., Mudry J., Mamouch Y., et al. (2022). Groundwater hydrochemical and isotopic evolution from high atlas jurassic limestones to errachidia cretaceous basin (Southeastern Morocco). Water 14 (11), 1747. doi: 10.3390/w14111747
Roy A., Keesari T., Mohokar H., Sinha U. K., Bitra S. (2018). Assessment of groundwater quality in hard rock aquifer of central Telangana state for drinking and agriculture purposes. Appl. Water Sci. 8 (5), 124. doi: 10.1007/s13201-018-0761-3
Ruhard J.-P. (1977). Le bassin quaternaire du Tafilalet. Tome 3. (Morocco: Éditions du Service Géologique du Maroc).
Salhi A., Martin-Vide J., Benhamrouche A., Benabdelouahab S., Himi M., Benabdelouahab T., et al. (2019). Rainfall distribution and trends of the daily precipitation concentration index in northern Morocco: A need for an adaptive environmental policy. SN Appl. Sci. 1 (3), 277. doi: 10.1007/s42452-019-0290-1
Sarti O., Otal E., Morillo J., Ouassini A. (2021). Integrated assessment of groundwater quality beneath the rural area of R’mel, Northwest of Morocco. Groundwater Sustain. Dev. 14, 100620. doi: 10.1016/j.gsd.2021.100620
Satish Kumar V., Amarender B., Dhakate R., Sankaran S., Raj Kumar K. (2016). Assessment of groundwater quality for drinking and irrigation use in shallow hard rock aquifer of Pudunagaram, Palakkad District Kerala. Appl. Water Sci. 6 (2), 149−167. doi: 10.1007/s13201-014-0214-6
Solangi G. S., Siyal A. A., Babar M. M., Siyal P. (2020). Groundwater quality evaluation using the water quality index (WQI), the synthetic pollution index (SPI), and geospatial tools: A case study of Sujawal district, Pakistan. Hum. Ecol. Risk Assessment: Int. J. 26 (6), 1529−1549. doi: 10.1080/10807039.2019.1588099
Soualhine S., de Leon J. T., Hoepffner C. (2003). Les faciès sédimentaires carbonifères de Tisdafine (Anti-Atlas oriental): Remplissage deltaïque d’un bassin en «pull-apart» sur la bordure méridionale de l’Accident sud-atlasique. Bull. Inst. Sci. Rabat 25, 31−41.
Soulaimani A., Bouabdelli M., Piqué A. (2003). L’extension continentale au Néo-Protérozoïque supérieur-Cambrien inférieur dans l’Anti-Atlas (Maroc). Bull. Soc géol. France 174 (1), 83−92.
Soulaimani A., Hefferan K. L. (2017). Précambrien à la bordure nord du craton ouest-africain (Anti-Atlas et Haut Atlas, Maroc) Données générales. Géologues 194, 33−36.
Stupar Z., Levei E. A., Neag E., Baricz A., Szekeres E., Moldovan O. T. (2022). Microbial water quality and health risk assessment in karst springs from Apuseni Mountains, ROmania. Front. Environ. Sci. 10. doi: 10.3389/fenvs.2022.931893
Szekeres E., Chiriac C. M., Baricz A., Szőke-Nagy T., Lung I., Soran M.-L., et al. (2018). Investigating antibiotics, antibiotic resistance genes, and microbial contaminants in groundwater in relation to the proximity of urban areas. Environ. pollut. 236, 734−744. doi: 10.1016/j.envpol.2018.01.107
US Salinity Laboratory S (1954). Diagnosis and improvement of saline and alkali soils. Agriculture Handbook. Washington, DC: U.S. Department of Agriculture. Vol. 60. 83−100.
Viviroli D., Kummu M., Meybeck M., Kallio M., Wada Y. (2020). Increasing dependence of lowland populations on mountain water resources. Nat. Sustainability 3 (11). doi: 10.1038/s41893-020-0559-9
WHO (2022). Guidelines for drinking−water quality: Fourth edition incorporating the first and second addenda (4th ed + 1st add + 2nd add) (Geneva: World Health Organization). Available at: https://apps.who.int/iris/handle/10665/352532.
Wiatkowski M., Paul L. (2009). Surface water quality assessment in the Troja River catchment in the context of Włodzienin Reservoir construction. Pol. J. Environ. Stud. 18 (5), 923–929.
Wilcox L. V. (1955). Classification and Use of Irrigation Waters (Washington, DC: U.S. Department of Agriculture).
Xu P., Feng W., Qian H., Zhang Q. (2019). Hydrogeochemical characterization and irrigation quality assessment of shallow groundwater in the central-western guanzhong basin, China. Int. J. Environ. Res. Public Health 16 (9), 1492. doi: 10.3390/ijerph16091492
Keywords: WQI, physicochemical and biological parameters, in situ measurement, drinking water, irrigation uses
Citation: Ait Said B, Mili E-M, El Faleh EM, Mehdaoui R, Mahboub A, Hamid FE, Tlemcani J and El Fakir R (2023) Hydrochemical evolution and groundwater quality assessment of the Tinejdad-Touroug quaternary aquifer, South-East Morocco. Front. Ecol. Evol. 11:1201748. doi: 10.3389/fevo.2023.1201748
Received: 07 April 2023; Accepted: 14 August 2023;
Published: 13 September 2023.
Edited by:
Gopal Krishan, National Institute of Hydrology (Roorkee), IndiaReviewed by:
Balamurugan Panneerselvam, Saveetha Medical College, IndiaCopyright © 2023 Ait Said, Mili, El Faleh, Mehdaoui, Mahboub, Hamid, Tlemcani and El Fakir. This is an open-access article distributed under the terms of the Creative Commons Attribution License (CC BY). The use, distribution or reproduction in other forums is permitted, provided the original author(s) and the copyright owner(s) are credited and that the original publication in this journal is cited, in accordance with accepted academic practice. No use, distribution or reproduction is permitted which does not comply with these terms.
*Correspondence: Brahim Ait Said, c2FpZGJyYWhpbS5haXRAZWR1LnVtaS5hYy5tYQ==
†ORCID: Brahim Ait Said, orcid.org/0000-0001-6985-0271
Disclaimer: All claims expressed in this article are solely those of the authors and do not necessarily represent those of their affiliated organizations, or those of the publisher, the editors and the reviewers. Any product that may be evaluated in this article or claim that may be made by its manufacturer is not guaranteed or endorsed by the publisher.
Research integrity at Frontiers
Learn more about the work of our research integrity team to safeguard the quality of each article we publish.