 Gajaba Ellepola
 Madhava Meegaskumbura
- 1College of Forestry, Guangxi Key Lab of Forest Ecology and Conservation, Guangxi University, Nanning, China
- 2Department of Zoology, Faculty of Science, University of Peradeniya, Peradeniya, Sri Lanka
A central focus of evolutionary biology is to understand species diversity by studying how they arrived at their current geographic distributions. The biogeography of the Old World tree frogs in the family Rhacophoridae has been extensively studied suggesting an early Paleogene origin in Asia (out of Asia hypothesis) with alternative hypotheses in play. However, these alternative hypotheses especially considering adjacency of biogeographical regions and plate tectonics have not been tested empirically. Here using a comprehensive time calibrated phylogeny and constrained dispersal multipliers we studied the biogeographical history and diversification of Rhacophoridae, distributed in five biogeographical regions. Five hypotheses suggesting different centers of origin, and additional hypotheses considering adjacency and plate tectonics were tested to delineate the biogeographical history of Rhacophoridae. In addition, various diversification models that accounted for factors such as lineage isolation time, diversity-dependence, paleotemperatures, speciation and extinction rates were also used to test patterns of diversification. Results confirmed an East/Southeast Asian center of origin (out of Asia), with dispersal likely mediated by plate tectonics and adjacency of biogeographical regions, which could be linked to periodic sea level fluctuations and climate changes. The best-fitting diversification models explained diversification through lineage isolation time and paleotemperature regimes, while diversity-dependent models had low support. Speciation was linearly dependent on time and paleotemperatures, while extinction rates were exponentially dependent on time and linearly dependent on paleotemperature. Our findings demonstrate that variable extinction rates contribute towards maintaining a constant diversification rate for rhacophorids. We discuss that episodic major extinction events on the Indian Plate may have played a major role in shaping the early evolution of Rhacophoridae thus favoring an Out of Asia hypothesis in the empirical models. However, current biogeographic models may not be sufficient to explain the origin of Rhacophoridae, as multiple factors are likely at play.
1 Introduction
The long-standing question of where lineages originated and how they arrived at their current distributions remains a point of inquiry in evolutionary biology. Despite several studies, the biogeography of Old World tree frogs of the family Rhacophoridae remains unresolved (Bossuyt and Milinkovitch, 2001; Li et al., 2013; Feng et al., 2017; Pan et al., 2017; Yuan et al., 2018; Chen et al., 2020).
The Rhacophorid tree frogs are a breathtakingly diverse group, making up a remarkable 6% of the world’s anuran diversity (Amphibiaweb, 2022; Frost, 2022). They are distributed across a large, climatically variable geographic area, mainly in Asia with a single clade in Africa (Amphibiaweb, 2022; Ellepola et al., 2022; Frost, 2022). These distinct biogeographic regions include continental mainland (East/Southeast Asia, peninsular India, and Africa), continental islands (Japan, Taiwan, Hong Kong, Hainan, Sri Lanka, and Andaman Islands), archipelagos (Sundaland and the Philippines), and montane regions (Himalaya). The origin of rhacophorids can putatively be traced back to the northeastern region of the subtropical-temperate Asian mainland and islands, where they evolved between 53 to 68 million years ago (Li et al., 2013; Chen et al., 2020).
The Rhacophoridae and Mantellidae, the sister frog groups diverged from each other around 53–68 million years ago (Mya) (Vences and Glaw, 2001; Meegaskumbura et al., 2015; Yuan et al., 2018). While Mantellidae are endemic to Madagascar, Rhacophoridae are predominantly Asian, with one nested clade in Africa. Plate-tectonic history suggest that during the time of rhacophorid-mantellid divergence (~53–68 Mya), the Indian/Madagascan plate had separated from the African plate (~88 Mya) and was moving northwards (Bocxlaer et al., 2006; Bossuyt et al., 2006; Li et al., 2013). Later, the Madagascan and Indian plate separated (~53–68 Mya), giving rise to Mantellidae and Rhacophoridae. This suggests that early ancestors of Rhacophoridae may have evolved on the Indian plate while it was still moving north (Out of India).
However, dispersal models and lineage analyses suggest that Rhacophoridae evolved in East/Southeast Asia (Li et al., 2013; Yuan et al., 2018; Chen et al., 2020; Ellepola et al., 2022) and spread to other biogeographic regions (Out of Asia). Previous biogeographic analyses on Rhacophoridae have relied on methods such as Lagrange analysis, S-DIVA analysis or unconstrained biogeographic models (DEC, DIVALIKE, BAYAREALIKE) provided by the BioGeoBEARS package (Bossuyt and Milinkovitch, 2001; Li et al., 2013; Feng et al., 2017; Pan et al., 2017; Yuan et al., 2018; Chen et al., 2020). While these studies have explored the concept of an East/Southeast Asian origin center and proposed the influences of plate tectonics and climate on Rhacophoridae diversification, the “Out of Asia” hypothesis remains contested. Alternative theories, such as the “Out of India” hypothesis, require testing. However, to test these alternative hypotheses, biogeographical models incorporating plate tectonics and dispersal multipliers are needed. This is because the approximate 68 My of evolutionary history has been subjected to a large number of plate tectonic events. These include the rapid northward movement of the Indian plate, formation of the Himalayas as a new biogeographic region, glacial and interglacial periods which led to sea level fluctuations resulting in the emergence and submergence of biogeographical regions and formation of islands (Hall, 2012; Vijayakumar et al., 2016; Meegaskumbura et al., 2019; Ellepola et al., 2022). A biogeographic analysis that integrates adjacency of biogeographical regions and plate tectonics could offer a robust conclusion regarding the potential region of origin for Rhacophoridae. In addition, using a complete species level phylogeny (previous biogeographical studies have used 114 (Li et al., 2013), 57 (Pan et al., 2017), 18 (Yuan et al., 2018) and 66 (Chen et al., 2020) species and phylogenetic studies have used 108 (Pyron and Wiens, 2011) and 247 (Chan et al., 2018) species) could enhance the accuracy and substantiation of evolutionary relationships, thereby enabling a more accurate reconstruction of biogeographical history (Purvis et al., 2011).
Furthermore, understanding the patterns of diversification can offer insights on how diversification of species-rich families have shaped through time. Previous studies show that the net diversification rate of Rhacophoridae, a clade of species exhibiting high richness, has remained constant throughout its history despite the filling up of vacant ecological niches (Ellepola et al., 2022). This phenomenon is counterintuitive, since mathematical models usually predict a slowdown in diversification rates as available niche space becomes increasingly filled (Gavrilets and Vose, 2005; Gavrilets and Losos, 2009). Furthermore, species diversifications that are typically rich in species exhibit fast initial diversification rates (early burst pattern) followed by slower rates of species-turnover (Simpson George Gaylord, 1953; Erwin, 1994; Losos and Miles, 2002). Hence, this persistent, yet intriguing, evolutionary pattern begs the question of what may have caused the constant diversification rates of Rhacophoridae.
Beginning from a center of origin, rhacophorids spread to far-reaching refugia in various biogeographical areas by adjusting to novel climatic conditions, especially in the wake of the emergence of fundamental evolutionary advances such as terrestrial breeding (in the Late Eocene) or through dispersal during times of advantageous climates (Ellepola et al., 2022). This shows that paleo-climates had a significant impact on their diversification. Despite the fact that it has been suggested that the Asian monsoons, which formed with the beginning of the Himalayan-Tibetan orogeny, affected their diversification (Li et al., 2013; Vijayakumar et al., 2016; Meegaskumbura et al., 2019; Chen et al., 2020; Ellepola et al., 2021), this idea had not been empirically demonstrated. Here, using a complete time calibrated phylogeny we investigate the biogeographical origin and evolutionary history of Rhacophoridae. We test five biogeographical hypotheses suggesting different centers of origin, and additional hypotheses considering adjacency and plate tectonics in a model-based approach to identify their likely center of origin and to reconstruct the biogeographical history. We then examine the modes of dispersal, correlating them to plate tectonic events that occurred during their evolution. Additionally, we try to explain the patterns of diversification and assess if other factors, such as isolation time and diversity-dependence significantly influenced their diversification, by fitting different diversification models. We empirically show that paleotemperatures have influenced the diversification pattern and non-constant extinction rates may have impacted the rate homogeneity of the rhacophorid phylogeny. We predict that historical extinctions contributed towards shaping the diversification in various biogeographical regions, potentially rendering the center of origin identified by biogeographical models inconclusive. This study will provide new insights into long-standing questions pertaining to the biogeography and evolution of Old World tree frogs.
2 Materials and methods
2.1 Taxon sampling, phylogenetic inference and divergence time estimation
First, we constructed a comprehensive, time-calibrated phylogeny of Rhacophoridae, which included 415 species representing all 22 genera, plus four outgroup taxa (Laliostoma labrosum, Tsingymantis antitra, Boophis goudotii, Spinomantis fimbriatus; representing the sister group Mantellidae from Africa). As the genetic data available for different rhacophorid lineages are uneven (some species having whole-genome sequences, many having Sanger sequencing data targeted on different loci and, others with no genetic data but described as a means of morphological evaluation), constructing a comprehensive phylogeny included with many taxa remained a challenging task. To overcome this, following Thomas et al. (2013) we took three main steps to derive a complete species-level phylogeny: (i) establishing a phylogenomic backbone, (ii) compiling Sanger sequence data of non-chimeric sequences, and (iii) adding species without genetic data using phylogenetic imputation.
A stable backbone tree based on Anchored Hybrid Enrichment data (Supplementary Table 1) was obtained from Chen et al. (2020), All Sanger sequence data for seven gene fragments on Rhacophoridae (mitochondrial loci 16S, 12S and cyt-b; and nuclear loci BDNF, Rag-1, rhod and Tyr) were obtained from GenBank (Supplementary Table 1) and were aligned separately using MUSCLE (Edgar, 2004) as implemented in MEGA v.6 (Tamura et al., 2013). Sequences of all fragments were then concatenated, with a total alignment length of 3923 base pairs (bp). The best partitioning scheme for the Sanger dataset was determined using PartitionFinder2 (Lanfear et al., 2016). Species without genetic data (17.8%) were soft constrained to their closest relatives based on morphology as indicated in published literature (Supplementary Table 2). MrBayes blocks included with all these data were generated using PASTIS version 0.1-2 (Thomas et al., 2013), with functions from the APE 5.4 (Paradis et al., 2004) and CAPER 0.2 (Orme et al., 2018) packages in R. The general time-reversible model with an invariable gamma rate for each partition, birth-death as prior probability distribution on branch lengths, fixed extinction-rate priors and exponential net speciation-rate priors were assigned to the alignment and constraints, and was run on MrBayes 3.2.5 for 20 million generations to obtain the posterior distribution of trees (the output contains ultrametric trees indicating only relative time). Convergence was assessed by inspecting the log-output file in TRACER v.1.6 (Drummond et al., 2012) and by ensuring ESS values were greater than 200. The first 10% of the trees were discarded, and the post burn-in trees were used to infer the maximum clade credibility tree using TREEANNOTATOR v.1.10.4 (Rambaut and Drummond, 2013). The maximum clade credibility tree (Supplementary Data 1), as well as a set of 1000 post burn-in topologies, was retained for further analyses (Supplementary Data 2).
To examine the temporal context of divergence, we used the lognormal relaxed clock model with default clock rate priors in our data set which showed the greatest fit. We time-calibrated the tree with two literature-based, molecular-estimated secondary calibration points from Meegaskumbura et al. (2019) and Chen et al. (2020): the age of the MRCA (most recent common ancestor) of extant Pseudophilautus (21.93–45.14 mya) and the age of the MRCA of clade involving Kurixalus, Philautus, Pseudophilautus and Raorchestes (31.65–40.53 mya). To infer the uncertainties in time calibration, we selected 1000 post-burn-in trees from the posterior sampling of the MrBayes 3.2.5 (Ronquist et al., 2012) analysis and visualized them in Densitree v.2.2.7 (Bouckaert, 2010). We then correlated the temporal context of divergence with geological and climatic events.
2.2 Ancestral state reconstruction
To infer the biogeographical history of the rhacophorids and to evaluate how range shifts among regions influenced its diversification, we used ancestral range reconstruction analyses based on a model testing approach as implemented in BioGeoBEARS v.1.1.2 (Matzke, 2013). Species ranges were categorized according to the biogeographic areas from Chen et al. (2020): (1) Africa; (2) peninsular India; (3) East/Southeast Asia; (4) Sundaland; and (5) Himalaya. Maximum range-size was set to 3, as no extant species of rhacophorid occur in more than three biogeographical regions.
Initially ancestral state reconstructions by Chen et al. (2020) were re-visited using the phylogeny of Rhacophoridae. Current analysis particularly increased the accuracy of the results of previous reconstructions due to more complete taxon sampling (Zwickl and Hillis, 2002). Dispersal constraints were not applied on this analysis following Chen et al. (2020). The analyses used six models (Matzke, 2013): Dispersal-Extinction Cladogenesis (DEC; Ree and Smith, 2008); ML version of Dispersal Vicariance Analysis (DIVALIKE; Ronquist, 1997); Bayesian biogeographical inference model (BAYAREALIKE; Landis et al., 2013); and an additional parameter (+J) for each of the three models. The additional parameter simulated the process of founder-event speciation, which could be associated with long distance dispersal and subsequent divergence of colonizing lineages (Matzke, 2013). These models differed in how they considered dispersal, vicariance, and extinction events during cladogenesis, and therefore, they allowed the exploration of distinct biogeographic scenarios. Model fit was assessed using the Akaike Information Criterion (AIC) and Akaike weights (Matzke, 2013) which suggested that DEC model and the DEC+J models performed well with the data.
To accomplish the objective of finding the most suitable model to explain the likely region of origin of Rhacophoridae, we conducted a separate BioGeoBEARS analysis. To reconstruct ancestral ranges, we used the maximum likelihood Dispersal–Extinction–Cladogenesis (DEC) model without the +J parameter (Ree and Smith, 2008) as it performed well with the initial unconstrained analysis. As the null model (M0), initially an unconstrained analysis was performed as above with allowing equal probability of dispersal among all areas regardless of distance and adjacency between the areas. This was used as our null model (M0) to compare five additional biogeographical scenarios by varying the dispersal rate matrix (Figure 1). Next, we fitted models M1, M2, M3, M4 and M5, to test the “center of origin” scenario for Rhacophoridae. For those (from model M1–M5), we fixed the state of the most ancestral node to be either state I (Peninsular India), E (East/Southeast Asia, A (Africa), S (Sundaland) or H (Himalaya) respectively. For models M1 to M5, a dispersal matrix was set, in which dispersal from the area of origin (Peninsular India, East/Southeast Asia, Africa, Sundaland or Himalaya) to a different area was modeled as ten times more likely than between any other areas (Vasconcellos et al., 2021). In model M6, the dispersal matrix was constrained using a model reflecting distance among areas. The pairwise distance between areas was modeled in increments of 1, 2, 3 or 4 steps, with dispersal probability decreased by half at each step increment after the first step. Under M6, moving across adjacent areas required only one step, with an additional step across non-adjacent further areas (Supplementary Table 3). Ancestral ranges were also not allowed to include in non-neighboring regions.
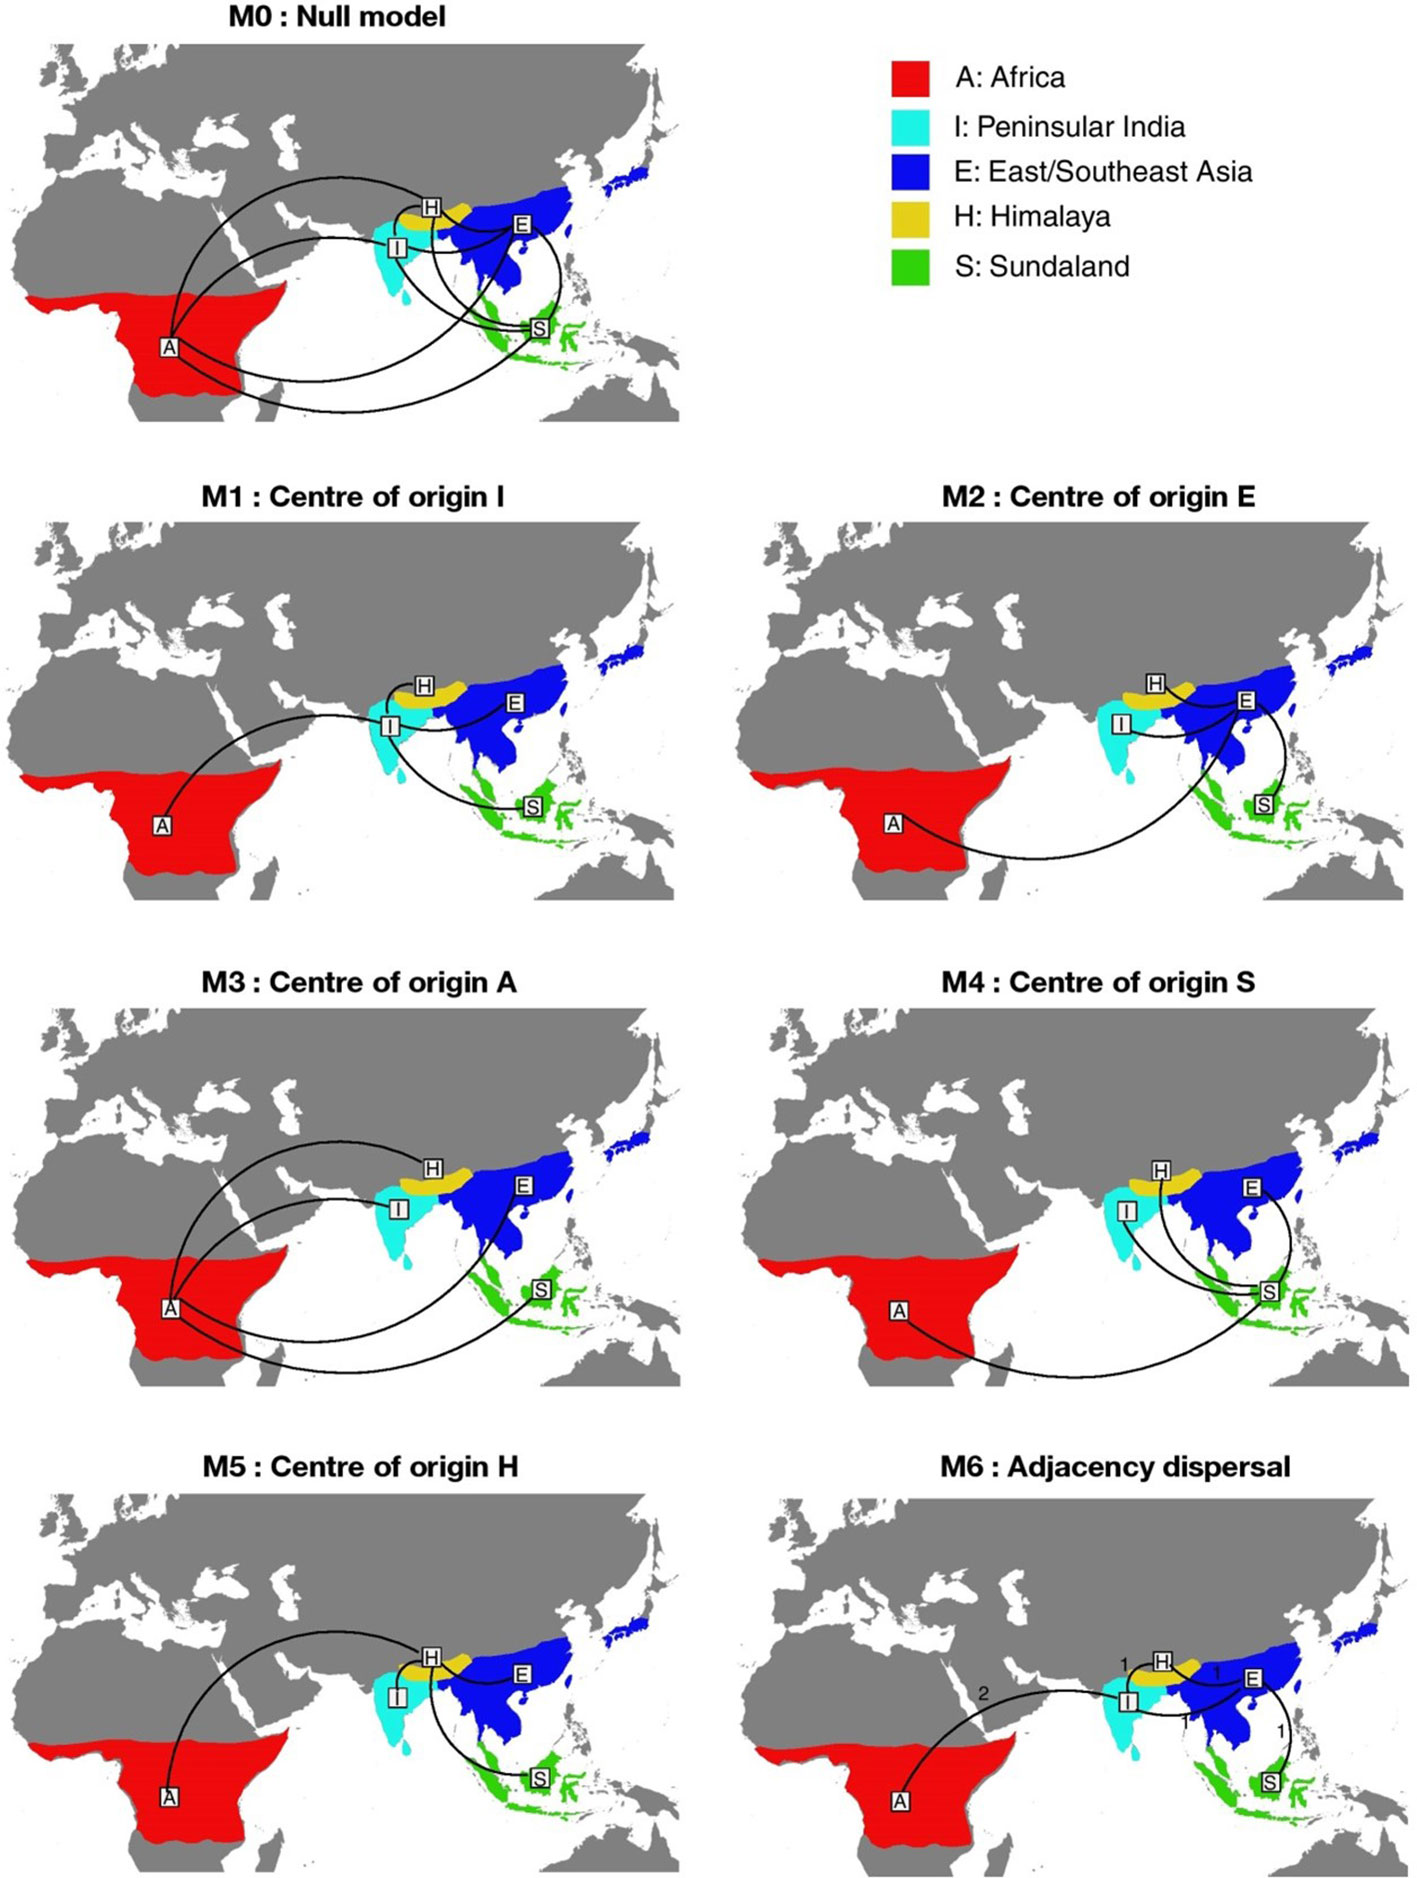
Figure 1 The seven biogeographical models tested in BioGeoBEARS depicting the entire range occupied by rhacophorids and their main connections. M0 represents the dispersal null model. M1, M2, M3, M4 and M5 represent the center of diversification model in India (I), East/Southeast Asia (E), Africa (A), Sundaland (S) and Himalaya (H), respectively. M6 represent a dispersal model with higher probability of dispersal, between adjacent areas (M6). The numbers on M6 represent the number of dispersal steps across areas.
An additional DEC based time stratified model was introduced, which reflected the plate tectonic events that took place within 67 Mys of earth’s history, thus reflecting the differences in probability of dispersal between geographical areas at different points in time. We used the physical distance between the closest points of the main landmasses of each pair of geographical areas as a proxy for dispersal probabilities (Turk et al., 2020). We measured the distances every 10 million years from 70 to 0 My using GPlates plate tectonics visualization software (Müller et al., 2018) and transformed the measured distances to dispersal probabilities with low values reflecting large physical distances and vice versa. For a zero kilometer distance between areas (i.e. if areas are in physical contact), we set the highest dispersal probability to 95%, because dispersal is very likely, but not necessary. Moreover, the dispersal probability was set as low as 5% with increased distance (Supplementary Table 4). All models were evaluated with AICc, which corrects for small sample sizes. The best-fit models were selected based on lower AICc values with larger weight (wAICc), representing the relative support for each model (Burnham and Anderson, 2002).
Biogeographical Stochastic Mapping (BSM; Dupin et al., 2017) was also used to estimate the uncertainty in ancestral range reconstructions and to quantify range shift events in the evolution of this treefrog group (Supplementary Figure 1). Given a biogeographical model with specified parameters, BSM simulates possible histories (“realizations”) of range shifts, including times and locations of anagenetic and cladogenetic events at the nodes and along the branches. Using the phylogeny, these simulations can be constrained to produce the observed data. Averaging over many realizations yields the same ancestral state probabilities as those calculated under ML (Vasconcellos et al., 2021; Matzke, 2013). Using BSM, one can calculate the mean and standard deviation of different range shift events (e.g., vicariance, dispersal, in situ speciation), which is more useful to understand historical patterns than relying on a single reconstruction. Event frequencies were estimated from 100 BSMs. The stochastic maps and statistics are conditioned on the data, the phylogeny, the model used with its inferred parameters, and the assumption of a Yule process (no extinction) (Dupin et al., 2017). The software package RASP (Reconstruct Ancestral State in Phylogenies; Yu et al., 2015) version 4.0 beta, which implements the R package BioGeoBEARS (Matzke, 2013) were also used to summarize the results of the biogeographic models.
2.3 Diversification rate models
We tested several diversification models using the constructed phylogeny of Rhacophoridae. As their diversification rate remains more or less constant throughout their evolutionary history (Ellepola et al., 2022, Supplementary Figure 2), first we tested if this assumption of rate homogeneity holds true or different modes of speciation exists in the phylogeny by using the spectral density method implemented in RPANDA 1.6 (Morlon et al., 2016). Since the results indicated a single main peak suggesting one modality of diversification (eigen gap located between 4th and 5th eigen values; Supplementary Figure 3) we compared the fit of constant-rate diversification models (Yule pure birth and constant birth-death) and then with variable-rate models including exponential and linear time dependent speciation (λ) and/or extinction (µ) on the rhacophorid phylogeny using RPANDA 1.6 (Morlon et al., 2016). Since the linear time-dependent speciation with exponential extinction model performed better than other models in this preliminary set (see Results), we assessed whether diversity-dependent speciation (either exponential [ddX] or linear [ddL]) or paleotemperature-dependent speciation models (either exponential [tempX] or linear [tempL]) could fit the data better. Diversity-dependent models with variable extinction were implemented using the DDD R package v.4.1 (Etienne et al., 2011). Paleotemperature-dependent models with variable extinction were implemented in RPANDA using the “InfTemp” dataset, a proxy for global temperatures inferred from oxygen isotope ratios taken from Zachos (2001). In all analyses, we set the current species richness in the group to be 451 (Frost, 2022) to account for the unsampled and extinct species (Meegaskumbura et al., 2007) in this family. All diversification models were evaluated using AICc.
To further evaluate the model results which supported variable extinction rates, we investigated the occurrence and timing of major extinction events and tree-wide diversification rate changes through time with the CoMET model within the R package TESS 2.1.0 (Höhna, 2013; May et al., 2016). This method implements a piecewise-constant speciation and extinction rate model with the number of rate shifts through time that is inferred through rjMCMC. We set the function ‘tess.analysis’ to account for empirical estimates of the hyperpriors of diversification-rates parameters by setting ‘empiricalHyperPriors = TRUE. We ran the rjMCMC for 50 million steps of which the initial 14.5% was discarded as burn-in. We considered a minimum ESS of 200 to ensure convergence of the chains. The occurrence of mass extinction events and shifts in speciation and extinction rates was evaluated through Bayes Factor. A similar analysis was carried out for three biogeographical regions (Peninsular India, East/Southeast Asia and Sundaland), the potential regions of origin for Rhacophoridae to investigate for any signs of major historical extinction events in those regions. For this purpose the phylogeny was pruned into taxa occupying each region, the numbers of expected mass extinctions events, number of expected rate changes, sampling fraction and expected survival probability were set to 3, 3, 0.9 and 0.1, respectively. Here we assumed that at least a total of three plate tectonic and climate driven extinction events took place during the evolution in each biogeographical region, and the rates of diversification increased three times after each extinction event due to ecological opportunity, 90% of the species present in the region were represented in our pruned phylogeny and that about 90% of species diversity was lost during a major mass-extinction event. However, as the package indicates the prior expectation of the number of events does not impact the conclusions as Bayes factors cancel out the prior assumptions. Therefore, the specific prior choices only tweak the performance of the method but does not result in qualitatively different conclusions (Höhna, 2013).
3 Results
The comprehensive phylogeny of Rhacophoridae included with 421 taxa had high support at most major nodes, and genus-level constraints were well resolved for the tips, increasing the accuracy of biogeographic reconstructions. Uncertainties were evident at localized tips, but did not affect the current study, which aimed to reconstruct the biogeographic history of major clades. In the phylogeny, Buergeria, Liuixalus, Theloderma and Nyctixalus constitute early diverging lineages, while the remaining genera diverged into two major clades: one clade including the genera—Beddomixalus, Gracixalus, Kurixalus, Mercurana, Nasutixalus, Philautus, Pseudophilautus and Raorchestes; and the other including —Chirixalus, Chiromantis, Feihyla, Ghatixalus, Leptomantis, Polypedates, Rhacophorus, Rohanixalus, Taruga and Zhangixalus. The clade involving Kurixalus, Philautus, Pseudophilautus and Raorchestes is mainly distributed in East Asia, Southeast Asia, Sundaland and the Indian subcontinent, whereas the latter clade mainly found in East Asia, Southeast Asia, Sundaland and Africa (Supplementary Figure 2).
The temporal distribution of Rhacophoridae as revealed by the phylogeny suggests that their MRCA originated around 57.5 Mya (95% HPD 41.8–76.0 Mya). Species accumulation in India and Sundaland resumed at later periods, around 29–57 Mya (mean 36.4 Mya, 95% HPD 30.6–56.4 Mya for India; mean 43.1 Mya, 95% HPD 32.1–56.9 Mya for Sundaland). Species accumulation in Africa and Himalaya seems to have occurred at later stages of evolution (mean 25.9 Mya, 95% HPD 20.0–36.8 Mya for Chiromantis in Africa; mean 16.2; 95% HPD 10.2–24.9 My for Nasutixalus in Himalaya). The dispersal of Rhacophoridae to India and Sundaland coincide with the Middle Eocene Climatic Optimum (MECO) global warming event (around 40 Mya) and the Eocene–Oligocene Transition (EOT, between 30–35 Mya). The dispersal to Africa appears to have coincided with the formation of ephemeral ice sheaths during the Oligocene (around 30 Mya), which may have been a favorable period for dispersal between adjacent biogeographical regions (Figure 2).
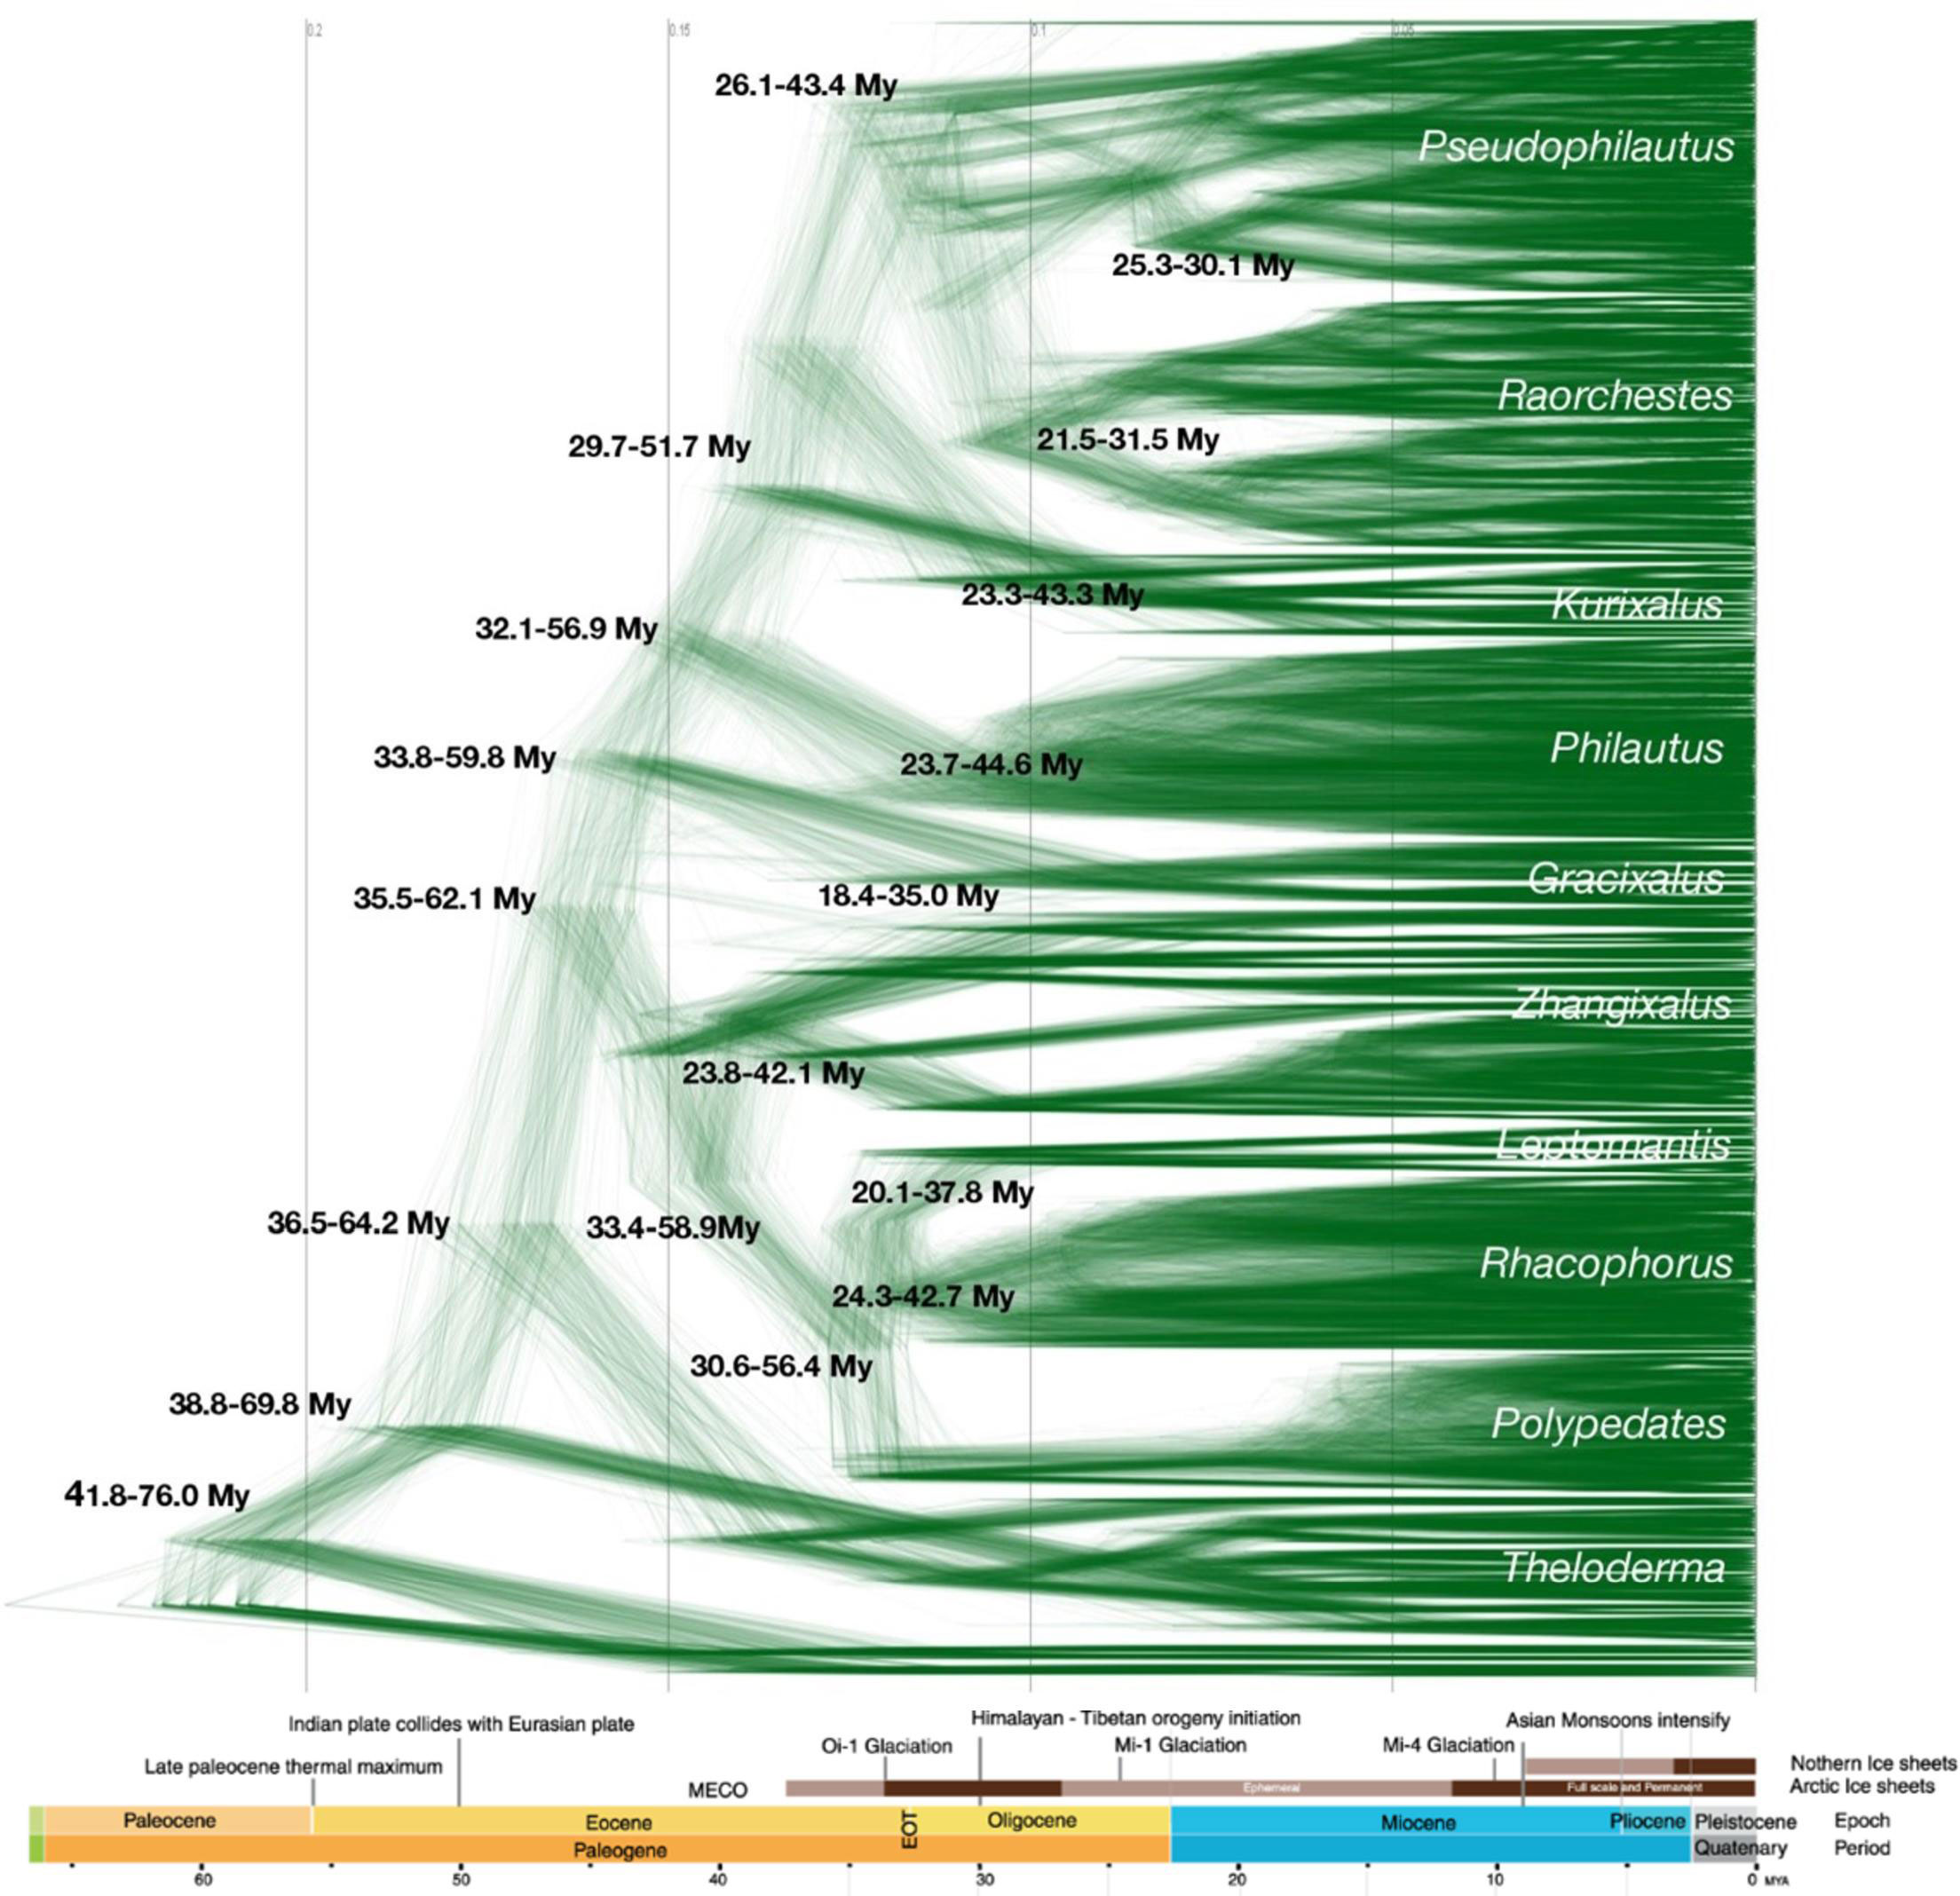
Figure 2 Time-calibrated density-tree of Rhacophoridae based on 1000 posterior trees from MrBayes. Estimated 95% HPD times of major clades are shown at nodes. The MRCA of Rhacophoridae likely evolved 57.5 Mya (95% HPD 41.8–76.0 Mya) and dispersal to India and Sundaland coincide with Middle Eocene Climatic Optimum (MECO) and Eocene–Oligocene Transition (EOT). The dispersal to Africa and Himalaya coincides with the Oligocene and early Miocene respectively.
In the unconstrained BioGeoBEARS analysis, the “+J” parameter significantly improved the fit of the three models. This suggests that founder-event speciation likely played a role in the development of the biogeographical pattern in Rhacophoridae. The model with the best fit was the DEC + J model (log Likelihood = −443.58, AIC weight = 1.00), in which multiple vicariance and dispersal events largely explain the distribution patterns. The DEC model (which excludes the “+J” parameter) yielded similar results. Overall, these results are comparable to those of Li et al. (2013) and Chen et al. (2020), despite the use of a more comprehensive phylogeny. As the “+J” parameter has been debated (Ree and Sanmartín, 2018), a dispersal model excluding it was used to test the centre of origin diversification hypothesis.
Results of the constrained biogeographical model analyses suggest that East/Southeast Asia is the most likely region of origin for Rhacophoridae (M2; log Likelihood = −436.51, wtAICc = 0.6554; Table 1). This hypothesis is further supported by numerous range shift events that were recovered during the evolution of these tree frogs. Other models (M1, M3, M4 and M5) for the center of origin diversification hypothesis in this group performed very poorly (wAICc = 0.00) and worse than the null model further confirming that East/Southeast Asia could be the likely region of origin for this group (Out of Asia). Furthermore, the time stratified biogeographical analysis also supported an East/Southesat Asian origin for Rhacophoridae. The time stratified model revealed a loglikelihood of −437.21 and an AICc weight of 0.3320, which is the second best model in the analysis (Table 1; Supplementary Figure 4). The spatial configuration and adjacency of biogeographical regions also had a great influence on their current distribution as well (M6, the 3rd Best model with similar range shift events to that of M2 and the time stratified analysis).Interestingly, the node separating Rhacophoridae from the sister group Mantellidae was recovered as a jump dispersal event between Asia and Africa in all these models. However, as M2 provide the best support for the data and other models are congruent with most of its range shift events, we evaluated range shifts in Rhacophoridae mainly under the M2 model (Figure 3). The M2 model summarizes 7731 dispersal events, 753 vicariance events and 93 extinction events (Supplementary Figure 5).
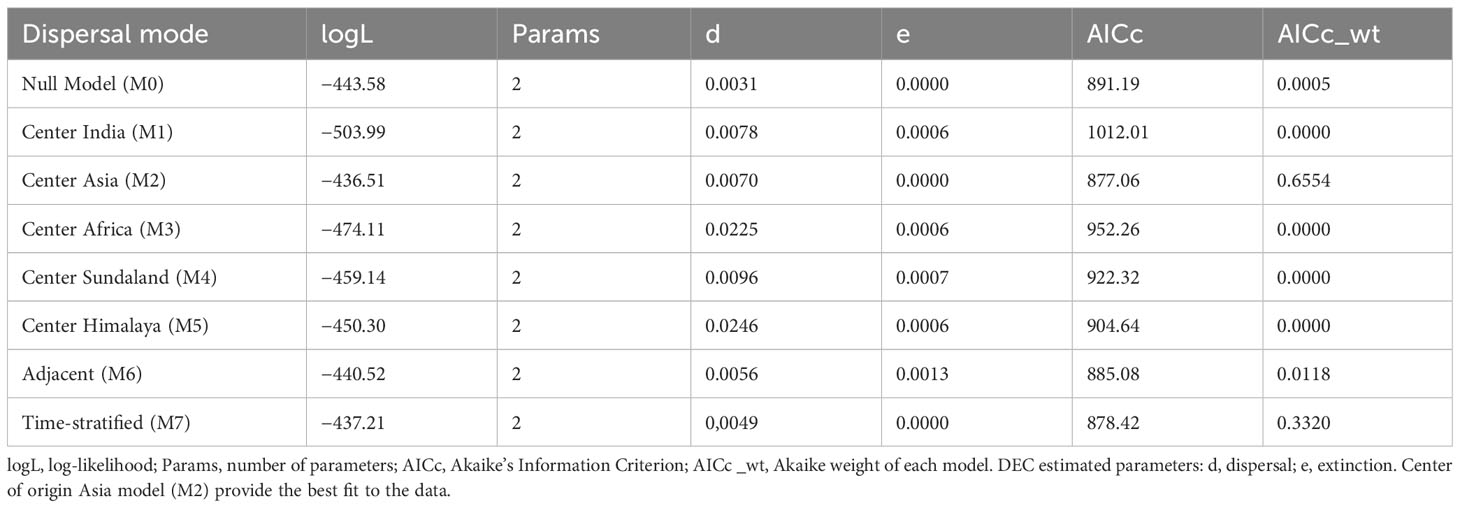
Table 1 Fit of biogeographical models estimated under the DEC (Dispersal–Extinction–Cladogenesis) model.
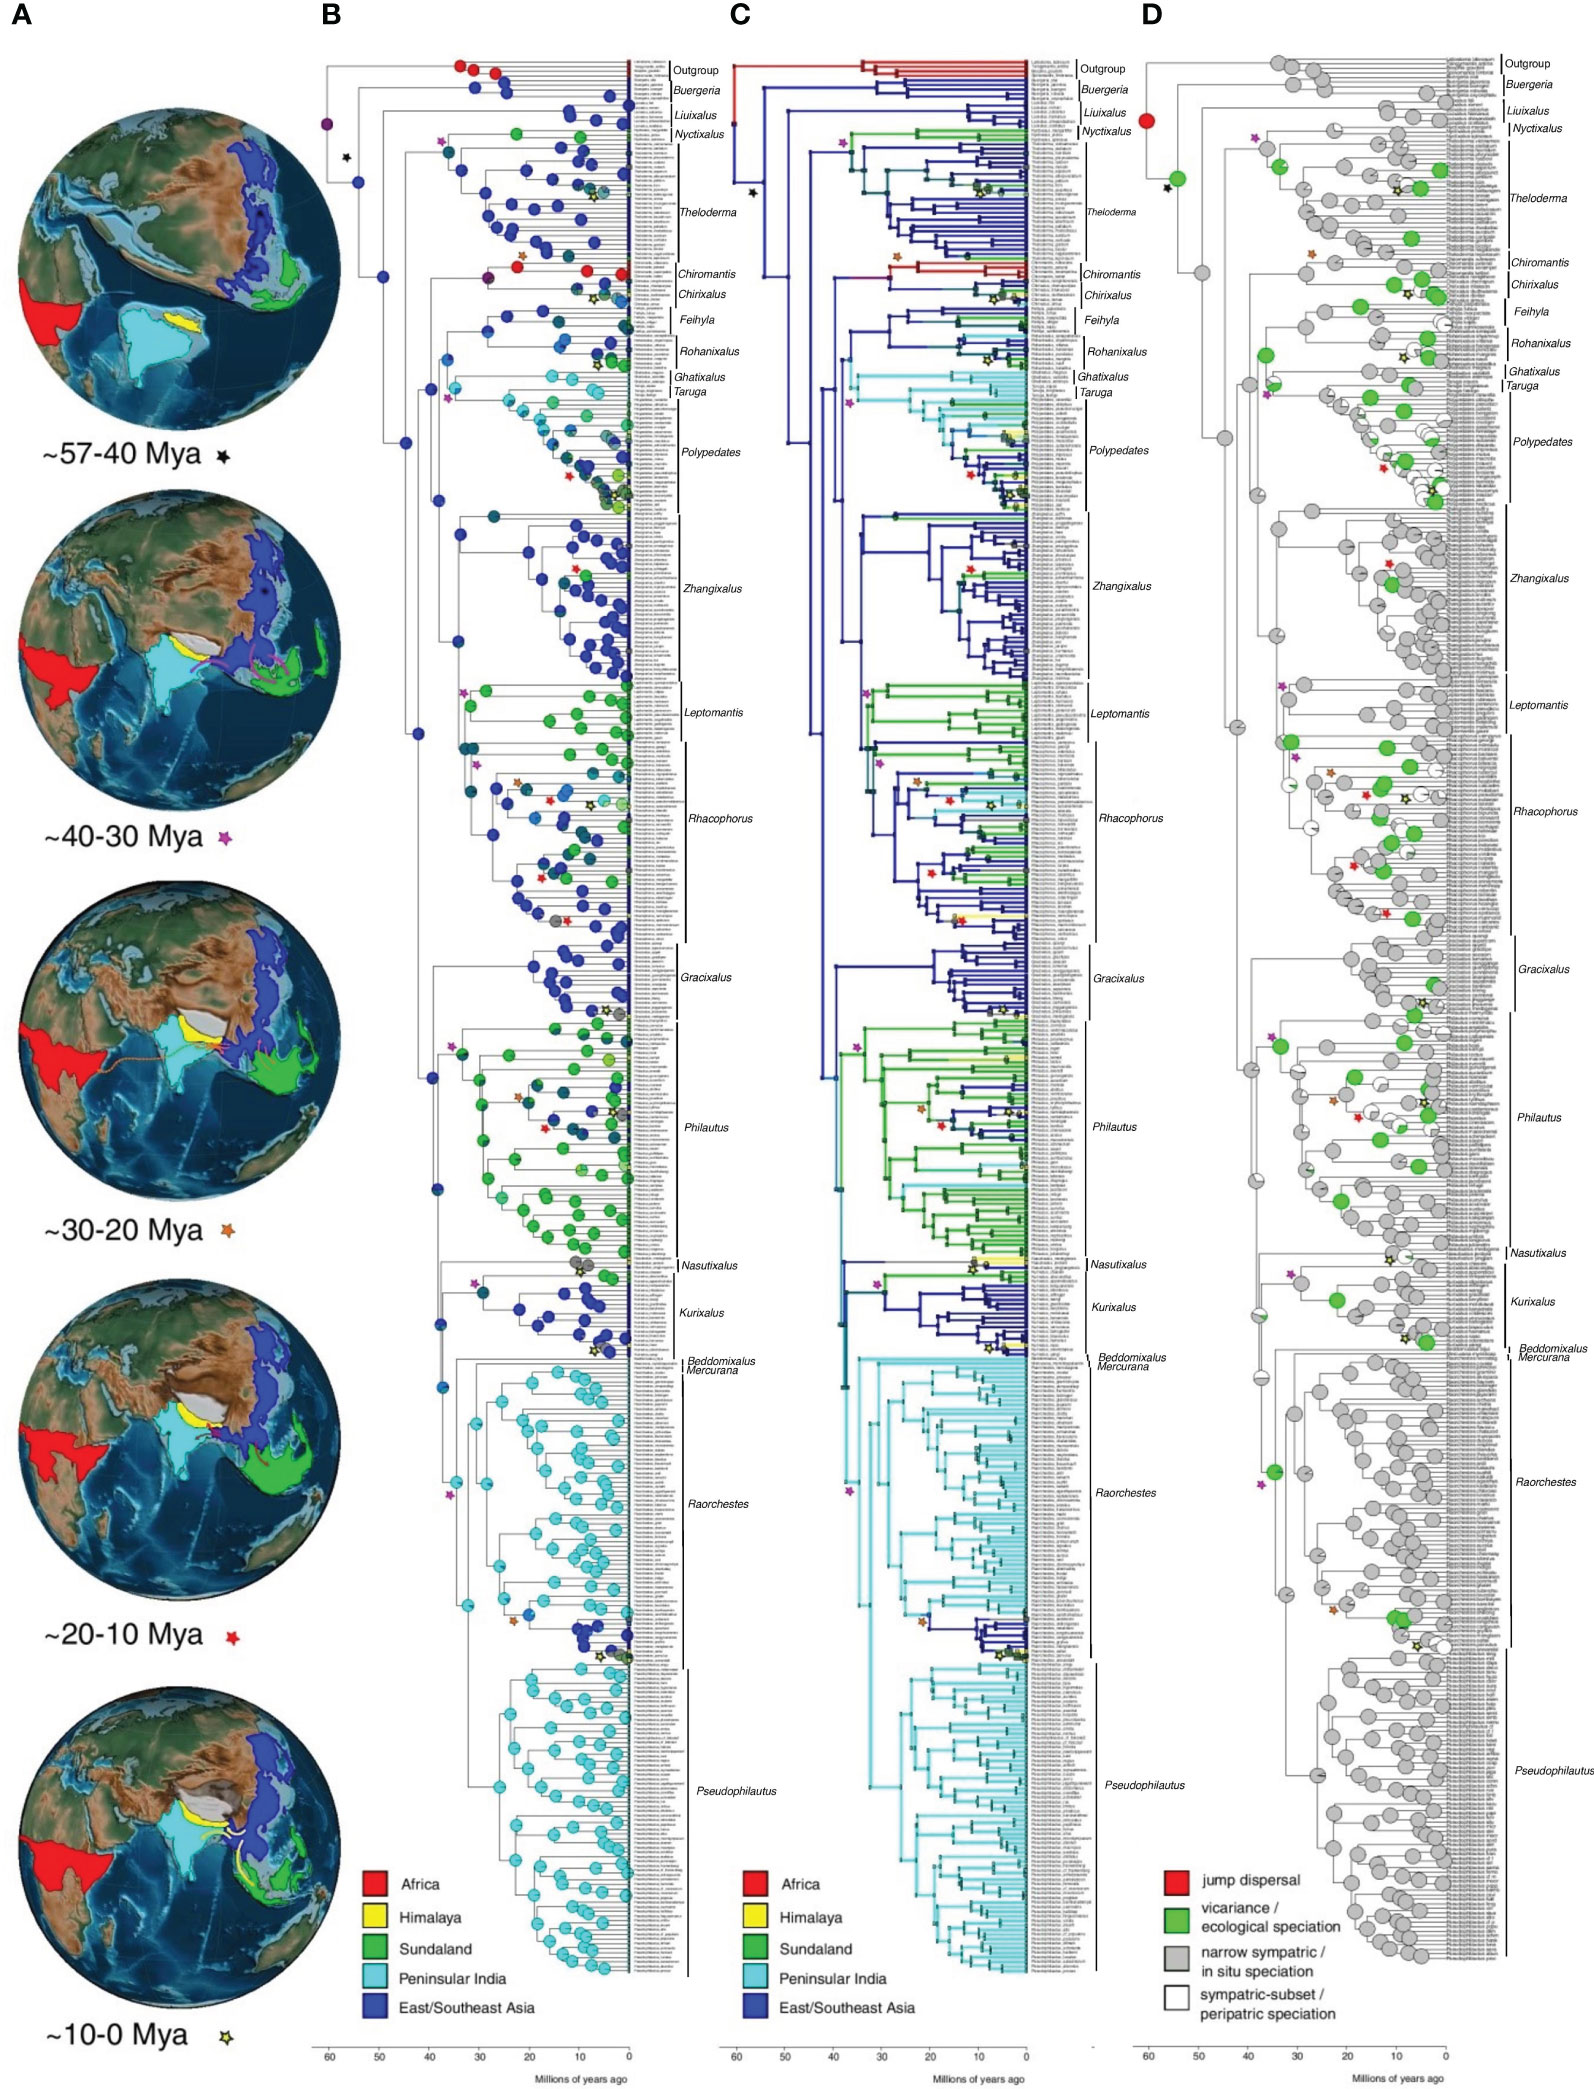
Figure 3 Ancestral range reconstructions of Rhacophoridae. (A) The plate tectonic evolution of the continents and ocean basins during the evolution of Rhacophoridae. Each map is a representation of the likely positions of continents during a particular geological time period. The likely dispersal events and their directions during a particular geological time period are depicted on each map. Color codes of the arrows and stars correspond to particular time periods. (B) Ancestral range reconstructions showing the most likely ancestral range at each node under the favored dispersal model (M2: center of origin Asia) in BioGeoBEARS using DEC. Tips are labeled with present-day species distributions. Dispersal events during particular time periods are indicated using stars with different color codes. (C) Plot of a single Biogeographical Stochastic Map (BSM) for M2 model. (D) The likelihood of cladogenetic range shift events depicted as pie charts at each node using Biogeographical Stochastic Mapping. The outgroup species Boophis goudotii, Tsingymantis antitra, Laliostoma labrosum and Spinomantis fimbriatus representing the African sister Mantellids are also indicated on the phylogeny.
According to the model M2, M6 and the time stratified models, the MRCA of Rhacophoridae probably originated in East/Southeast Asia around 57.5 Mya (95% HPD 41.8–76.0 Mya; Figure 2) during late Paleogene or early Eocene (Figure 3). Rhacophorids seem to have been diversifying and dispersing within East/Southeast Asia subjected to in-situ speciation, peripatric speciation from the early Eocene to Middle Eocene Climatic Optimum (MECO) nearly for ~20–25 million years with periodic extinctions (Supplementary Table 5; Supplementary Figures 5, 6). Then between ~40–30 Mya they dispersed to India and Sundaland as the Indian plate collided against the Asian plate and Sundaland became interconnected to Asia, respectively. MRCA of Leptomantis and Philautus are the earliest species to disperse to Sundaland while MRCA of Raorchestes, Pseudophilautus, Mercurana and Beddomixalus are the earliest to disperse into peninsular India. Between ~30–20 Mya during the Oligocene, India-Asia and Sundaland-Asia remained interconnected hence, facilitating two-way movements between peninsular India-Asia and between Sundaland-Asia. Raorchestes and Rhacophorus species seems to have back migrated to Asia from India and Sundaland, respectively. The genus Chiromantis reached Africa during this period although there is no evidence of a land connection between Africa to other regions of rhacophorid distribution. This was also recovered as a jump dispersal event in the models. The Himalayan-Tibetan orogeny proceeded during this time creating an unsettling geological and climatic environment in the Himalayas, not allowing species to settle down in Himalaya. Between ~20–0 Mya species further dispersed into Sundaland and peninsular India. However, there is no evidence of species dispersing back into Asia during this period according to the model. Mid-Miocene period also marks the beginning of species dispersal into Himalaya. Overall, late Eocene and mid-Miocene seem to support speciation through vicariance according to the model (Supplementary Table 5; Supplementary Figure 6). A substantial amount of extinction events are also evident during the late Eocene to mid-Miocene according to the models (Supplementary Figure 5).
In the attempt to check for the number of modalities in the phylogeny, a single peak was observed from the spectral density method, suggesting absence of rate shifts in the diversification of Rhacophoridae (Supplementary Figure 3). This allowed us to test for diversification models, which assumed rate homogeneity. According to the diversification models, the diversification of Rhacophoridae was mainly shaped by its long evolutionary history, as well as global temperature variation. A time dependent diversification model with a linear speciation rate and an exponential extinction rate had higher support than the constant-rate models (birth-death or Yule models) (Table 2). Diversity dependent diversification models had very low support, whereas temperature dependent diversification model with a linear speciation and extinction rates had relatively high support. Therefore, it is evident that with time extinctions have increased exponentially (the probable extinction events on the calibrated phylogeny shown in Supplementary Figure 5 with increased extinction events towards the present), with extinctions following temperature as well. Our findings demonstrate that non-constant extinction rates contribute towards an overall constant diversification rate, thus playing a major role in shaping the rhacophorid diversification (Figure 4; Supplementary Figure 7).

Table 2 Diversification model selection based on AICc.
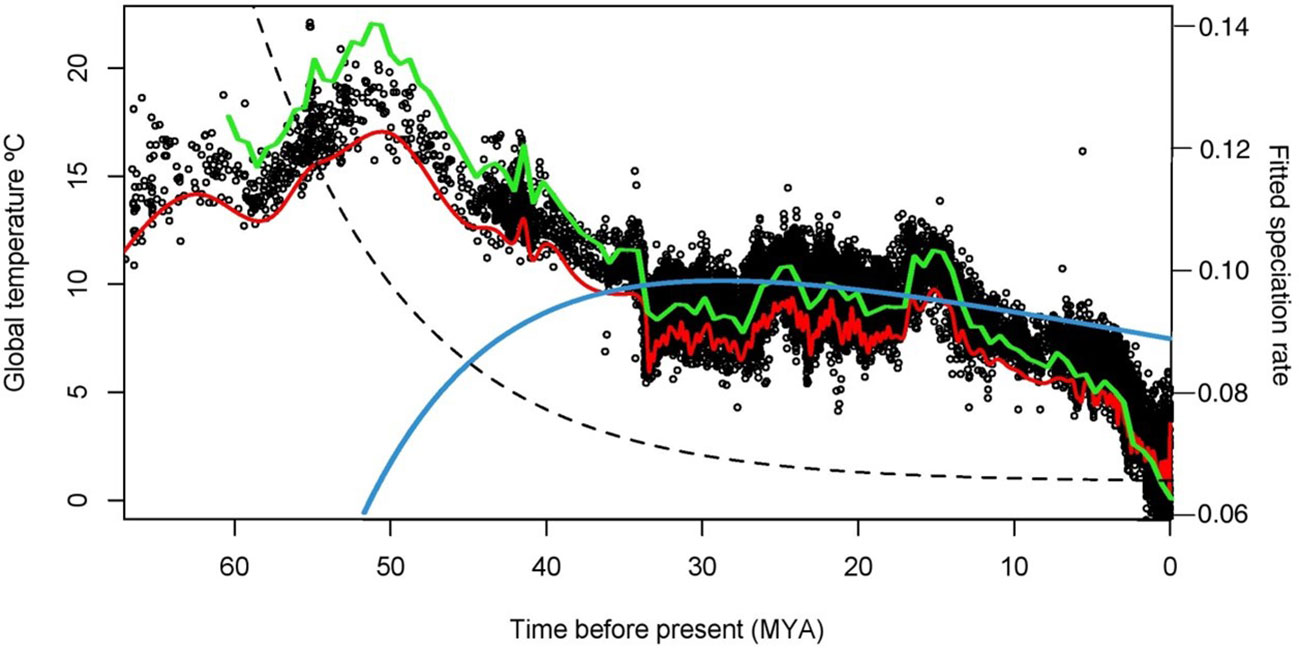
Figure 4 Plotted best fitted diversification models (time-dependent: λ_lin-µ_exp and temperature-dependent: lin_λ-temp-µ_lin) based on RPANDA. Net speciation rates estimated over time (green: temperature dependent diversification models, blue: time-dependent diversification model), extinction rates based on time dependent diversification model (dotted line) and global paleo-temperatures estimated over time (red) from Zachos (2001). Black dots in the background represent global paleotemperature data points. Primary “Y” axis depicts global paleo-temperature in (°C) and secondary “Y” axis depicts speciation/extinction rate.
We carried out the CoMET analysis (Figure 5) to further test for signs of such extinction events during the rhacophorid evolutionary history. However, we failed to record a significant major extinction event that may have influenced the pattern. But there were faint signs of potential extinction events. The CoMET analysis of the Rhacophoridae (Figure 5) provides evidence that there was potentially a non-significant extinction event around ~57–50 Mya in peninsular India which may explain why early ancestors of Rhacophoridae are not found there. In addition, the analysis shows that extinctions in other biogeographical regions were low, apart from in the Himalayas which shows signs of three major extinctions. Bootstrap values for speciation rates in India during the Miocene (~10–0 Mya) indicate a diversification bloom in that region. However, the overall speciation rates have only been slightly fluctuating for Rhacophoridae (Supplementary Figure 8).
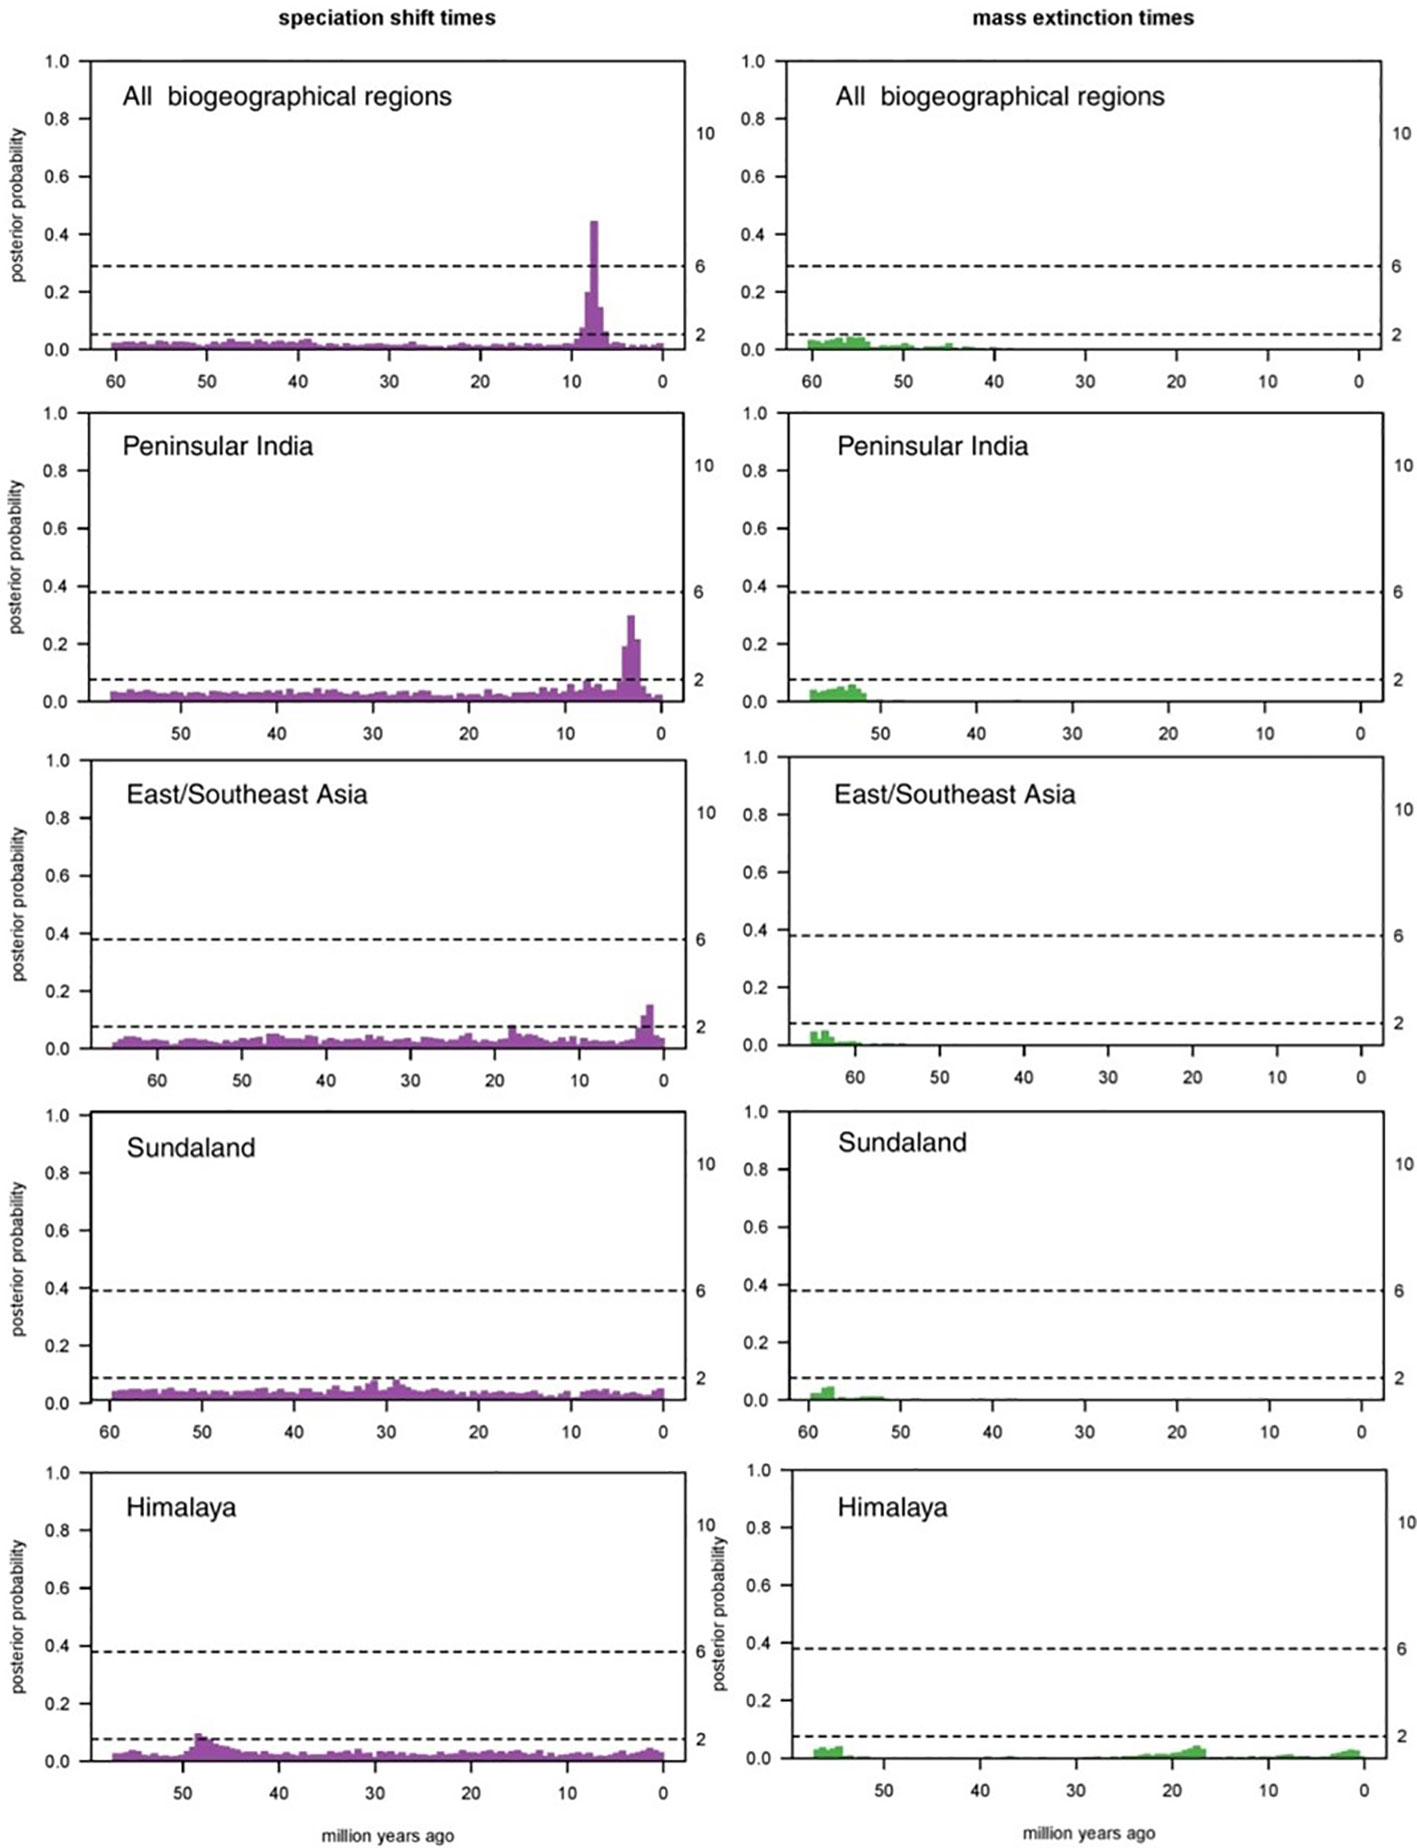
Figure 5 Results of the CoMET analysis. Posterior probabilities for the speciation shifts (purple) and major-extinction events (green) in each biogeographic region are shown (Note: Africa excluded due to lack of tip numbers). Bayes factor values for the speciation and major extinction events are shown on the secondary “Y” axis. A significant extinction event is not evident however, signs of historical extinction events are visible during early stages of rhacophorid diversification (a major extinction in India between ~57–50 Mya shows stronger signs than in other regions). Himalaya seems to have faced two other extinction events during the Miocene whereas Peninsular India, East/Southeast Asia and Sundaland shows significant shifts in speciation rates during the same period.
4 Discussion
This study suggests that the biogeographical history of Rhacophoridae is intricately linked to the geological and climatic history of the region. The timing of dispersal and speciation events indicated by models M2, adjacency and time-stratification is in agreement with the major geological and climatic events that shaped the region’s geography. The models suggest that Rhacophoridae originated in East/southeast Asia and subsequent late Eocene marked the beginning of the diversification of Rhacophoridae in East/Southeast Asia. The initial diversification of Rhacophoridae coincides with the Indian plate colliding against the Asian plate and the beginning of the Sundaland-Asia interconnection, and the MECO period. The mid-Miocene marks the beginning of dispersal to the Himalayas and this coincides with the Himalayan-Tibetan orogeny. Regional studies in other Rhacophorid genera might reveal more details about their dispersal and speciation.
This study demonstrates that the mean age of origin of Rhacophoridae is estimated to be around 57.5 million years ago (95% HPD 41.8–76.0 Mya). This is in agreement with previous studies by (Li et al., 2013; 68–53 Mya) and (Chen et al., 2020; 58.7 Mya, 95% HPD 54.23–62.32 Mya). The East/Southeast Asian origin hypothesis received the highest support (wAICc=0.65) in this study which is in agreement with other biogeographic studies of Rhacophoridae (Li et al., 2013; Chen et al., 2020; Ellepola et al., 2022). But, theoretically the out of Asia hypothesis may contain several flaws. For example this hypothesis fail to explain how Mantellids (sister group of rhacophorids) reached Madagascar, with them being the early diverging lineage in the amphibian phylogeny. In fact, the model suggests an unexpected jump dispersal event that separated the Rhacophoridae from their sister group, the Mantellidae, happening between Asia and Africa. However, this seems unlikely given the geographical distance between these continents, with the Indian plate isolated in between, even though it was gradually drifting northward during this period. This raises the question as to how and what caused the rhacophorids to avoid the Indian plate as indicated by the models.
It was previously thought that Rhacophoridae diverged from Mantellidae in Madagascar and the northward drifting Indian plate (out of India) facilitated the dispersal of rhacophorids to Asia (Bossuyt and Milinkovitch, 2001; Feng et al., 2017; Yuan et al., 2018). However, the inferred age and biogeographic region of origin of Rhacophoridae by empirical models indicate that their origin occurred in Asia prior to the collision of the Indian plate onto the Eurasian plate (~50 Mya; Figure 3). In fact the Indian plate started separating from the Madagascan plate around 53–68 Mya (Bocxlaer et al., 2006; Bossuyt et al., 2006; Kumar et al., 2007; Li et al., 2013) coinciding with the time of origin of Rhacophoridae (~57.5 Mya). This suggests that either a land bridge existed between Madagascar and East/Southeast Asia (the closest sister group of Rhacophoridae are Mantellids from Madagascar) or, between the drifting Indian plate and East/Southeast Asia. There is evidence for a post-Cretaceous biogeographic connection between Madagascar and India and/or the Seychelles (Vences et al., 2003; Bossuyt et al., 2006; Bocxlaer et al., 2006) which may have facilitated the movement of the common ancestor of Rhacophoridae and Mantellidae to Asia from Madagascar or vice versa. Alternatively, the drifting Indian plate might have facilitated the dispersal of early ancestors of Rhacophoridae to Asia (Out of India) but were subjected to mass extinction events caused by the effects of the rapid movement of the Indian plate. It is possible that the rapid movement of the Indian plate caused the extinction of many early rhacophorids due to exposure to extreme climate changes and geological activities such as the Deccan Traps formation around 66 Mya (Cande and Stegman, 2011), thus favoring an out of Asia model.
The presence of fossil evidence of Indorana prasadi from early Eocene sediments of India (Folie et al., 2013) provides some credence to the Indian origin of Rhacophoridae and probable extinctions, which took place on the Indian plate. This suggests that the Indian plate was home to closely related anurans during its northward drift, allowing for their dispersal into Asia. Previous studies have shown that India experienced dramatic latitudinal and climatic changes accompanied by massive extinctions of its biotas during the early Cenozoic (Rutschmann et al., 2004; Karanth, 2006). CoMET analysis also indicated weaker, yet non-statistically significant, signs of extinctions on the Indian plate during the early stages of rhacophorid diversification (Figure 5). The summary results also indicated a probable 93 extinction events during various time periods in the history (Supplementary Figure 5). Furthermore, our best fitted diversification models (Table 2) also support non-constant extinction rates on the diversification, confirming that extinctions played a major role in rhacophorid diversification. In fact, rhacophorids are known to have the highest number of extinct species among anuran families (Meegaskumbura et al., 2007; IUCN, 2012; Ellepola et al., 2021). Although the explanation of the origin of rhacophorids that suggest an alternative direct land connection between Madagascar and East/Southeast Asia is also plausible, but this is yet to be supported with fossil evidence. Therefore, the debate on the region of origin of Rhacophoridae still remains inconclusive.
The best-fitted biogeographical model (M2), the time stratified biogeographical model and the adjacency model (M6) suggest that founder-event speciation has played a role in the development of the biogeographical pattern of Rhacophoridae. Multiple vicariance, dispersal events, plate tectonics and adjacency explain their distribution across at least 137 ecoregions within 10 biomes (https://ecoregions2017.appspot.com/). Primarily, rhacophorids inhabit tropical and subtropical moist broadleaf forests ecoregions. This lack of deviation in preferences to ecoregions during evolution indicates ecoregion conservatism, which predicts stasis of ecoregions during lineage evolution and frequent transitions between ecologically similar regions or habitats (Crisp et al., 2009). Indeed, the potential predilection of rhacophorids for certain ecoregions could provide an explanation why as to their region of origin is recovered as East/southeast Asia but not India. It is possible that they went extinct on the Indian plate during its early northward drift due to changes in the vegetation on the plate, driven by shifting climatic conditions (Rutschmann et al., 2004; Karanth, 2006).
The subsequent diversification of rhacophorids is governed by a plethora of factors. At the Paleocene–Eocene boundary, megathermal rainforests were widespread across Africa, India, Sundaland, and East Asia (Morley, 2011). Thus, if land connections existed between these biogeographic regions, it is likely that Rhacophoridae expanded their range quickly. The ecosystem conservatism mentioned above explains why most speciation events reconstructed appear as narrow sympatric or in-situ speciation events (Figure 3; Supplementary Table 5). In-situ speciation in Rhacophoridae is likely due to ecological opportunity, climatic niche shifts (Pan et al., 2017; Ellepola et al., 2022), and key evolutionary innovations (Stroud and Losos, 2016; Ellepola et al., 2022). Additionally, the evolution of reproductive modes in response to climate warming could have pushed aquatic species towards cooler subtropical moist broadleaf forest regions (East Asia) and warm-adapted species towards tropical regions in Asia (Ellepola et al., 2022), contributing to species packing in Rhacophoridae. Vicariance events (see Figure 3) are mostly attributed to geographical isolation due to mountain formation at some places and sea level fluctuations (Hall, 2012; Meegaskumbura et al., 2019).
Subsequently to the arrival of the MRCA of Rhacophoridae in Asia, they were mainly restricted towards the cooler eastern reaches of Asia and later dispersed within Asia for nearly 20 million years (Figure 3, map 1). The early dispersal of Rhacophoridae can be hypothesized to have occurred via two different routes. Firstly, the early ancestors may have originated in East Asia (if the Out of India hypothesis is rejected) and then dispersed towards lower latitudes as climate became favorable for their dispersal. Alternatively, the MRCA may have arrived via the Indian plate and widely dispersed across Asia, with the effects of its collision with Asia around 50 Mya (Ali and Aitchison, 2008) leading to the extinction of the species from the Indian plate and western reaches of the Asian plate thus limiting them towards the eastern reaches of the Asian plate. The Middle Eocene Climatic Optimum (MECO) which occurred around 40 Mya may have then enabled the long-distance dispersal of rhacophorids due to the emergence of the derived reproductive modes (Ellepola et al., 2022). The high-temperature adapted rhacophorids then dispersed towards lower latitudes, with no exchange of species occurring between Asia and India or Sundaland due to ongoing tectonic activities on those regions (Li et al., 2013).
Following the MECO and contact of mainland Asia with the adjacent Indian plate and Sundaland (Figure 3, map 2), warm-adapted species were able to move towards lower latitudes. With the Eocene–Oligocene transition (EOT) between 22–33 Mya, the Oi-1 glaciation event caused a dramatic global cooling event (Zachos, 2001) that led to sea level lowstands (Zachos, 2001; Kominz et al., 2008). This period marks a time of high faunal exchange between Asia and the Indian sub-continent (Li et al., 2013), likely allowing also for the dispersal of Chiromantis lineage to Africa via land bridges. Favorable vegetation along these land bridges would have facilitated this migration. Intensive volcanic activity in Southeast Asia also occurred during this period, due to the collision of the Eurasian and Australian plates (Hall, 2012). The majority of the islands at the margin of Sundaland were created at this time, leading to increased levels of vicariance speciation in the region.
Around 10–20 million years ago (Mya), an only “out of Asia” dispersal is evident according to our models. In-situ speciation appears to have been more prominent during this time. The Himalayas were forming and the Asian monsoon system was developing, leading to cooler environments and high precipitation (Sun and Wang, 2005; Harris, 2006). It is possible that ecological opportunities in Peninsular India and Sundaland were higher than in Asia, prompting species to disperse to these regions in response to the effects of the monsoon rains. Dispersal to the Himalayas likely began during this period. During the most extreme climatic period of the Miocene (0–10 Mya) – the glacial maxima, when climates were at their coldest and, in most places, also driest – tropical rainforests shrank to their smallest extent, restricted to relatively small refugia (Smith and Jeremy, 2022). This hampered species’ ability to disperse to distant locations. However, staged, yet rapid rises of the Tibetan Plateau and parallel climatic changes and reinforcement of the Asian monsoons (15 Mya, 8 Mya and 4–3 Mya) may have prompted a burst of diversification in Rhacophoridae (Pan et al., 2017). Despite the shrinking rainforest, certain species continued to disperse into India, Sundaland and particularly into the Himalayas, likely due to wetter and cooler conditions facilitated by intensifying Asian monsoons (Briggs, 2003). Our results, in agreement with Chen et al. (2020), did not detect any “Out of Himalaya” scenarios for Rhacophoridae, but rather an “Into Himalaya” scenario only.
Based on the evidence from our diversification models, we propose temperature- and time-dependent diversification models with exponential speciation and extinction rates to explain diversification of Rhacophoridae (Table 2; Figure 4). These non-constant extinction rates and periodic extinction events prompt how near-constant diversification rates were maintained in Rhacophoridae. Paleotemperatures seem positively associated with speciation and negatively associated with extinction rates for amphibians in general, indicating higher speciation and lower extinction with warmer climates (Rolland and Condamine, 2019). Warmer climates may promote higher rates of molecular evolution and subsequent niche evolution (Wright et al., 2006; Ellepola et al., 2022), as well as correlate with periods of higher global productivity, potentially providing more ecological niches (Mayhew et al., 2012). Thus, the increased ecological opportunity offered by the series of colonization events supported by favorable climates may have facilitated diversification in Rhacophoridae. It seems that the diversification rates were not affected by the species density as inter-specific competition seems unlikely in Rhacophoridae due to the abundance of ecological opportunity available and evolution of novel traits (key innovations). Although periodic climate cooling may have slowed down diversification and caused extinctions, their adaptation to terrestrial reproduction allowed them to diversify under cool and dry conditions over a long period of time, leading to diversification rates remaining more or less constant. Major extinction events may also have played a role in the initial diversification in different biogeographical regions, as tectonic events were intense during their early colonization (Figure 5). We caution, however, that the biogeographic origin of Rhacophoridae as revealed by our most supported models may produce different results if future analyses include better models incorporating speciation, and extinction rates.
In conclusion, current data supports the hypothesis that Rhacophoridae originated in East/Southeast Asia (out of Asia), with plate tectonics and adjacency of biogeographic regions playing an important role in their dispersal. Plate tectonic evolution, sea level fluctuations, climate changes and long evolutionary histories with corresponding paleotemperatures are likely important correlates of rhacophorid diversification. In addition, extinction rates, especially major extinction events, have likely had a major impact on their diversification. However, we emphasize that current biogeographic models may not be sufficient to explain the origin of Rhacophoridae, as multiple factors are likely at play. Consequently, future biogeographic analyses should incorporate fossil evidence, and speciation and extinction rates.
Data availability statement
The original contributions presented in the study are included in the article/Supplementary material. Further inquiries can be directed to the corresponding author.
Ethics statement
Ethical review and approval was not required for the animal study because The study is based on an analysis of published data.
Author contributions
Conceptualization, data curation, methodology, formal analysis—GE. Writing—original draft preparation, writing—review and editing—GE and MM. Supervision—MM. All authors contributed to the article and approved the submitted version.
Funding
We thank Guangxi University Laboratory Startup Funding (MM) and China Student Council Fellowship for graduate studies (GE) for providing financial assistance.
Conflict of interest
The authors declare that the research was conducted in the absence of any commercial or financial relationships that could be construed as a potential conflict of interest.
Publisher’s note
All claims expressed in this article are solely those of the authors and do not necessarily represent those of their affiliated organizations, or those of the publisher, the editors and the reviewers. Any product that may be evaluated in this article, or claim that may be made by its manufacturer, is not guaranteed or endorsed by the publisher.
Supplementary material
The Supplementary Material for this article can be found online at: https://www.frontiersin.org/articles/10.3389/fevo.2023.1195689/full#supplementary-material
References
Ali J. R., Aitchison J. C. (2008). Gondwana to Asia: Plate tectonics, paleogeography and the biological connectivity of the Indian sub-continent from the Middle Jurassic through latest Eocene (166–35 Ma). Earth-Sci. Rev. 88 (3–4), 145–166. doi: 10.1016/j.earscirev.2008.01.007
Amphibiaweb (2022). Available at: https://amphibiaweb.org/.
Bocxlaer I. V., Roelants K., Biju S. D., Nagaraju J., Bossuyt F. (2006). Late cretaceous vicariance in gondwanan amphibians. PloS One 1 (1), e74. doi: 10.1371/journal.pone.0000074
Bossuyt F., Brown R. M., Hillis D. M., Cannatella D. C., Milinkovitch M. C. (2006). Phylogeny and biogeography of a cosmopolitan frog radiation: Late cretaceous diversification resulted in continent-scale endemism in the family ranidae. Systemat. Biol. 55 (4), 579–594. doi: 10.1080/10635150600812551
Bossuyt F., Milinkovitch M. C. (2001). Amphibians as indicators of early tertiary ‘out-of-India’ dispersal of vertebrates. Science 292 (5514), 93–95. doi: 10.1126/science.1058875
Bouckaert R. R. (2010). DensiTree: making sense of sets of phylogenetic trees. Bioinformatics 26 (10), 1372–1373. doi: 10.1093/bioinformatics/btq110
Briggs J. C. (2003). The biogeographic and tectonic history of India: Biogeographic and tectonic history of India. J. Biogeog. 30 (3), 381–388. doi: 10.1046/j.1365-2699.2003.00809.x
Burnham K. P., Anderson D. R. (2002). Model selection and multi-model inference: A practical information theoretic approach, (2nd ed.) (New York: Springer Verlag).
Cande S. C., Stegman D. R. (2011). Indian and African plate motions driven by the push force of the Réunion plume head. Nature 475 (7354), 47–52. doi: 10.1038/nature10174
Chan K. O., Grismer L. L., Brown R. M. (2018). Comprehensive multi-locus phylogeny of old world tree frogs (Anura: Rhacophoridae) reveals taxonomic uncertainties and potential cases of over- and underestimation of species diversity. Mol. Phylogenet. Evol. 127, 1010–1019. doi: 10.1016/j.ympev.2018.07.005
Chen J. M., Prendini E., Wu Y. H., Zhang B. L., Suwannapoom C., Chen H. M., et al. (2020). An integrative phylogenomic approach illuminates the evolutionary history of Old World tree frogs (Anura: Rhacophoridae). Mol. Phylogenet. Evol. 145, p.106724. doi: 10.1016/j.ympev.2019.106724
Crisp M. D., Arroyo M. T. K., Cook L. G., Gandolfo M. A., Jordan G. J., McGlone M. S., et al. (2009). Phylogenetic biome conservatism on a global scale. Nature 458, 754–756. doi: 10.1038/nature07764
Drummond A. J., Suchard M. A., Xie D., Rambaut A. (2012). Bayesian phylogenetics with BEAUti and the BEAST 1.7. Mol. Biol. Evol. 29 (8), 1969–1973. doi: 10.1093/molbev/mss075
Dupin J., Matzke N. J., Särkinen T., Knapp S., Olmstead R. G., Bohs L., et al. (2017). Bayesian estimation of the global biogeographical history of the Solanaceae. J. Biogeog. 44 (4), 887–899. doi: 10.1111/jbi.12898
Edgar R. C. (2004). MUSCLE: a multiple sequence alignment method with reduced time and space complexity. BMC Bioinf. 5, 113–113. doi: 10.1186/1471-2105-5-113
Ellepola G., Herath J., Manamendra-Arachchi K., Wijayathilaka N., Senevirathne G., Pethiyagoda R., et al. (2021). Molecular species delimitation of shrub frogs of the genus Pseudophilautus (Anura, rhacophoridae). PloS One 16 (10), e0258594. doi: 10.1371/journal.pone.0258594
Ellepola G., Pie M. R., Pethiyagoda R., Hanken J., Meegaskumbura M. (2022). The role of climate and islands in species diversification and reproductive-mode evolution of Old World tree frogs. Commun. Biol. 5 (1), 347. doi: 10.1038/s42003-022-03292-1
Erwin D. H. (1994). Early introduction of major morphological innovations. Acta Palaeontol. Pol. 38, 281–294.
Etienne R. S., Haegeman B., Stadler T., Aze T., Pearson P. N., Purvis A., et al. (2011). Diversity-dependence brings molecular phylogenies closer to agreement with the fossil record. Proc. R. Soc. London B: Biol. Sci. 279 (1732), 1300–1309. doi: 10.1098/rspb.2011.1439
Feng Y.-J., Blackburn D. C., Liang D., Hillis D. M., Wake D. B., Cannatella D. C., et al. (2017). Phylogenomics reveals rapid, simultaneous diversification of three major clades of Gondwanan frogs at the Cretaceous–Paleogene boundary. Proc. Natl. Acad. Sci. 114 (29):5865–70. doi: 10.1073/pnas.1704632114
Folie A., Rana R. S., Rose K. D., Sahni A., Kumar K., Singh L., et al. (2013). Early eocene frogs from vastan lignite mine, gujarat, India. Acta Palaeontol. Pol. 58, 511–524. doi: 10.4202/app.2011.0063
Frost D. R. (2022) Amphibian species of the world. Available at: https://amphibiansoftheworld.amnh.org/index.php.
Gavrilets S., Losos J. B. (2009). Adaptive radiation: Contrasting theory with data. Science 323 (5915), 732–737. doi: 10.1126/science.1157966
Gavrilets S., Vose A. (2005). Dynamic patterns of adaptive radiation. Proc. Natl. Acad. Sci. 102 (50), 18040–18045. doi: 10.1073/pnas.0506330102
Hall R. (2012). “Sundaland and Wallacea: Geology, plate tectonics and palaeogeography,” in Biotic evolution and environmental change in southeast asia. Ed. Gower D. J. (Cambridge: Cambridge University Press), 33–78.
Harris N. (2006). The elevation history of the Tibetan Plateau and its implications for the Asian monsoon. Palaeogeog. Palaeoclimatol. Palaeoecol. 241 (1), 4–15. doi: 10.1016/j.palaeo.2006.07.009
Höhna S. (2013). Fast simulation of reconstructed phylogenies under global time-dependent birth–death processes. Bioinformatics 29 (11), 1367–1374. doi: 10.1093/bioinformatics/btt153
IUCN (2012). Sri Lanka, Ministry of Environment, Biodiversity Secretariat, Sri Lanka, National Herbarium, Department of National Botanic Gardens. The national red list 2012 of Sri Lanka: conservation status of the fauna and flora. (Colombo, Sri Lanka: Ministry of Environment).
Karanth P. K. (2006). Out-of-India Gondwanan origin of some tropical Asian biota. Curr. Sci. 90 (6), 789–792.
Kominz M. A., Browning J. V., Miller K. G., Sugarman P. J., Mizintseva S., Scotese C. R. (2008). Late Cretaceous to Miocene sea-level estimates from the New Jersey and Delaware coastal plain coreholes: An error analysis. Basin Res. 20 (2), 211–226. doi: 10.1111/j.1365-2117.2008.00354.x
Kumar P., Yuan X., Kumar M. R., Kind R., Li X., Chadha R. K. (2007). The rapid drift of the Indian tectonic plate. Nature 449 (7164), 894–897. doi: 10.1038/nature06214
Landis M. J., Matzke N. J., Moore B. R., Huelsenbeck J. P. (2013). Bayesian analysis of biogeography when the number of areas is large. Systemat. Biol. 62 (6), 789–804. doi: 10.1093/sysbio/syt040
Lanfear R., Frandsen P. B., Wright A. M., Senfeld T., Calcott B. (2016). PartitionFinder 2: new methods for selecting partitioned models of evolution for molecular and morphological phylogenetic analyses. Mol. Biol. Evol. 34 (3), 772–773. doi: 10.1093/molbev/msw260
Li J.-T., Li Y., Klaus S., Rao D.-Q., Hillis D. M., Zhang Y.-P. (2013). Diversification of rhacophorid frogs provides evidence for accelerated faunal exchange between India and Eurasia during the Oligocene. Proc. Natl. Acad. Sci. 110 (9), 3441–3446. doi: 10.1073/pnas.1300881110
Losos J. B., Miles D. B. (2002). Testing the hypothesis that a clade has adaptively radiated: Iguanid lizard clades as a case study. Am. Nat. 160 (2), 147–157. doi: 10.1086/341557
Matzke N. (2013) BioGeoBEARS: BioGeography with Bayesian (And likelihood) evolutionary analysis in R scripts. Available at: https://cran.r-project.org/web/packages/BioGeoBEARS/index.html.
May M. R., Höhna S., Moore B. R. (2016). A Bayesian approach for detecting the impact of mass-extinction events on molecular phylogenies when rates of lineage diversification may vary. Methods Ecol. Evol. 7 (8), 947–959. doi: 10.1111/2041-210X.12563
Mayhew P. J., Bell M. A., Benton T. G., McGowan A. J. (2012). Biodiversity tracks temperature over time. Proc. Natl. Acad. Sci. United States America 109 (38), 15141–15145. doi: 10.1073/pnas.1200844109
Meegaskumbura M., Manamendra-Arachchi K., Schneider C. J., Pethiyagoda R. (2007). New species amongst Sri Lanka’s extinct shrub frogs (Amphibia: Rhacophoridae: philautus). Zootaxa 1397 (1), 1–15. doi: 10.11646/zootaxa.1397.1.1
Meegaskumbura M., Senevirathne G., Biju S. D., Garg S., Meegaskumbura S., Pethiyagoda R., et al. (2015). Patterns of reproductive-mode evolution in Old World tree frogs (Anura, rhacophoridae). Zool. Script. 44 (5), 509–522. doi: 10.1111/zsc.12121
Meegaskumbura M., Senevirathne G., Manamendra-Arachchi K., Pethiyagoda R., Hanken J., Schneider C. J. (2019). Diversification of shrub frogs (Rhacophoridae, pseudophilautus) in Sri Lanka – Timing and geographic context. Mol. Phylogenet. Evol. 132, 14–24. doi: 10.1016/j.ympev.2018.11.004
Morley R. J. (2011). Tropical rainforest responses to climate change. Eds. Bush M. B., Flenley J. R. (Heidelberg: Springer), 1–34.
Morlon H., Lewitus E., Condamine F. L., Manceau M., Clavel J., Drury J. (2016). RPANDA: An R package for macroevolutionary analyses on phylogenetic trees. Methods Ecol. Evol. 7 (5), 589–597. doi: 10.1111/2041-210X.12526
Müller R. D., Cannon J., Qin X., Watson R. J., Gurnis M., Williams S., et al. (2018). Gplates: Building a virtual earth through deep time. Geochem. Geophys. Geosyst. 19 (7), 2243–2261. doi: 10.1029/2018GC007584
Orme D., et al. (2018) caper: Comparative Analyses of Phylogenetics and Evolution in R version 0.5. Available at: http://CRAN.R-project.org/package=caper.
Pan T., Zhang Y., Wang H., Wu J., Kang X., Qian L., et al. (2017). The reanalysis of biogeography of the Asian tree frog, Rhacophorus (Anura: Rhacophoridae): geographic shifts and climatic change influenced the dispersal process and diversification. PeerJ 5, e3995. doi: 10.7717/peerj.3995
Paradis E., Claude J., Strimmer K. (2004). APE: analyses of phylogenetics and evolution in R language. Bioinformatics 20 (2), 289–290. doi: 10.1093/bioinformatics/btg412
Purvis A., Fritz S. A., Rodríguez J., Harvey P. H., Grenyer R. (2011). The shape of mamMalian phylogeny: patterns, processes and scales. Philos. Trans. R. Soc B 366, 2462–2477. doi: 10.1098/rstb.2011.0025
Pyron A. R., Wiens J. J. (2011). A large-scale phylogeny of amphibia including over 2800 species, and a revised classification of extant frogs, salamanders, and caecilians. Mol. Phylogenet. Evol. 61 (2), 543–583. doi: 10.1016/j.ympev.2011.06.012
Rambaut A., Drummond A. J. (2013) TreeAnnotator v1.10.4. Available as part of the BEAST package a. Available at: http://beast.bio.ed.ac.ukt.
Ree R. H., Sanmartín I. (2018). Conceptual and statistical problems with the DEC +J model of founder-event speciation and its comparison with DEC via model selection. J. Biogeog. 45 (4), 741–749. doi: 10.1111/jbi.13173
Ree R. H., Smith S. A. (2008). Maximum likelihood inference of geographic range evolution by dispersal, local extinction, and cladogenesis. Systemat. Biol. 57 (1), 4–14. doi: 10.1080/10635150701883881
Rolland J., Condamine F. L. (2019). The contribution of temperature and continental fragmentation to amphibian diversification. J. Biogeog. 46 (8), 1857–1873. doi: 10.1111/jbi.13592
Ronquist F., Teslenko M., van der Mark P., Ayres D. L., Darling A., Höhna S., et al. (2012). MrBayes 3.2: Efficient Bayesian phylogenetic inference and model choice across a large model space. Systemat. Biol. 61 (3), 539–542. doi: 10.1093/sysbio/sys029
Ronquist F. (1997). Dispersal-vicariance analysis: A new approach to the quantification of historical biogeography. Systematic Biol. 46 (1), 195–203. doi: 10.1093/sysbio/46.1.195
Rutschmann F., Eriksson T., Schönenberger J., Conti E. (2004). Did Crypteroniaceae really disperse out-of-India? Mol. dating evidence rbcL ndhF rpl16 intron sequences. Int. J. Plant Sci. 165, 69–83. doi: 10.1086/383335
Simpson George Gaylord (1953). The major features of evolution (New York NY: Columbia University Press).
Smith, Jeremy M. B. (2022). Tropical rainforest. In: Encyclopedia britannica. Available at: https://www.britannica.com/science/tropical-rainforest (Accessed 16 January 2023).
Stroud J. T., Losos J. B. (2016). Ecological opportunity and adaptive Radiation. Annu. Rev. Ecol. Evolut. Systemat. 47 (1), 507–532. doi: 10.1146/annurev-ecolsys-121415-032254
Sun X., Wang P. (2005). How old is the Asian monsoon system?—Palaeobotanical records from China. Palaeogeog. Palaeoclimatol. Palaeoecol. 222 (3–4), 181–222. doi: 10.1016/j.palaeo.2005.03.005
Tamura K., Stecher G., Peterson D., Filipski A., Kumar S. (2013). MEGA6: molecular evolutionary genetics analysis version 6.0. Mol. Biol. Evol. 30 (12), 2725–2729. doi: 10.1093/molbev/mst197
Thomas G. H., Hartmann K., Jetz W., Joy J. B., Mimoto A., Mooers A. O. (2013). PASTIS: an R package to facilitate phylogenetic assembly with soft taxonomic inferences. Methods Ecol. Evol. 4 (11), 1011–1017. doi: 10.1111/2041-210X.12117
Turk E., Čandek K., Kralj-Fišer S., Kuntner M. (2020). Biogeographical history of golden orbweavers: Chronology of a global conquest. J. Biogeog. 47 (6), 1333–1344. doi: 10.1111/jbi.13838
Vasconcellos M. M., Colli G. R., Cannatella D. C. (2021). Paleotemperatures and recurrent habitat shifts drive diversification of treefrogs across distinct biodiversity hotspots in sub-Amazonian South America. J. Biogeog. 48 (2), 305–320. doi: 10.1111/jbi.13997
Vences M., Kosuch J., Glaw F., Bohme W., Veith M. (2003). Molecular phylogeny of hyperoliid treefrogs: Biogeographic origin of Malagasy and Seychellean taxa and re-analysis of familial paraphyly. J. Zool. Systemat. Evolution. Res. 41 (3), 205–215. doi: 10.1046/j.1439-0469.2003.00205.x
Vences M., Glaw F. (2001). When molecules claim for taxonomic changes: new proposals on the classification of old world treefrogs. Spixiana 24 (1), 85:92.
Vijayakumar S. P., Menezes R. C., Jayarajan A., Shanker K. (2016). Glaciations, gradients, and geography: Multiple drivers of diversification of bush frogs in the Western Ghats Escarpment. Proc. R. Soc. B: Biol. Sci. 283 (1836), 20161011. doi: 10.1098/rspb.2016.1011
Wright S., Keeling J., Gillman L. (2006). The road from Santa Rosalia: A faster tempo of evolution in tropical climates. Proc. Natl. Acad. Sci. United States America 103 (20), 7718–7722. doi: 10.1073/pnas.0510383103
Yu Y., Harris A. J., Blair C., He X. (2015). RASP (Reconstruct ancestral state in phylogenies): A tool for historical biogeography. Mol. Phylogenet. Evol. 87, 46–49. doi: 10.1016/j.ympev.2015.03.008
Yuan Z.-Y., Zhang B.-L., Raxworthy C. J., Weisrock D. W., Hime P. M., Jin J.-Q., et al. (2018). Natatanuran frogs used the Indian Plate to step-stone disperse and radiate across the Indian Ocean. Natl. Sci. Rev. 6 (1), 10–14. doi: 10.1093/nsr/nwy092
Zachos J. (2001). Trends, rhythms, and aberrations in global climate 65 Ma to present. Science 292 (5517), 686–693. doi: 10.1126/science.1059412
Keywords: biogeography, distribution, diversity, diversification rate, extinction, out of Asia, out of India
Citation: Ellepola G and Meegaskumbura M (2023) Diversification and biogeography of Rhacophoridae – a model testing approach. Front. Ecol. Evol. 11:1195689. doi: 10.3389/fevo.2023.1195689
Received: 28 March 2023; Accepted: 21 August 2023;
Published: 08 September 2023.
Edited by:
Francois Munoz, Université Grenoble Alpes, FranceReviewed by:
Praveen Karanth, Indian Institute of Science (IISc), IndiaKanishka Ukuwela, Rajarata University of Sri Lanka, Sri Lanka
Naman Goyal, Indian Institute of Science Education and Research, Tirupati, India
Copyright © 2023 Ellepola and Meegaskumbura. This is an open-access article distributed under the terms of the Creative Commons Attribution License (CC BY). The use, distribution or reproduction in other forums is permitted, provided the original author(s) and the copyright owner(s) are credited and that the original publication in this journal is cited, in accordance with accepted academic practice. No use, distribution or reproduction is permitted which does not comply with these terms.
*Correspondence: Madhava Meegaskumbura, bWFkaGF2YV9tQG1hYy5jb20=