 Xiao Wang
 Quanli Xu
 Jing Liu
- 1Department of Geography, Yunnan Normal University, Kunming, China
- 2GIS Technology Engineering Research Centre for West-China Resources and Environment of Educational Ministry, Kunming, China
- 3Yunnan Geospatial Information Technology Engineering Research Center, Kunming, China
- 4Key Laboratory of Resources and Environment Remote Sensing in Yunnan University, Kunming, China
Introduction: The use of pseudo-absence data constrained by environmental conditions can facilitate potential distribution predictions of invasive species. However, pseudo-absence data generated by existing methods are usually not representative because the relationship between the presence and pseudo-absence points is either simplistic or neglected. This could under or overestimate the potential distribution of invasive species.
Methods: To address this deficiency, this study proposes a new method for obtaining pseudo-absence data based on geographic similarities. First, the reliability of pseudo-absences was quantified based on the geographic similarity to the occurrence of species. Subsequently, a representative pseudo-absence reliability threshold interval was determined. Finally, different pseudo-absence acquisition methods were assessed by combining virtual species with a real invasive species.
Results: The analysis demonstrated that the geographic similarity method can improve model accuracy and achieve a more realistic distribution compared with the traditional method of sampling for pseudo-absence data.
Discussion: This result indicates that the pseudo-absence data obtained using the geographic similarity approach were more representative. Our study provides valuable insights into improving invasive plant distribution predictions by considering the geographical relationships between species occurrences and the surrounding environments.
1. Introduction
Invasive plants cause a loss of species habitat and diversity, therefore, studying their distribution is important for ecological conservation (Pyšek et al., 2012; Blackburn et al., 2019). Species distribution models (SDMs), also known as ecological niche models, use associations between the known occurrence (presence) of species and environmental conditions to estimate the potential geographic distribution of species, and have become a principal tool for studying the distribution of invasive species (Guisan and Thuiller, 2005; Elith et al., 2006; Elith and Leathwick, 2009). The quality and representativeness of the distribution data applied to SDMs are vital, because samples that infer relationships between variables should be representative of the underlying population (Zaniewski et al., 2002; Lobo, 2008; Rocchini et al., 2011; Tessarolo et al., 2021). Depending on the distribution data of species used, SDMs can be classified into presence-only and presence-absence models (Brotons et al., 2004; Elith et al., 2006). Unlike presence-only models, presence-absence models require additional species-absence information to explore species-environment relationships. Moreover, several comparisons of various SDMs have demonstrated that presence-absence models tend to perform better than presence-only models (Brotons et al., 2004; Engler et al., 2004; Elith et al., 2006; Guisan et al., 2006). Presence data can be acquired through in situ collections, herbaria, or web-based information databases, such as the Global Biodiversity Information Facility (GBIF; Elith et al., 2006; Elith and Leathwick, 2007; Wisz et al., 2008). However, these occurrence data may suffer from spatial bias (sample selection bias) because some sites are more likely to be surveyed or some species under recorded (Hortal et al., 2007; Phillips et al., 2009). Obtaining real absence data is sometimes challenging; thus, SDMs use random pseudo-absence (background or implied absence) data from the study area to reveal the environmental information available. Even with the inherent spatial bias in the collected data, pseudo-absence data selected through presence data is still useful, especially when available data records are rare (e.g., managing invasive or endangered species; Engler et al., 2004; Peterson et al., 2018). Furthermore, even if the quality of the presence data is high, pseudo-absence data should be thoroughly selected, as this is critical for the relative accuracy of SDMs (Lobo et al., 2010; Smith et al., 2013).
Two methods have been proposed for obtaining pseudo-absence data. The first involves random sampling of the entire geographic area, providing a broad representation of the environmental space (Stockwell, 1999; Hirzel et al., 2001). However, this method may generate abundant false absences, leading to erroneous predictions, particularly when records of species are scarce (Engler et al., 2004; Lobo et al., 2010). The second method samples a specific region rather than the entire area and can be delineated in geographic (geographic constraint method) or environmental space (environmental constraint method; Lobo and Tognelli, 2011; Barbet-Massin et al., 2012). This method increases the probability of obtaining absence data in places with environmental conditions different from those of the presence data, crucial for predicting the potential distribution of species (Lobo et al., 2010). However, spatial distance buffers used to define geographic ranges are often arbitrary and subjective (VanDerWal et al., 2009; Barbet-Massin et al., 2012). An ecological approach known as the two-step method has been employed, which selects pseudo-absence data from unsuitable areas predicted by the BIOCLIM envelope model or ecological niche factor analysis based on presence data only (Engler et al., 2004; Wisz and Guisan, 2009). However, this method produces overly optimistic forecasts (Engler et al., 2004). Without objective thresholds, pseudo-absence data tends to be selected within a “narrow” range, causing overestimated predictions with an underrepresented geographic sample and an overly broad distribution (Lobo et al., 2010). Subsequently, a three-step pseudo-absence data selection technique that balances both geographic and environmental dimensions has been proposed to avoid such overestimations (Senay et al., 2013; Iturbide et al., 2015). This approach attempts to determine sampling geographic ranges based on changes in the importance of environmental variables, and subsequently applies classifiers and clusters to select representative pseudo-absence data. However, this approach introduces additional uncertainty when determining distances.
The use of pseudo-absence data is crucial for the distribution modeling of species, but to ensure accuracy, they must closely represent the geographical study area. Current pseudo-absence data-selection methods either under or overestimate potential distributions, both of which are detrimental to the management of invasive species. The difficulty in applying existing methods to determine a reasonable sampling range is the main driver behind the abovementioned underrepresentation. As the existing methods often involve explicit or implicit arbitrary assumptions, a “smooth” approach needs to be developed to obtain a reliable threshold. To this end, we proposed quantifying the environmental similarity between the unknown location and the occurrence location, as those with similar environmental characteristics are more likely to have similar distribution characteristics of species (Broennimann et al., 2012; Tocchio et al., 2015). This is known as the “geographic similarity principle,” namely, the more similar the geographical configuration of two points (regions), the more similar the value (process) of the target variable at these two points (regions) and has been shown to improve the reliability of distribution predictions of geographic phenomena (e.g., landslides and soils; Zhu et al., 2018; Xu et al., 2023b). Based on this principle, we proposed a method for obtaining pseudo-absence data of species that considers geographic similarity to improve the pseudo-absence data quality. By exploring the correlation between the distribution of species and the geographic environment, we calculated the confidence level of a location becoming absent based on the degree of similarity to known distribution locations of species. However, using pseudo-absences that are too far away (i.e., not similar) from the presence data may overestimate the potential distribution (Lobo et al., 2010). Therefore, we introduced a new metric, the predictive efficiency index (PEI)—discussed later—to evaluate prediction overestimation.
The main aim of this study is to use the geographic similarity principle to improve the representation of pseudo-absence data, thus improving the potential distribution prediction of invasive species. To this end, we tested and compared the performance of traditional methods (“random,” “geographic constraints,” and “environmental constraints”) and a new geographic similarity-based approach (pseudo-absence selection method) in presence-absence models using virtual species (Meynard et al., 2019) and a real case of Ageratina adenophora (Spreng.) R.M. King and H. Rob (Asterales, Asteraceae) distribution in Yunnan, China. Specifically, we applied each of the four pseudo-absence selection methods described above to virtual species, as well as real A. adenophora SDMs, and tested their performance under different biases and presence numbers (30, 50, 100, and 300). We validated the new methods by comparing the model results with the known (virtual) distribution suitability of species.
2. Materials and methods
2.1. Research processes
This study consisted of three steps (Figure 1). First, the geographical environmental similarity between known presence points of species and unknown locations was computed to assess the reliability of the unknown locations as pseudo-absences. This reliability measure provides guidance for sampling pseudo-absences. Second, the impact of pseudo-absences was tested with varying levels of reliability on the prediction of invasive distributions of species. The aim was to understand how different levels of reliability influence the accuracy and effectiveness of the distribution models. Finally, the feasibility and effectiveness of the proposed method were compared with those of traditional approaches.
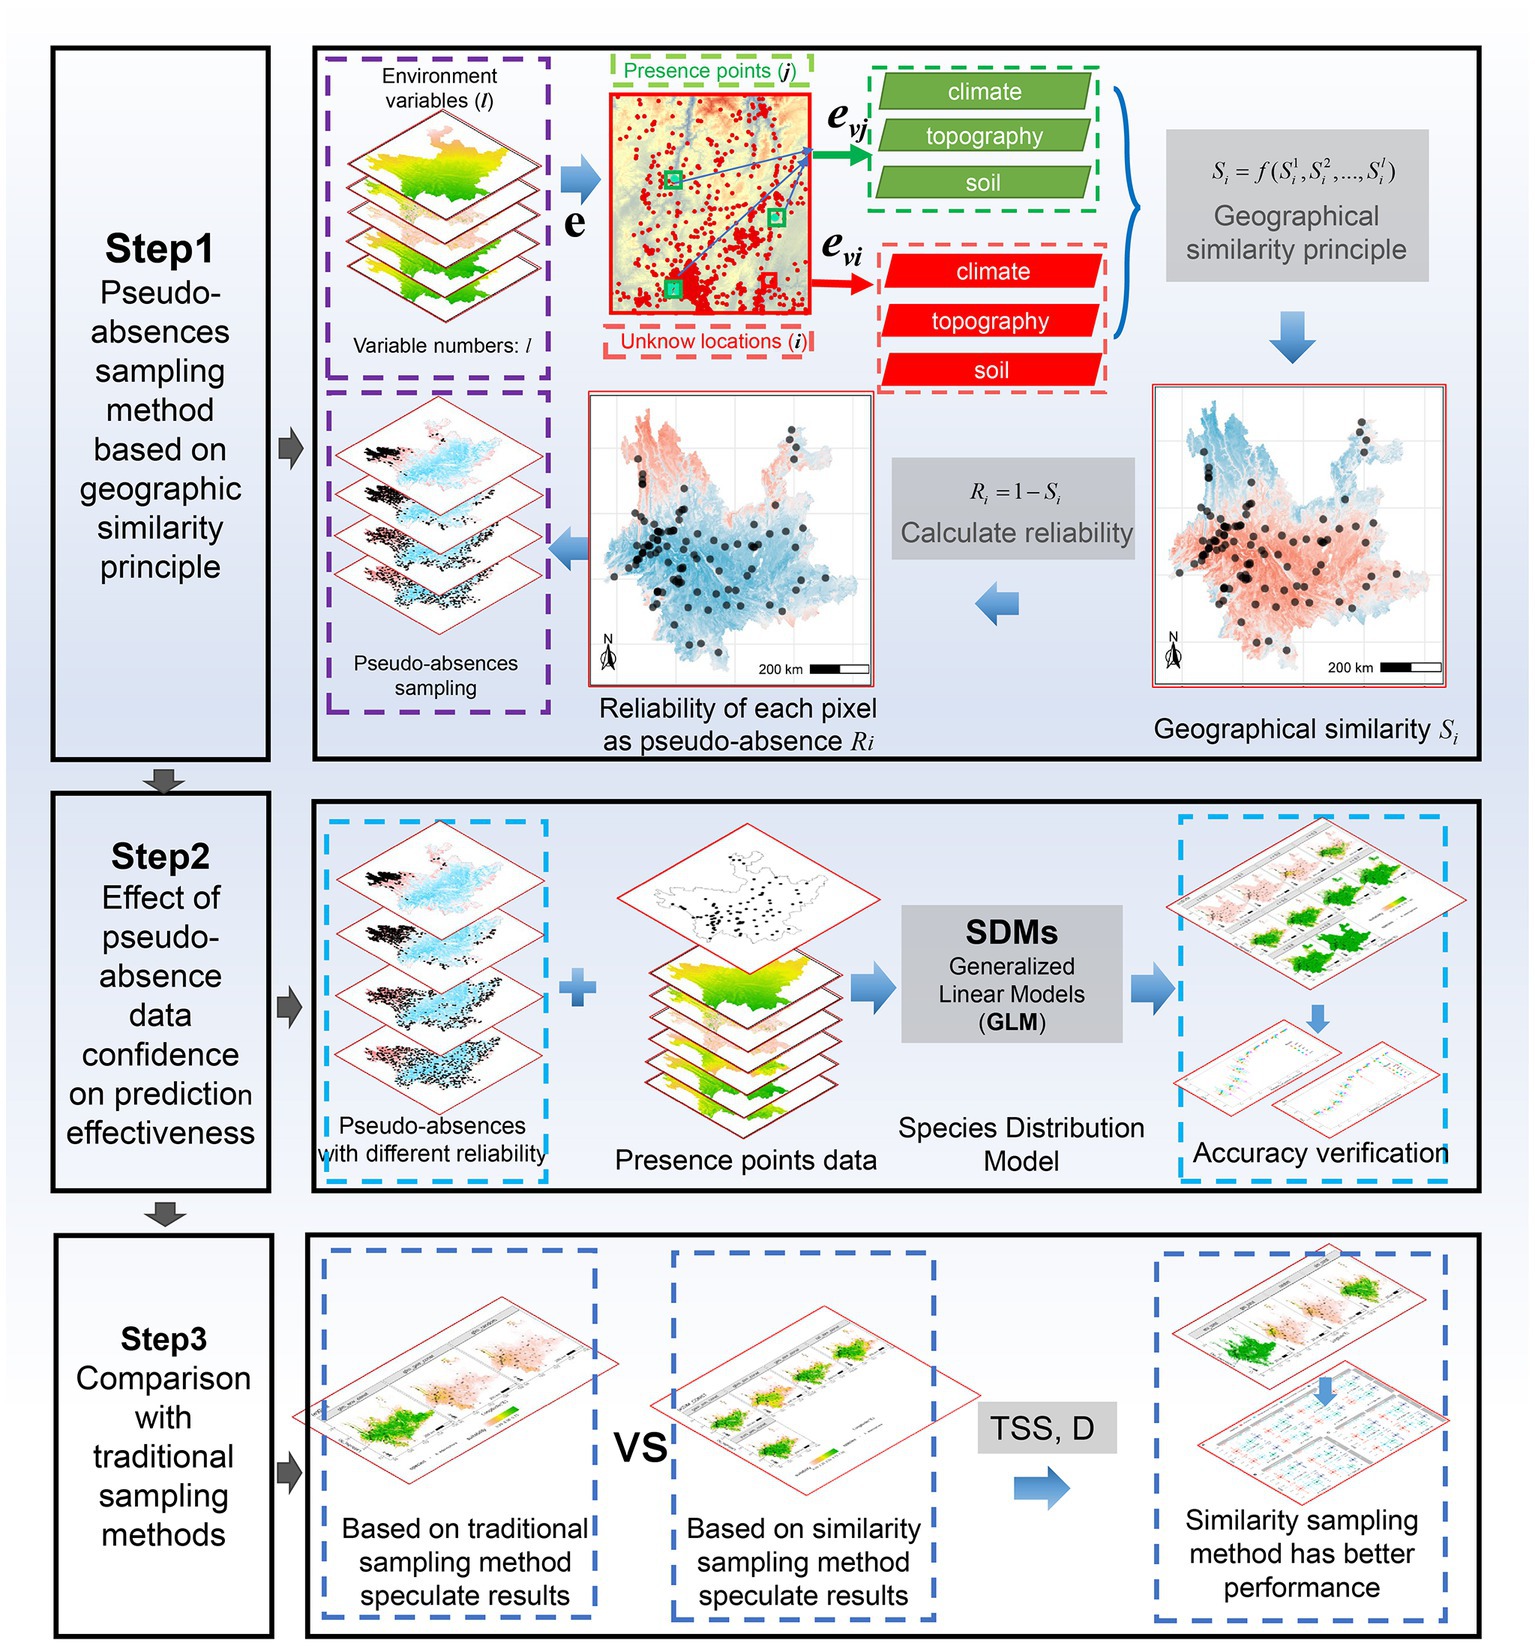
Figure 1. Research flow chart.
2.2. Ageratina adenophora and environmental variables
Yunnan Province (China), located on the border of Southwest China and covering a total area of 394,100 km2, was selected as the study area (Figure 2). Its mountainous regions account for 84% of the total area which has a complex topography including rivers and lakes. Although Yunnan features a diverse ecological environment, as a border province with frequent foreign exchanges, it is vulnerable to biological invasions, which threaten its biodiversity and natural environment. A. adenophora is a successfully invasive plant species in Yunnan and ranked first among the 16 most important invasive alien species identified by China’s State Environmental Protection Administration in 2003 (Zhang et al., 2007). Here, we obtained 300 valid A. adenophora distribution points from the literature (Xian et al., 2023; Figure 2). Nine environmental variables (Pearson’s |r| < 0.8, reducing the effect of multicollinearity) associated with the growth and spread of A. adenophora were selected for analysis, including bioclimates from WorldClim (Fick and Hijmans, 2017; bio2, bio9, bio14, bio15, bio16, and bio19), topsoil organic matter, and acid–base conditions (toc, tph). A detailed description of the environmental variables is provided in Supplementary material.
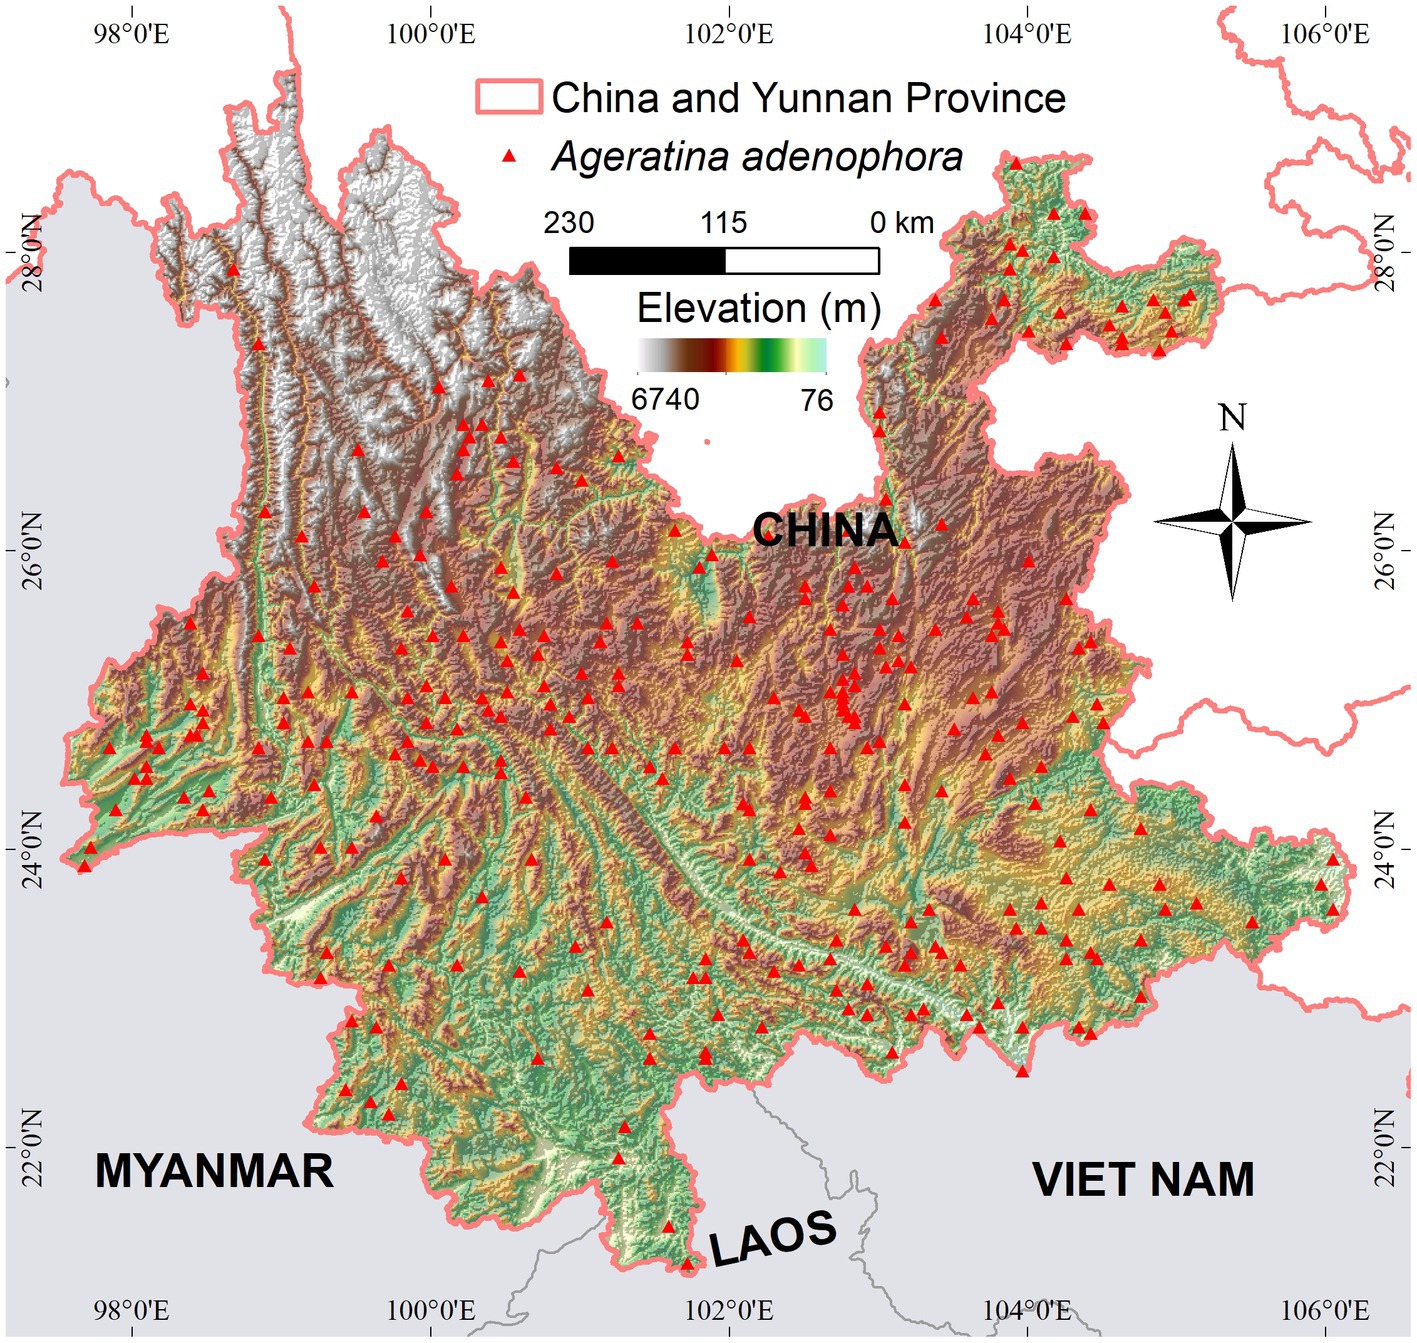
Figure 2. Map of the study area in Yunnan, China.
2.3. Virtual species
Virtual species were modeled with known true distributions to validate the similarity approach. We generated two virtual species using the function generateSpFromPCA in the package virtualspecies v.1.5.1 (Leroy et al., 2016) in R v.4.2.0 (R Core Team, 2022), which creates different principal component axes based on the given environmental variables and defines the species response to the principal component axes. We selected the first two axes (explaining 80.34% of the environmental variables), set the ecological niche breadth of the species to “wide,” and fixed the slope α to −0.1. Two virtual species with a prevalence of 0.4 and 0.7 were generated. Subsequently, we performed a binary (presence-absence) transformation of the distribution suitability of the virtual species using a “logistic” approach. The environmental variables used to generate and predict the distribution of virtual species were consistent with those used for A. adenophora. To investigate the effect of sampling bias and the size of the presence data on the model prediction accuracy we performed 10-fold subsampling (30, 50, 100, and 300 presences) for the potential distribution with and without bias. The bias weights were the spatial kernel densities of plant records (GBIF, https://doi.org/10.15468/dl.p3pwxa) from Yunnan Province.
2.4. Modeling and evaluation
We modeled species distributions by a commonly used, presence-absence based generalized linear model (GLM) using the R package flexsdm v.1.3.3 (Velazco et al., 2022). A key advantage of the GLM is its flexibility in accommodating different response variables. GLM can handle binary data (presence or absence) by using a binomial distribution with a logit link function that models the probability of occurrence based on environmental predictors. This is well suited for the distribution modeling of species, where the goal is to predict the presence or absence of a species in relation to environmental variables. Here, GLMs were developed using a 10-fold cross-validation approach, with the data randomly divided for each iteration into a training and test set (70% and 30% of the data, respectively).
Several evaluation metrics were employed to assess the performance of the model. Sensitivity, representing the proportion of correctly predicted presences, and specificity, indicating the proportion of correctly predicted absences, were calculated. True skill statistics (TSS) were computed using the formula: TSS = sensitivity + specificity − 1 (Allouche et al., 2006; Jiménez-Valverde and Lobo, 2007). The TSS provides an advantageous assessment of the model accuracy and was utilized to classify the presence or absence of prediction results, considering the maximum TSS value as the threshold. We also employed the area under the receiver operating characteristic (ROC) curve (AUC) as a summary measure of model performance (Allouche et al., 2006). The AUC quantifies the overall fit of the model by plotting sensitivity against 1—specificity over various thresholds. It ranges from 0.5 (representing a random model) to 1 (indicating a perfect fit). Schoener’s D (D) was used to evaluate niche overlap or similarity, ranging from 0 (completely dissimilar ecological niche) to 1 (identical ecological niche; Schoener, 1968). Higher values of D indicate a better prediction performance. To ensure the reliability of our evaluations, these indicators were calculated based on the known potential distribution of virtual species (but note that for the real species A. adenophora, the AUC and TSS were calculated based on pseudo-absence). We utilized the R packages ENMTools v.2.0.0 (Warren et al., 2021) and PresenceAbsence v.1.1.11 (Freeman and Moisen, 2008) to compute D and TSS, respectively.
2.5. True absence and pseudo-absence
We considered all points outside the potential distribution of the species as true absences. The methods below were used to generate 10,000 pseudo-absences for the GLM (Barbet-Massin et al., 2012).
2.5.1. Similarity-based pseudo-absence method
Similarity-based pseudo-absence was performed in three steps (Figure 3). First, the similarity of the geographic environment was calculated for all unknown locations and presence points in the study area. Second, the reliability of the pseudo-absence was calculated based on the similarity. Finally, the optimal reliability was determined and pseudo-absences were obtained.
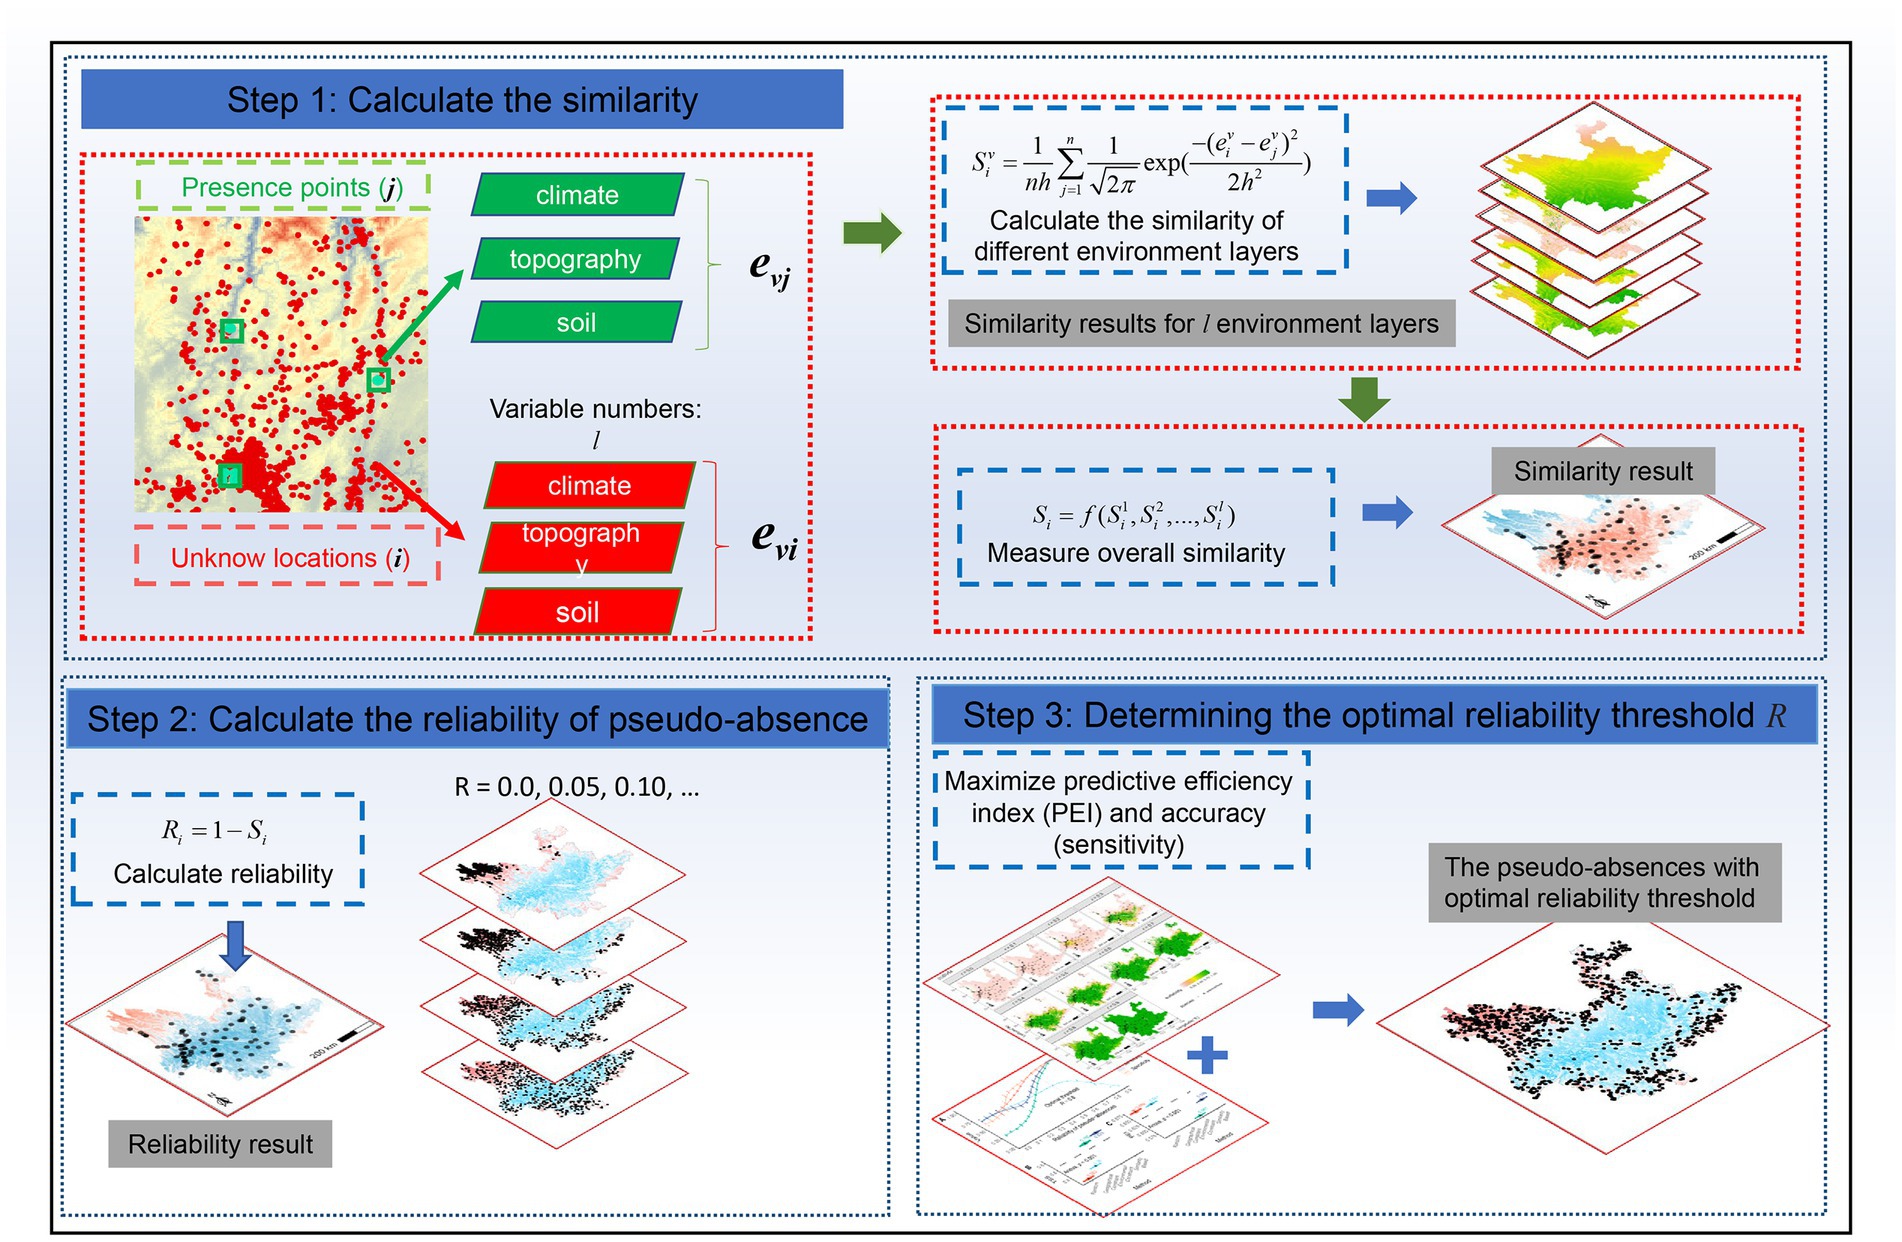
Figure 3. The three steps used to create the similarity-based pseudo-absence data. Step 1: calculate the similarity. Step 2: calculate the reliability of pseudo-absence. Step 3: determine the optimal reliability threshold R.
Previous studies have used the Mahalanobis distance to measure similarity; however, this requires a priori prediction of the “best observed value” (Farber and Kadmon, 2003). Here, the Kernel density was used to calculate the geographic environmental similarity between each unknown location and all presences (Zhu et al., 2015, 2018, 2019; Xu et al., 2021, 2023a). The environmental variables must be normalized prior to unifying their magnitudes.
First, using Equation (1), we calculated the similarity Siv between each unknown location i (i = 1, 2, 3, …, k; k is the total number of all locations) and all presences j (j = 1, 2, 3, …, n; n is the number of presences) based on the vth (v = 1, 2, 3, …, l; l is the total number of environmental variables) environmental variable, where eiv and ejv are the values of the unknown points i and j, respectively. The bandwidth h was determined using an empirical rule (Liu et al., 2021) with Equation (2), where σv is the standard deviation of the vth environmental variable. Subsequently, we combined all l environmental variables to compute the comprehensive similarity Si of each unknown location to the presence data using Equation (3). Where f denotes the integrated similarity calculation function, and we used the average function.
The reliability of pseudo-absence and similarity of presence data are complementary concepts used to measure the reliability of pseudo-absence data based on the results of similarity calculations, as shown in Equation (4):
where Ri is the reliability of unknown location i as a pseudo-absence. Similar to Si, the value domain of Ri is [0, 1]. To test the prediction of the distribution of invasive species under different threshold constraints step by step, we tested k reliability intervals (i.e., reliability falling in [t × s, 1], t = 0, 1, …, k-1, k. k = 1/s), where s is the step size (set as 0.05) and R (R = t × s) is the reliability threshold.
The model discrimination (AUC or TSS score) can be high when overpredicting, that is, when the area occupied by the predicted species is high with regard to the total study area. However, this does not imply the applicability and accuracy of the predictions because the model results should precisely predict most species to occur in the smallest area (“parsimony rule”; Engler et al., 2004; Lobo et al., 2008; García-Roselló et al., 2019). Inspired by this idea, we used the predicted efficiency index (PEI) to determine the optimal reliability threshold R. Similar to the AUC, the predicted efficiency index was obtained by computing the area under the curve, which is composed of the coordinates xi and yi, based on Equation (5):
Analogous to the reliability class classification, but with a smaller step of 0.01, the model-predicted values were classified into i classes (i = 1, 2, … m). The vertical axis yi represents the ratio of the known presence number Ni within rank i to the total number of presences, and the horizontal axis xi represents the ratio of area Ai predicted as a presence within rank i to the total study area (equivalent to the number of raster cells). The area under the curve was calculated as the PEI and its value was within the interval [0, 1]. Higher values indicated higher applicability or accuracy of the prediction results. Therefore, it is important to ensure high PEI values and model accuracy (sensitivity). We considered R to be the best pseudo-absence reliability threshold when the mean of the two was maximum.
2.5.2. Traditional pseudo-absence sampling methods
Three traditional types of pseudo-absence data sampling were performed using the R package “flexsdm” (Velazco et al., 2022). (1) The random method—random selection from all the points in the geospatial background of the study area, excluding known presence points; (2) geographical constraint method—sampling of the areas located 20 km away from known presence points; and (3) environmental constraint method—sampling of the results generated based on the envelope model BIOCLIM (Booth et al., 2014).
3. Results
3.1. Ageratina adenophora distribution model
The A. adenophora distribution model showed different responses to pseudo-absences, with different levels of reliability (Figure 4). As the reliability threshold R increased, the extent of highly suitable areas expanded, as represented by an increase in green areas. Relatively low thresholds (Figure 4A) were generally associated with low suitability. When the threshold was moderate (Figure 4B), a relatively “smooth” trend of high and low values was discerned. However, as the threshold continued to increase (Figure 4C), the suitability exhibited a “bipolar” (0 and maximum predicted value) distribution pattern. In terms of the model discrimination (Figure 5A), we found that the AUC and TSS increased as the threshold value increased. The PEI remained relatively flat at high values with low thresholds (R = 0.0 ~ 0.2) but then decreased as the reliability threshold increased. Notably, the TSS (and sensitivity) exhibited significant instability at high thresholds (R = 0.9). The mean values of predictive efficiency and sensitivity were greatest when the reliability threshold (R) = 0.6; therefore, this was set as the optimal reliability threshold.
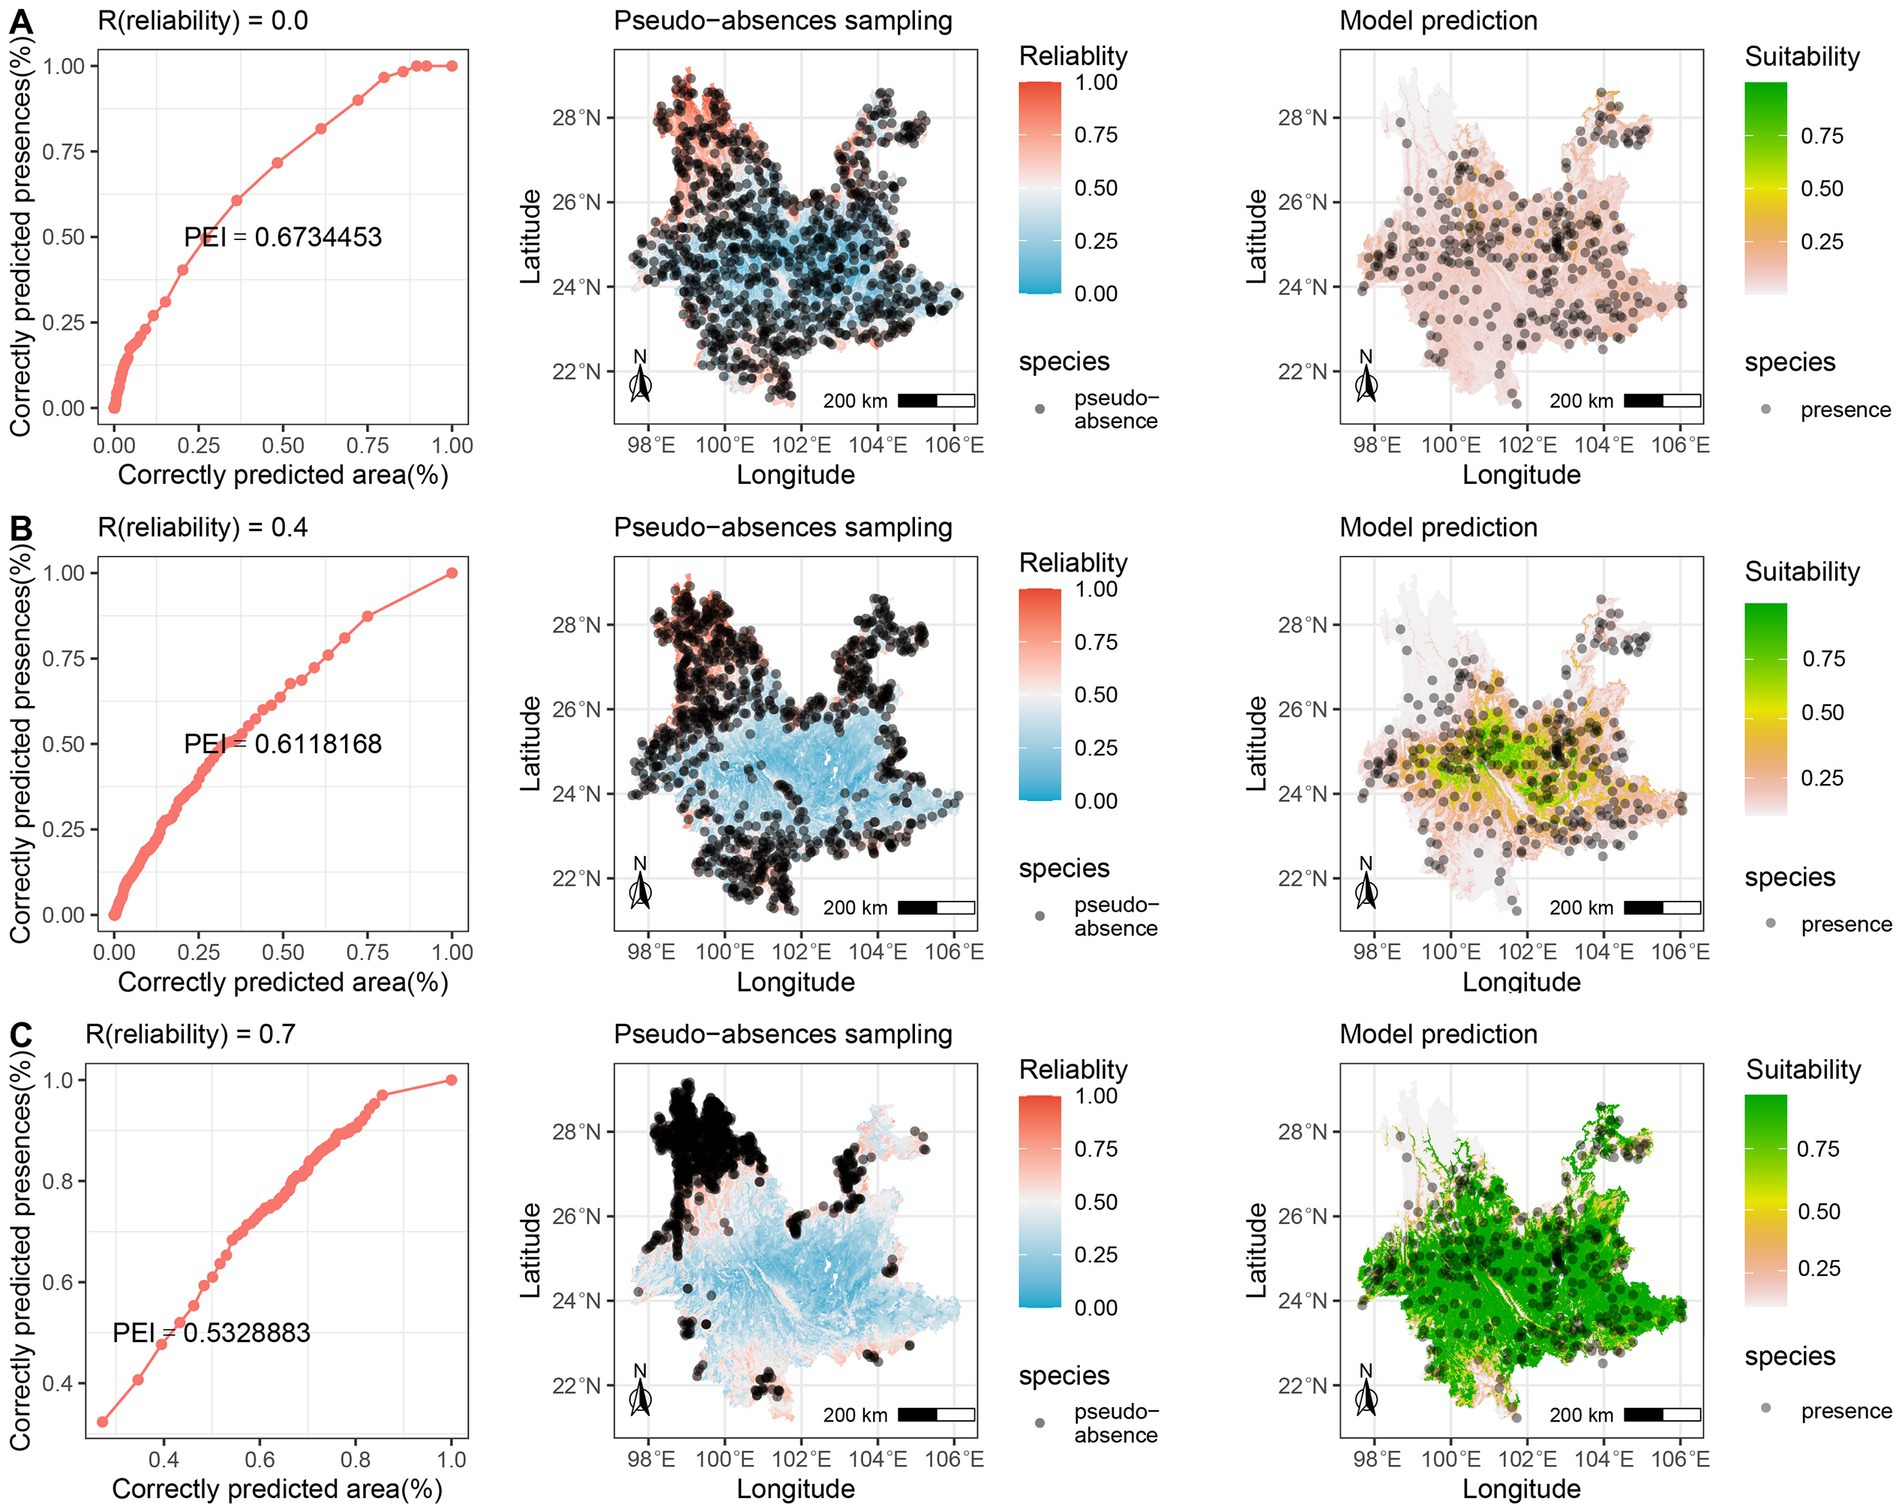
Figure 4. The A. adenophora distribution model showed different responses to pseudo-absences with different levels of reliability. (A) When low threshold, the pseudo-absence data may contain a large number of false absences, predicting with high efficiency but underestimating the species distribution; (B) When medium threshold, some false absences are excluded and over- or underestimation is mitigated; (C) When high threshold, pseudo-absences are restricted to a tight range, with low prediction efficiency and overestimation of species distribution.
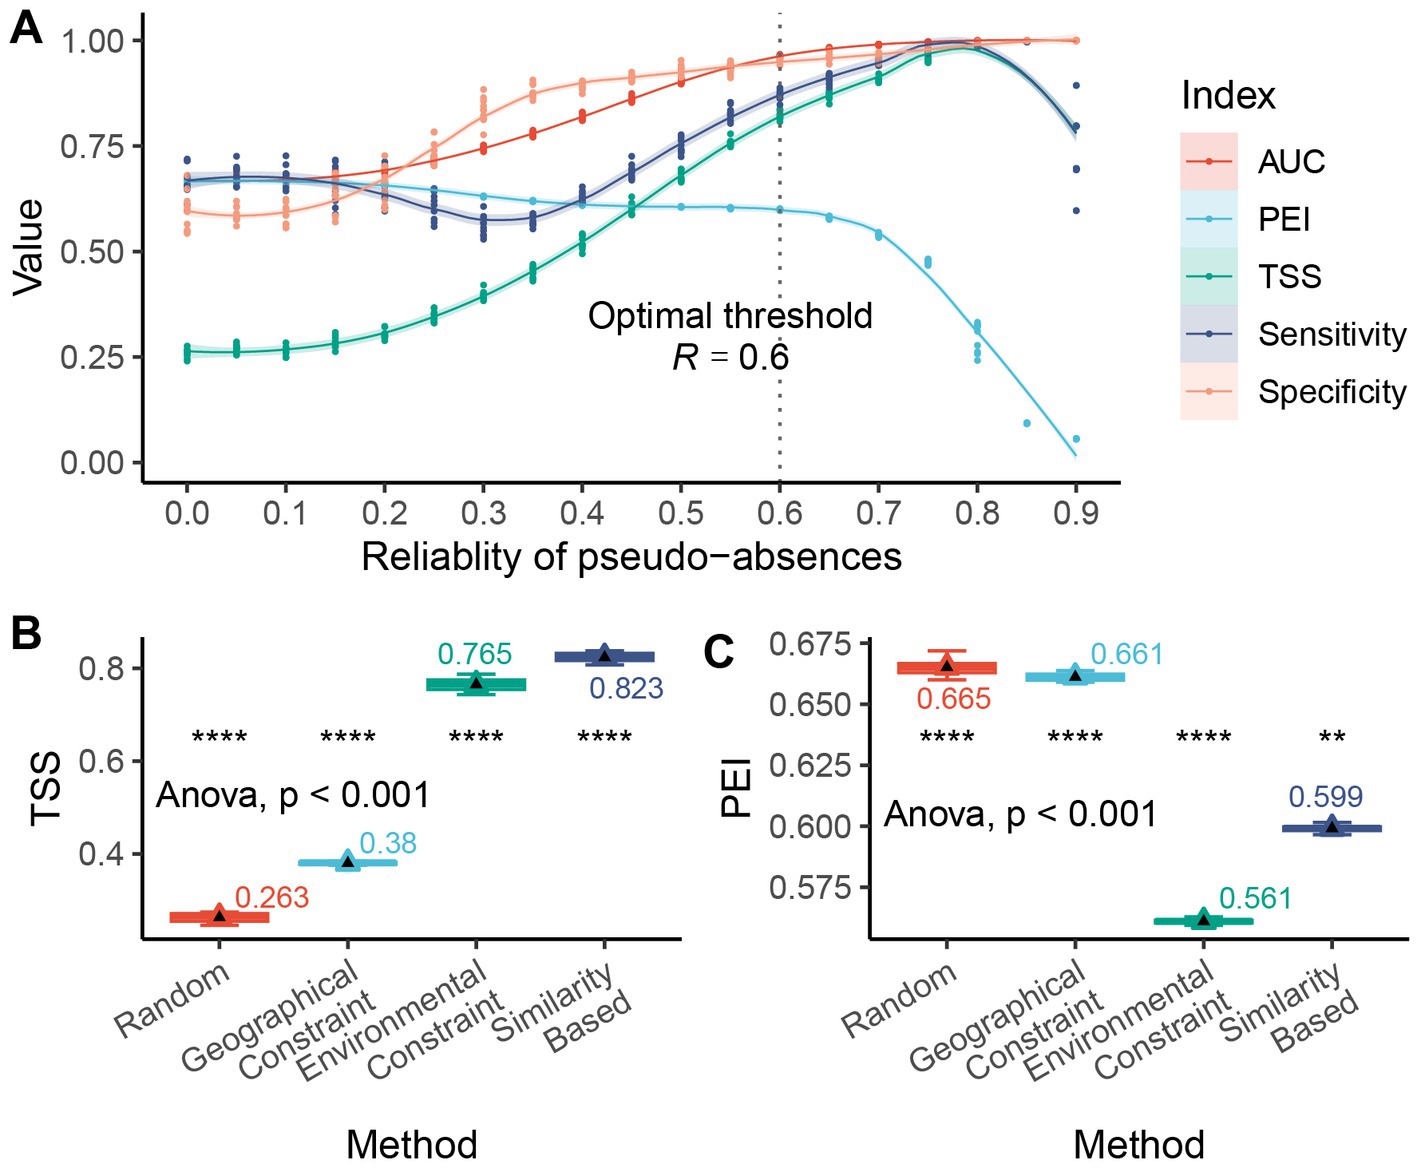
Figure 5. The selection of different pseudo-absence methods influenced the modeling accuracy of the A. adenophora distribution model. (A) Model accuracy (discrimination, calculated based on pseudo-absences and 300 presences) varies with the reliability threshold in the A. adenophora distribution model; (B) Comparison of the accuracy (TSS) of different pseudo-absence selection methods in the A. adenophora distribution model; (C) Comparison of the prediction efficiency (PEI) of different pseudo-absence selection methods in the A. adenophora distribution model. Differences in means were tested using T-test and ANOVA, respectively. The symbols “*”, “**”, “***”, and “****” represent significant p-values less than 0.05, 0.01, 0.001, and 0.0001, respectively.
The selection of different pseudo-absence methods influenced the accuracy of the A. adenophora distribution model (Figures 5B,C). The environmental constraint and similarity methods substantially improved the modeling accuracy of TSS compared to the random and geographical constraint methods; however, these approaches resulted in a decrease in the PEI. The similarity method achieved a higher PEI than the environment-constrained method. Overall, the similarity method produced models with higher prediction accuracy and efficiency. The pseudo-absence sampling method, based on geographic similarity, has demonstrated notable advantages in terms of both model performance and accuracy. It exhibits greater stability in striking a balance between avoiding overestimation and making accurate predictions.
3.2. Virtual species distribution simulation
For the virtual SDMs (Figure 6), the pseudo-absence selection based on similarity achieved the best accuracy (TSS) and ecological realism (D) across different sample sizes (Figure 6A). The similarity method achieved the highest accuracy and most realistic representation of ecological niches, even for species with different distributions and prevalence rates (Figure 6B). For species with a higher prevalence, the environmentally constrained methods performed slightly higher in accuracy (TSS) but lower in ecological veracity than the similarity methods. Notably, although the ecological realism (D) attained by the similarity method was slightly lower than that of the random method under unbiased conditions, bias did not significantly affect the high accuracy (TSS) achieved by the similarity method (Figure 6C). Overall, compared with traditional approaches, pseudo-absence based on the similarity method yielded better model performance under various conditions.
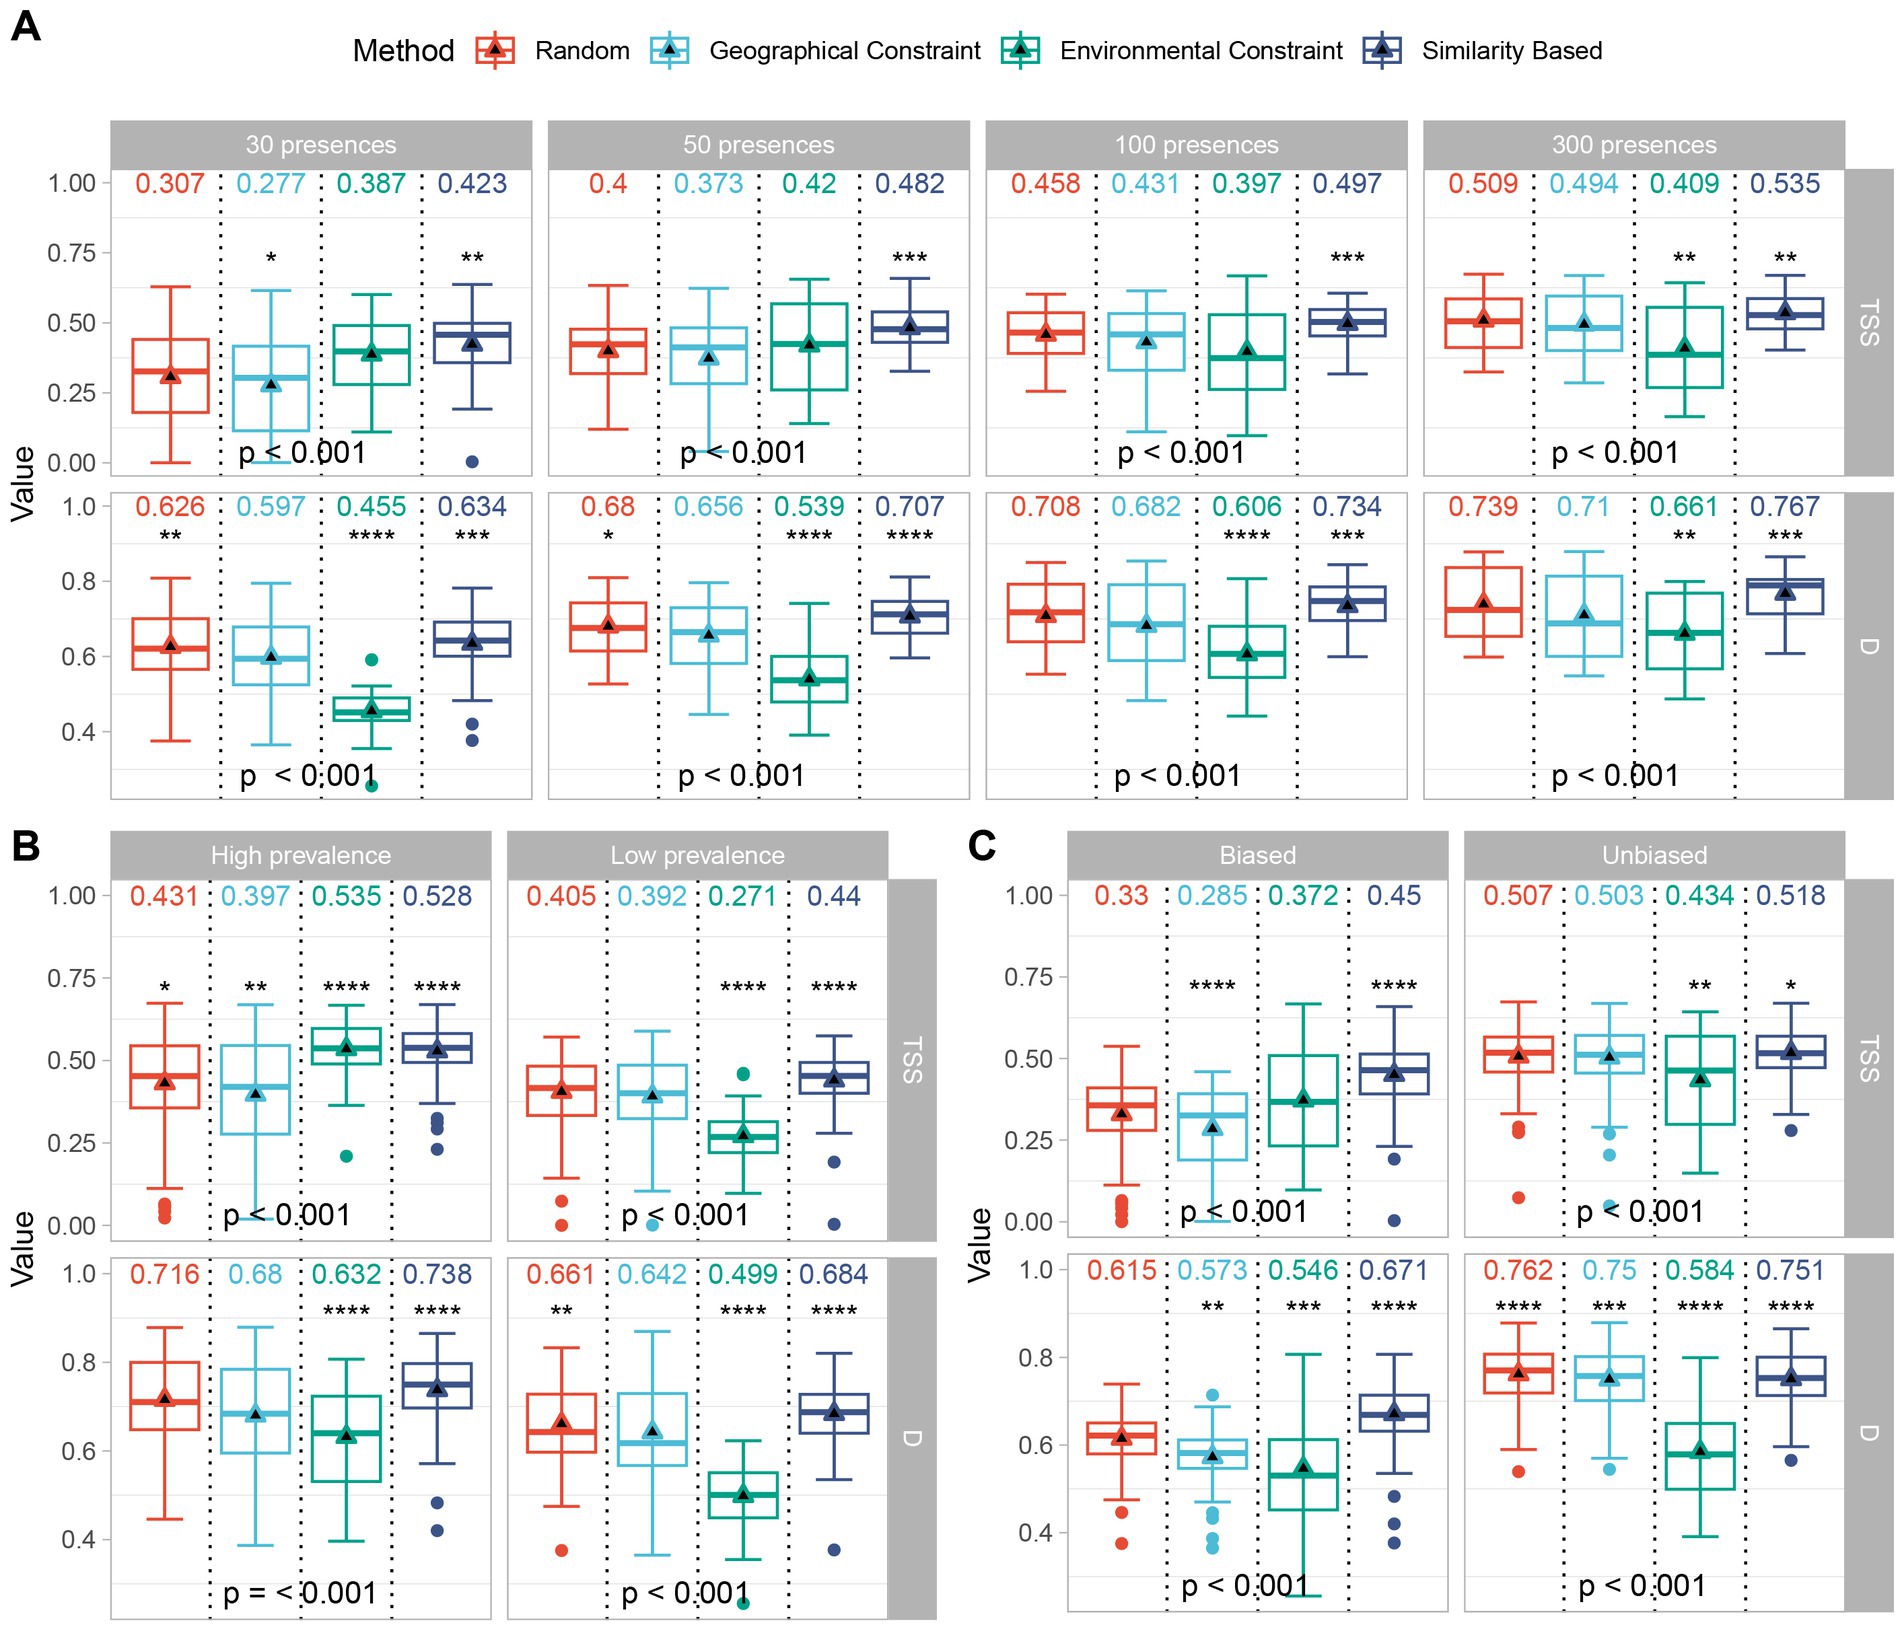
Figure 6. Performance (calculated based on known potential distributions) of different pseudo-absence methods in virtual species distribution models. Model accuracy (TSS) and ecological realism (D) for different pseudo-absence methods with different sample sizes (A), prevalences (B), and biases (C); differences in means were tested using T-test and ANOVA, respectively. The symbols “*”, “**”, “***”, and “****” represent significant p-values less than 0.05, 0.01, 0.001, and 0.0001, respectively.
4. Discussion
4.1. The significance of quantifying pseudo-absence reliability and its implications in the distribution modeling of species
The results of the A. adenophora distribution model highlight the significant influence of the reliability threshold for pseudo-absence data on model quality. Increasing the reliability threshold improved both model discrimination (AUC) and prediction accuracy (TSS or sensitivity). However, it is important to exercise caution, as excessively high thresholds can lead to overprediction and confusion, reminiscent of the “no elephants in Antarctica” scenario (Figure 4C).
When the reliability of the pseudo-absence data was relatively low, the resulting geographic representation was extensive but resulted in a significant number of false absences, leading to lower model accuracy, particularly in terms of sensitivity. The model predictions resembled those of the random method and were restricted to a narrow range in the presence of known species. Consequently, the identification of potential species distribution areas was ineffective, despite the relatively high PEI values. Moderate reliability thresholds strike a balance by considering geographic representations, while filtering out false absences. This improved the modeling accuracy and alleviated underestimation, while maintaining high prediction efficiency. High reliability thresholds restricted pseudo-absence sampling to areas that were highly unfavorable for species survival. Consequently, the model can accurately distinguish between presence and absence, yielding high accuracy. However, such data only represent a limited geographic environment within non-invasive areas (extremely unfavorable places for the survival of a species), failing to capture the full complexity of the environment in those areas. Consequently, more spatial areas were classified as potential distribution areas for the invasive species, resulting in a lower PEI. Therefore, it is crucial to determine an appropriate reliability threshold to achieve optimal prediction effectiveness and accuracy.
The above process demonstrates that quantifying the reliability of pseudo-absence data using similarity represents a data-driven guideline for sampling reasonable pseudo-absence data. This approach provides valuable insight for future studies aimed at collecting reliable pseudo-absence data. To identify the optimal sampling threshold, we focused on the principle of accurately predicting species presence within smaller areas where possible. Our goal was to maximize both the sensitivity and PEI; therefore, we employed the concept of environmental similarity to species presence, interpreted as a measure of the uncertainty associated with pseudo-absences (Buisson et al., 2010). This concept guided the selection of pseudo-absences, ensuring the reliability of the sampling approach.
4.2. The effectiveness of pseudo-absence data obtained via the geographic similarity method
Validation of the virtual SDM demonstrated the effectiveness of pseudo-absences based on similarity, which yielded significant improvements. The random method underestimates the distribution of species, especially with small sample sizes, resulting in low sensitivity. The environmental constraint approach sacrifices specificity to enhance sensitivity, as such method need to occupy more realistic absence sites to correctly predict presence sites (low PEI). The geographic constraint approach lies between the two, behaving like the random method when using short distances and resembling the environmental constraint method when using long distances.
In contrast to these approaches, the PEI enables a better balance between sensitivity and specificity within the similarity method. Similar to the trend observed for specificity, the PEI decreased as reliability increased. Because true absences are lacking, and true specificity cannot be calculated, maximizing the PEI and sensitivity can be viewed as a variation of maximizing specificity and sensitivity, namely, maximizing TSS, which has been shown to generate the most accurate distribution predictions. Thus, the similarity method achieved the highest precision in the virtual SDM.
Our findings confirm those of previous studies that obtained a reliable representation of the potential distribution of a species using pseudo-absences located near the external boundaries of the environmental niche occupied by that species (Chefaoui and Lobo, 2008; Lobo et al., 2010). Compared to traditional methods, the similarity method provides a more reasonable determination of this range. By considering the implications of quantifying pseudo-absence reliability and the effectiveness of the geographic similarity method, we gain valuable insights into improving the distribution modeling of species. These findings have important implications for conservation, invasive species management, and ecological research. Understanding the impact of pseudo-absence data reliability on model performance allows informed decisions when selecting appropriate thresholds and sampling methods.
4.3. Conclusion and further efforts
Our study introduced a novel method that utilizes geographic similarity to obtain representative pseudo-absence data for the distribution modeling of invasive species. By considering the relationship between species distribution and the geographic environment, we quantified the reliability of pseudo-absence data and predicted the distribution of the invasive plant A. adenophora in Yunnan Province, China. This approach was further validated using virtual species. Our analysis demonstrates that the similarity-based method enhances the representativeness of pseudo-absence data and improves predictive accuracy. This has important implications for conservation management, ensuring effective protection of rare species and management of invasive species. By quantifying the pseudo-absence reliability and incorporating geographic constraints, our approach improves the accuracy and reliability of SDMs, providing valuable information for conservation planning and biodiversity assessments. However, addressing the potential spatial bias in the sample data remains a challenge that requires further consideration and ongoing efforts to improve spatial representation. In conclusion, our research highlights the importance of quantifying pseudo-absence reliability and demonstrates the effectiveness of the geographic similarity method in the distribution modeling of species, offering insights for biodiversity conservation and management strategies. Future studies should validate and explore these approaches in different ecological contexts to advance our understanding of species-environment relationships and conservation efforts.
Data availability statement
The original contributions presented in the study are included in the article/Supplementary material, further inquiries can be directed to the corresponding author.
Author contributions
XW, QX, and JL conceived and designed the experiments. XW performed all experiments, analyzed the data, and wrote the manuscript. All authors contributed to the article and approved the submitted version.
Funding
Funding was provided by the National Natural Science Fund of China (Grant Nos. 42161065 and 41461038) and Graduate Research Innovation Fund of Yunnan Normal University.
Acknowledgments
The authors would like to express their sincere gratitude to the editors and reviewers who invested considerable time and effort into their comments on this paper. The authors have gained useful insights from and would like to express their sincere gratitude to Prof. A-Xing Zhu for his lecture “Condensation of scientific problems and writing of SCI papers and grant projects”. They would also like to thank Editage (www.editage.cn) for English language editing.
Conflict of interest
The authors declare that the research was conducted in the absence of any commercial or financial relationships that could be construed as a potential conflict of interest.
Publisher’s note
All claims expressed in this article are solely those of the authors and do not necessarily represent those of their affiliated organizations, or those of the publisher, the editors and the reviewers. Any product that may be evaluated in this article, or claim that may be made by its manufacturer, is not guaranteed or endorsed by the publisher.
Supplementary material
The Supplementary material for this article can be found online at: https://www.frontiersin.org/articles/10.3389/fevo.2023.1193602/full#supplementary-material
References
Allouche, O., Tsoar, A., and Kadmon, R. (2006). Assessing the accuracy of species distribution models: prevalence, kappa and the true skill statistic (TSS): Assessing the accuracy of distribution models. J. Appl. Ecol. 43, 1223–1232. doi: 10.1111/j.1365-2664.2006.01214.x
Barbet-Massin, M., Jiguet, F., Albert, C. H., and Thuiller, W. (2012). Selecting pseudo-absences for species distribution models: how, where and how many? Methods Ecol. Evol. 3, 327–338. doi: 10.1111/j.2041-210X.2011.00172.x
Blackburn, T. M., Bellard, C., and Ricciardi, A. (2019). Alien versus native species as drivers of recent extinctions. Front. Ecol. Environ. 17, 203–207. doi: 10.1002/fee.2020
Booth, T. H., Nix, H. A., Busby, J. R., and Hutchinson, M. F. (2014). BIOCLIM: the first species distribution modelling package, its early applications and relevance to most current MAXENT studies. Divers Distrib. 20, 1–9. doi: 10.1111/ddi.12144
Broennimann, O., Fitzpatrick, M. C., Pearman, P. B., Petitpierre, B., Pellissier, L., Yoccoz, N. G., et al. (2012). Measuring ecological niche overlap from occurrence and spatial environmental data: Measuring niche overlap. Glob. Ecol. Biogeogr. 21, 481–497. doi: 10.1111/j.1466-8238.2011.00698.x
Brotons, L., Thuiller, W., Araújo, M. B., and Hirzel, A. H. (2004). Presence-absence versus presence-only modelling methods for predicting bird habitat suitability. Ecography 27, 437–448. doi: 10.1111/j.0906-7590.2004.03764.x
Buisson, L., Thuiller, W., Casajus, N., Lek, S., and Grenouillet, G. (2010). Uncertainty in ensemble forecasting of species distribution. Glob. Chang. Biol. 16, 1145–1157. doi: 10.1111/j.1365-2486.2009.02000.x
Chefaoui, R. M., and Lobo, J. M. (2008). Assessing the effects of pseudo-absences on predictive distribution model performance. Ecol. Model. 210, 478–486. doi: 10.1016/j.ecolmodel.2007.08.010
Elith, J., Graham, C. H., Anderson, R., Dudík, M., Ferrier, S., Guisan, A., et al. (2006). Novel methods improve prediction of species’ distributions from occurrence data. Ecography 29, 129–151. doi: 10.1111/j.2006.0906-7590.04596.x
Elith, J., and Leathwick, J. (2007). Predicting species distributions from museum and herbarium records using multiresponse models fitted with multivariate adaptive regression splines. Divers. Distrib. 13, 265–275. doi: 10.1111/j.1472-4642.2007.00340.x
Elith, J., and Leathwick, J. R. (2009). Species Distribution Models: Ecological Explanation and Prediction Across Space and Time. Annu. Rev. Ecol. Evol. Syst. 40, 677–697. doi: 10.1146/annurev.ecolsys.110308.120159
Engler, R., Guisan, A., and Rechsteiner, L. (2004). An improved approach for predicting the distribution of rare and endangered species from occurrence and pseudo-absence data. J. Appl. Ecol. 41, 263–274. doi: 10.1111/j.0021-8901.2004.00881.x
Farber, O., and Kadmon, R. (2003). Assessment of alternative approaches for bioclimatic modeling with special emphasis on the Mahalanobis distance. Ecol. Model. 160, 115–130. doi: 10.1016/S0304-3800(02)00327-7
Fick, S. E., and Hijmans, R. J. (2017). WorldClim 2: new 1-km spatial resolution climate surfaces for global land areas. Int. J. Climatol. 37, 4302–4315. doi: 10.1002/joc.5086
Freeman, E. A., and Moisen, G. (2008). PresenceAbsence: An R Package for Presence Absence Analysis. J. Stat. Softw. 23, 1–31. doi: 10.18637/jss.v023.i11
García-Roselló, E., Guisande, C., González-Vilas, L., González-Dacosta, J., Heine, J., Pérez-Costas, E., et al. (2019). A simple method to estimate the probable distribution of species. Ecography 42, 1613–1622. doi: 10.1111/ecog.04563
Guisan, A., Lehmann, A., Ferrier, S., Austin, M., Overton, J. M., Aspinall, R., et al. (2006). Making better biogeographical predictions of species’ distributions. J. Appl. Ecol. 43, 386–392. doi: 10.1111/j.1365-2664.2006.01164.x
Guisan, A., and Thuiller, W. (2005). Predicting species distribution: offering more than simple habitat models. Ecol. Lett. 8, 993–1009. doi: 10.1111/j.1461-0248.2005.00792.x
Hirzel, A. H., Helfer, V., and Metral, F. (2001). Assessing habitat-suitability models with a virtual species. Ecol. Model. 145, 111–121. doi: 10.1016/S0304-3800(01)00396-9
Hortal, J., Lobo, J. M., and Jiménez-Valverde, A. (2007). Limitations of Biodiversity Databases: Case Study on Seed-Plant Diversity in Tenerife, Canary Islands. Conserv. Biol. 21, 853–863. doi: 10.1111/j.1523-1739.2007.00686.x
Iturbide, M., Bedia, J., Herrera, S., del Hierro, O., Pinto, M., and Gutiérrez, J. M. (2015). A framework for species distribution modelling with improved pseudo-absence generation. Ecol. Model. 312, 166–174. doi: 10.1016/j.ecolmodel.2015.05.018
Jiménez-Valverde, A., and Lobo, J. M. (2007). Threshold criteria for conversion of probability of species presence to either–or presence–absence. Acta Oecol. 31, 361–369. doi: 10.1016/j.actao.2007.02.001
Leroy, B., Meynard, C. N., Bellard, C., and Courchamp, F. (2016). virtualspecies, an R package to generate virtual species distributions. Ecography 39, 599–607. doi: 10.1111/ecog.01388
Liu, Q., Xu, J., Jiang, R., and Wong, W. H. (2021). Density estimation using deep generative neural networks. Proc. Natl. Acad. Sci. U.S.A. 118:e2101344118. doi: 10.1073/pnas.2101344118
Lobo, J. M. (2008). More complex distribution models or more representative data? Biodiv. Inf. 5, 14–19. doi: 10.17161/bi.v5i0.40
Lobo, J. M., Jiménez-Valverde, A., and Hortal, J. (2010). The uncertain nature of absences and their importance in species distribution modelling. Ecography 33, 103–114. doi: 10.1111/j.1600-0587.2009.06039.x
Lobo, J. M., Jiménez-Valverde, A., and Real, R. (2008). AUC: a misleading measure of the performance of predictive distribution models. Glob. Ecol. Biogeogr. 17, 145–151. doi: 10.1111/j.1466-8238.2007.00358.x
Lobo, J. M., and Tognelli, M. F. (2011). Exploring the effects of quantity and location of pseudo-absences and sampling biases on the performance of distribution models with limited point occurrence data. J. Nat. Conserv. 19, 1–7. doi: 10.1016/j.jnc.2010.03.002
Meynard, C. N., Leroy, B., and Kaplan, D. M. (2019). Testing methods in species distribution modelling using virtual species: what have we learnt and what are we missing? Ecography 42, 2021–2036. doi: 10.1111/ecog.04385
Peterson, A. T., Navarro-Sigüenza, A. G., and Gordillo, A. (2018). Assumption-versus data-based approaches to summarizing species’ ranges. Conserv. Biol. 32, 568–575. doi: 10.1111/cobi.12801
Phillips, S. J., Dudík, M., Elith, J., Graham, C. H., Lehmann, A., Leathwick, J., et al. (2009). Sample selection bias and presence-only distribution models: implications for background and pseudo-absence data. Ecol. Appl. 19, 181–197. doi: 10.1890/07-2153.1
Pyšek, P., Jarošík, V., Hulme, P. E., Pergl, J., Hejda, M., Schaffner, U., et al. (2012). A global assessment of invasive plant impacts on resident species, communities and ecosystems: the interaction of impact measures, invading species’ traits and environment. Glob. Chang. Biol. 18, 1725–1737. doi: 10.1111/j.1365-2486.2011.02636.x
R Core Team (2022). R: A Language and Environment for Statistical Computing. Vienna, Austria: R Foundation for Statistical Computing.
Rocchini, D., Hortal, J., Lengyel, S., Lobo, J. M., Jiménez-Valverde, A., Ricotta, C., et al. (2011). Accounting for uncertainty when mapping species distributions: The need for maps of ignorance. Progr Phys Geograph 35, 211–226. doi: 10.1177/0309133311399491
Schoener, T. W. (1968). The Anolis Lizards of Bimini: Resource Partitioning in a Complex Fauna. Ecology 49, 704–726. doi: 10.2307/1935534
Senay, S. D., Worner, S. P., and Ikeda, T. (2013). Novel Three-Step Pseudo-Absence Selection Technique for Improved Species Distribution Modelling. PLoS One 8:e71218. doi: 10.1371/journal.pone.0071218
Smith, A. B., Santos, M. J., Koo, M. S., Rowe, K. M. C., Rowe, K. C., Patton, J. L., et al. (2013). Evaluation of species distribution models by resampling of sites surveyed a century ago by Joseph Grinnell. Ecography 36, 1017–1031. doi: 10.1111/j.1600-0587.2013.00107.x
Stockwell, D. (1999). The GARP modelling system: problems and solutions to automated spatial prediction. Int. J. Geogr. Inf. Sci. 13, 143–158. doi: 10.1080/136588199241391
Tessarolo, G., Lobo, J. M., Rangel, T. F., and Hortal, J. (2021). High uncertainty in the effects of data characteristics on the performance of species distribution models. Ecol. Indic. 121:107147. doi: 10.1016/j.ecolind.2020.107147
Tocchio, L. J., Gurgel-Gonçalves, R., Escobar, L. E., and Peterson, A. T. (2015). Niche similarities among white-eared opossums (Mammalia, Didelphidae): Is ecological niche modelling relevant to setting species limits? Zool. Scr. 44, 1–10. doi: 10.1111/zsc.12082
VanDerWal, J., Shoo, L. P., Graham, C., and Williams, S. E. (2009). Selecting pseudo-absence data for presence-only distribution modeling: How far should you stray from what you know? Ecol. Model. 220, 589–594. doi: 10.1016/j.ecolmodel.2008.11.010
Velazco, S. J. E., Rose, M. B., de Andrade, A. F. A., Minoli, I., and Franklin, J. (2022). FLEXSDM: An R package for supporting a comprehensive and flexible species distribution modelling workflow. Methods Ecol. Evol. 13, 1661–1669. doi: 10.1111/2041-210X.13874
Warren, D. L., Matzke, N. J., Cardillo, M., Baumgartner, J. B., Beaumont, L. J., Turelli, M., et al. (2021). ENMTools 1.0: an R package for comparative ecological biogeography. Ecography 44, 504–511. doi: 10.1111/ecog.05485
Wisz, M. S., and Guisan, A. (2009). Do pseudo-absence selection strategies influence species distribution models and their predictions? An information-theoretic approach based on simulated data. BMC Ecol. 9:8. doi: 10.1186/1472-6785-9-8
Wisz, M. S., Hijmans, R. J., Li, J., Peterson, A. T., Graham, C. H., Guisan, A., et al. (2008). Effects of sample size on the performance of species distribution models. Divers. Distrib. 14, 763–773. doi: 10.1111/j.1472-4642.2008.00482.x
Xian, X., Zhao, H., Wang, R., Zhang, H., Chen, B., Liu, W., et al. (2023). Evidence of the niche expansion of crofton weed following invasion in China. Ecol. Evol. 13:e9708. doi: 10.1002/ece3.9708
Xu, Q., Li, W., Liu, J., and Wang, X. (2023a). A geographical similarity-based sampling method of non-fire point data for spatial prediction of forest fires. Forest Ecosyst 10:100104. doi: 10.1016/j.fecs.2023.100104
Xu, Q., Wang, Q., Liu, J., and Liang, H. (2021). Simulation of Land-Use Changes Using the Partitioned ANN-CA Model and Considering the Influence of Land-Use Change Frequency. IJGI 10:346. doi: 10.3390/ijgi10050346
Xu, Q., Zhu, A.-X., and Liu, J. (2023b). Land-use change modeling with cellular automata using land natural evolution unit. Catena 224:106998. doi: 10.1016/j.catena.2023.106998
Zaniewski, A. E., Lehmann, A., and Overton, J. M. (2002). Predicting species spatial distributions using presence-only data: a case study of native New Zealand ferns. Ecol. Model. 157, 261–280. doi: 10.1016/S0304-3800(02)00199-0
Zhang, L., Ma, Y., Li, H., Liu, W., Cao, Z., and Zhang, Q. (2007). Patterns of Eupatorium adenophorum along roadsides in Lincang region, Yunnan province, China. Ecol Environ Sci. 16, 516–522. doi: 10.16258/j.cnki.1674-5906.2007.02.050
Zhu, A. X., Liu, J., Du, F., Zhang, S. J., Qin, C. Z., Burt, J., et al. (2015). Predictive soil mapping with limited sample data: PSM using limited samples. Eur. J. Soil Sci. 66, 535–547. doi: 10.1111/ejss.12244
Zhu, A., Lu, G., Liu, J., Qin, C., and Zhou, C. (2018). Spatial prediction based on Third Law of Geography. Ann. GIS 24, 225–240. doi: 10.1080/19475683.2018.1534890
Keywords: species distribution modeling, biological invasion, pseudo-absence, absence, representation
Citation: Wang X, Xu Q and Liu J (2023) Determining representative pseudo-absences for invasive plant distribution modeling based on geographic similarity. Front. Ecol. Evol. 11:1193602. doi: 10.3389/fevo.2023.1193602
Edited by:
Paulo A. V. Borges, University of the Azores, PortugalReviewed by:
Gabor Pozsgai, University of the Azores, PortugalMarco Girardello, Joint Research Centre, Italy
Copyright © 2023 Wang, Xu and Liu. This is an open-access article distributed under the terms of the Creative Commons Attribution License (CC BY). The use, distribution or reproduction in other forums is permitted, provided the original author(s) and the copyright owner(s) are credited and that the original publication in this journal is cited, in accordance with accepted academic practice. No use, distribution or reproduction is permitted which does not comply with these terms.
*Correspondence: Quanli Xu, Z28yaGFwcGluZXNzQDE2My5jb20=