 Zhiqian Zuo
 Yanzhao Yang2,3,4
95% of researchers rate our articles as excellent or good
Learn more about the work of our research integrity team to safeguard the quality of each article we publish.
Find out more
ORIGINAL RESEARCH article
Front. Ecol. Evol. , 22 June 2023
Sec. Urban Ecology
Volume 11 - 2023 | https://doi.org/10.3389/fevo.2023.1192952
This article is part of the Research Topic Evaluation of Urban Ecological Security and Measurement of Urban Ecological Resilience View all 18 articles
Under a background of uncoordinated economic development and the ecological environment, quantifying the ecological effect brought by land resource changes, have become research key and hotspots. To explore land use change and its impact on ecosystem service value (ESV), the land use change analysis method, ecosystem service evaluation model, flow direction analysis model and two-dimensional graph theory clustering method were used to analyze the profit and loss of ESV in Qiqihar in 2010 and 2020 and the division of ecological function areas with counties as units. The results show that: 1) The land use change in Qiqihar city is more obvious, Among them, the area of cultivated land, wetland, construction land and other increases, Woodland, grassland, water area decreased, The changed land area accounts for 30.95% of the total area; 2) The ESV in Qiqihar city increased by 869 million yuan, The sum of the value of cultivated land and wetland exceeded 70.0% of the ESV, is the main source of ESV in Qiqihar city; 3) Not all land-use shifts are conducive to ESV growth. The increase of ESV mainly comes from the flow of cultivated land and grassland to the wetland; Conversion of woodlands, water area, wetlands to other types causes ESV loss, the most loss is the conversion of wetlands to cultivated land; 4) Qiqihar city is divided into the central wetland ecological conservation area, the western characteristic agriculture and dotted wetland ecological function area, and the northeast agricultural ecological environment construction functional area. Three policies were proposed to improve ESV:(1) give play to the radiation role of wetland nature reserves; (2) popularize the black land protection technology model; and (3) prevent and control agricultural non-point source pollution and promote clean agriculture.
The concept of Lucid Waters and Lush Mountains Are Invaluable Assets has been deeply rooted in the hearts of the people since the 18th National Congress of the CPC. Green has become increasingly important for high-quality development. The construction of ecological civilization has a bearing on the well-being of the people and the future of the nation. Realizing ecological sustainable development has become the focus of the world. ESV, a hot topic of sustainable development, has been widely regarded by researchers as one of the main indicators to evaluate ecological and environmental changes (Le, 2022; Zhang J. et al., 2022). Ecosystem service function refers to various benefits that humans can directly or indirectly obtain from the ecosystem (Costanza et al., 1997). They are usually divided into four categories: supply, regulation, support, and culture (Swallow et al., 2009). Land use change changes the structure of the land ecosystem (Zhang X et al., 2022), which is an important part of the ecosystem. It also affects the ecosystem service function and ESV (Li et al., 2020; Xie et al., 2020; Yuan et al., 2021). Therefore, ESV research based on land use can grasp the spatiotemporal pattern of regional land use change and its impact on ESV and provide a theoretical basis and reference for ecological construction.
Researchers have made rich achievements in studying ecosystem services (Le, 2022) in recent years. Costanza (Costanza et al., 1997) explained the relationship between natural capital and ecological service function in 1997. He also used ESV to measure ecosystem function and represented the impact of different land use changes on ecological service function in the form of monetization. Xie proposed the equivalent factor method (Xie et al., 2003) based on the actual situation in China in 2003. He then supplemented and revised it in 2015 (Xie et al., 2015). Studies on ecosystem service function are analyzed from the perspective of administrative regions (Guo et al., 2001; Li et al., 2009; Mamat et al., 2013; Zhao et al., 2013; Kremer et al., 2016; Gashaw et al., 2018; Ruiz-Sandoval et al., 2019; Solomon et al., 2019; Yu et al., 2022) and natural divisions such as watersheds and urban agglomeration (Liu et al., 2020; Pan et al., 2021; Das et al., 2022; Huang et al., 2022) in terms of research scale.
It mainly includes comprehensive research on the ecosystem and special research on the single ecosystem and service value (Fujii et al., 2017; Schild et al., 2018; Zhang X et al., 2022) in terms of research contents. Most of the existing literature calculates the spatiotemporal evolution of ESV in provinces, cities, and counties. Few of them analyze the flow direction of ESV and study the ecological function zoning of land use according to various ESVs in the county. The gains and losses and zoning of ESV under land use change play an important role in developing and managing differentiated land as well as regional sustainable development. There are few studies on the relatively underdeveloped northeast China at present, especially in the wind-sand, drought-prone, and black-soil areas.
Qiqihar, located in one of the world’s three major Black Soil Belts, is known as the National Granary, which has provided grain production support for Heilongjiang Province and even the whole country. Drastic changes have taken place in land use cover in this region since the 20th century, and land use types are constantly changing. Therefore, the urgency of curbing ecological environment deterioration (Niu et al., 2021; Wen et al., 2021), and the construction and function improvement of the ecosystem have attracted much attention. The study on ESV in Qiqihar has an early time series, and there is a lack of recent studies on ESV and the gain and loss relation between land use change and ESV in this region. The key problem to be solved is to grasp the status quo of land use in Qiqihar, study how the changes of land use types affect the rate of flow and flow direction of ESV in the city, And grouped according to the characteristics of single ESV combination of each unit area in different counties. According to the characteristics of different ecological function zones, reasonable and differentiated implementation and management plans should be formulated. This study used GIS tools to reveal the law of land use change in Qiqihar, analyzed the ESV profit and loss caused by land use change, and based on nine categories of ESV per unit area, 16 counties (cities, districts) were divided into different ecological functional areas. By quantifying the ecological effect brought by land resource changes, it provides theoretical basis and decision support for the improvement of land ecosystem service value, food security and sustainable management of Qiqihar ecosystem.
Qiqihar city (122-126° E, 45-48° N) belongs to Heilongjiang Province, located in the west of Songnen Plain, the intersection of black, Kyrgyzstan and Mongolia provinces. (Figure 1). It is a central city in the northwest region of Northeast China and an important marketable grain base and old industrial base in China. Qiqihar has jurisdiction over 1 city, 8 counties, and 7 districts and covers an area of 42,400 km2. The city has a temperate continental monsoon climate with four distinctive seasons. Annual precipitation is 400-550 mm, and annual evaporation is 500-800 mm, which is greater than precipitation. Qiqihar’s typical black-soil land accounts for 25.4% of the province and 14.2% of the northeast of China. It bears the major political responsibility of ensuring national food security and protecting black-soil cultivated land. The urbanization rate is 48.73%, and the GDP has reached 120.039 billion yuan by the end of 2020. Ecological and environmental problems caused by human production activities have become increasingly prominent with the acceleration of industrial development and urbanization. The water and soil loss is serious, and land desertification and salinization are intensified in the region. Meanwhile, the multiple values and protection of the Black Soil Granary have been neglected for a long time, and the excessive use of land has caused land degradation and quality decline in Qiqihar.
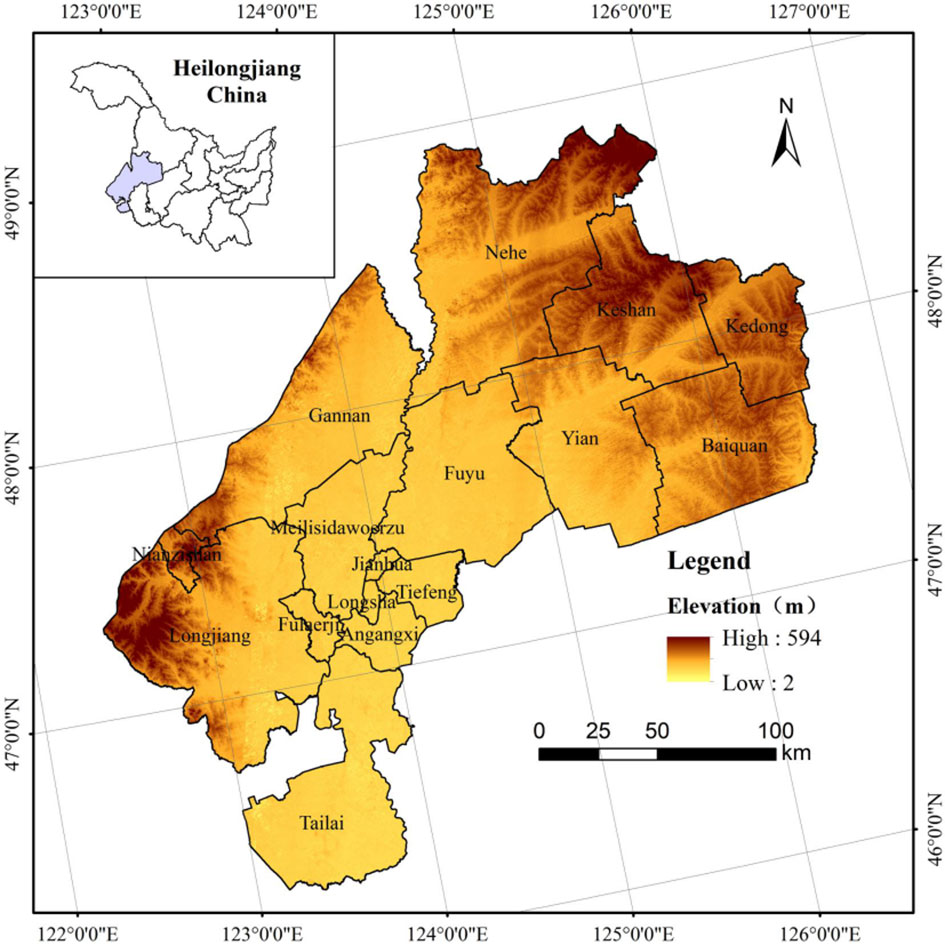
Figure 1 Location and topography of the study area.
Data involved in the work include the following items: (1) Land use classification data of two periods in 2010 and 2020: 1×1 km raster data from Resource and Environment Science and Data Center, Chinese Academy of Sciences (https://www.resdc.cn/). The unused land was classified into marshland and other lands, considering that marshland was an important part of the wetland system and had higher ecological functions. It was combined with the current situation and research objectives of the research area to make the ESV assessment more accurate. Swamp land was classified as a wetland system and other land includes sandy land, saline-alkali soil land, bare land, bare rock, and stony land. The final classification was cultivated land, woodland, grassland, water area, construction land, other lands, and wetland.(2) Two types of vegetation type data in 2010 and 2020 are as follows: 500 × 500 m vegetation net primary productivity (NPP) data came from the MODIS data products provided by NASA’s website (https://modis.gsfc.nasa.gov). It was used in ESV coefficient correction. (3) Meteorological data in 2010 and 2020 are as follows: precipitation data of 1 × 1 km and potential evapotranspiration data of 1× 1 km were provided by National Earth System Science Data Center (http://www.geodata.cn). (4) Social and economic data in 2010 and 2020 are as follows: Yield of food crop, sowing area of cereal crops, and per capita GDP were obtained from Qiqihar Statistical Yearbook, Qiqihar Statistical Bulletin of National Economic and Social Development, and the website of the State Statistical Bureau.
The overlay analysis of the land use type figures of the two periods was carried out based on software ArcGIS10.2. The land transfer matrix and land use change rate (Hemmavanh et al., 2010; Peng et al., 2016) (Table 1) were used to quantitatively study the changing condition of various types of land resources. This was the basis for studying the change in the land use structure and ecosystem service. The land use transfer matrix is a two-dimensional matrix constructed according to the change of the current situation of land use at different research points in the same region. By analyzing the transfer matrix, we can get the mutual transformation between different classes at the end of the period, including the location and area of the change. And the land use change rate refers to the ratio of the changing area of each land use type and the initial area during the study period of the same research area, reflecting the intensity of the change in the same area.
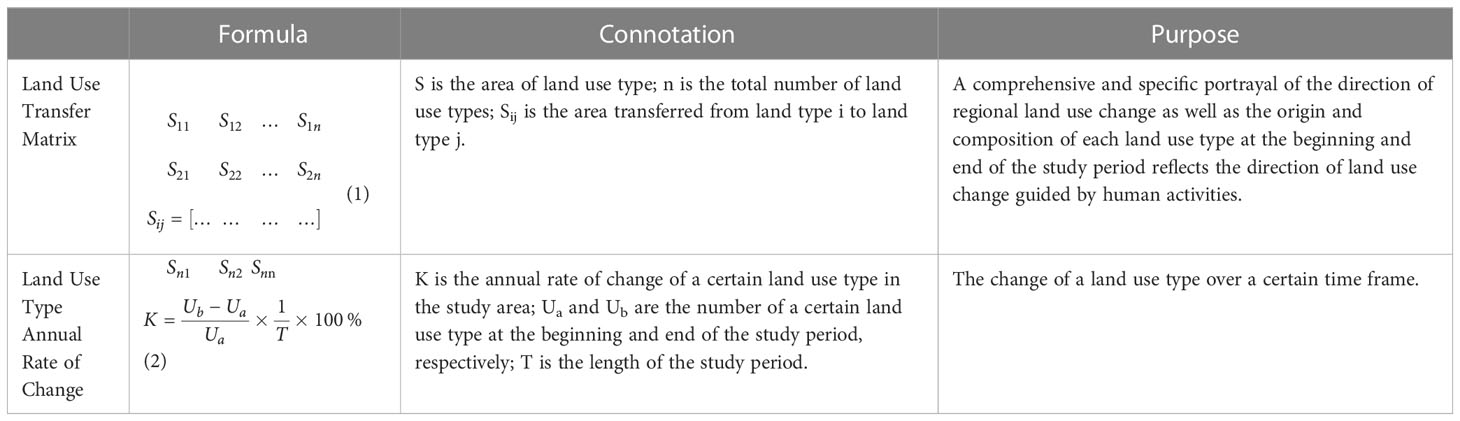
Table 1 Analysis methods of land use change.
The ESV of Qiqihar is calculated using the ecosystem service assessment model based on the relevant theoretical achievements of Costanza et al. (Costanza et al., 1997) and Xie et al. (Xie et al., 2003). The specific formula is as follows:
Where: ESV is ecosystem service value (yuan); Ab is area of bth land use type (ha); VCb is ecosystem service value coefficient per unit area (yuan/ha).
Considering the dynamics of ecosystem service equivalent factor and the degree of ecosystem sustainable development, four correction factors, including the economic value of grain yield per unit area, land use type, biomass factor and economic factor correction, were selected to improve the ESV evaluation model, as shown in Table 2. That is, on the basis of the original ESV evaluation model, the value equivalent scale (Xie et al., 2008),was multiplied by the value of each correction factor to obtain the ESV coefficient table per unit area of Qiqihar City (Table 3).
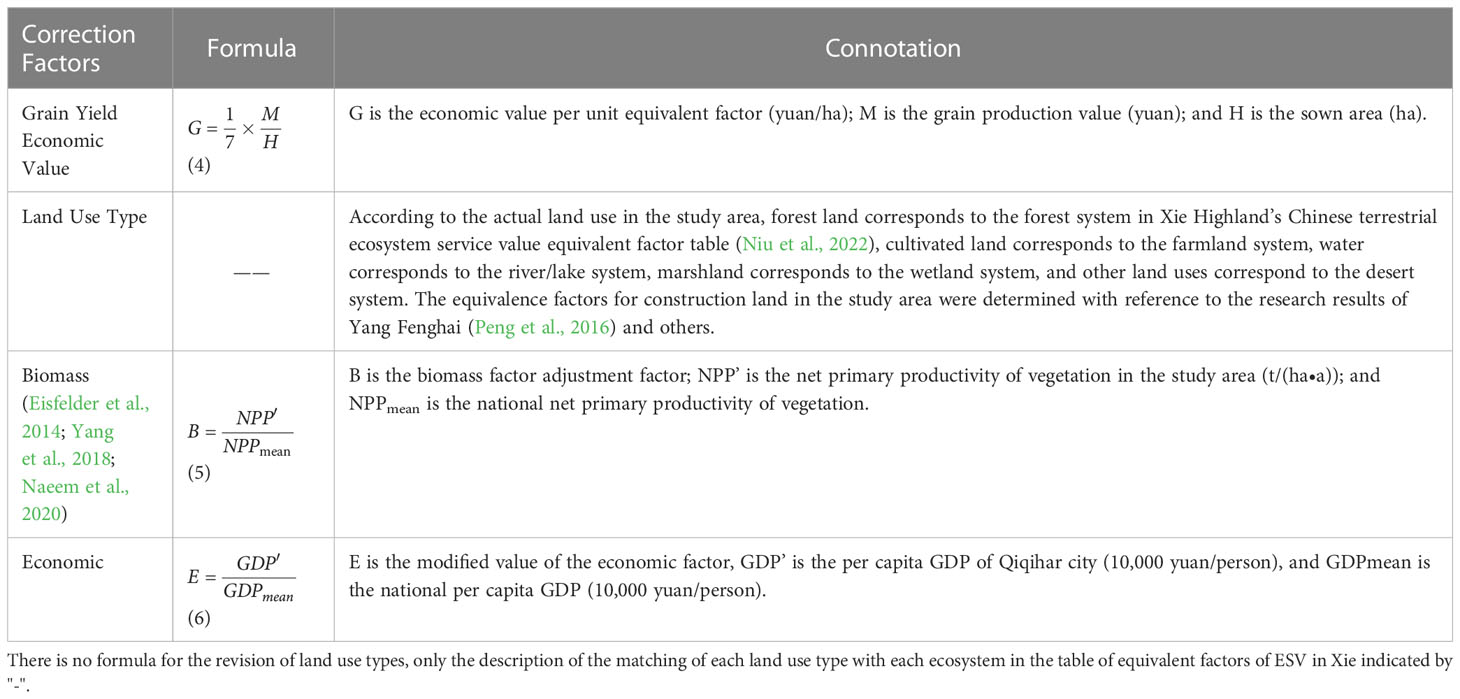
Table 2 ESV assessment model revision.
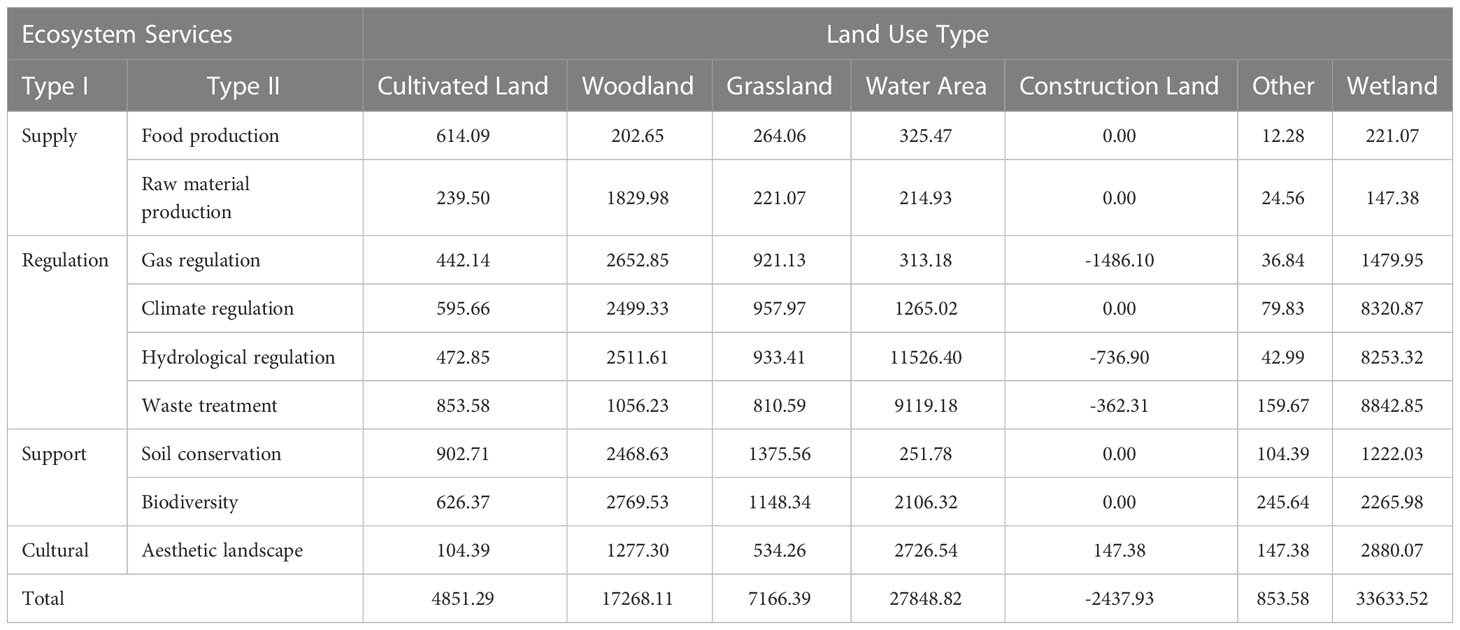
Table 3 ESV coefficients per unit area in Qiqihar(Unit: yuan/ha).
The coefficient of variation is used to quantitatively calculate the dispersion degree of county ESV on time and space scales. It reflects the dispersion degree and sequential variation of the regional gap and is the ratio of the standard deviation of basic data to the mean value of basic data (Sun et al., 2019).
Where: Vc is the coefficient of variation; n is the number of samples; Ki is the county ESV;`K is the mean of county ESV in two periods. The larger the coefficient of variation Vc, the more discrete the time series and the greater the interannual fluctuation of ESV; conversely, the more stable the time series and the smaller the interannual fluctuation of ESV.
The flow analysis model is used to analyze ESV, which reflects the effect of land use type conversion on ESV gains and losses. The calculation formula is as follows (Wang et al., 2022).
Where: PLij is the gain or loss value of ESV after the transfer of land use type i to land use type j (108yuan); VCi and VCj are the ESV coefficients per unit area of land use type i and j, respectively (108yuan/ha); Aij is the area transferred from land use type i to land use type j (ha).
The 2D graph theory clustering method is to study Birds of a Feather Flock Together in mathematical statistics, which is classified according to the degree of similarity of its properties (Wu et al., 2018; Niu et al., 2022). The internal differences and similarities among each zoning unit are considered, while the spatial connectivity between adjacent units and the integrity of the administrative boundaries are ensured by constructing an undirected weighted graph (Kayser et al., 1992; Lu et al., 2017; Wu et al., 2018; Zhang et al., 2020) based on the location relation. The change of ESV driven by land use change is an important quantitative index of ecological effect. The 2D graph theory clustering method based on ecosystem service function utilization can determine the optimal combination of ecological advantages in the best location from the perspective of changing trends in ESV. This can control the direction of land use conversion.
Firstly, 16 counties, urban areas, and districts were determined as zoning units to form a zoning unit set (V). The longitude and latitude of the zoning units were determined by ArcGIS spatial analysis. Then, connect each zoning point and determine the adjacency relation set of each zoning unit by adjacency matrix (E). Secondly, 9 ESVs in the above value equivalent factor table were used as zoning indicators, and the weight of each indicator was determined by the entropy weight method. Each index value was obtained, and the weight matrix was constructed to determine the weight value (D). Next, the undirected connected weighted graph G= (V, E, and D) was formed by considering the spatial connectivity and index similarity between the zoning units. The minimum spanning tree was obtained by the graph theory minimum tree method. The minimum spanning tree was divided into n subtrees to obtain a 2D optimal tree cluster and an appropriate threshold value was selected according to the principle of the subtle difference in the region and obvious difference in the interval. The zoning result was finally obtained after proper adjustment according to the actual situation of the region. List the specific calculation formula (Table 4).
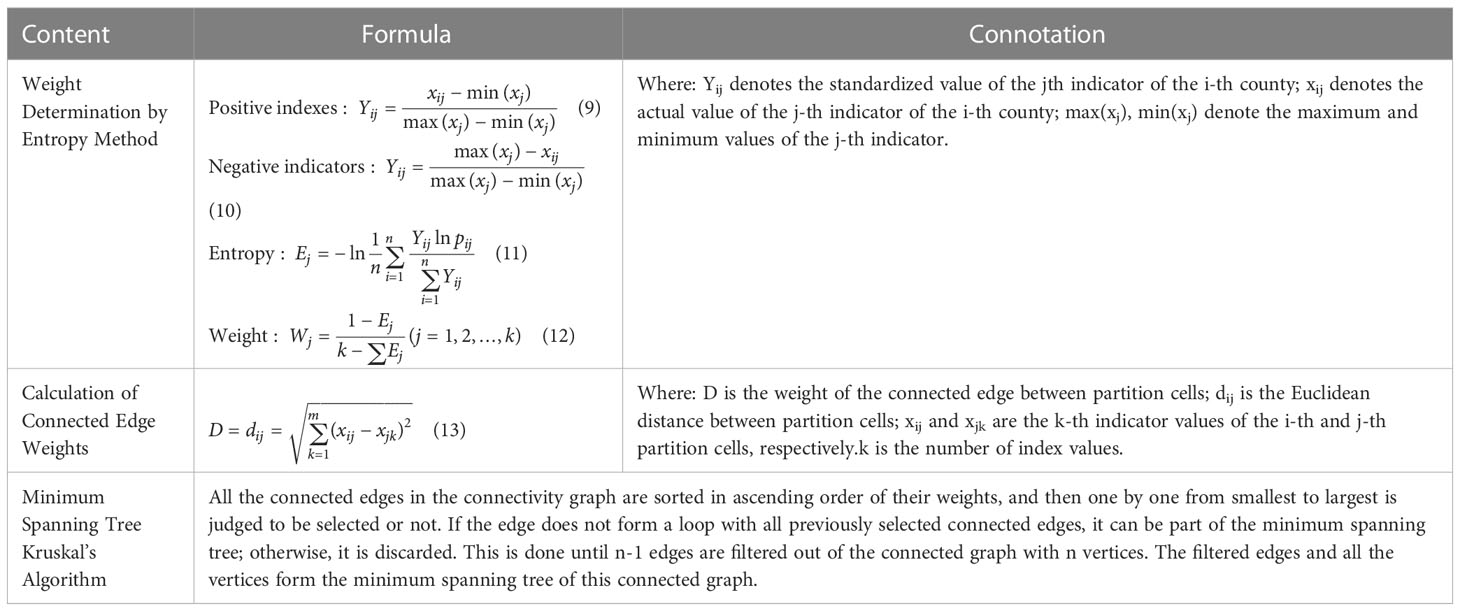
Table 4 Calculation formulae related to ecological function zoning of land use in Qiqihar.
Cultivated land is the main type of land use in Qiqihar and accounts for about 73% of the total area, which is the largest of the seven land use types. The second largest area is the wetland which accounts for about 10% of the total area. The research area mainly includes Zhalong Wetland, Tailai Wetland, and Three wetland Nature Reserves along the River Wetland, Jiangxin Island National Wetland Park, and Fuyulong’an Bridge National Wetland Park. Compared with 2010, significant changes in the land use cover of Qiqihar in 2020 (Figure 2). The most obvious changes are the decreased area of grassland and water and the increased area of cultivated land and wetland.
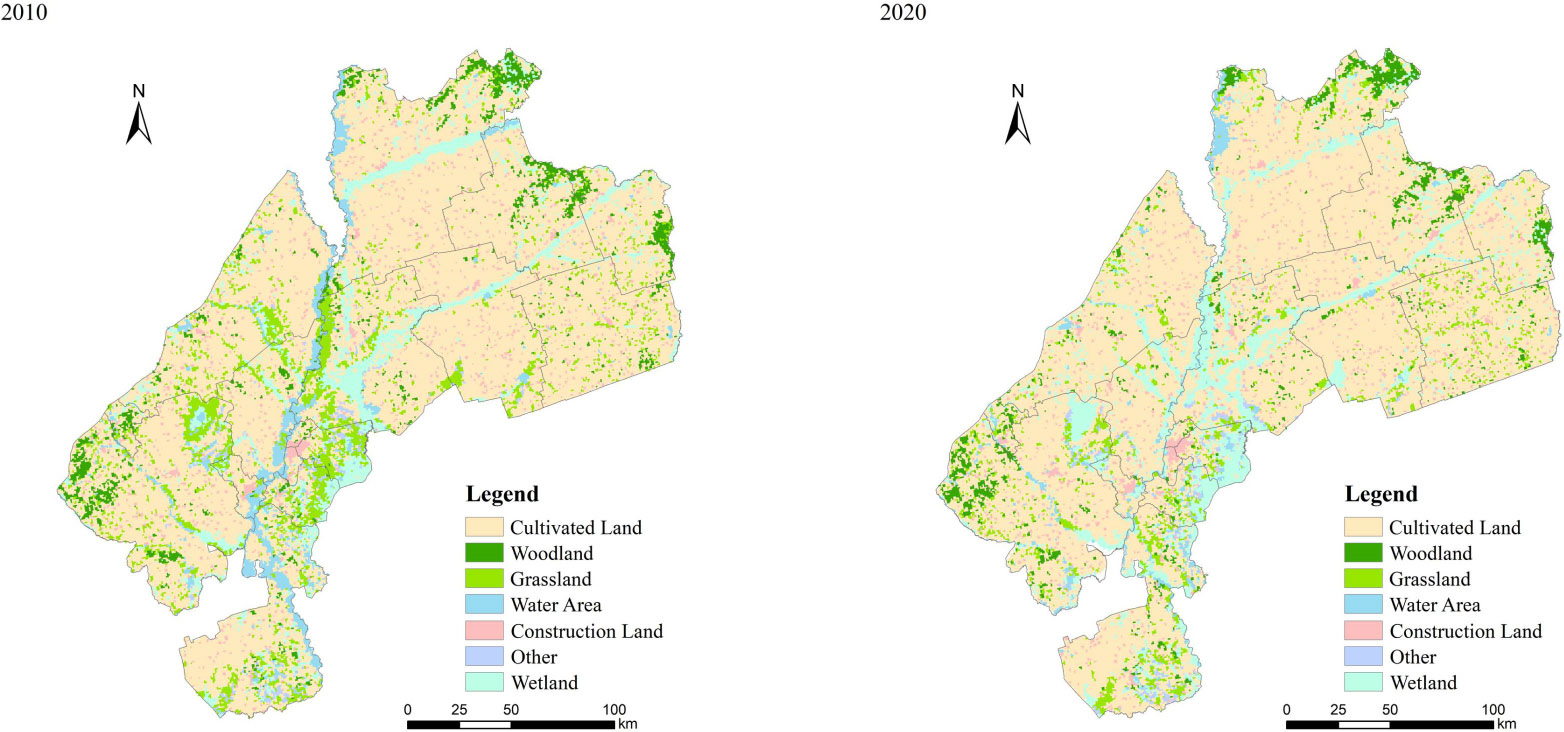
Figure 2 Present land use map of Qiqihar city from 2010 to 2020.
The area of grassland and water area was sharply reduced, and the grassland was reduced by 1,508 km2 (41.83%), with an annual change rate of -4.18% in 2020 compared with 2010. The Three Kinds of Grassland, i.e., desertification, salinization, and degradation, accounted for 70% of the total grassland area. The predatory mode of management has caused serious damage to Qiqihar grassland due to the rapid development of grassland animal husbandry. Hence, governance and repair are urgent. Compared with 2010, the water area decreased by 860 km2, with a decrease of 48.64% and an annual change rate of -4.86% in 2020. It is the land use type with the largest change rangeability. The decrease in precipitation and increase in evapotranspiration are important reasons for the shrinking of the water area according to the rainfall and evapotranspiration data of Qiqihar City.
The cultivated land increased by 1,105 km2 with a minimum change rate of only 0.37%. The stability of cultivated land is the basic guarantee of a stable ecosystem and is conducive to maintaining the ecological balance. It also guarantees regional food security. The wetland increases by 1,187 km2, with an annual change rate of 3.73%. That of other land types is 0.68%. Other land types are mainly saline-alkali land, which provides backup for the urban development of Qiqihar.
All counties, urban areas, and districts are dominated by cultivated land from the perspective of counties, urban areas, and districts except for the Tiefeng District dominated by wetland. Tiefeng District wetland area accounts for 37.78% of the total district area. The proportion ranks first in the city. The proportion of cultivated land in the main urban area is about 47.49%, and the proportion of that in the whole city is the minimum. The water area and wetland are the most and account for about 22.88% of the total area of the whole city. The total amount and proportion of construction land are the highest in the whole city. Baiquan County has 83.23% cultivated land and 0.39% water area. The proportion of cultivated land ranks first in the city, and the water area is far less than the average of the city. Water factor restricts the development of Baiquan County. The wetland area of Fuyu County accounts for about 19.77% of the total area of the county, ranking first in the city. The woodland in the Nianzishan area ranks first in the whole city and accounts for 16.30%, with a high afforestation level.
The overall land use change in Qiqihar is obvious from 2010 to 2020, and the regions are relatively concentrated from the land use transfer matrix and spatial distribution (Table 5; Figure 3). The net outflow of grassland is the largest, mainly in the periphery of urban areas. Grassland reclamation contributed the most to the increase of cultivated land area, which is attributed to the rapid increase of population in the region and the continuous improvement of agricultural mechanization. Human activities cause the transfer of grassland to some extent, which should be paid attention to. The net outflow of water area is the second largest, mainly on the left bank of the Nenjiang River Main Stream, of which 583 km2 is transformed into cultivated land and 536 km2 into the wetland. A large number of water areas have been transformed into cultivated land, and there are unreasonable human activities such as farm reclamation from lack and aquaculture in the lake, which damages ecological functions.
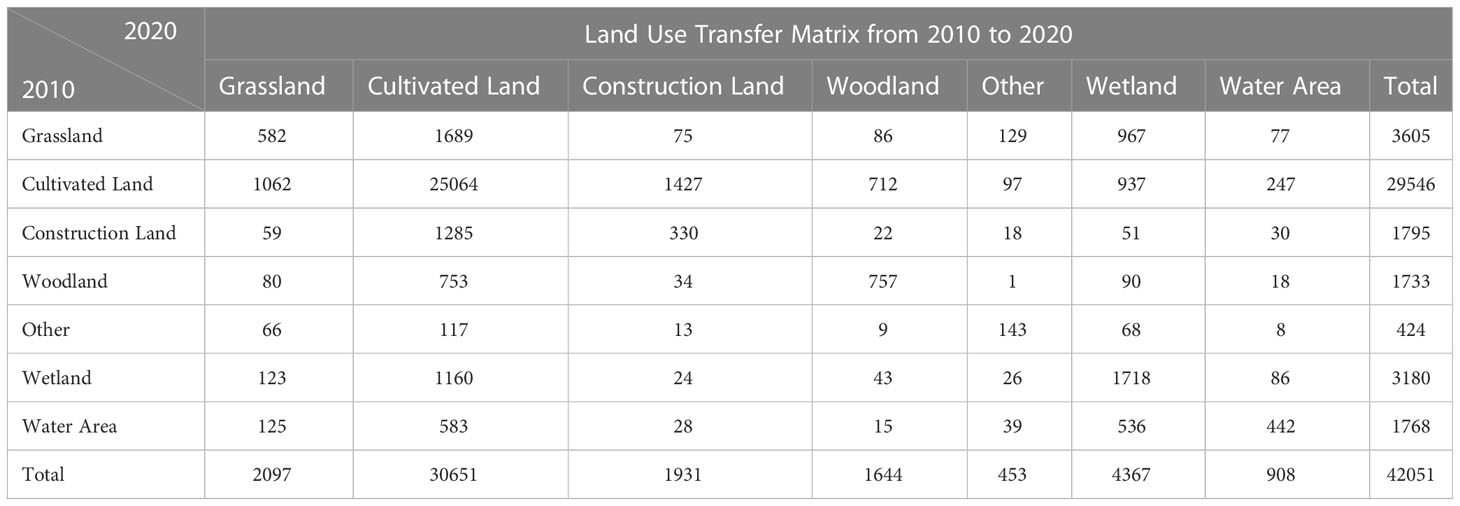
Table 5 Land use transfer matrix of Qiqihar from 2010 to 2020 (Unit: km2).
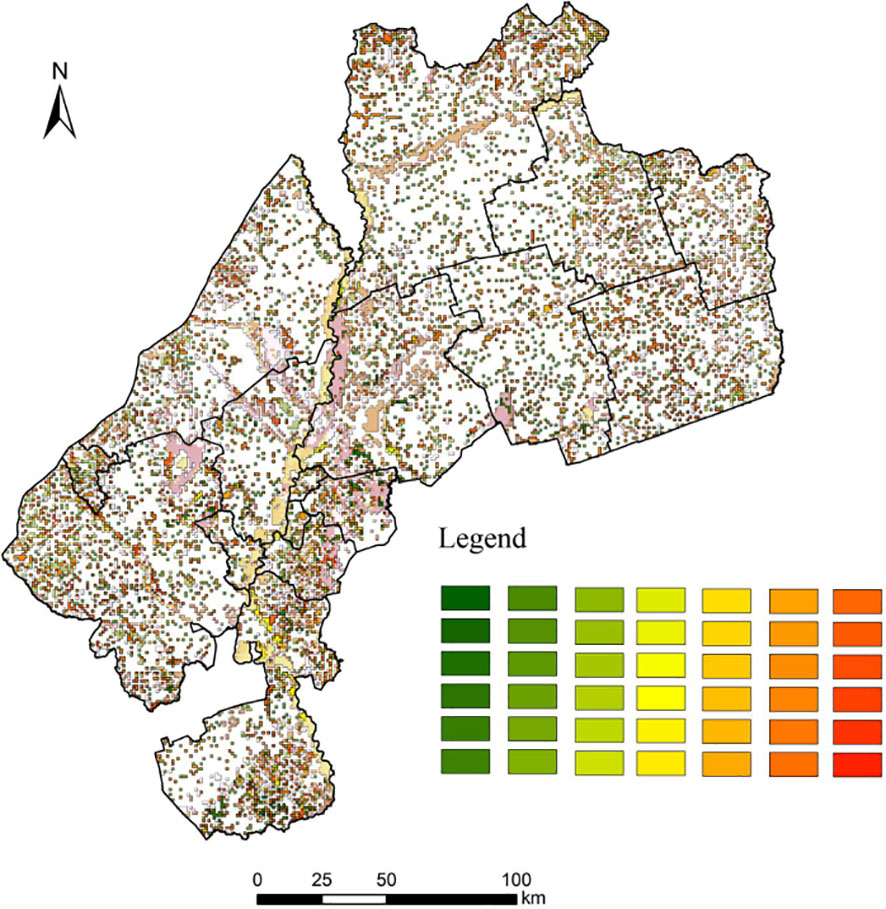
Figure 3 Spatial transfer characteristics of land use. The legend is shown from top to bottom, from left to right: Other-Construction Land; Other-Woodland; Other-Water Area; Other-Wetland; Other-Cultivated Land; Other-Grassland; Construction Land-Other; Construction Land-Woodland; Construction Land-Water Area; Construction Land-Wetland; Construction Land-Cultivated Land; Construction Land-Grassland; Woodland-Other; Woodland-Construction Land; Woodland-Water Area; Woodland-Wetland; Woodland-Cultivated Land; Woodland-Grassland; Water Area-Other; Water Area-Construction Land; Water Area-Woodland; Water Area-Wetland; Water Area-Cultivated Land; Water Area-Grassland; Wetland-Other; Wetland-Construction Land; Wetland-Woodland; Wetland-Water Area; Wetland-Cultivated Land; Wetland-Grassland; Cultivated Land-Other; Cultivated Land-Construction Land; Cultivated Land-Woodland; Cultivated Land-Water Area; Cultivated Land-Wetland; Cultivated Land-Grassland; Grassland-Other; Grassland-Construction Land; Grassland-Woodland; Grassland-Water Area; Grassland-Wetland; Grassland-Cultivated Land.
Data shows that Qiqihar is located in the wind-sand, drought-prone region of the western Songnen Plain, with an annual average precipitation of about 467 and 224 mm in 2010 and 2020, respectively. Annual potential evapotranspiration is about 779 and 805 mm, respectively. The water area shrinks and transforms into a marsh wetland due to the decrease of precipitation and increase of evapotranspiration. The net inflow of cultivated land and wetland is the largest. Cultivated land was mainly from grassland, woodland, and wetland, which account for 30.23%, 13.48%, and 20.76% of the transferred area, respectively. However, the wetland is mainly from cultivated land, grassland, and water area, which account for 35.37%, 36.50%, and 20.23% of the transferred area, respectively.
In conclusion, although a large part of the cultivated land in Qiqihar was transformed into construction land in 2020 compared with 2010, the total cultivated land area still maintains an upward trend because the cultivated land is continuously transformed from the wetland, grassland, and other land types. The water area decreases sharply and the wetland area increases due to decreased precipitation and increased evapotranspiration. The construction land area is mainly transformed from cultivated land. The increase in other land is due to the transformation of grassland and cultivated land into land types that are difficult to use. However, it can be used as backup resources for urban development through renovation.
Generally, the proportion of the total value of cultivated land and wetland exceeded 70.0% of the total value of ecosystem services in Qiqihar in 2010 and 2020. The two are the main sources of ESV in Qiqihar. Therefore, they are of great significance to the development of Qiqihar. It also reflects the natural advantage of the Northeast Black Soil Area in this region to some extent.
Compared with 2010, the total value of ecosystem services in Qiqihar increased from 35.127 billion to 35.996 billion yuan in terms of changes. The total value of ecosystem services increased by 869 million yuan, with a change rate of 2.47%, showing relatively slow growth. The ESV of woodland, grassland, water area, and construction land decreased in different degrees, among which the area of water decreased the most, reaching 48.64%, followed by grassland and woodland. The decrease in water area is the most important cause of ESV loss during this period, followed by grassland. The ESV of cultivated land, wetland, and other land increases, and that of wetland increase the most, with a change rate of 37.33% (Figure 4). The increased area of cultivated land and wetland areas, the main contributors to ESV in Qiqihar, makes up for the loss of the total value of ecosystem services to a certain extent. It determines the total value of ecosystem services and its change trend to a large extent.
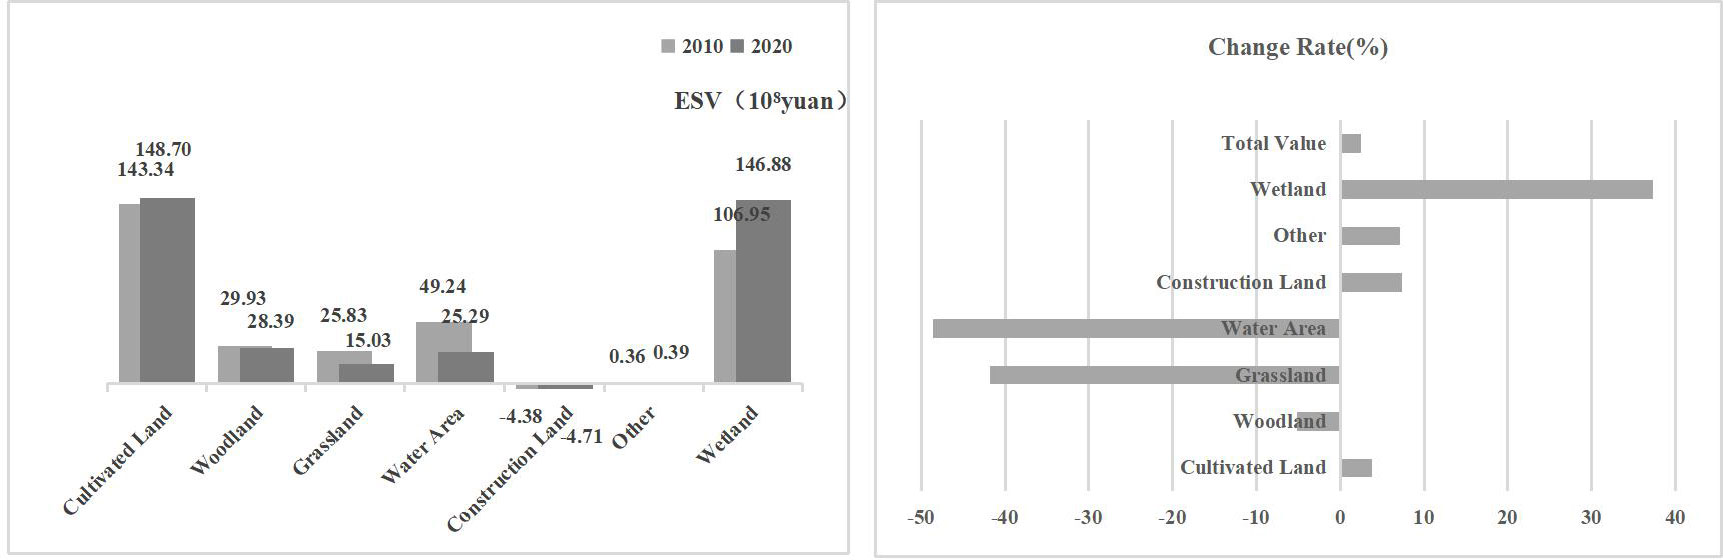
Figure 4 Changes of ESV in Qiqihar City from 2010 to 2020. And change rate of ESV of each land use type at the end of the period compared with the beginning.
The size relation of individual ESVs in Qiqihar in 2010 and 2020 from the perspective of the composition of ESV is as follows: waste treatment > hydrological regulation > climate regulation > soil conservation > biodiversity > gas regulation > aesthetic landscape > food production > raw material production (Table 6). The top five together account for more than 75% of the total value of ecosystem services in a given year.
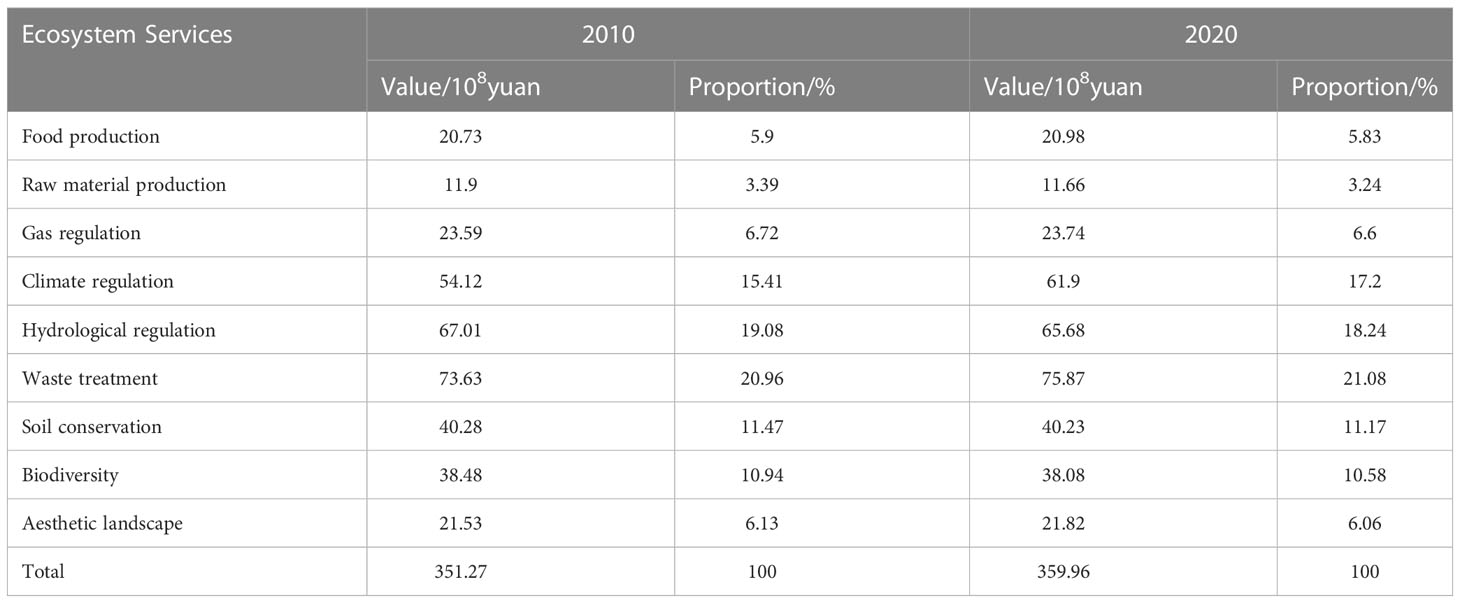
Table 6 Changes in the value of individual ecosystem services from 2010 to 2020.
The value of food production, gas regulation, climate regulation, and waste treatment all increased by 1.21%, 0.63%, 14.38%, and 3.04% in the decade, respectively. A large increase in the area of cultivated land increases the value of land for food production and so on. The increase of wetland areas optimizes the ecological environment, which increases the value of gas regulation, climate regulation, and waste treatment. There has been a reduction in the value of raw material production, hydrological regulation, soil conservation, biodiversity, and aesthetic landscape. It is mainly the result of the reduction of woodland, grassland, and water area as well as the increase of other land and construction land.
Based on the above findings, it is evident that land use changes and ecosystem service value changes in Qiqihar have a very strong correlation during the study time period, and the drivers affecting land use structure changes in Qiqihar indirectly affect the ESV in Qiqihar. Taken together, economic development, population growth, natural environment, and policy factors are important drivers of ESV change (He et al., 2022; Liu et al., 2022; Yang and Liu, 2022; Haque et al., 2023). ①The economic level and urbanization rate have increased significantly (Li D et al., 2022), and the demand for construction land in Qiqihar has increased, and the area of ecological land such as woodland, grassland and water area has been shrinking, resulting in an increase in land use intensity and unreasonable utilization structure, which have certain impacts on the ES such as raw material production, hydrological regulation and soil conservation in the ecosystem. ②Population is an important factor affecting changes in the amount of cultivated land, and the increase in population requires not only more cultivated land to ensure people’s food security, but also to expand production and improve living facilities. Human activities are a trigger for the decrease in the area of high service value land use types such as woodland, grassland and water (Li J et al., 2022), which in turn causes changes in the value of ecosystem services provided by such land use types. ③Natural environmental factors also have some influence on land use and ESV. And in this area the surface water income exceeds expenditure, precipitation exceeds evaporation. Due to the low-lying terrain, the river water quickly accumulates during the rainy season, coupled with poor drainage, resulting in the formation of a large area of swampy wetlands. These factors have certain effects on food production, gas regulation, climate regulation, waste treatment, and aesthetic landscape. ④Agricultural policy is also one of the important drivers of change in the value of ecosystem services in Qiqihar (Zhou et al., 2016). The region responded positively to the national policies and implement a strict cultivated land protection system under the guidance of the government, and increase the effective supply of cultivated land through the balance of cultivated land occupation and the linkage between increase and decrease of construction land.
Nehe City has the maximum ecological value, which accounts for 16% of the total value of Qiqihar from ESV changes of counties, urban areas, and districts in Qiqihar in 2010 and 2020 (Figure 5). It benefits from 75% of the cultivated land in Nehe and the Nemoer River Wetland Nature Reserve Wetland. The second is Fuyu County, whose ESV accounts for 13% of the total value, thanks to the ESV of Zhalong Wetland. Jianhua District, Longsha District, Nianzishan District, and Fulaerji District provide less ESV due to limited land area. ESV per unit area decreases because of the reduction of cultivated land, woodland, and water area in Jianhua District. Besides, the reduction of woodland, grassland, and wetland in the Nianzishan district and grassland, woodland, and water area in the Fulaerji District also caused the decrease of ESV. However, that of Longsha District improves due to the increased area of cultivated land, woodland, and wetland in Longsha District.
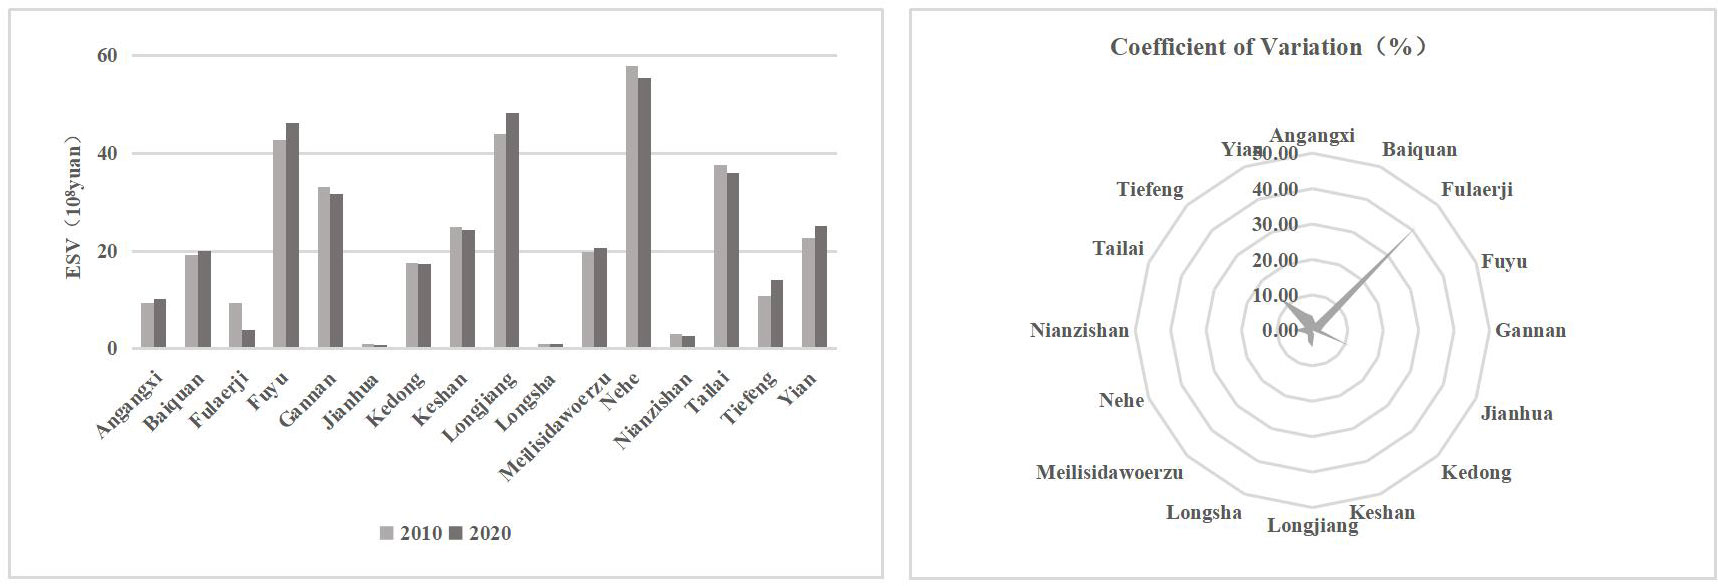
Figure 5 Changes of ESV in counties and districts of Qiqihar from 2010 to 2020. And the coefficient of variation of the degree of ESV change at the end of the reaction period.
Fulaerji District has the maximum coefficient of variation, which is as high as 41.73% analyzing the difference of ESV among counties in Qiqihar in 2010 and 2020 (Figure 5). ESV has decreased by 547 million yuan over the past decade. The variable coefficients of Jianhua District and Tiefeng district are higher, 11.41% and 13.02%, respectively. ESV decreased by 20 million yuan and increased by 319 million yuan, respectively, during the decade. Kedong County is the area with minimum average annual change and variable coefficient. Meris and Keshan County have the same small change in value.
Lists the analysis of ESV flow direction under land use change in Qiqihar from 2010 to 2020 (Table 7). ESV income mainly comes from the transformation of cultivated land and grassland ecosystem to wetland ecosystem, and water ESV to the wetland from the flow direction of ESV net gains and losses under land use change. It also plays a certain role in the increase of ESV in Qiqihar. The transformation of woodland, water area, and wetland to other types results in ESV losses. The largest loss is the transformation of the wetland to cultivated land, about 3.338 billion yuan. The ESV transfer gains and losses of other lands are flat.
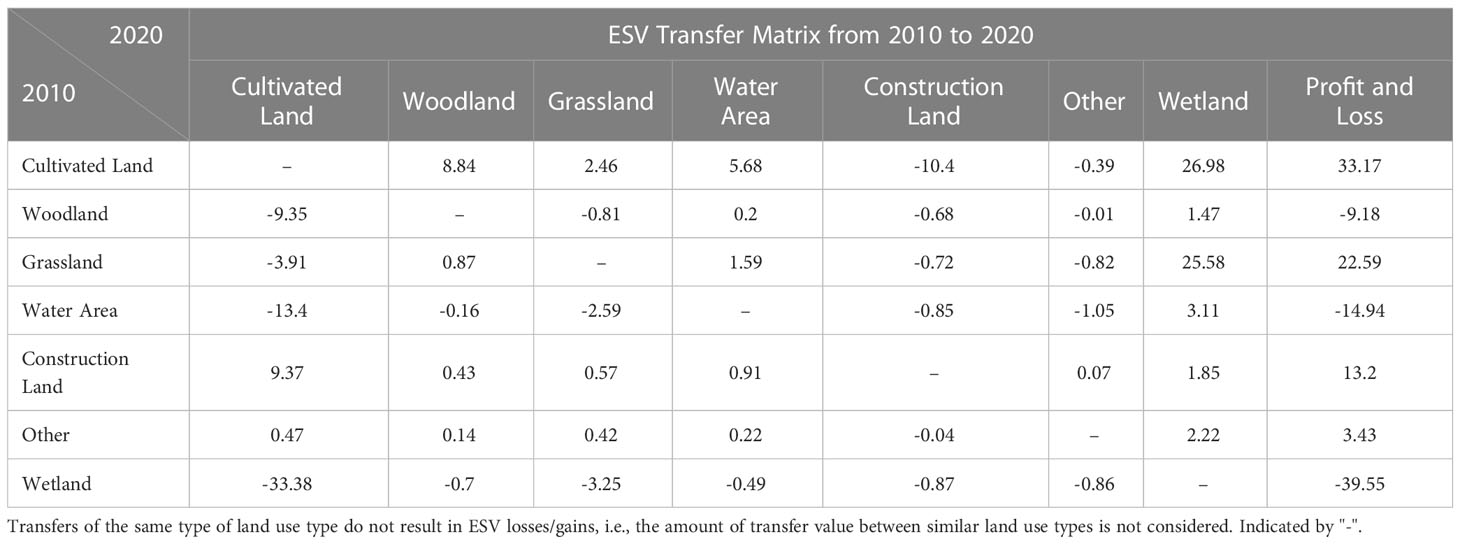
Table 7 Analysis of ESV flow direction under land use change in Qiqihar from 2010 to 2020 (unit: 108yuan).
Compared with 2010, the Sankey diagram directly shows the transfer direction and flow of changed ESV gains and losses in the research area. A large number of ESVs of cultivated land and grassland transforms into wetland ESV according to the Sankey diagram (Figure 6). The ESV income of cultivated land and grassland, as the main income flows of wetland ESV during this period, are 2.698 and 2.558 billion yuan, respectively. A large number of ESVs of wetland, water area, woodland, and grassland were transformed into cultivated land ESVs according to the Sankey diagram (Figure 7). The wetland ESV is the main loss flow direction of cultivated land ESV during this period, with a loss of 3.338 billion yuan. Wetland ESV has the maximum net value, which is 2.166 billion yuan according to the ESV gain and loss changes caused by land transformation.
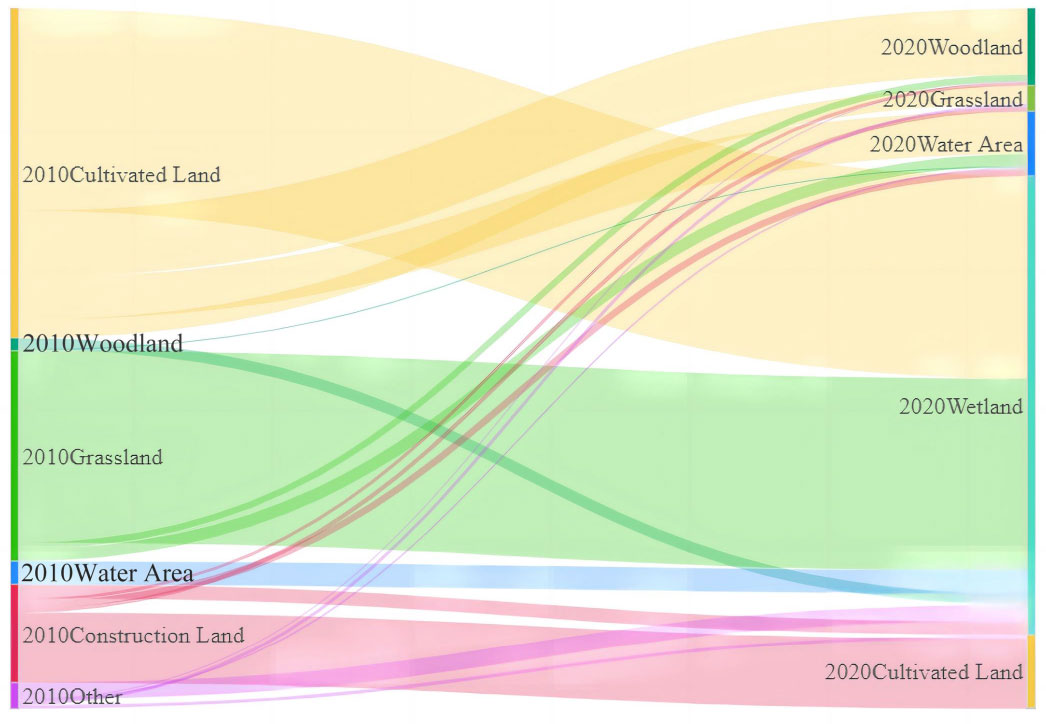
Figure 6 Sankey diagram of ESV revenue flow. The flow direction is from left to right, and the rate of flow is different color height pair.
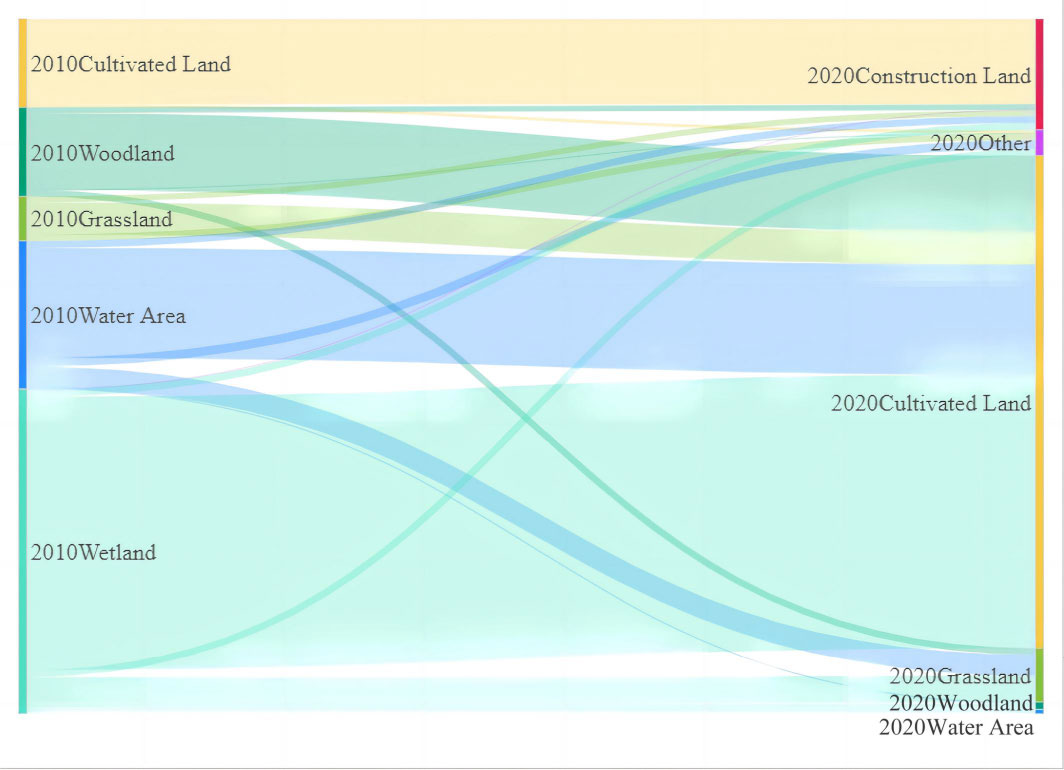
Figure 7 Sankey diagram of ESV loss flow. The flow direction is from left to right, and the rate of flow is different color height pair.
It can be seen that human activities such as urban expansion and reclamation and farming occupy a large amount of water and wetland, leading to the reduction of the ecosystem service value of Qiqihar city. However, the natural conditions such as low-lying land and wet surface make up for the decrease of value brought by human activities.
A zoning scheme of land-use ecological function in Qiqihar was proposed based on the standardized processing of nine ecosystem service function indexes ESV. The 2D graph theory clustering method and the centroid longitude and latitude of the taxonomic unit were used for analysis to provide a reference for guiding the direction of land utilization and development. The 16 county-level administrative districts in Qiqihar produced 15 connecting edges without loops. Three ecological functional zones of land use were obtained using 0.0496 as the threshold value by considering the scale and correlation of each zone in the zoning results. These are ecological wetland conservation areas in central China, point-shaped ecological-function wetland areas with featured agriculture in western China, and agricultural ecological environment construction functional areas in Northeast China (Figure 8).
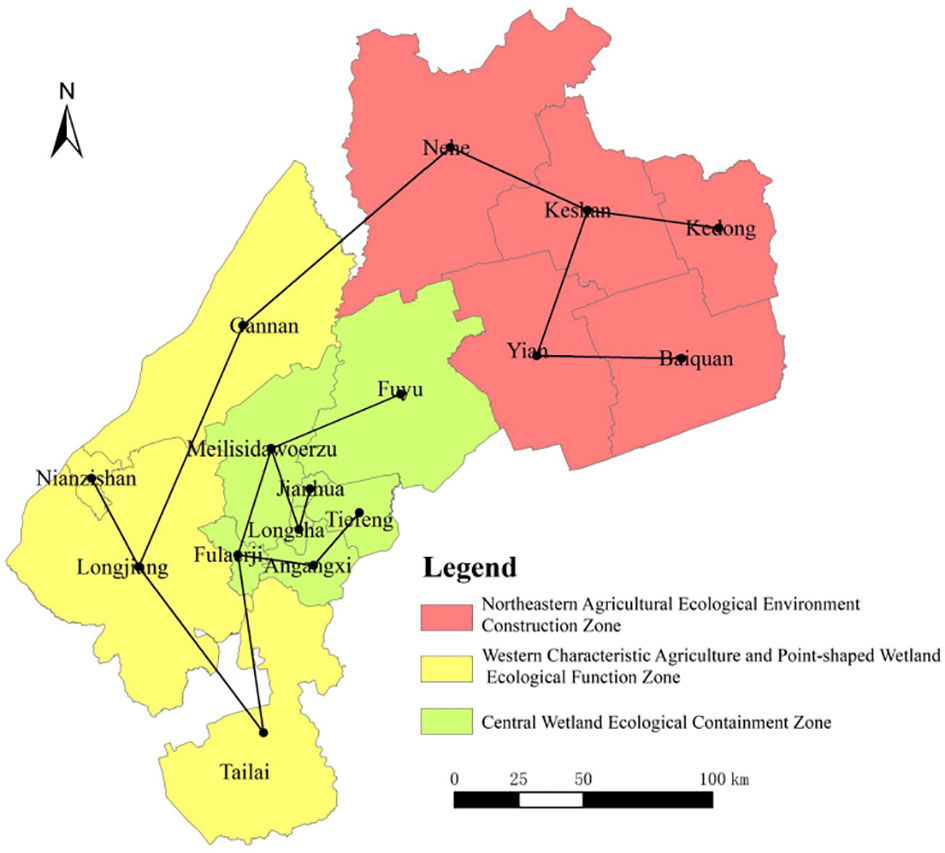
Figure 8 Ecological function zoning of land use. The black line segment shows the set of connected edges without circuits in each county (city, district).
Central wetland ecological conservation area, located in the middle of the Nenjiang alluvial plain, mainly includes the main urban area and 7 counties of Fuyu, which accounts for 19% of the total area. The main land use types of the conservation area are cultivated land and wetland. The main ecosystem service functions are waste treatment, hydrological regulation, climate regulation, and aesthetic landscape. The area has wetland that are important in China and even in the world.
Western characteristic agriculture and point-shaped wetland ecological functional area, located in the south of Nenjiang alluvial plain and west of the hilly area, mainly includes Gannan, Longjiang, Tailai County, and Nianzishan district. They account for 35% of the total area. The main land use type is cultivated land and wetland and the main ecosystem service functions are raw material production, soil conservation, and high gas regulation value. The area shoulders the great responsibility of safeguarding the ecological security of Qiqihar on the west bank of the Nenjiang River Basin. Many wetland are distributed in a pointed pattern. The average thickness of the cultivated layer in the typical black-soil area is more than 28 cm, but that in the area is only 18 cm.
The functional area of agricultural ecological environment construction in Northeast China mainly includes Nehe, Yi’an, Keshan, Kedong, and Baiquan County in the northeast of Qiqihar. The area is located on the southern slope of the Lesser Khingan Mountains and accounts for 46% of the total area. The main land use is cultivated land and the main ecosystem service function is food production and soil conservation. Songnen plain black-soil belt is mainly distributed in Nehe, Yi’an, Keshan, Kedong, and Baiquan County. The cultivated land is concentrated in contiguous distribution with high natural fertility, which is suitable for the development of agricultural production. Meanwhile, the area is an important agricultural area of Qiqihar with high grain yields and good quality and contributes to the grain production of Qiqihar.
The work adopted the ESV evaluation model to calculate the ESV of the research area, and a flow analysis model was built to analyze the flow direction and flow of net gain and loss value of ecosystem services. Besides, the 2D graph theory clustering method was used to divide ecological functional areas to provide a reference and basis for ecological construction from the perspective of ESV change trends. However, further exploration is needed in the following aspects.
According to the zoning results, we put forward the management direction for each ecological functional area.
The central wetland ecological conservation zone: surrounding districts and counties together with central Zhalong International Wetland Nature Reserve will improve the functional value of gas regulation, soil conservation, and biodiversity. Meanwhile, it will control the scale of tourism and focus on wetland protection and construction to maintain and improve the health and function of the land ecosystem. We will strictly control urban sprawl as well as reduce damage to the ecological environment caused by human activities and the discharge of waste gas, wastewater, solid waste, and other pollutants.
The western characteristic agriculture and point-shaped wetland ecological functional zone: building a featured agricultural product base, stimulating industrial vitality and farmers’ participation enthusiasm in the future, maintaining the supply function of the ecosystem, firmly establishing the concept of green development, and promoting the green and efficient technology model of reducing the chemical fertilizers and pesticides. Besides, six black-soil land protection technology models are promoted, including fertile plough layer cultivation, straw mulching, crop rotation, soil turning, and organic fertilizer back to the field, to demonstrate the prevention and control of wind and water erosion, soil consolidation, and fertilization technology of black-soil land. A multi-pointed wetland protection pattern is formed by gathering numerous point-shaped wetland protection areas to improve the functions of climate regulation and hydrological regulation. Finally, multiple cultural sites are used to promote the integration of culture and tourism as well as the aesthetic landscape and other functions.
The northeast agricultural ecological environment construction zone.: Firstly, focus on the protection of cultivated land and strictly prohibit the construction of cultivated land to ensure the productive function of biological production. Then, maintain land resources and improve the organic content of the soil. We will prevent and control agricultural non-point source pollution and actively promote clean agriculture with agricultural production as the core. Besides, the agricultural ecological environment and agricultural yield will be improved. Next, raise public awareness of environmental protection, monitor and control pollution sources, and ease pressure on the soil. Finally, improve soil self-purification and productivity, the construction and protection of farmland ecosystems, and the sustainable use of cultivated land resources.
The work adopted the equivalent factor method to evaluate the dynamic process of ESV caused by land use change. The method is of high practical value in ESV assessment based on unit area value. Researchers focused on the ESV changes caused by different biomass and willingness to pay between the different years in the same ecosystems. Besides, they used various coefficients to correct ESV (Shi and Wang, 2008; Wei et., 2017; Tang et al., 2019) to make the research results reflect the actual situation in different regions. The most commonly used correction coefficients are the economic value of grain production per unit area of farmland (Tang et al., 2019), biomass factor (Yan, 2022), and per capita GDP (Li X et al., 2015). The above correction methods mainly use the results of previous studies and cannot reflect the actual situation of the region well. Therefore, the work adopted biomass factor, economic factor, and economic value of grain yield per unit area to make a compound correction to the ESV coefficient. The correction results reflected the actual situation of the research area. However, it was neglected that the ecosystem service changed as the external form and internal structure of the ecosystem changed. The whole research area was taken as the whole to calculate the correction coefficient during revising the biomass and economic factor of the ESV assessment model. The differences in counties, urban areas, districts, and land use types were not fully considered. The positive and negative effects of construction land on ESV are fully considered. However, the total ESV of the study area changes greatly by considering the influence of construction land ESV because various ESVs of construction land are generally negative in many studies (Li B et al., 2015) or the influence of that is not considered (Cao et al., 2020; Ma et al., 2021). There are various calculation methods for ESV, such as cultivated land, woodland, grassland, and wetland. However, the calculation process often involves various factors affecting ESV and it is not easy to separate the direct impact of land type change on value when other conditions are unchanged. Each land type should be uniformly quantified to study the ESV changes caused by land use changes. It also requires a unified ecosystem service evaluation system and accounting under the same method. However, the method ignores the contribution of environmental factors such as land quality and rainfall to ESV change. Therefore, we should comprehensively consider all factors affecting ESV change and extract the contribution of land use change to ESV change. The 2D graph theory clustering method selected by land use ecological function zoning can alleviate the disputes between adjacent administrative units caused by ambiguous land boundaries and local differential management to a certain extent. However, the result of centralized contiguous zoning ignores the differences among individual internal units of the zoning to a certain extent.
The ESV calculation results of the research area are similar to those of Yang et al. (Yang et al., 2018) on the ecosystem service value of Qiqihar from 1990 to 2015: The grassland and water area decreased significantly, while the cultivated land, construction land, and unused land increased during research. The ecological service value of grassland, water area, and construction land decreased year by year, while that of cultivated land and unused land increased year by year. However, some of the results are not following the above conclusion. For example, the wetland area increases, and the woodland area decreases. The difference in the results is caused by their different classification criteria and time range of land use. Yang et al. (Yang et al., 2018). directly identified wetland types through visual interpretation, while the unused land marshland is directly classified as a wetland system in the work. The land use change in the research area is similar to that of Qiqihar from 2010 to 2017 as described by Xie et al. (Xie et al., 2021). Construction land continues to expand with the advancement of urbanization. Cultivated land occupies the largest proportion and the area ratio of the wetland is second to that of cultivated land. The area of woodland and grassland both decreases. Using Costanza and Xie method to study the change of ESV under land use change, which is consistent with the method chosen by scholars (Hoque et al., 2020; Gao et al., 2021; Li Q et al., 2022). Thus, it is reasonable and reliable to use the method to study such content.
Land use pattern is an important factor affecting the change of ecosystem service value, which reshapes the flow pattern of the ecosystem service. An in-depth discussion on the relationship between land use change and ESV will impact the coordinated development of the regional ecological economy. Future research will further consider using the grid as a research scale to reflect the change in ecological service value, improve research methods, and refine land use types and the ecological service value coefficient of different land use. Meanwhile, various land use scenarios will be set up with the help of CLUE-S, CA, and other models. It is to scientifically predict the future gains and losses of ecosystem service value under land use change in the research area. Besides, the research on ecological function zoning of land use needs to further explore the following aspects. They are land quality, land use type, soil type, landform, population, and coordination between economic development and resources and environment in combination with the theory of zoning. Then, it can better realize the coordinated development of an ecological land economy and sustainable use of land resources.
Quantitative research on the impact of land use change on ESV is conducive to comprehensively understanding the dynamic change trend of the regional ecological environment. It is also beneficial to optimizing regional land use patterns, maintaining the regional ecological environment, and promoting sustainable land development. The land structure of Qiqihar City changed significantly and the ecological land such as woodland, grassland, and water area decreased rapidly during the research period. The regional ecological environment is in urgent need of protection and repair.
Single ESVs mainly focus on waste treatment and hydrological regulation, which reflects the importance of land and water regulation capacity in water and wetland. The reduced water land area decreases the value of hydrological regulation services. The decreased grassland and woodland area reduces the value of soil conservation and biodiversity protection. It also fails to maintain the service value of raw material production and supply and promote high-quality development of woodlands, grasslands, and water areas. The supply, regulation, culture, and supporting service functions of ecological conservation land will be improved when the existing area is consolidated.
The ESV income of Qiqihar mainly comes from the transformation of cultivated land and grassland ecosystem into wetland ecosystems. The transformation of woodland, water area, and wetland to other lands leads to ESV losses. We should reasonably control the transformation of woodland, water area, and wetland land and pay attention to the quantity control of these lands, such as forest coverage rate and water area rate. Besides, the ecological resource layout and ecological quality should also be considered to improve the quality and stability of the ecosystem. Three ecological functional zones are divided according to single ESVs with local suitability, which provides a reference for ecological planning and design strategies in Qiqihar.
Publicly available datasets were analyzed in this study. This data can be found here: https://www.resdc.cn/; https://modis.gsfc.nasa.gov; http://www.geodata.cn.
ZZ: conceptualization, writing—original draft, and formal analysis. YY: resources and writing—review and editing. RW and JL: investigation, methodology and visualization. PZ: supervision, reviewing, and editing. All authors contributed to the article and approved the submitted version.
This research was supported by the Strategic Priority Research Program of Chinese Academy of Sciences (XDA28060302).
We sincerely thank the Resource and Environment Science and Data Center, Chinese Academy of Sciences for providing time series land use data, the NASA’s website for providing time series MODIS products, and the National Earth System Science Data Center for providing time series meteorological data, and thank all reviewers who provided detailed and valuable comments or suggestions to improve this manuscript.
The authors declare that the research was conducted in the absence of any commercial or financial relationships that could be construed as a potential conflict of interest.
All claims expressed in this article are solely those of the authors and do not necessarily represent those of their affiliated organizations, or those of the publisher, the editors and the reviewers. Any product that may be evaluated in this article, or claim that may be made by its manufacturer, is not guaranteed or endorsed by the publisher.
Cao Y., Zhao S., Yang Y., Guo P. (2020). Spatial and temporal dynamics of ecosystem service value and regional economic growth in chongqing. Yangtze River Basin Res. Environ. 29, 2354–2365. doi: 10.11870/cjlyzyyhj202011003
Costanza R., dArge R., deGroot R., Farber S., Grasso M., Hannon B., et al. (1997). The value of the world's ecosystem services and natural capital. Nature 387, 253–260. doi: 10.1038/387253a0
Das S., Shit P. K., Bera B., Adhikary P. P. (2022). Effect of urbanization on the dynamics of ecosystem services: an analysis for decision making in kolkata urban agglomeration. Urban Ecosyst. 25, 1541–1559. doi: 10.1007/s11252-022-01246-3
Eisfelder C., Klein I., Niklaus M., Kuenzer C. (2014). Net primary productivity in Kazakhstan, its spatio-temporal patterns and relation to meteorological variables. J. Arid. Environ. 103, 17–30. doi: 10.1016/j.jaridenv.2013.12.005
Fujii H., Sato M., Managi S. (2017). Decomposition analysis of forest ecosystem services values. Sustainability 9, 14. doi: 10.3390/su9050687
Gao X., Wang J., Li C., Shen W., Song Z., Nie C. (2021). Land use change simulation and spatial analysis of ecosystem service value in shijiazhuang under multi-scenarios. Environ. Sci. pollut. R. 28 (24), 31043–31058. doi: 10.1007/s11356-021-12826-9
Gashaw T., Tulu T., Argaw M., Worqlul A. W., Tolessa T., Kindu M. (2018). Estimating the impacts of land use/land cover changes on ecosystem service values: the case of the andassa watershed in the upper blue Nile basin of Ethiopia. Ecosyst. Serv. 31, 219–228. doi: 10.1016/j.ecoser.2018.05.001
Guo Z., Xiao X., Gan Y., Zheng Y. (2001). Ecosystem functions, services and their values - a case study in xingshan county of China. Ecol. Econ. 38, 141–154. doi: 10.1016/s0921-8009(01)00154-9
Haque M. N., Mahi M. M., Sharif M. S., Rudra R. R., Sharifi A. (2023). Changes in the economic value of ecosystem services in rapidly growing urban areas: the case of Dhaka, Bangladesh. Environ. Sci. pollut. Res. 19. doi: 10.1007/s11356-023-26096-0
He C., Shao H., Xian W. (2022). Spatiotemporal variation and driving forces analysis of eco-system service values: a case study of sichuan province, China. Int. J. Environ. Health 19 (14), 22. doi: 10.3390/ijerph19148595
Hemmavanh C., Ye Y. M., Yoshida A. (2010). Forest land use change at trans-boundary Laos-China biodiversity conservation area. J. Geogr. 20, 889–898. doi: 10.1007/s11442-010-0818-1
Hoque M. Z., Cui S., Islam I., Xu L., Tang J. (2020). Future impact of land Use/Land cover changes on ecosystem services in the lower meghna river estuary, Bangladesh. Sustainability 12 (5), 18. doi: 10.3390/su12052112
Huang L., He C., Wang B. (2022). Study on the spatial changes concerning ecosystem services value in Lhasa river basin, China. Environ. Sci. pollut. Res. 29, 7827–7843. doi: 10.1007/s11356-021-16245-8
Kayser K., Sandau K., Paul J., Weisse G. (1992). An approach based on two-dimensional graph theory for structural cluster detection and its histopathological application. J. Microsc. 165, 281–288. doi: 10.1111/j.1365-2818.1992.tb01486.x
Kremer P., Hamstead Z. A., McPhearson T. (2016). The value of urban ecosystem services in new York city: a spatially explicit multicriteria analysis of landscape scale valuation scenarios. Environ. Sci. Policy. 62, 57–68. doi: 10.1016/j.envsci.2016.04.012
Le T. A. T. (2022). Transdisciplinary research in valuing forest ecosystem services for sustainability: the importance and challenges. Front. Ecol. Evol. 10. doi: 10.3389/fevo.2022.859748
Li Z., Jiang W., Wang W., Chen Z., Ling Z., Lv J. (2020). Ecological risk assessment of the wetlands in Beijing-Tianjin-Hebei urban agglomeration. Ecol. Indic. 117, 13. doi: 10.1016/j.ecolind.2020.106677
Li J., Liao Q., Shen S., Liu X., Liao J. (2022). Study on the spatial and temporal change of ecosystem service value in the green heart area of changsha-Zhuzhou-Xiangtan urban agglomeration. Chin. Garden 38 (01), 100–105. doi: 10.1007/s11356-021-16245-8
Li B., Qu A., Gu H., Ji Y. (2015). Land use change and its impact on ecosystem service value in the mining area of jiawang, xuzhou city. Ecolo. Sci. 34, 147–153. doi: 10.14108/j.cnki.1008-8873.2015.05.023
Li Q., Wang L., Du G., Faye B., Li Y., Li J. (2022). Dynamic variation of ecosystem services value under land Use/Cover change in the black soil region of northeastern China. Int. J. Env. Res. Pub. He. 19 (12), 18. doi: 10.3390/ijerph19127533
Li D., Wu B., Wang X., Mei X. (2022). Study on the coupling and coordinated spatial and temporal differentiation of new urbanization and cultivated land utilization in heilongjiang province. chin. J. Agric. Res. Reg. Plan. 43 (05), 143–155. doi: 10.7621/cjarrp.1005-9121.20220515
Li Y., Zhou G., Liang T., Wu L., Liu W. (2009). Study of land use change on the gains and losses of ecosystem service function values of chaohu lake basin. Geogr. Res. 28, 1656–1664. doi: 10.11821/yj2009060021
Li X., Zhu Y., Zhao L., Tian J., Li J. (2015). Research on the change of ecosystem service value in qinglong county based on dynamic adjustment of value coefficient. Chin. J. Ecol. Agric. 23, 373–381. doi: 10.13930/j.cnki.cjea.140595
Liu H., Shu C., Sun L. (2022). Spatiotemporal evolution and influencing factors of ecosystem service value in the sanjiangyuan nature reserve nature reserve. Adv. Nano Res. 12 (3), 319–336. doi: 10.12989/anr.2022.12.3.319
Liu H., Zheng L., Wu J., Liao Y. (2020). Past and future ecosystem service trade-offs in poyang lake basin under different land use policy scenarios. Arab. J. Geosci. 13, 16. doi: 10.1007/s12517-019-5004-x
Lu C., Lei G., Zhou H., Zhang A., Zhang K. (2017). Research on land use zoning in northeast China based on two-dimensional graph theory clustering method. J. Integr. Agric. 48, 155–164. doi: 10.6041/j.issn.1000-1298.2017.12.018
Ma Y., Ling X., Tong Y. (2021). Estimation of ecological service value and spatial and temporal variation characteristics of typical tourist cities at grid scale: the case of sanya. J. Ecol. 41, 7542–7554. doi: 10.5846/stxb202002280364
Mamat Z., Yimit H., Eziz M., Ablimit A. (2013). Analysis of the ecology-economy coordination degree in yanqi basin, xinjiang, China. Asian J. Org. Chem. 25, 9034–9040. doi: 10.14233/ajchem.2013.14978
Naeem S., Zhang Y., Tian J., Qamer F. M., Latif A., Paul P. K. (2020). Quantifying the impacts of anthropogenic activities and climate variations on vegetation productivity changes in China from 1985 to 2015. Remote Sens. 12, 29. doi: 10.3390/rs12071113
Niu S., Lv X., Gu G. (2021). Study on the influence of perceived benefits on farmers' decisions on blackland conservation behavior: an example of the "Lishu model". CLS. 35, 44–53. doi: 10.11994/zgtdkx.20210915.090523
Niu G., Wang G., Lu Q., Xiong C. (2022). Function evaluation and optimal strategies of three types of space in cross-provincial areas from the perspective of high-quality development: a case study of Yangtze river delta, China. Pol. J. Environ. Stud. 31, 2763–2777. doi: 10.15244/pjoes/144910
Pan N., Guan Q., Wang Q., Sun Y., Li H., Ma Y. (2021). Spatial differentiation and driving mechanisms in ecosystem service value of arid Region:A case study in the middle and lower reaches of shule river basin, NW China. J. Clean Prod. 319, 14. doi: 10.1016/j.jclepro.2021.128718
Peng W., Zhou J., Fan S., Yang C. (2016). Effects of the land use change on ecosystem service value in chengdu, Western China from 1978 to 2010. J. Remote Sens. 44, 197–206. doi: 10.1007/s12524-015-0481-1
Ruiz-Sandoval D., Arana-Coronado J. J., Godbout S., Sandoval-Salas F., Brambila-Paz J. J. (2019). Economic valuation of three ecosystem services before the establishment of a greenbelt of Quebec city forest, Canada. Rev. Chapingo. Ser. Cie. 25, 3–15. doi: 10.5154/r.rchscfa.2018.04.036
Schild J. E., Vermaat J. E., van Bodegom P. M. (2018). Differential effects of valuation method and ecosystem type on the monetary valuation of dryland ecosystem services: a quantitative analysis. J. Arid. Environ. 159, 11–21. doi: 10.1016/j.jaridenv.2017.09.001
Shi X., Wang W. (2008). An integrated assessment method and application of ecosystem function value: the case of kangbao county, hebei province. J. Ecol. 28, 3998–4006. doi: 10.3321/j.issn:1000-0933.2008.08.060
Solomon N., Segnon A. C., Birhane E. (2019). Ecosystem service values changes in response to land-Use/Land-Cover dynamics in dry afromontane forest in northern Ethiopia. Int. J. Env. Res. Pub. He. 16, 15. doi: 10.3390/ijerph16234653
Sun Y., Liang X., Xiao C. (2019). Assessing the influence of land use on groundwater pollution based on coefficient of variation weight method: a case study of shuangliao city. Environ. Sci. pollut. Res. 26, 34964–34976. doi: 10.1007/s11356-019-06598-6
Swallow B. M., Sang J. K., Nyabenge M., Bundotich D. K., Duraiappah A. K., Yatich T. B. (2009). Tradeoffs, synergies and traps among ecosystem services in the lake Victoria basin of East Africa. Environ. Sci. Policy. 12, 504–519. doi: 10.1016/j.envsci.2008.11.003
Tang Q., Liu F., Liu X., Wang H. (2019). Evaluation of ecosystem service value in karst mountains based on LUCC. Environ. Sci. Technol. 42, 170–177. doi: 10.19672/j.cnki.1003-6504.2019.01.025
Wang S., Lv Y., Lin J., Wang L., Zhu Y. (2022). Impacts of land use change on ecosystem service values in the lake superior region of suzhou. Chn. Urban Forestry 20, 125–130. doi: 10.12169/zgcsly.2020.08.12.0002
Wei H., Zhao W., Zhang X., Wang X. (2017). Evaluation of regional ecosystem service value based on land use change:An example from dezhou city, Shandong province. J. Ecol. 37, 3830–3839. doi: 10.5846/stxb201603300581
Wen L., Wang J., Ren M., Fan J., Bai J., Shang J. (2021). Effectiveness of integrated soil erosion management in the black soil area of northeast China. Soil Water Conserv. 6, 4–7. doi: 10.3969/j.issn.1000-0941.2021.06.005
Wu B., Yu B., Wu Q., Chen Z., Yao S., Huang Y., et al. (2018). An extended minimum spanning tree method for characterizing local urban patterns. Int. J. Geogr. Inf. Sci. 32, 450–475. doi: 10.1080/13658816.2017.1384830
Xie H., He Y., Choi Y., Chen Q., Cheng H. (2020). Warning of negative effects of land-use changes on ecological security based on GIS. Sci. Total Environ. 704, 9. doi: 10.1016/j.scitotenv.2019.135427
Xie J., Li W., Jia J., Zhao H. (2021). Construction and optimization of ecological network in the main urban area of qiqihar. Res. Soil Water Conserv. 28, 308–315. doi: 10.13869/j.cnki.rswc.20210305.001
Xie G., Lu C., Leng Y., Zheng D., Li S. (2003). Valuation of ecological assets on the qinghai-Tibet plateau. NRJ. 18, 189–196. doi: 10.11849/zrzyxb.2003.02.010
Xie G., Zhang C., Zhang L., Chen W., Li S. (2015). Improvement of ecosystem service valorization method based on unit area value equivalent factor. NRJ. 30, 1243–1254. doi: 10.11849/zrzyxb.2015.08.001
Xie G., Zhen L., Lu C., Xiao Y., Chen C. (2008). An expert knowledge-based approach to valorization of ecosystem services. NRJ. 23, 911–919. doi: 10.11849/zrzyxb.2008.05.019
Yan F. (2022). Effects of climate changes on net primary productivity variation in the marsh area of the sanjiang plain. Front. Ecol. Evol. 10. doi: 10.3389/fevo.2022.1002397
Yang L., Liu F. (2022). Spatio-temporal evolution and driving factors of ecosystem service value of urban agglomeration in central yunnan. Sustainability 14 (17), 20. doi: 10.3390/su141710823
Yang F., Zhao Y., Song J., He X., Liu Y. (2018). Study on the spatial and temporal variation of land ecosystem service value in qiqihar city. J. Chn. Agric. Univ. 23, 105–114. doi: 10.11841/j.issn.1007-4333.2018.02.14
Yu S., Du H., Zhang P., Li J. (2022). Study on the spatial differentiation of the relationship between urbanization and ecosystem service coordination in zhangcheng region. Fores Ecol. Sci. 37, 301–311. doi: 10.13320/j.cnki.hjfor.2022.0044
Yuan Z., Xu J., Wang Y., Yan B. (2021). Analyzing the influence of land use/land cover change on landscape pattern and ecosystem services in the poyang lake region, China. Sci. Total Environ. 28, 27193–27206. doi: 10.1007/s11356-020-12320-8
Zhang X., Chen P., Dai S., Han Y. (2022). Assessment of the value of regional water conservation services based on SWAT model. Environ. Monit. Assess. 194, 14. doi: 10.1007/s10661-022-10247-w
Zhang L., Lei G., Guo Y. (2020). Land use multifunctionality zoning in liaoning province based on two-dimensional graph theory clustering. J. Agric. Engineer. 36, 242–249. doi: 10.11975/j.issn.1002-6819.2020.13.028
Zhang J., Song Y., Wang J. (2022). Spatiotemporal patterns of gross ecosystem product across china's cropland ecosystems over the past two decades. Front. Ecol. Evol. 10. doi: 10.3389/fevo.2022.959329
Zhao L., Zhang P., Zhou Z. (2013). Analysis of the impact of land use change on ecosystem and driving factors in the ecosystem service values in the central yunnan urban group from 2000 to 2020. Soil Water Conserv. 41, 310–322,2. doi: 10.7621/cjarrp.1005-9121.20130512
Keywords: land use change, ecosystem service value, the flow-oriented model, ecological function zoning, Qiqihar city
Citation: Zuo Z, Yang Y, Wang R, Li J and Zhang P (2023) Analysis of the gains and losses of ecosystem service value under land use change and zoning in Qiqihar. Front. Ecol. Evol. 11:1192952. doi: 10.3389/fevo.2023.1192952
Received: 24 March 2023; Accepted: 05 June 2023;
Published: 22 June 2023.
Edited by:
Xueru Zhang, Hebei University of Economics and Business, ChinaReviewed by:
Shangcheng Li, PKU, ChinaCopyright © 2023 Zuo, Yang, Wang, Li and Zhang. This is an open-access article distributed under the terms of the Creative Commons Attribution License (CC BY). The use, distribution or reproduction in other forums is permitted, provided the original author(s) and the copyright owner(s) are credited and that the original publication in this journal is cited, in accordance with accepted academic practice. No use, distribution or reproduction is permitted which does not comply with these terms.
*Correspondence: Pengtao Zhang, emhhbmdwdEBoZWJhdS5lZHUuY24=
Disclaimer: All claims expressed in this article are solely those of the authors and do not necessarily represent those of their affiliated organizations, or those of the publisher, the editors and the reviewers. Any product that may be evaluated in this article or claim that may be made by its manufacturer is not guaranteed or endorsed by the publisher.
Research integrity at Frontiers
Learn more about the work of our research integrity team to safeguard the quality of each article we publish.