 Jinyuan Guo
 Teng Wang
 Fei Li
 Zhiguang Qu
 Jingjing Yan1
 Shaojie Kong
94% of researchers rate our articles as excellent or good
Learn more about the work of our research integrity team to safeguard the quality of each article we publish.
Find out more
ORIGINAL RESEARCH article
Front. Ecol. Evol. , 12 June 2023
Sec. Environmental Informatics and Remote Sensing
Volume 11 - 2023 | https://doi.org/10.3389/fevo.2023.1192847
This article is part of the Research Topic Aerosol Pollution and Air Quality in Cities View all 5 articles
Introduction: With the promulgation of air pollution control policies, there are still many cities where the PM2.5 concentration exceeds 35 μg/m3, and O3 pollution is increasingly apparent.
Methods: The spatio-temporal evolution and differentiation characteristics of PM2.5 and O3 pollution were explored, and then compound pollution hotspot urban agglomerations were screened out. A weather normalization technique was used to identify the driving amount, the influence of meteorological factors, and the anthropogenic emissions quantitatively, on pollution in hotspot urban agglomeration. Furthermore, the health and economic losses due to PM2.5 and O3 in hot cities in 2015–2020 were quantified. Finally, a natural break-point classification method was used to establish the health loss rating systems for PM2.5 and O3.
Results and Discussion: The results showed the following: (1) From 2015 to 2020, 78%, 72%, 69%, 58%, 50%, and 41% of the annual mean PM2.5 concentration had exceeded 35 μg/m3, respectively, and 17%, 18%, 31%, 33%, 30%, and 17% of the annual mean O3 concentration exceeded 160 μg/m3, respectively, in 337 cities in China. (2) From 2015 to 2020, the health losses caused by PM2.5 and O3 were ranked as follows: Beijing–Tianjin–Hebei (BTH; 1968, 482 people) > Shandong Peninsula (SDP; 1,396, 480 people) > Central Plains (CP; 1,302, 314 people) > Yangtze River Delta (YRD; 987, 306 people) > Triangle of Central China (TC; 932, 275 people) > Guanzhong Plain (GZP; 869, 189 people). (3) The average economic losses associated with public health of the PM2.5 and O3 were ranked as follows: BTH (2.321 billion, 3.218 billion RMB, 1 RMB = 0.0.1474 USD on 20 January 2023) > SDP (1.607, 2.962 billion RMB) > YRD (1.075, 1.902 billion RMB) > TC (1.016 billion, 1.495 billion RMB) > CP (1.095, 1.453 billion RMB) > GZP (0.69, 0.828 billion RMB). Therefore, combining hot pollution factors, the regional characteristics of the priority control areas, and the national 14th 5-Year Plan, targeted control countermeasures were proposed.
China has formulated strict air pollution control and pollution reduction measures, fundamentally tightening air pollution targets to reduce particulate matter pollution since 2013. PM2.5 concentration and the number of exceedence days have decreased significantly. Based on the 14th 5-Year Plan for Ecological and Environmental Protection, 40% of cities have an annual mean PM2.5 concentration that exceeds the Grade-II standard (35 μg/m3) of the Chinese Ambient Air Quality Standards (GB 3095–2012), indicating that China’s PM2.5 pollution problem remains challenging. In addition, O3 pollution not only fluctuates and rises gradually, but also shows a diffusion trend in its pollution range, and the number of medium–high O3-polluted cities gradually increases (Li et al., 2019a). PM2.5 and O3 have become primary pollutants in many Chinese cities (Xing et al., 2022). In addition, PM2.5 and O3 precursors are similar (NO x and VOCs) and interact with each other (Lu et al., 2020). Therefore, it is of significance to study the collaborative control of the PM2.5 and O3 pollution complex in relation to China’s air pollution control.
The changes in PM2.5 and O3 concentrations have been influenced by both anthropogenic emissions and meteorological factors. Previous studies have demonstrated that weaker wind speed has aggravated regional air pollution (Zhang and Wang, 2020), and high temperatures have promoted O3 generation (He et al., 2021). With less precipitation, the removal of air pollutants was weakened, which could have further increased the concentration of air pollutants (Wang et al., 2018). PM2.5 and O3 have been predominantly affected by meteorological fluctuations and anthropogenic emissions (Zhang et al., 2018; Tao et al., 2020). Therefore, it is of great significance to quantitatively analyze the respective contributions of meteorological and anthropogenic emission factors for decision-makers to understand the driving mechanisms of ambient composite pollution.
At present, studies have applied numerical simulations and statistical methods to assess the impact of meteorology on the trend of the PM2.5 and O3 in China (Han et al., 2020). Gao et al. (2020) used a WRF–Chem model to quantify the amount of the PM2.5 driven by meteorological changes in Beijing during winter. However, due to the great uncertainty of the emission inventory and the model (Gao et al., 2018), as well as the large computational resources required by the chemical-transmission model, its application was limited by the available computing power (Chen et al., 2019). Statistical model analysis was another common method for deducting influence of meteorology on air quality, but it usually requires emission and meteorological data over a large time span. Zhai et al. (2019) used a stepwise multiple-linear-regression (MLR) model to calculate meteorological trend driving the PM2.5 concentration in the BTH region from 2013 to 2018 as −1.3 μg/m3/year. Currently, new methods are being continuously developed to remove meteorological influences on air quality, including enhanced-regression-tree (BRT) and random-forest (RF) algorithms (Grange and Carslaw, 2019). Machine-learning-based technologies had better performance than traditional models in reducing the variance and errors in high-dimensional data. Therefore, this study intended to quantify the influence of meteorology on air quality based on a random-forest algorithm and derive the meteorological effects on ambient air quality. The quantitative identification of the driving mechanism of pollution could not only be beneficial to understanding the effectiveness of existing air control measures, but it could also be useful for establishing targeted countermeasures.
The quantified identification of the health losses due to PM2.5 and O3 under anthropogenic conditions could be helpful for accurate systems for economic loss assessment. In recent years, the application of ambient economic-loss-assessment models has focused on evaluating of the PM2.5-related economic losses (Xia et al., 2019), but few have considered O3-related economic losses, despite this posing a significant threat to the health of organisms in the near-surface atmosphere (Yao et al., 2023). In addition, existing studies have generally attributed the improvement of the ambient air quality entirely to the implementation of emission-reduction policies. For example, the changes in the economic losses associated with public health caused by the decrease in the PM2.5 concentration was used to evaluate the effect of emission-reduction policies (Xu et al., 2021), but the significant influence of meteorological factors had not been taken into account, so the evaluation results have been biased to a certain extent. In addition, based on the policy implementation in recent years, the PM2.5 concentration has continued to decline while the O3 pollution has fluctuated and shown an increasing trend. However, few studies have evaluated the ratio of the composite of the economic losses associated with public health as being caused by both. Therefore, the value of a statistical life (the value that society is willing to pay to reduce the certain risk of death or prevent a member of society from an early death; Wang et al., 2020) was used to quantify the PM2.5-related and O3-related economic losses associated with public health.
The major aims of this study were the following: (1) to analyze the spatio-temporal evolution and the differentiation characteristics of urban PM2.5 and O3 pollution in 2015–2020 and to screen the urban agglomeration using spatial aggregation; (2) to quantitatively identify the driving factors of the PM2.5 and O3 pollution caused by meteorological factors and anthropogenic emission factors; (3) to quantify the health losses of the PM2.5 and O3 driven by anthropogenic emissions in hot cities and to calculate the economic losses associated with public health based on the empirical analysis of the value of a statistical life; and (4) to establish a health-loss rating system of the PM2.5 and O3 pollution, based on a natural-breakpoint-classification method and to propose targeted pollution-control measures via zoning and classification.
The concentration data were sourced from the National Air Quality Daily,1 published by the Ministry of Ecology and Environment of China. The daily mean (DM) PM2.5 concentration and the maximum daily average of 8 h (MDA8) O3 in 337 cities above the prefecture level (333 prefecture-level cities and 4 municipalities) in China from 2015 to 2020, were screened out. Based on the Technical Regulation for Ambient Air Quality Assessment (HJ663–2013), the arithmetic mean values of the PM2.5 DM and O3 MDA8 were used for daily evaluation. The annual mean (AM) PM2.5 concentration and the 90th percentile of O3 MDA8 concentration were used for annual evaluation. According to HJ663–2013, urban stations above the prefecture level in the national air quality monitoring network referred to the ambient air quality assessment within the scope of urban built-up areas, that is, they belonged to Grade-II ambient-air functional areas. Therefore, the daily evaluation standards of the PM2.5 DM and O3 MDA8 were 75 and 160 μg/m3, respectively. Then the annual exceedence rates of the PM2.5 and O3 pollution in 337 cities were further calculated. Moreover, the average temperature (AT, °C), average atmospheric pressure (AP, hPa), average wind speed (WS, m/s), average wind direction at maximum wind speed (WD, °), and relative humidity (RH, %) were selected as weather normalization prediction parameters. The daily mean data of these five parameters were from the China Meteorological Administration.2 Permanent population and mortality data were obtained from the corresponding China statistical yearbooks.
Spatial autocorrelation is often used to test whether air pollutants aggregate between regions. The global Moran’s I index was selected to analyze the global spatial autocorrelation between PM2.5 and O3. The calculation formulas are as follows:
where n is the number of cities; xa and xb are the values of cells a and b, respectively; and W is the weight matrix. The global Moran’s I is within the range [−1,1], where I < 0 indicates a negative correlation and I > 0 indicates a positive correlation. I close to or equal to 0 indicates a random distribution or no correlation between observations. The Z variable is used to test whether the correlation is significant. E(I) is expectation, and var(I) is variance.
Global spatial autocorrelation cannot reflect the characteristics of urban spatial agglomeration in a region. Therefore, this study used spatial hotspot-detection analysis to test and characterize the effect of spatial local autocorrelation. For i, its corresponding local autocorrelation statistic Getisord Gi* is defined as follows:
where S is the standard deviation. If Gi* is positive and significant, it indicates that the value around i is high, belonging to a hotspot region (high–high aggregation); otherwise, it indicates a cold-spot region (low–low aggregation).
The population-weighted PM2.5 and O3 concentrations in a single grid were calculated by a grid calculator to reflect the exposure risk of the populations in the study area. The formula is as follows:
where is population-weighted PM2.5 or O3 concentration; i is the number of grid cells; Pi is the number of people in the grid; and Ci is the PM2.5 or O3 concentration in the grid, μg/m3.
Weather normalization technology can use randomly selected meteorological conditions to predict air pollutant concentration at a specific measurement time point, that is, to remove the influence of meteorological conditions on pollutant concentration. This method was presented by Grange and Carslaw (2019) for the first time. The input dataset was first randomly generated from the original observation dataset and divided into a training dataset (70% of the input dataset) and a test dataset (30% of the input dataset). For a particular day, the model randomly selected time variables and weather parameters for any day from the feature dataset, and this was repeated 1,000 times to provide a new input dataset. The input dataset was then fed into RF model to predict pollutant concentration on a given day, resulting in 1000 predicted concentrations for that day. The final pollutant concentration, known as the weather-normalization concentration, was the arithmetic average of 1,000 predicted concentrations. The weather normalization R language code for a single city is shown in Supplementary material.
According to the technical specifications for health risk assessment of ambient air pollution (WS/T666–2019), the health risk assessment procedure was divided into four steps: risk identification, risk-response assessment, risk assessment, and risk characteristic description. In this study, the objects of risk identification were PM2.5 and O3. All-cause death was selected as the health end-point for PM2.5 and O3 pollution in this study (Zeng et al., 2019; Qu et al., 2020). The health losses (ΔMort, excess deaths) caused by PM2.5 and O3 pollution were assessed as follows:
where y0 is the baseline mortality of all-cause death; Pop is the annual exposed population from 2015 to 2020; AF is the attributable proportion ( ); RR is relative risk; and the calculation formula is as follows:
where C is the concentrations of PM2.5 and O3; and C0 is the minimum risk exposure concentrations of PM2.5 and O3. MDA8 O3 is also a scientific representative of the impact of O3 pollution on human health (Yan et al., 2012). Therefore, C was chosen as PM2.5 AM and MDA8 O3 for the calculated concentrations. For C0, based on existing studies, the highest concentration of PM2.5 without health damage is 5.8–8.8 μg/m3 (Lim et al., 2012), and the average value is 7.3 μg/m3. According to the study of Turner et al. (2016), the lowest risk exposure level of the annual mean MDA8 O3 is 26.7 ppb (57.3 μg/m3). Therefore, C0 was set at 7.3 μg/m3 for PM2.5 and 57.3 μg/m3 for O3. β is the concentration-response coefficient, which was obtained according to the existing studies (Yin et al., 2017; Zeng and Ruan, 2020), as shown in Table 1.
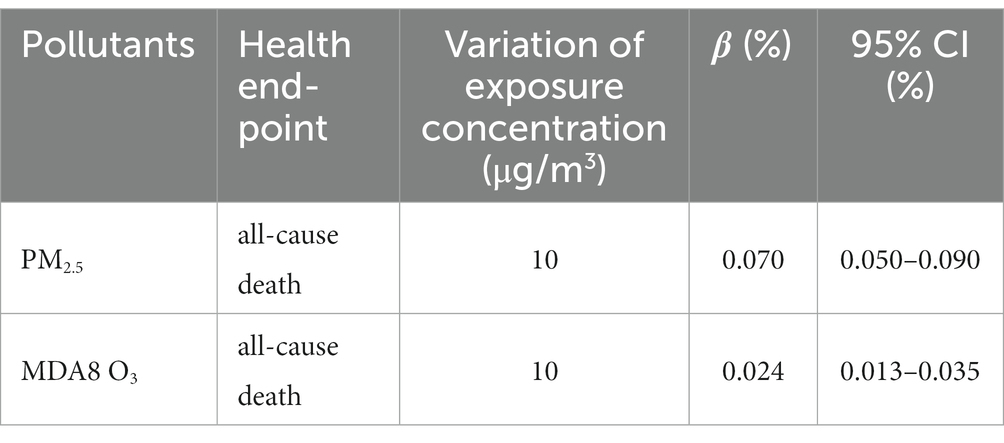
Table 1. Exposure-response coefficient of the PM2.5 and O3.
The evaluation method of the economic losses associated with public health is as follows:
where Δ Mort is the health loss corresponding to PM2.5 and O3. HL is the economic losses associated with public health.
At present, the value of statistical life (VSL) has often been used to quantify the economic losses associated with public health (Qu et al., 2020; Wang et al., 2020; Xu et al., 2021). This study selected the combination of questionnaire research and a result-transfer method to reduce uncertainty in the VSL calculations. Taking Wuhan as the research object, we conducted an empirical study and conducted a questionnaire survey of the willingness to pay across 13 administrative regions of Wuhan. Questionnaire design was shown in Supplementary material. Based on the survey, the average level of willingness to pay (WTP) for reducing the excess mortality risk of PM2.5 per 1,000 people in Wuhan over the next 10 years was RMB 146.25 (RMB 1 = USD 0.1485 on 18 July 2022)/year/person. The corresponding VSL value was RMB 1,462,500 in 2020.
Figure 1 shows the spatio-temporal distribution of PM2.5 AM, and the corresponding exceedence rates (ERs) in 337 prefecture-level cities in China. Generally, the PM2.5 AMs of the total 337 cities from 2015 to 2020 were 10–118 μg/m3, 11–157 μg/m3, 10–100 μg/m3, 8–116 μg/m3, 7–110 μg/m3, and 6–113 μg/m3, respectively. The highest values were concentrated in Hotan and Kashgar of Xinjiang, while the lowest values were in Nyingchi, Shannan, and Ngari of Tibet. The high PM2.5 in Xinjiang was due to natural factors, such as sand and dust. In addition, the PM2.5 AMs in 337 cities from 2015 to 2020 were 50 ± 19, 46 ± 18, 44 ± 16, 39 ± 15, 37 ± 14, 33 ± 13 μg/m3, respectively. A total of 78%, 72%, 69%, 58%, 50%, and 41% of the cities were exposed to AMs > 35 μg/m3, respectively, which initially showed the heavy pollution and the relative exposure risk to PM2.5 in China. The annual mean ERs of PM2.5 were 56% (20%–95%), 50% (22%–94%), 48% (4%–93%), 41% (0%–90%), 36% (0%–91%), and 31% (0%–95%), respectively, which also showed a downward trend, year over year. Spatially, the cities with PM2.5 AMs exceeding the standard (AM > 35 μg/m3) in 2015 were all located in the eastern, northern, and western regions of China, and the pollution was very serious. From 2016 to 2020, the PM2.5 pollution level in the central and northern regions gradually decreased, and the high pollution areas became gradually concentrated in the northwest and eastern regions of the contiguous distribution. The degree of pollution in the southern region also gradually weakened, and the high-value area gradually shifted to the northeast. By 2020, the areas with high PM2.5 values were concentrated in the northwest, north, and central urban areas of China.
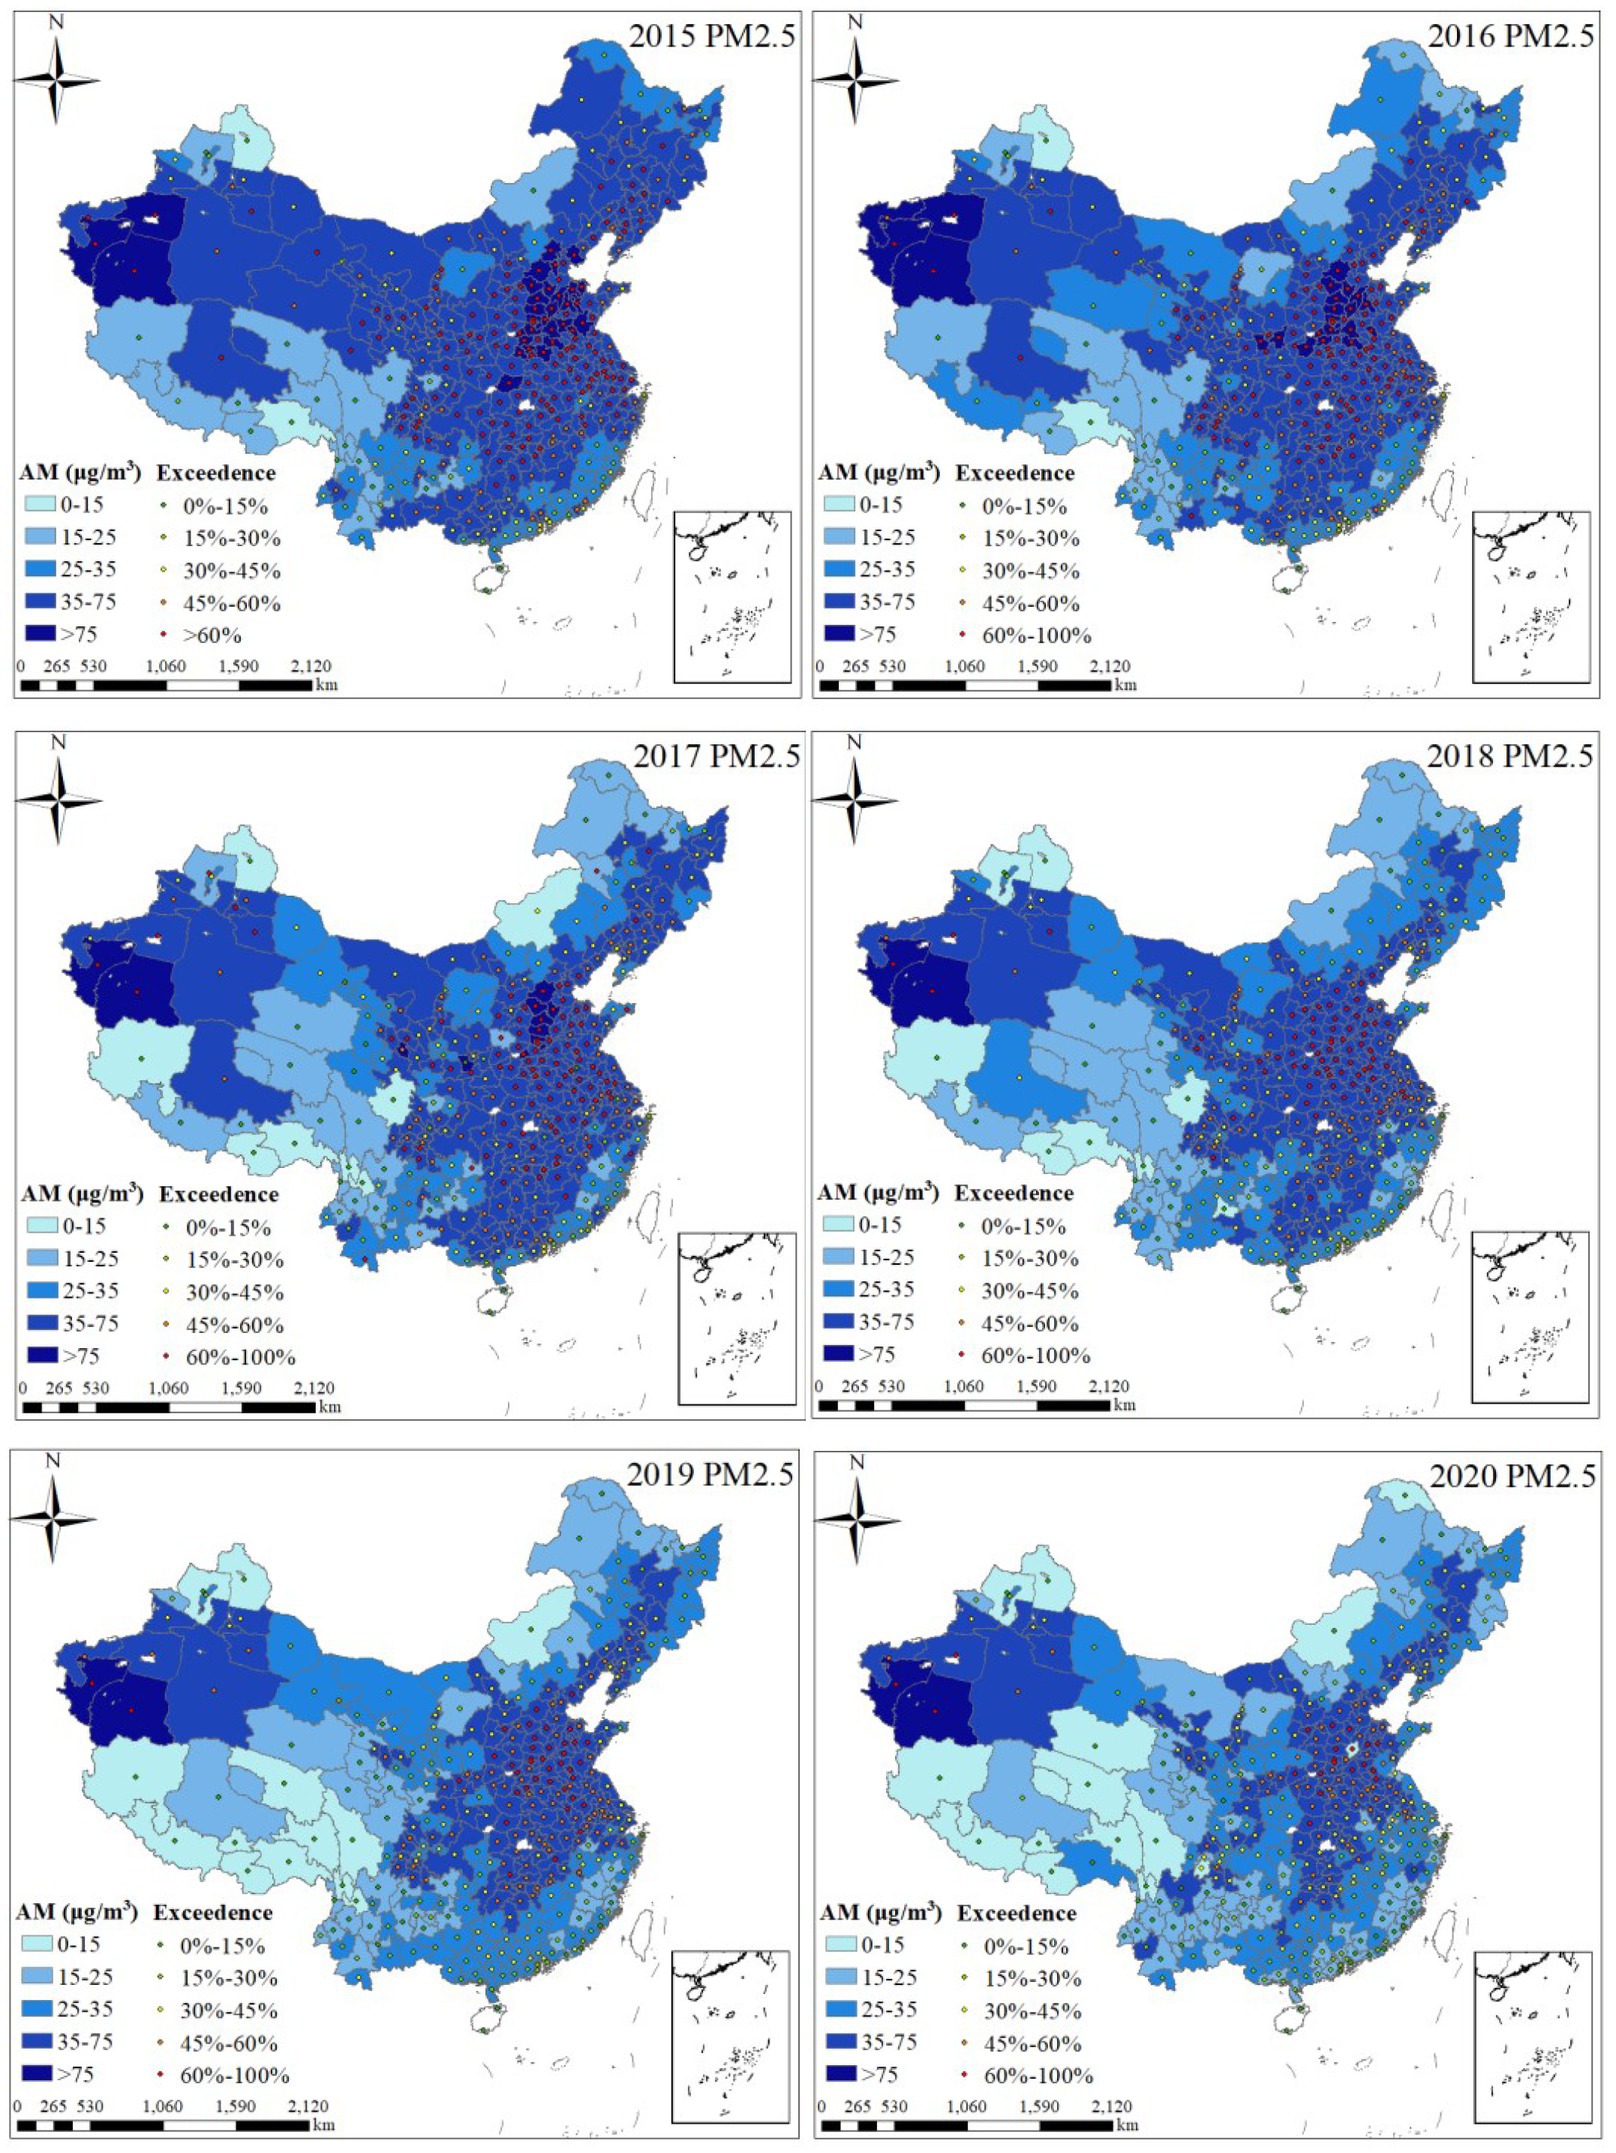
Figure 1. Spatiotemporal distribution of annual mean values and exceedence rates of PM2.5 from 2015 to 2020.
Figure 2 shows the spatio-temporal evolution and distribution of O3 MDA8–90% and the corresponding ERs in 337 cities in China. The range of O3 MDA8–90% from 2015 to 2020 were 62–202, 74–200, 78–220, 74–215, 82–209, and 82–194 μg/m3, respectively. The highest values were concentrated in Beijing and Baoding in North China as well as Liaocheng and Zibo in Shandong Peninsula. The lowest values were primarily distributed across Hami, Naqu, and Turpan, in Xinjiang from 2015 to 2018. From 2019 to 2020, the lowest values were transferred to Jixi and Mudanjiang in northeast China. In addition, the O3 MDA8–90% AMs in China from 2015 to 2020 were 135 ± 26, 138 ± 25, 149 ± 28, 150 ± 26, 148 ± 27, and 138 ± 23 μg/m3, respectively. A total of 17%, 18%, 31%, 33%, 30%, and 17% of the cities were exposed to O3 MDA8–90% > 160 μg/m3, respectively, indicating that the O3 pollution trend first increased and then decreased. The O3 MDA8–90% ERs were 5% (0%–25%), 5% (0%–28%), 8% (0%–31%), 8% (0%–30%), 8% (0%–28%), and 5% (0%–23%), respectively, which also indicated a trend of first increasing and then decreasing. Spatially, the O3 pollution in 2015 was relatively low, and the cities with O3 MDA8–90% > 160 μg/m3 were distributed across North China, the Shandong Peninsula, and the eastern coastal areas. From 2016 to 2018, the high-value areas of O3 pollution spread to the central region, and the overall pollution level increased. From 2018 to 2020, the high-value areas of O3 pollution were concentrated in North China, and the pollution appeared to be decreasing.
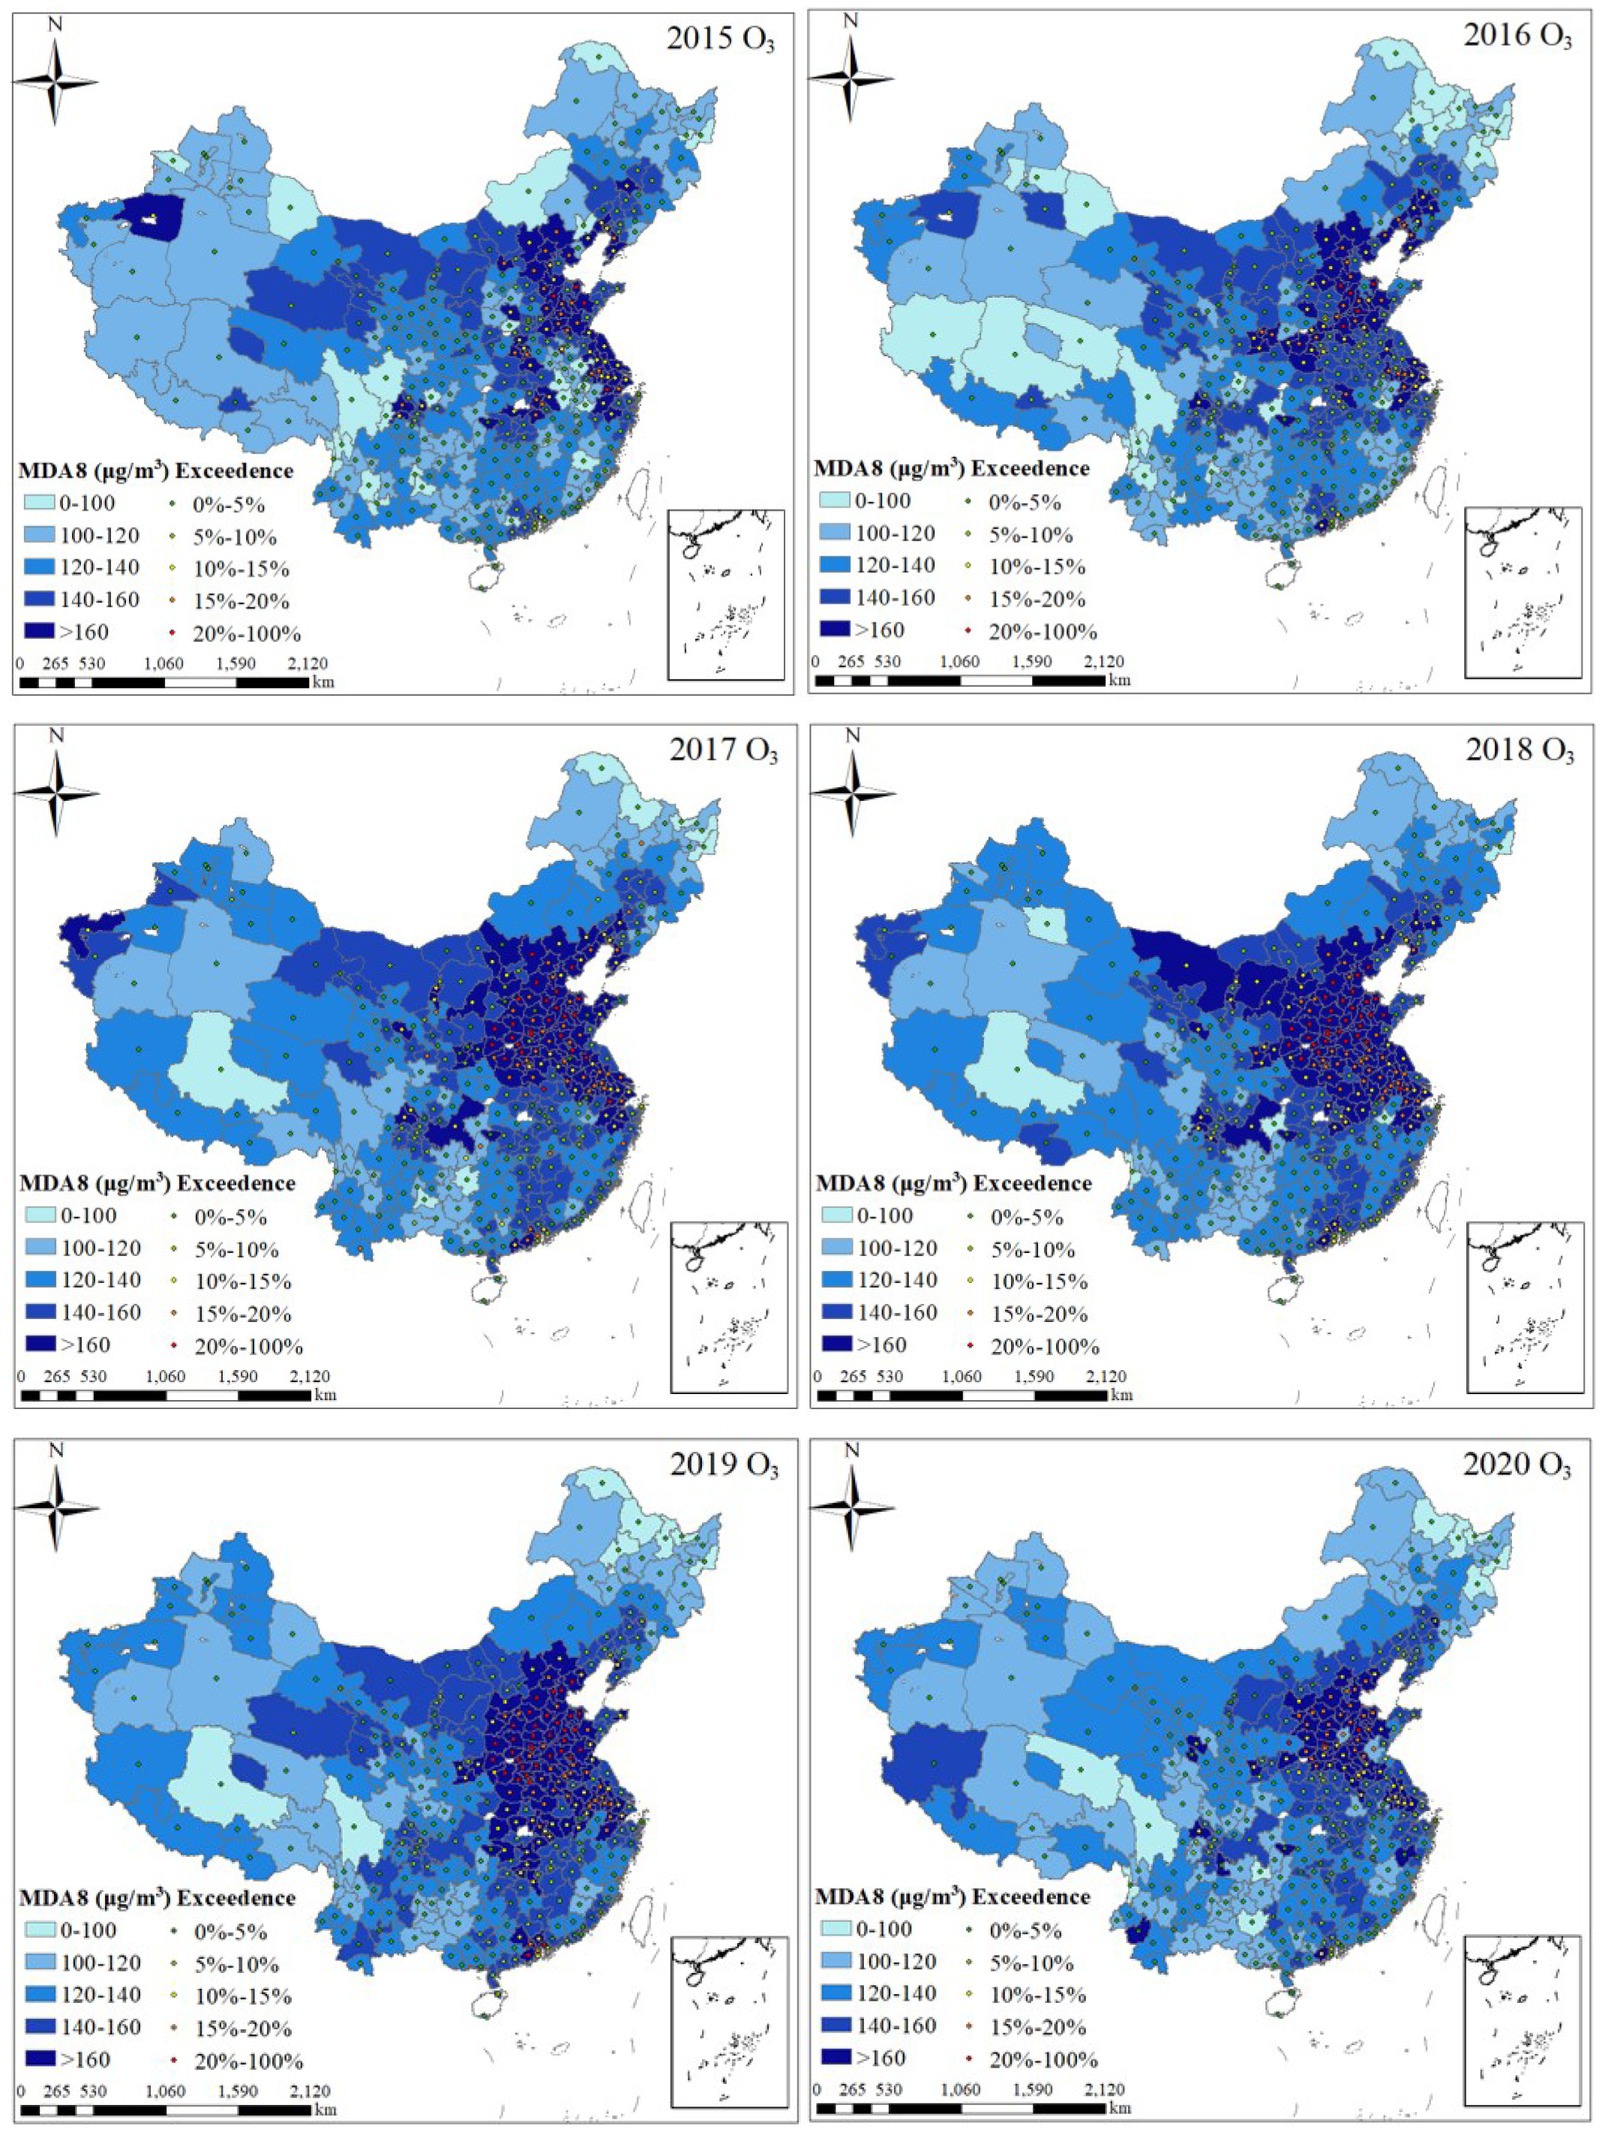
Figure 2. Spatiotemporal distribution of O3 MDA8–90% and exceedence rates from 2015 to 2020.
Based on the analysis of Figures 1, 2, it showed that the PM2.5 pollution in China had a continuous downward trend from 2015 to 2020, while the corresponding O3 pollution trend first increased (2015–2018) and then decreased (2018–2020). The Air Pollution Prevention and Control Plan (hereinafter, Plan) issued in 2013 focused on particulate matter, which greatly reduced the emission of particulate matter, thus explaining the continuous decline of the PM2.5 from 2015 to 2018. Li et al. (2019b) used the Goddard Earth Observation System Chemical Transport Model (GEOS-Chem) for sensitivity simulation and proved the inhibitory effect of the PM2.5 on O3 generation. The results showed that PM2.5 could absorb HO2 free radicals and NO x as raw materials for O3 generation (Eqs. 10–12) and further inhibited O3 generation. Therefore, from 2015 to 2018, when PM2.5 pollution had decreased significantly with the implementation of the air pollution-control policies, the surface O3 pollution increased to varying degrees. In addition, the Ministry of Ecology and Environment of China suggested that the high pollution of O3 was also due to the high emission of precursors and the more favorable meteorological conditions (high temperature and less rain).
ArcGIS 10 software was used to test the global spatial autocorrelation. First, the effects of spatial aggregation of the PM2.5 and O3 MDA8–90% AMs in 337 cities were tested. The test results were shown in Table 2, which indicated that the Moran’s I values of the PM2.5 and O3 in 2015–2020 were both greater than 0, indicating that there were positive spatial autocorrelations between the PM2.5 and O3 concentrations in 337 cities. In addition, at the significance level below 1%, the Z values of the PM2.5 and O3 pollution from 2015 to 2020 were greater than 2.58, indicating significant positive spatial autocorrelations and significant spatial effects from pollution. Spatially, the high pollution areas and low pollution areas often clustered.
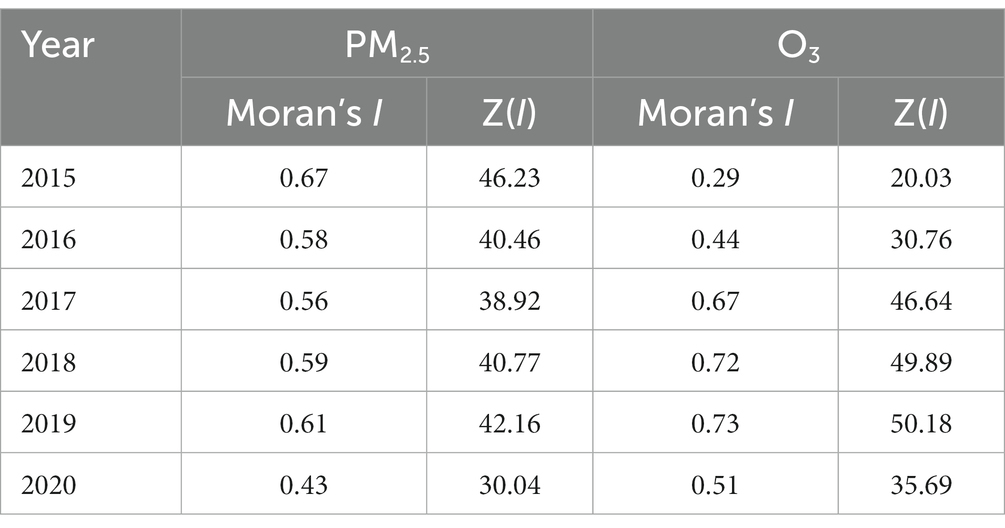
Table 2. Spatial autocorrelation test of the PM2.5 and O3 pollution in 337 cities.
The effect of local spatial autocorrelation of the PM2.5 and O3 pollution in 337 cities was further explored. ArcGIS 10 was used to analyze cold and hotspots. Combined with the spatial distribution of the PM2.5 and O3 cold spots and hotspots in Figures 3, 4, it showed that PM2.5 and O3 AMs presented spatial clustering states during 2015–2020, and the distributions of the cold spots and the hotspots were roughly the same. From 2015 to 2020, the hotspots were predominantly concentrated in Beijing, Tianjin, Henan, Hebei, Shandong, Anhui, Jiangsu, Shanxi, Hubei, and Shaanxi, covering 82 cities. In 2015, the common hotspots also included Huludao in Liaoning Province. Since the beginning of 2016, the hot cities migrated into the southwest, including Hubei Province in the South and Shaanxi Province in the West.
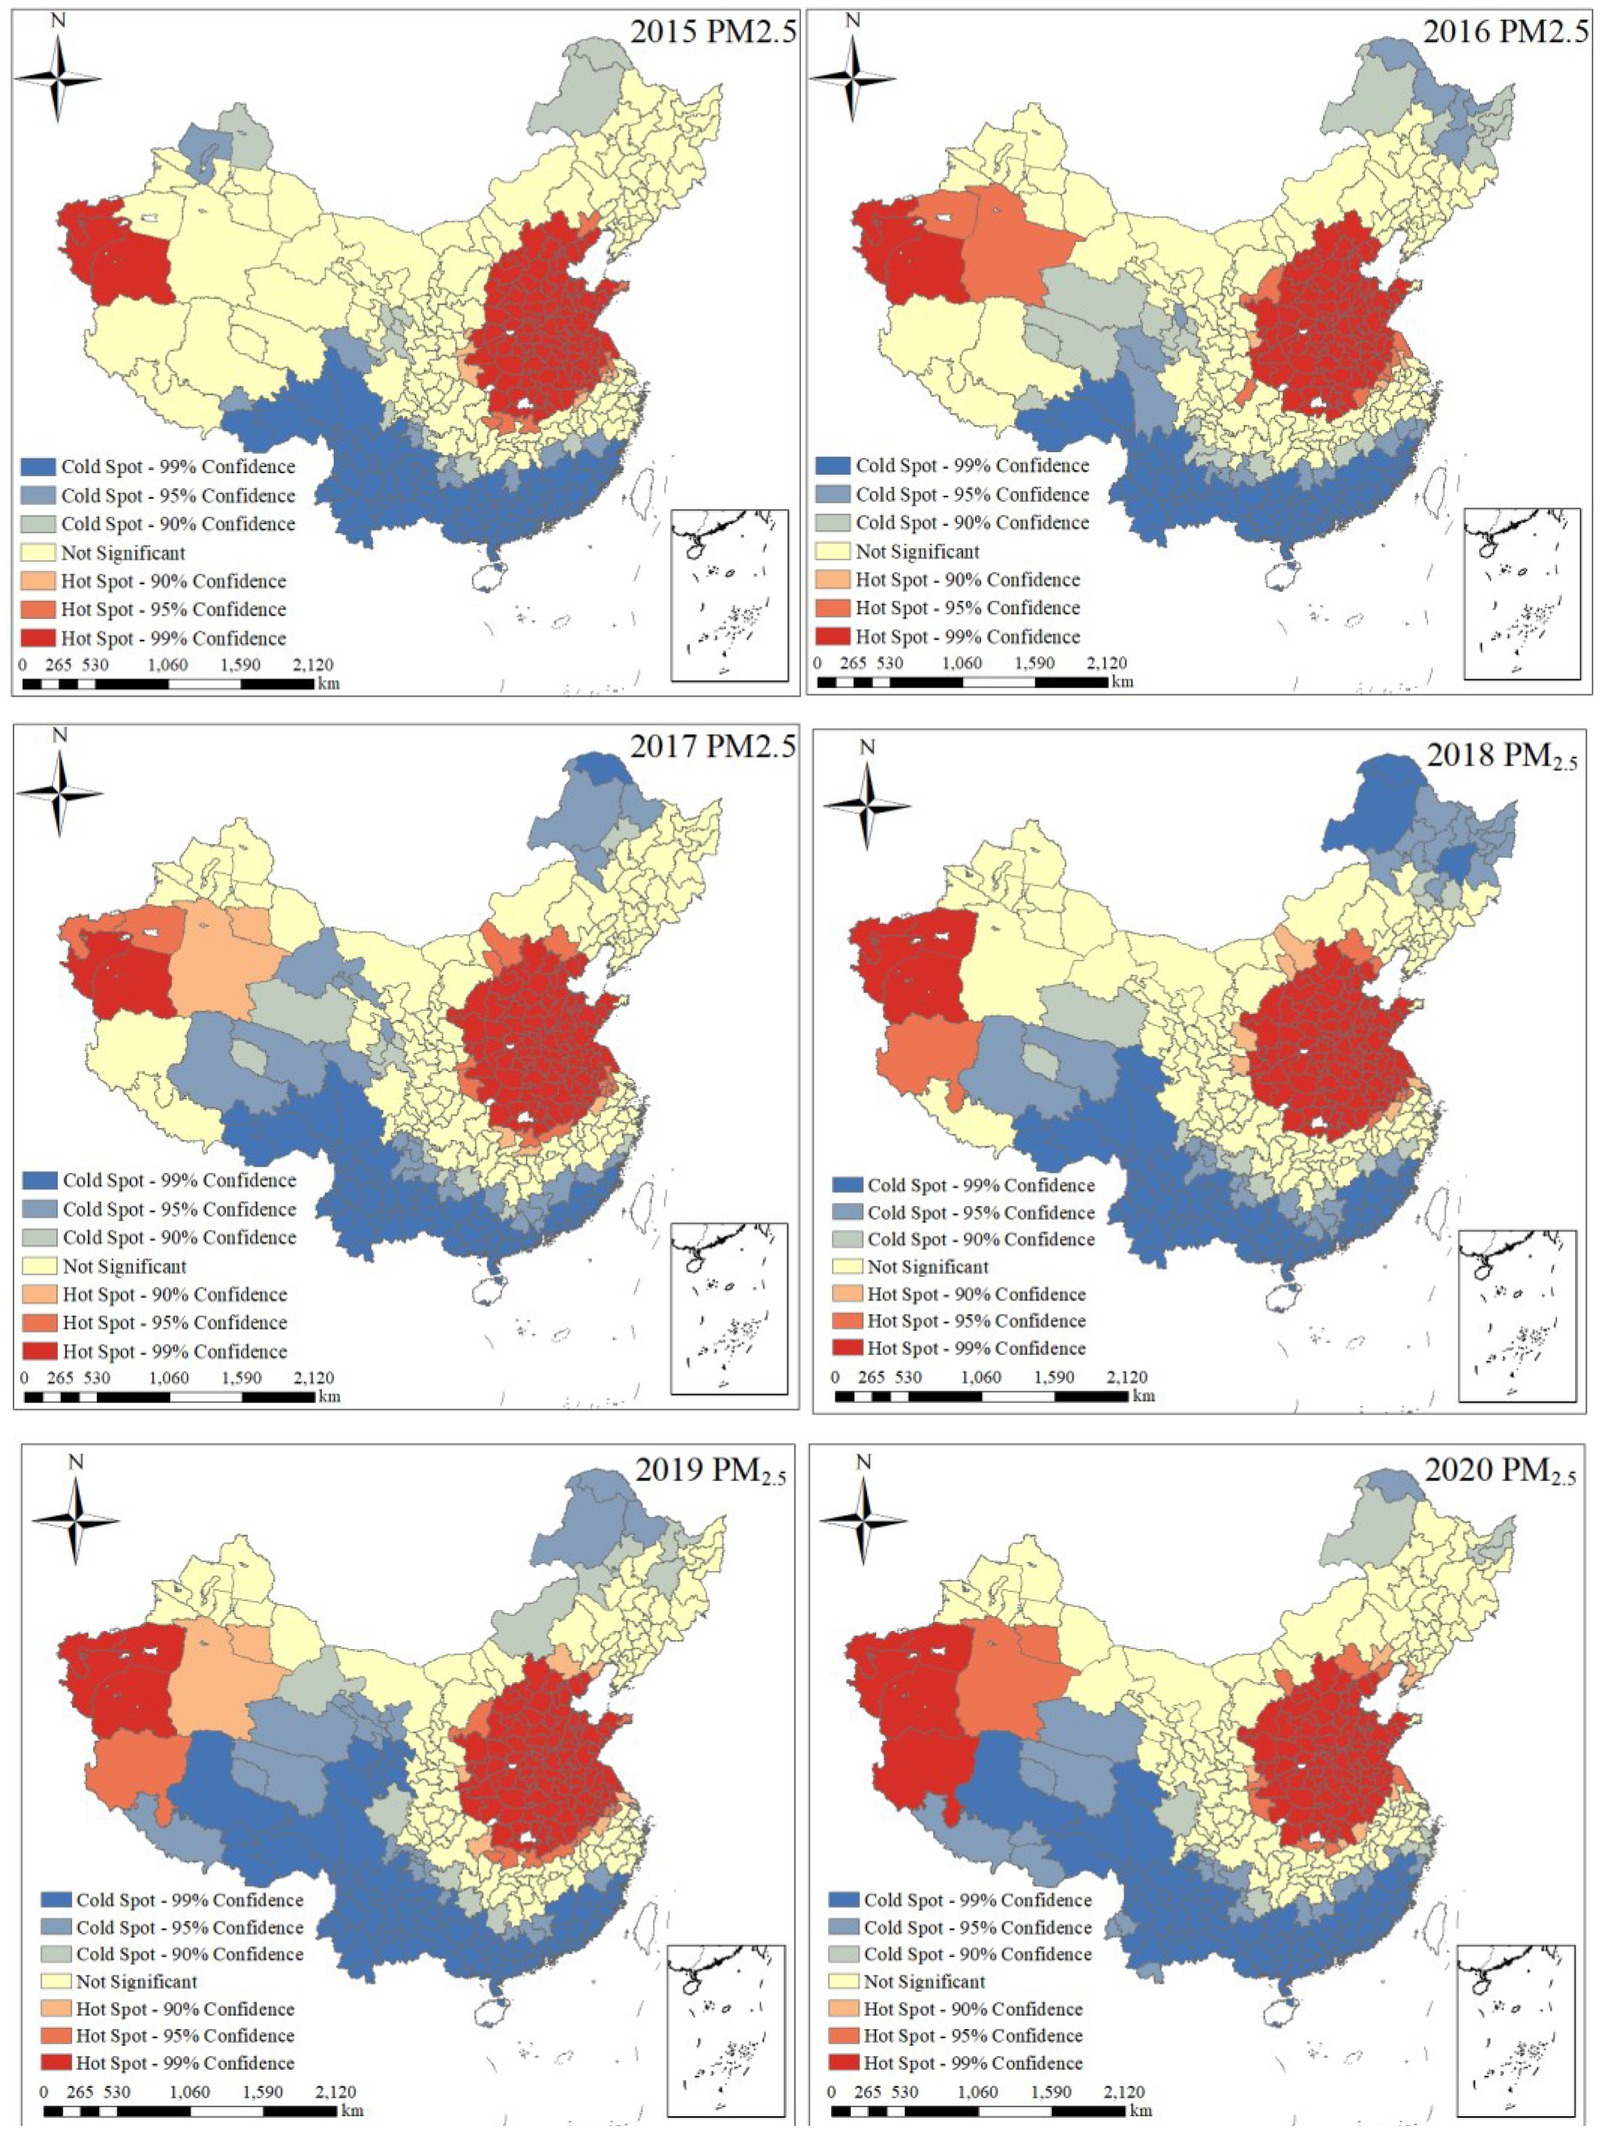
Figure 3. Spatial distribution of cold spots and hotspots of PM2.5 pollution.
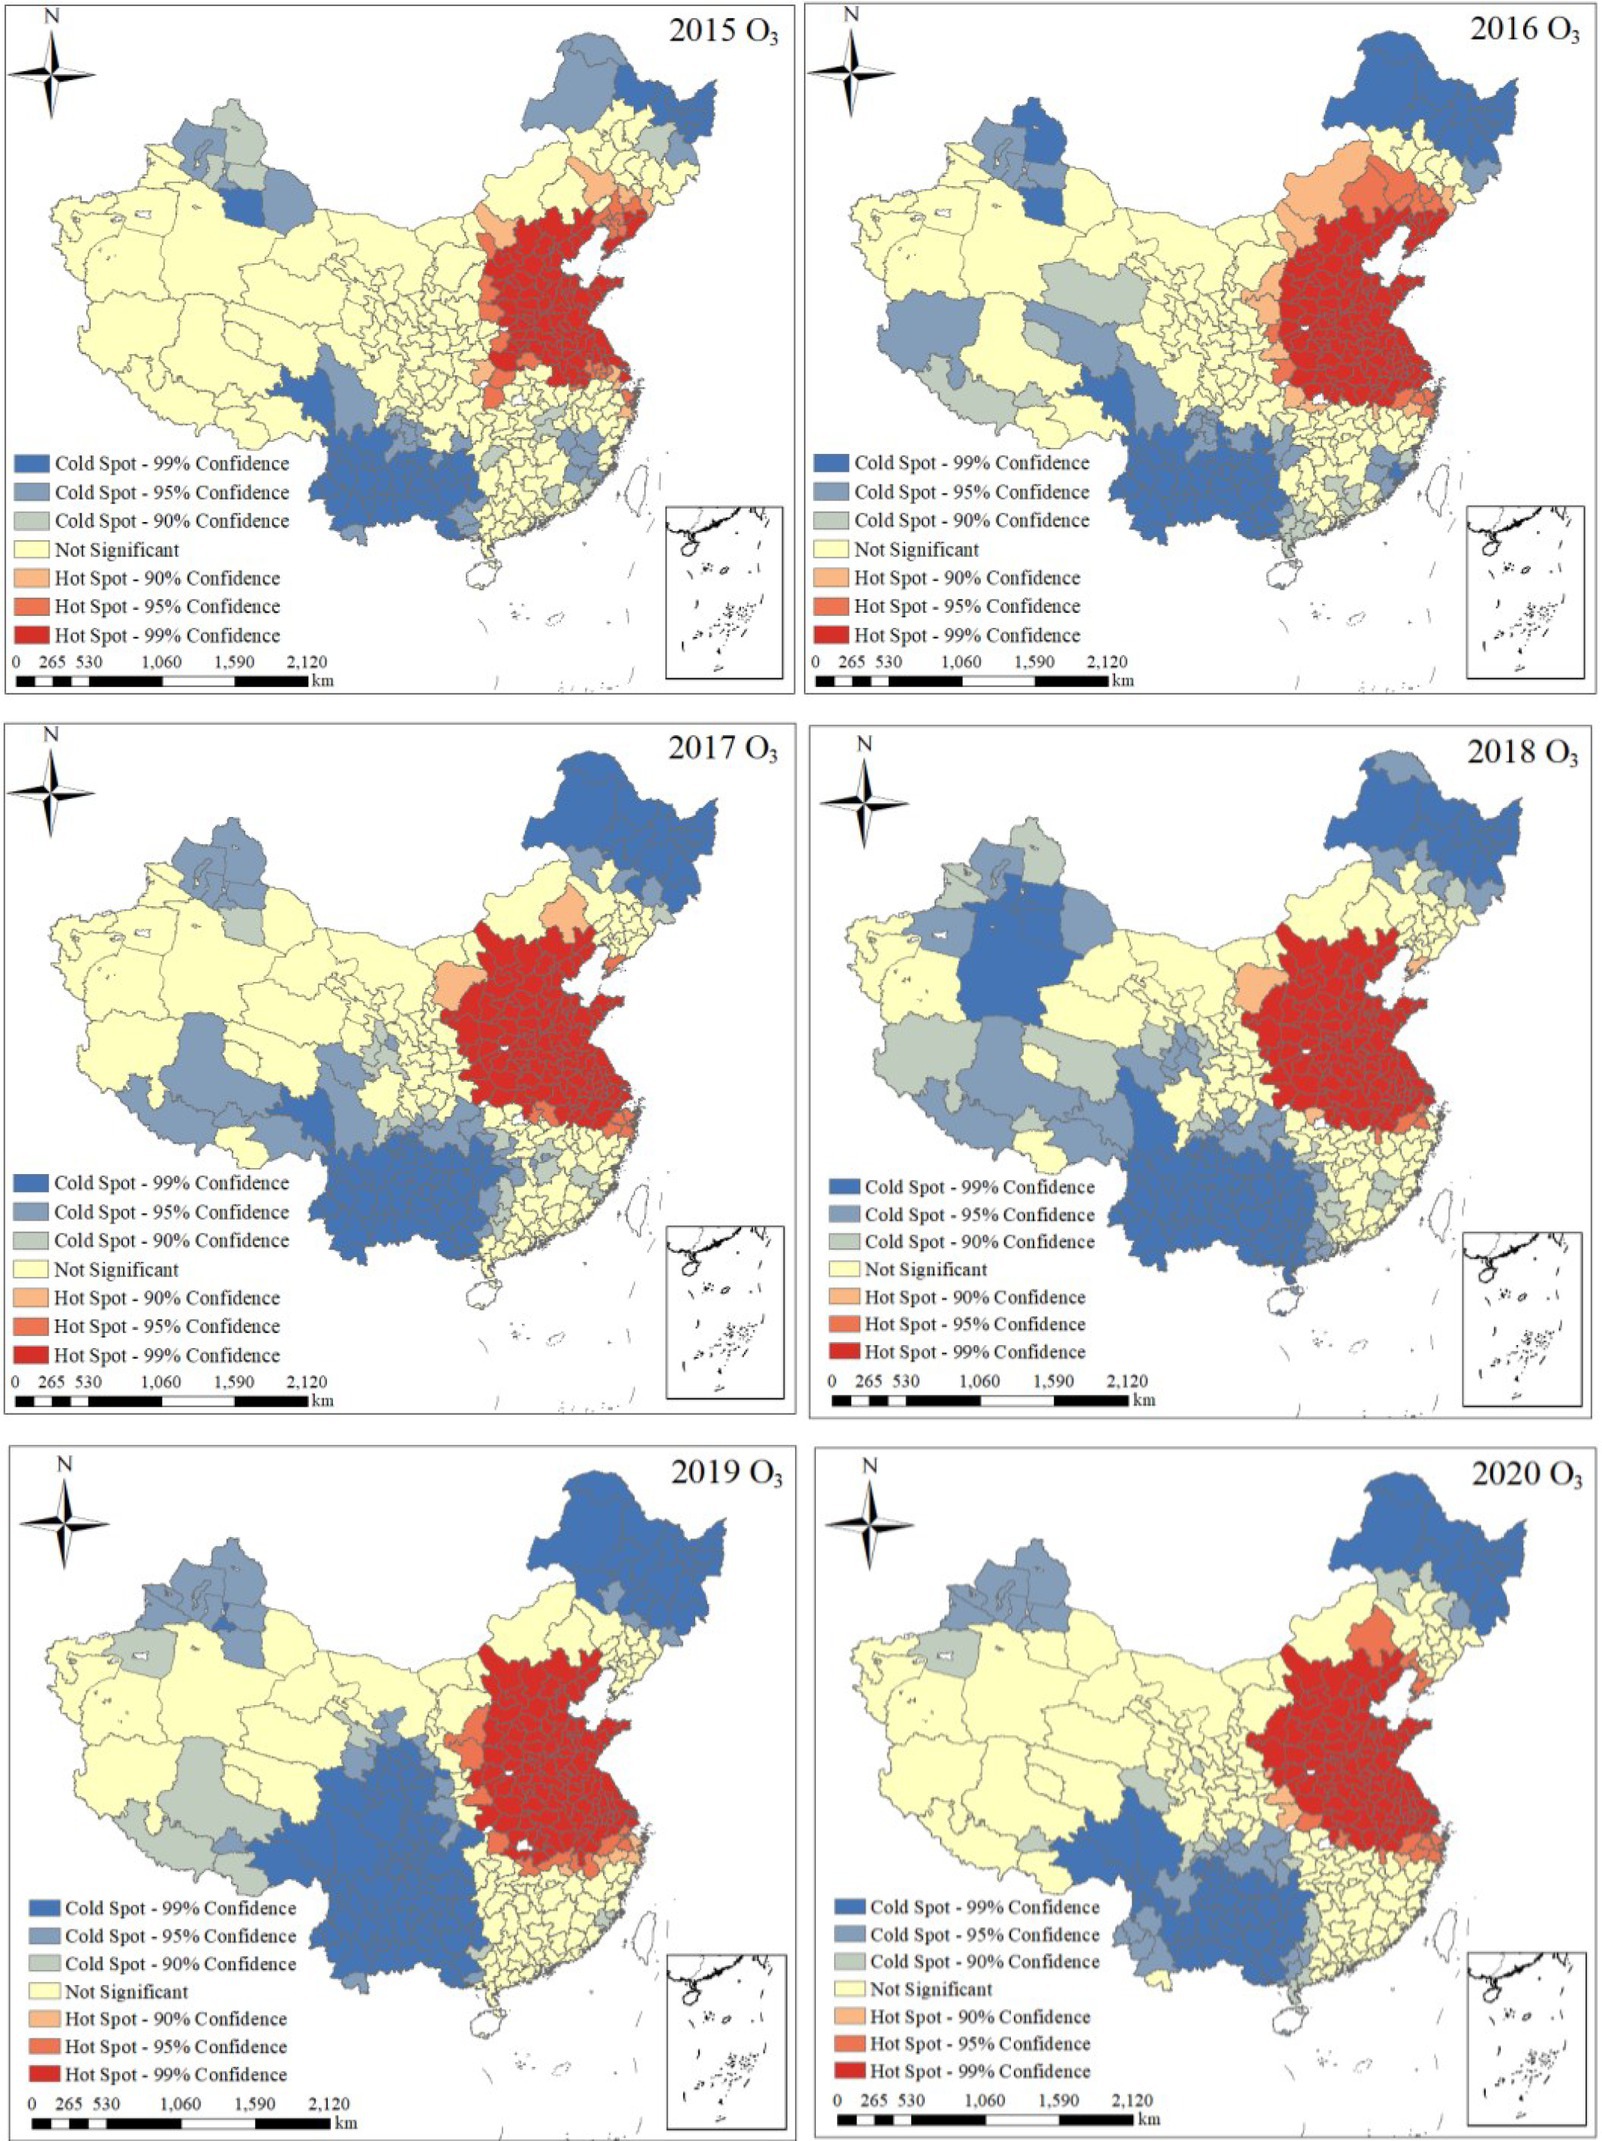
Figure 4. Spatial distribution of cold spots and hotspots of O3 pollution.
PM2.5 and O3 risk levels of exposure under population-weighted conditions were shown in Supplementary Figures S3, S4. The 0.5 standard deviation classification method was used to divide the population-weighted concentration values into six levels: the higher the level, the higher the exposure risk to PM2.5 and O3. The low risk of exposure was classified as levels 1 and 2; the medium risk of exposure was classified as levels 3 and 4; and the high risk of exposure was classified as levels 5 and 6. From 2015 to 2020, the regions with the highest exposure risks of the PM2.5 and O3 pollution were similar and concentrated in the central and eastern regions of China, such as Beijing, Tianjin, Hebei, Henan, Anhui, Beijing–Tianjin–Hebei, Yangtze River Delta, and Central Plains urban agglomeration. In addition, the low-exposure risk was distributed across Xinjiang, Qinghai, and other western regions.
In order to control hotspot cities methodically based on the spatial aggregation of hotspot cities, the distribution of the population-weighted PM2.5 and O3 concentrations, and referring to the existing division of the country, the common hotspot cities of the PM2.5 and O3 pollution were divided into six urban agglomerations by zone clustering: Beijing–Tianjin–Hebei (BTH), Central Plains (CP), Guanzhong Plains (GZP), Yangtze River Delta (YRD), middle reach of Yangtze River urban (Triangle of Central China, or TC), and the Shandong Peninsula (SDP). Six hot urban agglomerations are shown in Figure 5.
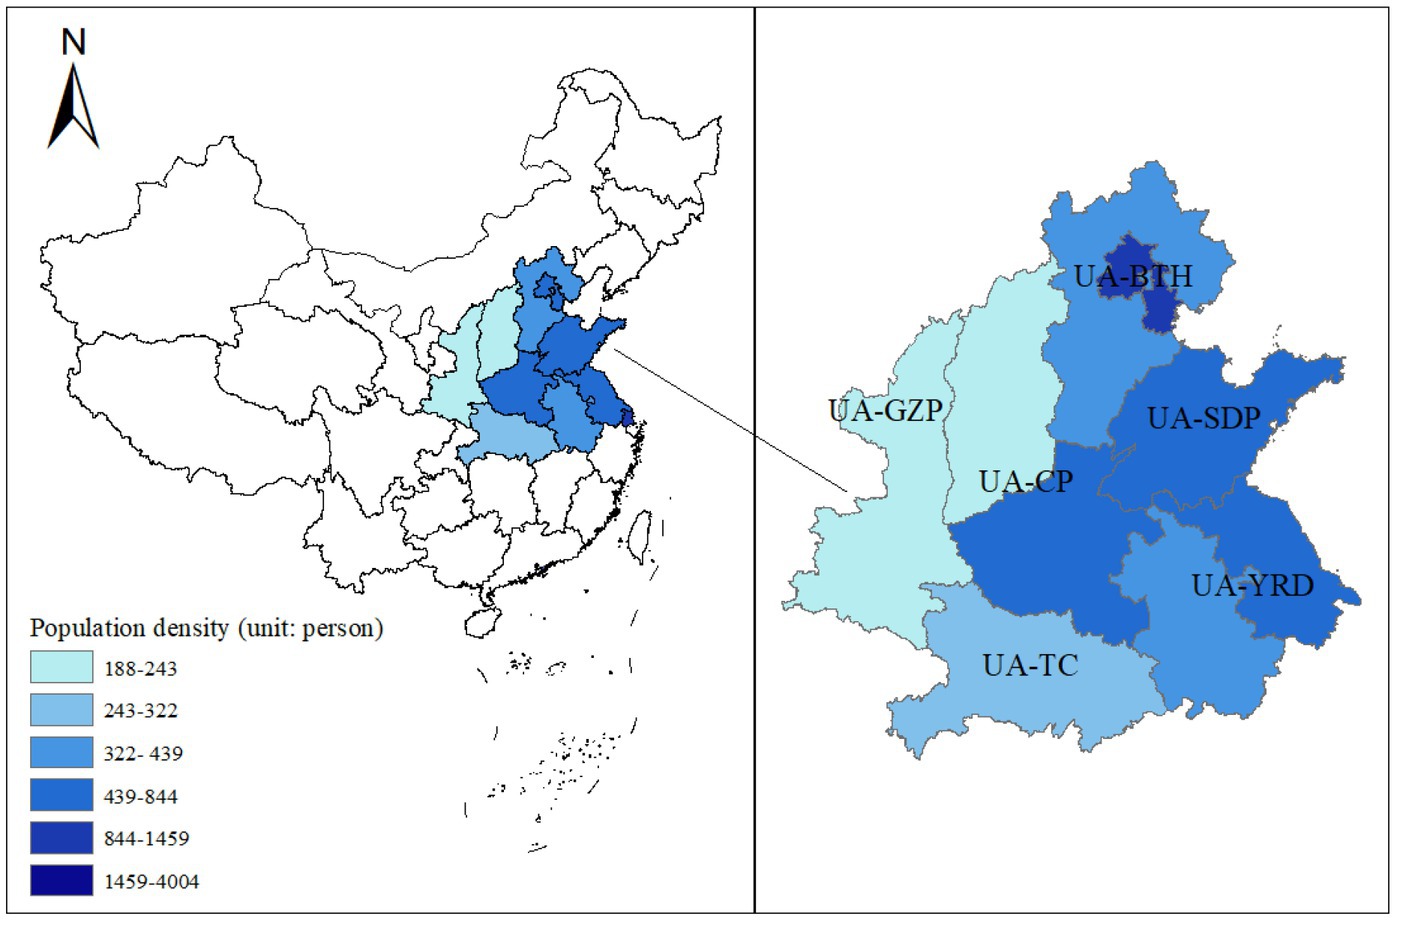
Figure 5. Location distribution of hotspot urban agglomeration.
In order to further quantitatively analyze the pollution drivers in high-pollution cities, accumulation maps were drawn for the average annual observed values of PM2.5 and O3, from 2015 to 2020. The overall PM2.5 pollution levels, from 2015 to 2020, were as follows: BTH > CP > SDP > TC > YRD > GZP. The PM2.5 AMs in the six hotspot urban agglomerations showed a decreasing trend. PM2.5 AM values were 78 μg/m3 (BTH), 72 μg/m3 (CP), 73 μg/m3 (SDP), 67 μg/m3 (TC), 58 μg/m3 (YRD), and 53 μg/m3 (GZP), in 2015, and in 2020, these decreased by 32 μg/m3, 25 μg/m3, 29 μg/m3, 27 μg/m3, 20 μg/m3, and 14 μg/m3, respectively, accounting for 41.5, 34.3, 39.7, 41.0, 34.8, and 25.8%, respectively, as compared to 2015. The reduction in the anthropogenic emission contribution was the main reason for the improvement in the urban PM2.5 pollution, accounting for 75.4%, 77.8%, 75.5%, 75.8%, 72.4%, and 64.5% of the observed decreased PM2.5, respectively, showing the importance of air pollution-reduction measures in 2015–2020. Meteorology had a minor effect on the PM2.5 pollution in six hotspots, and it showed a decreasing effect or a slightly increasing effect over a single year.
The overall O3 pollution levels from 2015 to 2020 were as follows: BTH > SDP > CP > YRD > GZP > TC. The annual mean value (MDA8–90%) of O3 in six hot urban agglomerations showed an increasing, and then decreasing, trend, and the peak value was found in 2017–2018, which was consistent with the national trend. The O3 observed values fluctuated with the meteorological factors, and the meteorological factors were the controlling factors of the changes in O3 pollution, as compared to anthropogenic sources, and the driving force of the O3 pollution was positive, which positive led the generation of O3 pollution and aggravated the pollution (Kumar et al., 2014).
From the perspective of urban agglomeration, both observed values of the PM2.5 and anthropogenic-driven AM concentrations decreased in six urban hotspots in 2015–2020, indicating that with the effective implementation of air pollution-control programs in recent years, the PM2.5 pollution at the urban agglomeration level had decreased. However, there remained a gap, as compared to the national standard (35 μg/m3). The O3 ERs were improved. Except for the highly polluted BTH, all of which exceeded the O3 limit (160 μg/m3) during 2015–2020, the remaining five urban agglomerations only exceeded the O3 limit in the peak years (2017, 2018, and 2019). In addition, BTH, CP, and SDP ranked as the top three in terms of O3 and PM2.5 pollution, which should be the focus for strict control (Figures 6, 7).
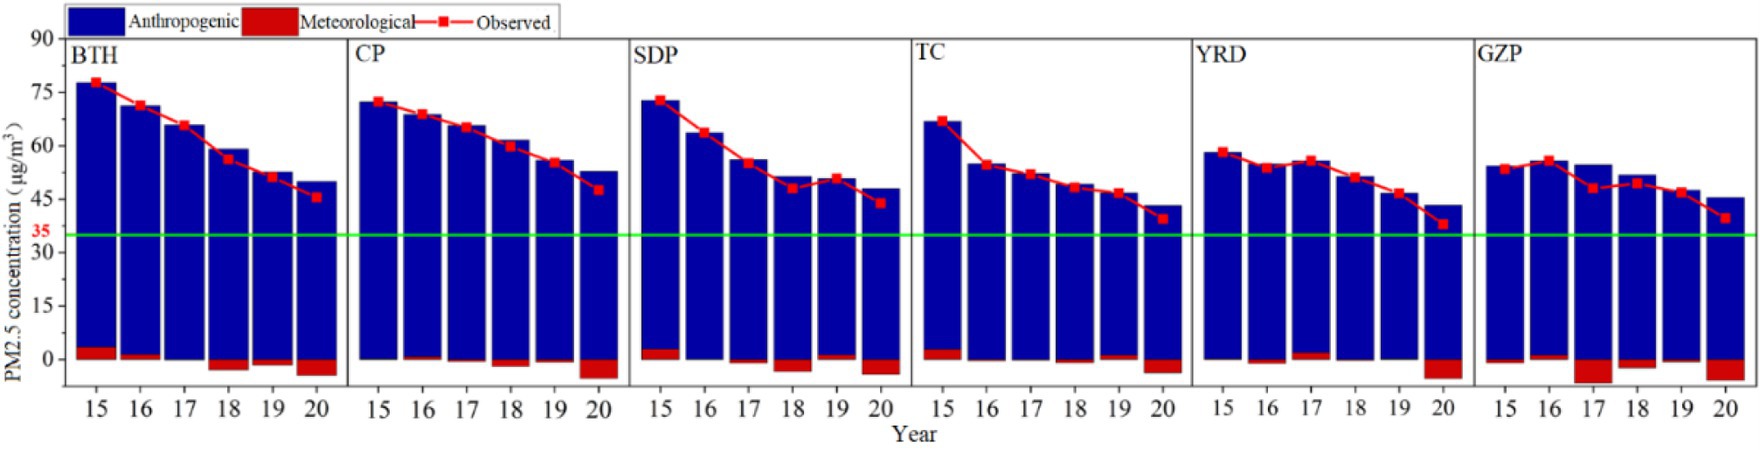
Figure 6. Observed variations of the PM2.5 concentrations under anthropogenic and meteorological driving.
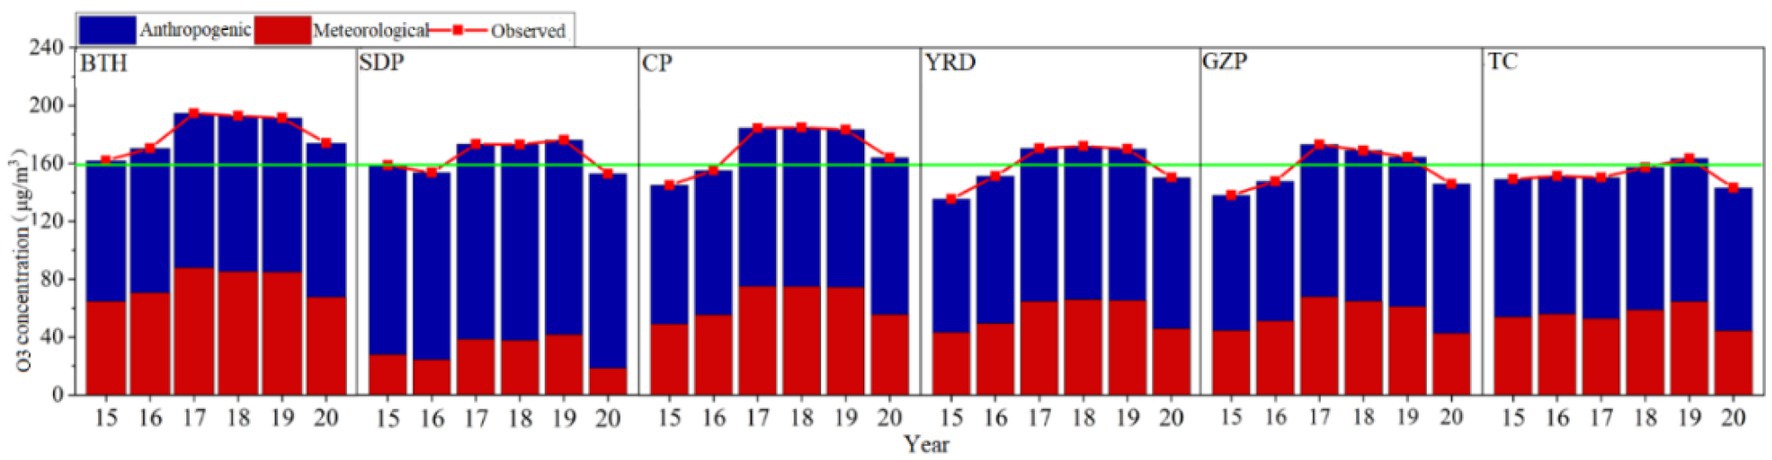
Figure 7. Observed variations of O3 concentrations under anthropogenic and meteorological driving.
The health losses caused by PM2.5 and O3 pollution, as driven by anthropogenic emissions in hot urban agglomerations from 2015 to 2020, were shown in Supplementary Tables S2, S3. Spatially, the average levels of the PM2.5-related health losses in each urban agglomeration were as follows: BTH (1968 people) > SDP (1,396 people) > CP (1,302 people) > YRD (987 people) > TC (932 people) > GZP (869 people). The average level of the O3-related health losses in each urban agglomeration were as follows: BTH (482 people) > SDP (480 people) > CP (314 people) > YRD (306 people) > TC (275 people) > GZP (189 people).
Supplementary Figures S1, S2 show the distribution of the PM2.5-related and O3-related health losses in hot urban agglomerations from 2015 to 2020. The PM2.5-related health losses in hot cities showed a fluctuating downward trend from 2015 to 2020. High PM2.5-related health losses were distributed across Baoding, Beijing, Handan, Shijiazhuang, and Tianjin in BTH; Fuyang, Zhoukou, and Nanyang in CP; Linyi, Jining, and Yantai in SDP; Xuzhou in YRD; Weinan in GZP; and Wuhan in TC, in 2015–2017. However, health losses increased in cities in the northern part of CP, especially in Zhengzhou. In addition, from 2018 to 2020, Beijing, Shijiazhuang, Handan, and Tianjin in BTH; Zhengzhou, and Nanyang in CP; Linyi and Weifang in SDP; Xuzhou in YRD; and Weinan in GZP still had high levels of health losses (more than 2,000 people).
The O3-related health losses in hot cities showed a fluctuating trend from 2015 to 2020, and it gradually increased from 2015 to 2017. The pollution in SDP, the southeastern part of CP, and the eastern part of YRD increased, and the health losses affected more than 675 people. From 2018, due to the implementation of the Blue Sky Protection Campaign, the emissions of O3 precursors were limited, to a certain extent, and the health losses decreased in Yantai, Qingdao, Tai’an, and Linyi in SDP, as well as in Xuzhou in YRD. However, there remained a large number of cities with high levels of health losses (> 675 people), such as Baoding, Beijing, Handan, Shijiazhuang, and Tianjin in BTH; Fuyang, Heze, Nanyang, Zhengzhou, and Zhoukou in CP; Nanjing, Xuzhou, and Yancheng in YRD; Jinan, Jining, Linyi, and Weifang in SDP; and Wuhan in TC. Although pollution levels of PM2.5 and O3 were high in hot cities, the levels and the trends in health losses driven by anthropogenic emissions were different. Therefore, for the composite pollution control of PM2.5 and O3 in hot cities, different types of control areas should be further determined based on the assessments of the health effects.
Based on Equation 8, PM2.5-related health economic losses in hot urban agglomerations during 2015–2020 could be evaluated, as shown in Supplementary Table S4. The average PM2.5-related health economic losses in the six hot urban agglomerations were ranked as follows: BTH (2.321 billion) > SDP (1.607 billion) > YRD (1.075 billion) > TC (1.016 billion) > CP (1.095 billion) > GZP (0.690 billion). The average levels of the health and health economic losses in BTH and SDP were at the forefront. Although the PM2.5-related health losses in CP were high, the health economic losses low. The reason could have been that the per capita disposable income in CP was relatively low, so the VSL obtained was low; thus, the health economic losses were low. The health economic losses not only depended on the PM2.5-related health losses, but it also was affected by the level of urban economic development. Therefore, the proportion of the health economic losses to the GDP was further calculated. The proportion of health economic losses in six urban agglomerations were CP (0.47%) > GZP (0.46%) > BTH (0.40%) > SDP (0.35%) > YRD (0.31%) > TC (0.28%).
The O3-related health economic losses in hot urban agglomeration from 2015 to 2020 were shown in Supplementary Table S5. The average O3-related health economic losses in six hot urban agglomeration were ranked as follows: BTH (3.218 billion) > SDP (2.962 billion) > YRD (1.902 billion) > TC (1.495 billion) > CP (1.453 billion) > GZP (0.828 billion). The average health and health economic losses in BTH and SDP were at the forefront, and the pollution was serious. Furthermore, the proportion of health economic losses to the GDP in six hot urban agglomeration was calculated. The average sizes were SDP (0.64%) > CP (0.61%) > GZP (0.55%) > BTH (0.54%) > YRD (0.53%) > TC (0.40%).
Figure 8 shows the distribution of the PM2.5-related health economic losses in hot urban agglomerations from 2015 to 2020. The range of the PM2.5-related economic losses from 2015 to 2020 were 0.1 billion RMB (Tongchuan)–9.1 billion RMB (Beijing), 0.1 billion RMB (Tongchuan)–9.7 billion RMB (Beijing), 0.3 billion RMB (Tongchuan)–9.6 billion RMB (Beijing), 0.3 billion RMB (Tongchuan)–9.2 billion RMB (Beijing), and 0.2 billion RMB (Tongchuan)–10.5 billion RMB (Beijing). The health economic losses in Beijing in BTH reached its highest levels from 2015 to 2020. The lowest health losses were found in Tongchuan in GZP. Considering the high per-capita disposable income and rapid urban development in Beijing, the residents had a high willingness to pay for pollution and a high VSL, which was matched with the high health economic losses. In addition, from 2015 to 2020, the average levels of the PM2.5-related health economic losses in a single hotspot city were 1.1 ± 1.1 billion RMB, 1.1 ± 1.2 billion RMB, 1.4 ± 1.3 billion RMB, 1.4 ± 1.2 billion RMB, 1.4 ± 1.1 billion RMB, and 1.4 ± 1.3 billion RMB, respectively, showing a fluctuating upward trend. The PM2.5-related health economic losses in 2015–2016 were generally low but showed increasing trends. The high value was in Beijing and Tianjin in BTH in 2015–2016. In 2017, the health economic losses in Beijing and Tianjin in BTH; Jinan and Yantai in SDP; and Wuhan in TC were higher, reaching more than 4 billion RMB. As compared to 2017, the high-value area of health economic losses decreased in 2018 and continued to decrease from 2018 to 2019. However, health economic losses in Zhengzhou, Linyi, and Nanjing, in 2020, were higher than those in 2019.
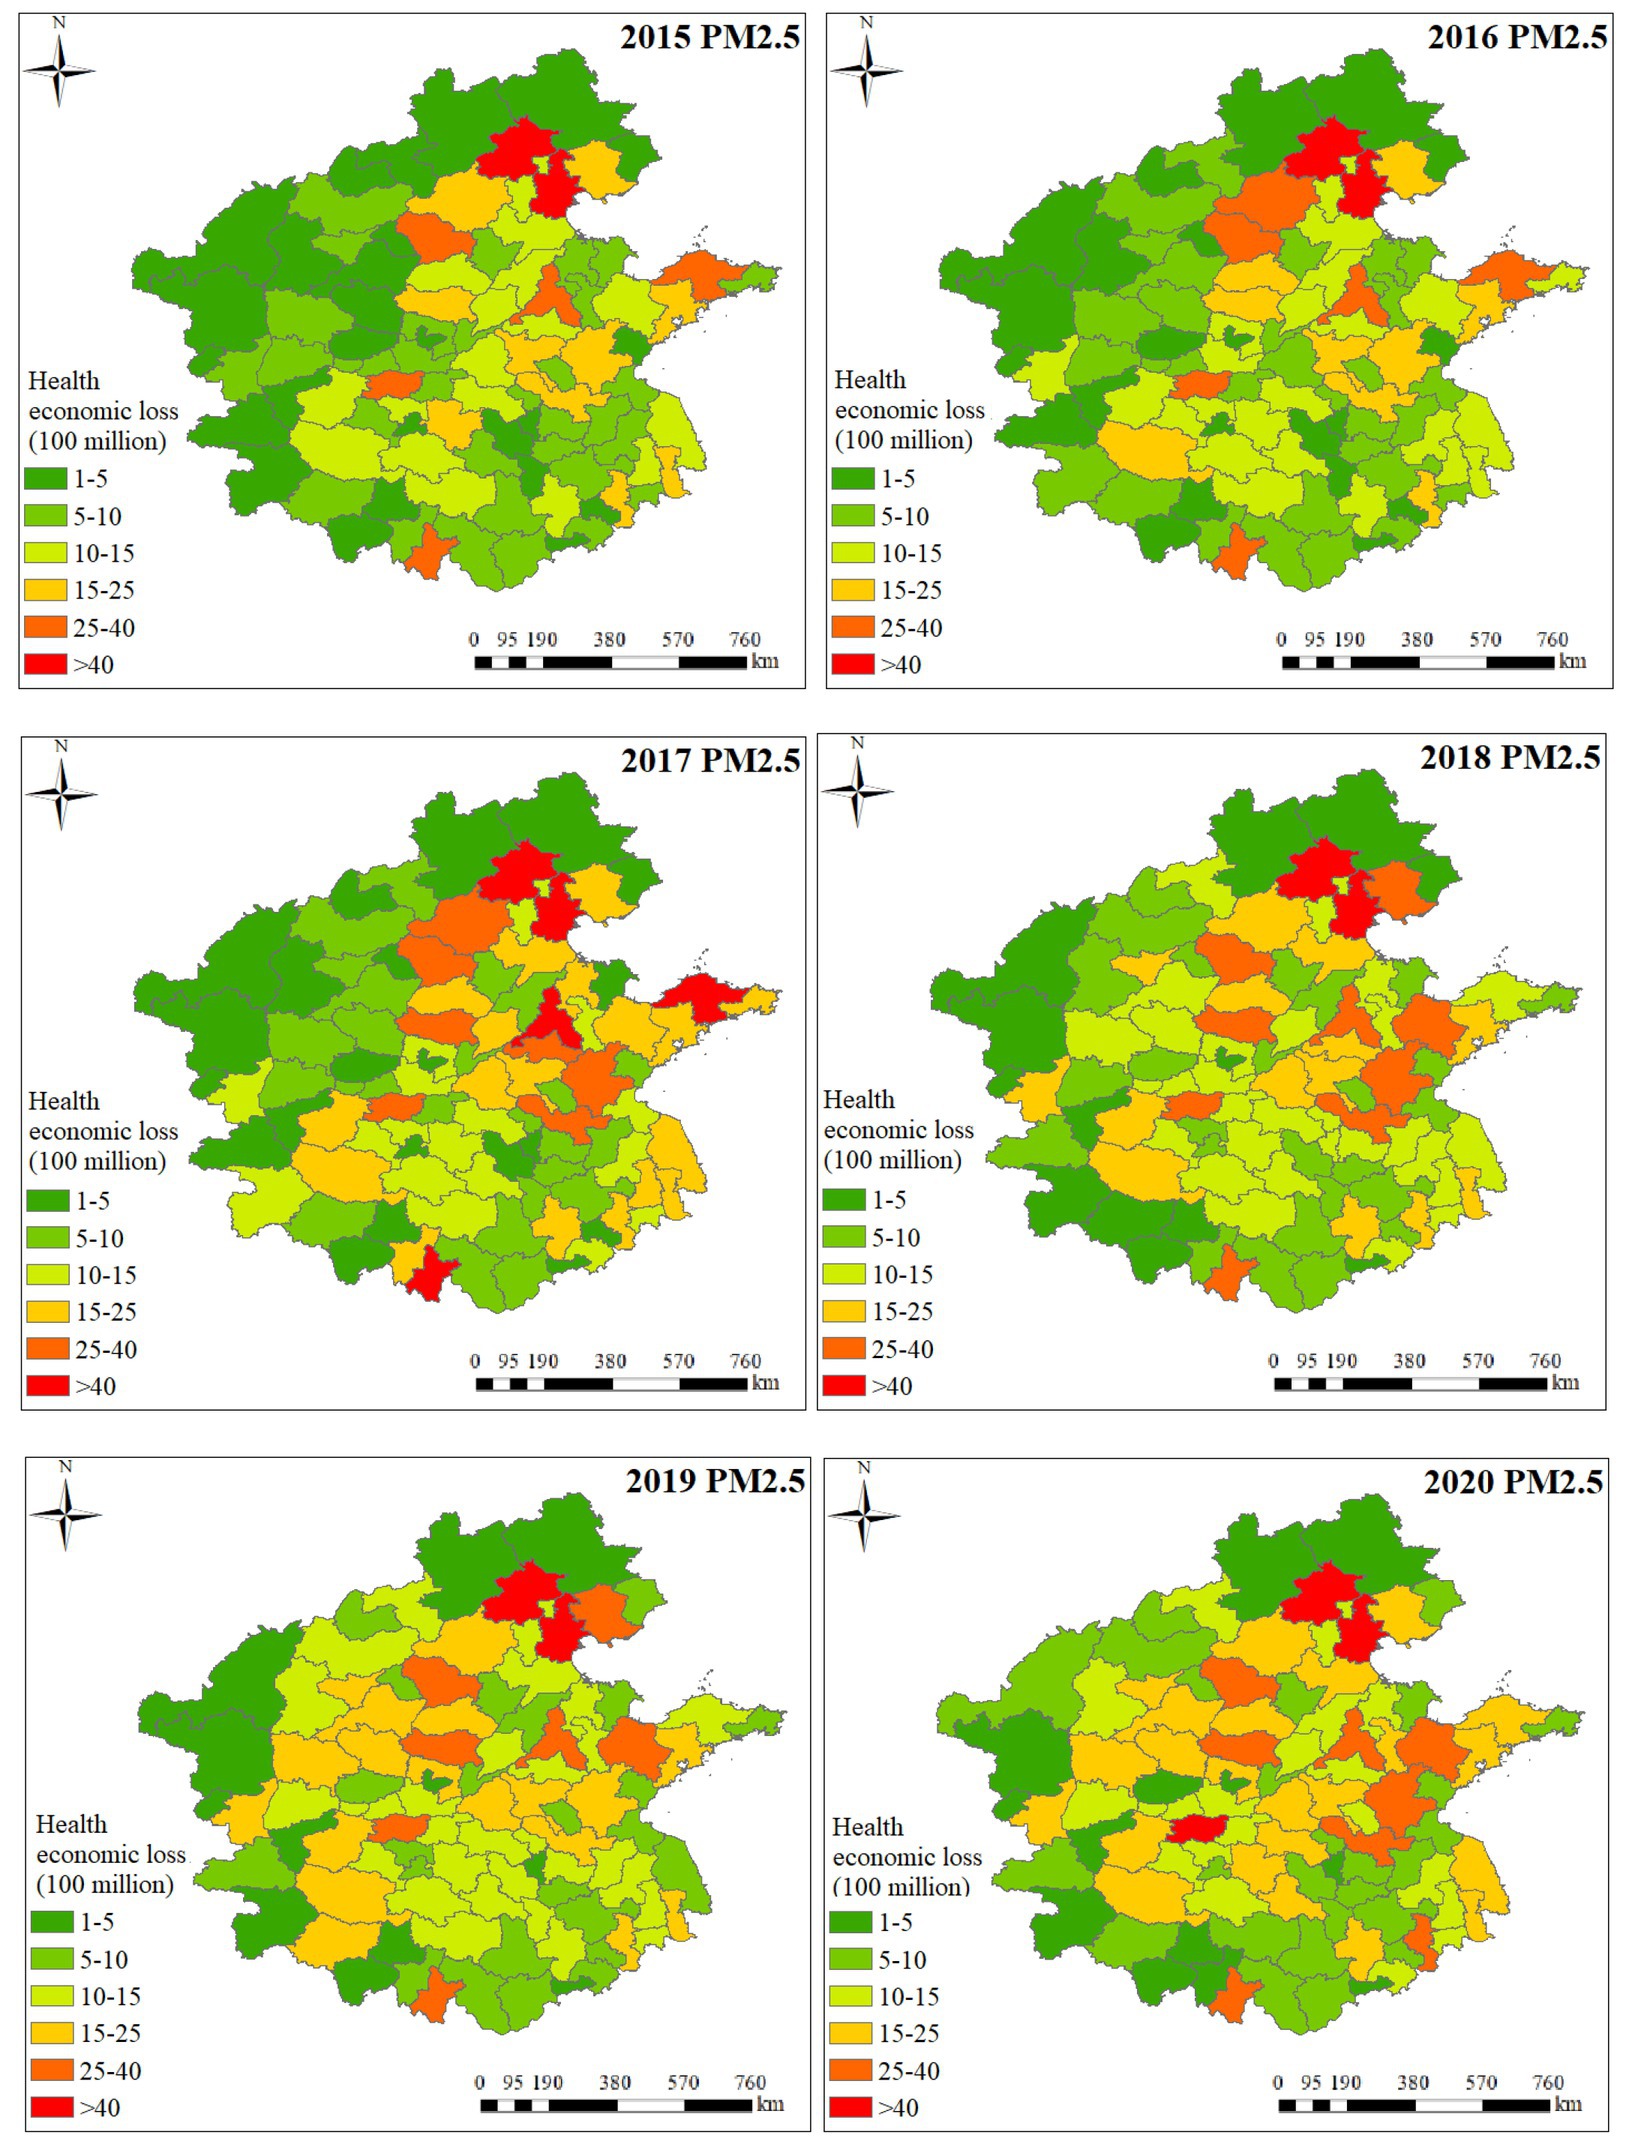
Figure 8. Distribution of the PM2.5-related economic losses associated with public health in hot cities from 2015 to 2020.
Figure 9 shows the distribution of the O3-related health economic losses in hotspot urban agglomerations from 2015 to 2020. The O3-related health economic losses in a single hotspot city from 2015 to 2020 were 0 billion RMB (Chuzhou)–10 billion RMB (Beijing), 0.1 billion RMB (Luliang)–11 billion RMB (Beijing), 0.2 billion RMB (Tongchuan)–12.5 billion RMB (Beijing), 0.2 billion RMB (Tongchuan)–14.8 billion RMB (Beijing), 0.2 billion RMB (Tongchuan)–16.1 billion RMB (Beijing), and 0.3 billion RMB (Tongchuan)–21.3 billion RMB (Beijing). In addition, from 2015 to 2020, the average O3-related health economic losses in a single hotspot city were 1.1 ± 1.2 billion RMB, 1.4 ± 1.4 billion RMB, 2.1 ± 1.9 billion RMB, 2.1 ± 1.8 billion RMB, 2.3 ± 2 billion RMB, and 2.8 ± 2.7 billion RMB, respectively, showing a fluctuating upward trend. The O3-related health economic losses during 2015 to 2016 were generally low but showed an upward trend. In 2017, the health economic losses in Beijing and Wuhan reached more than 7 billion RMB. As compared to 2017, the high-value areas of the health economic losses in 2018 decreased but continued to show an upward trend from 2018 to 2019. Therefore, Beijing, Tianjin, Handan, and Shijiazhuang in BTH; Yantai, Qingdao, Weifang, Linyi, and Jinan in SDP; Nanjing and Xuzhou in YRD; and Wuhan in TC had higher health economic losses in 2020.
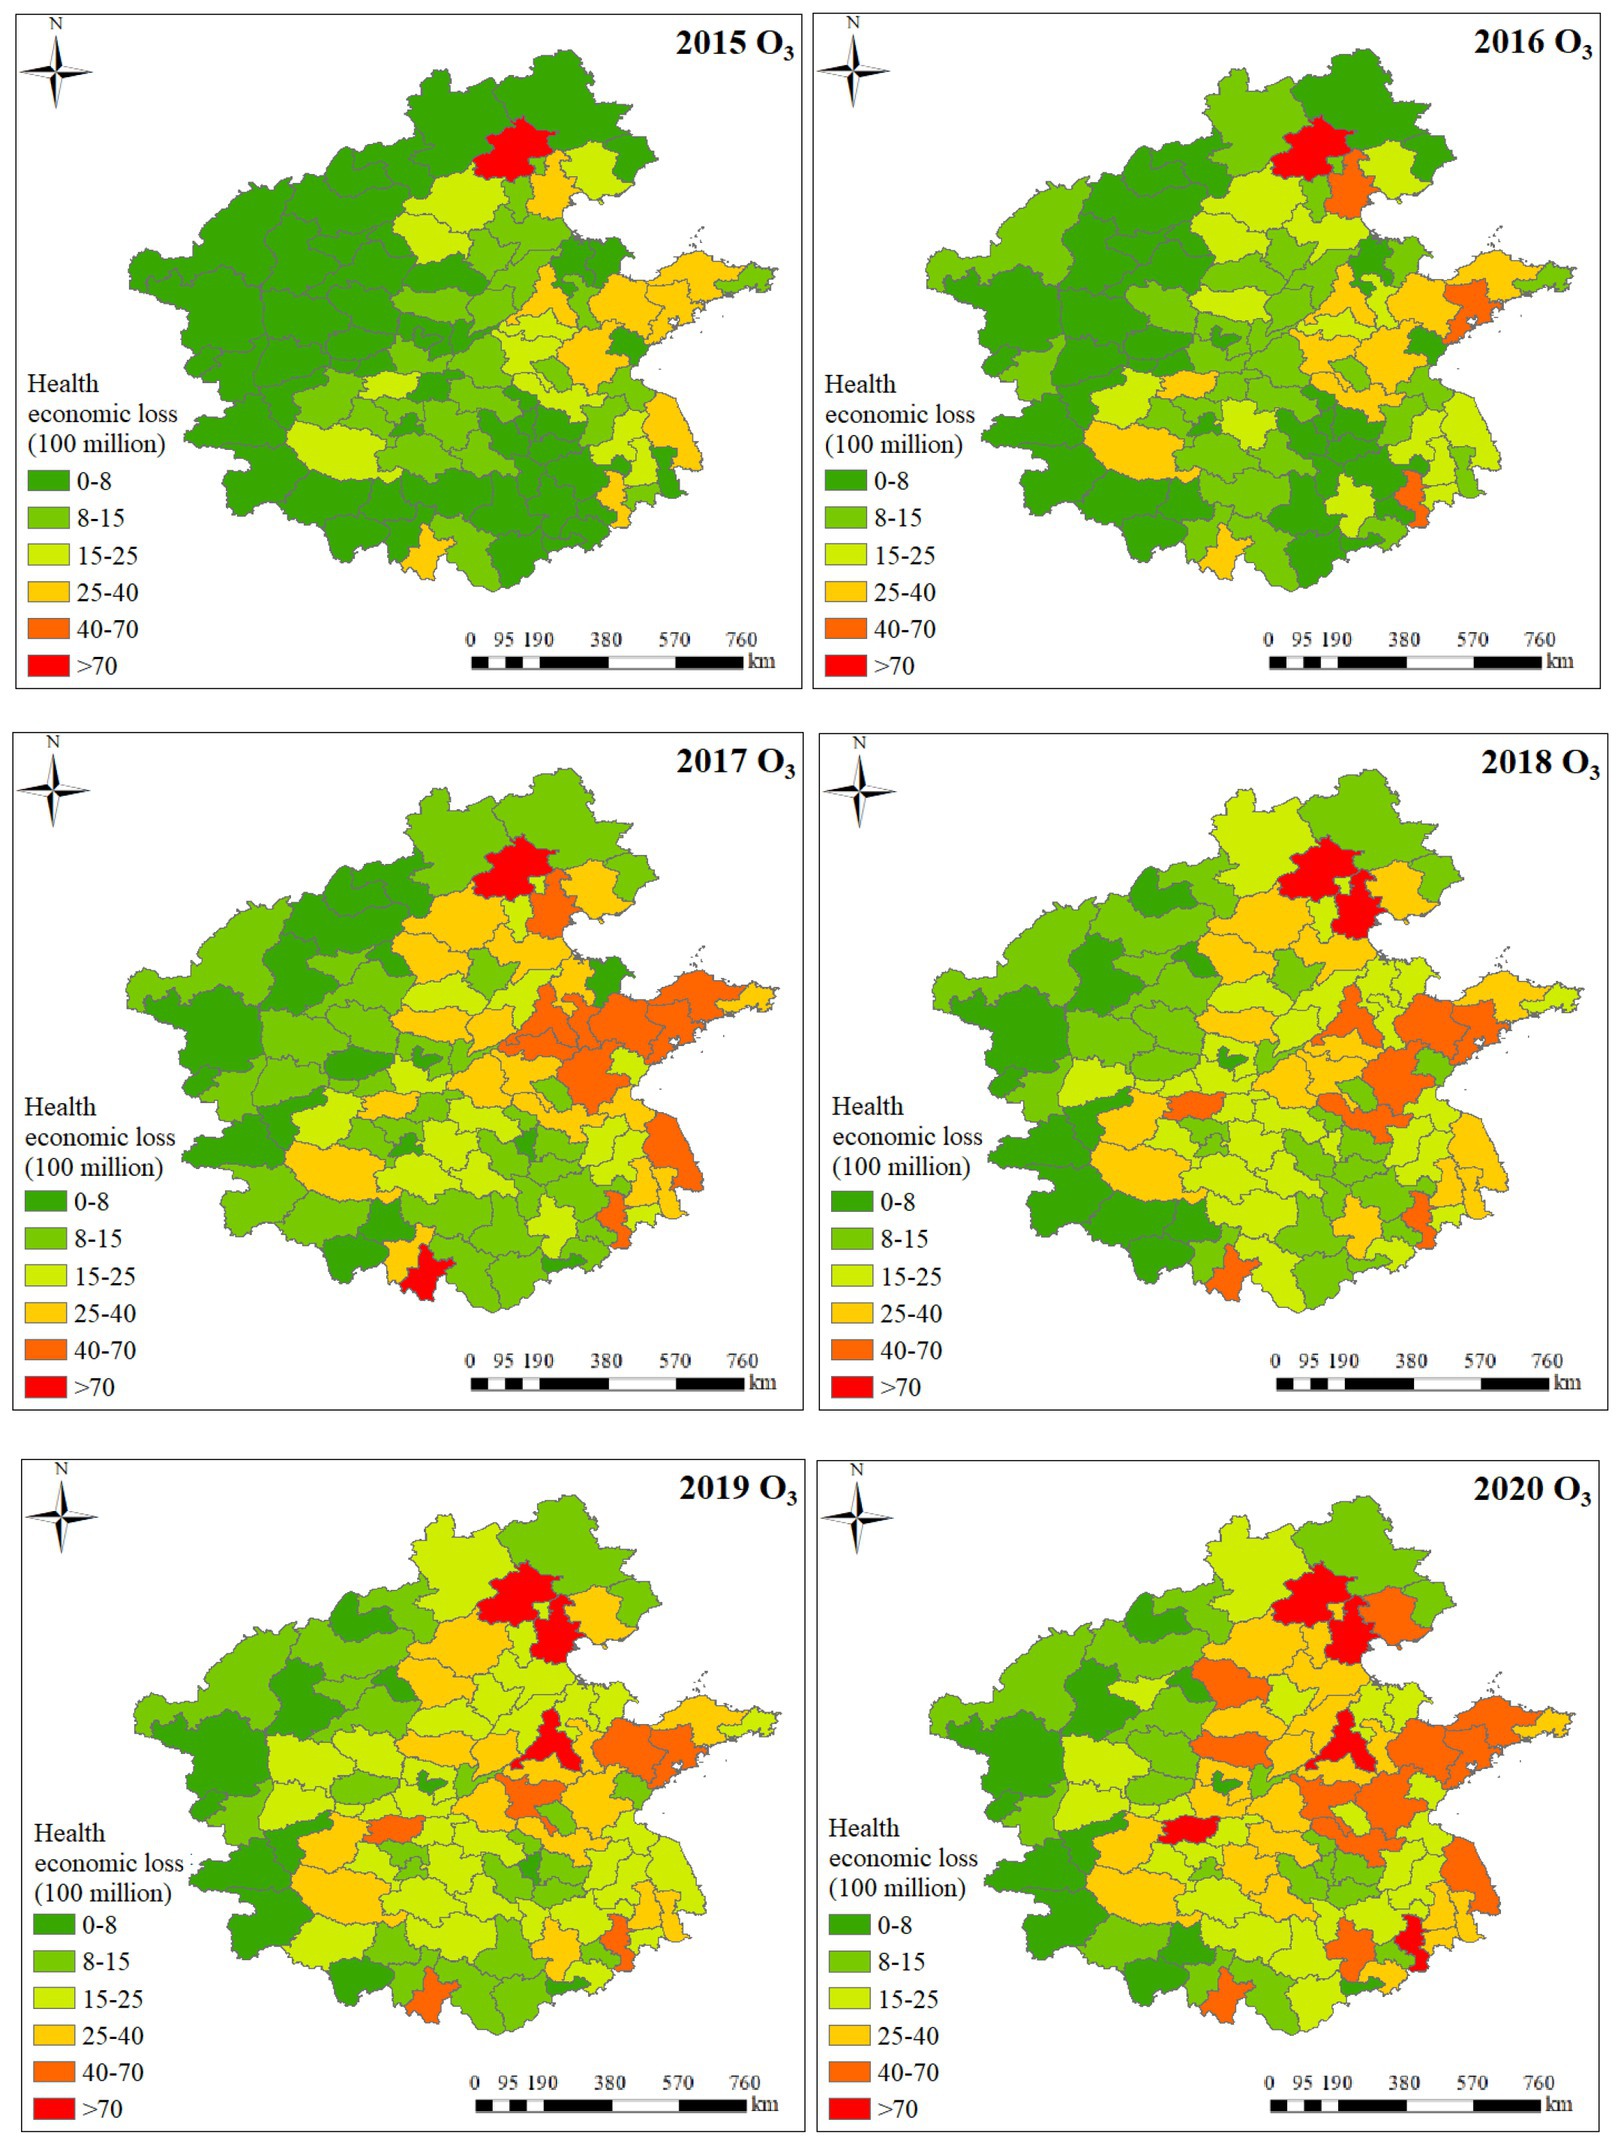
Figure 9. Distribution of O3-related economic losses associated with public health in hot cities from 2015 to 2020.
Based on the distribution of the health losses, a rating system for PM2.5-related and O3-related health losses was established by using the natural-breakpoint-classification method (NBC). The core concept of NBC was to maximize the similarity within each group, the difference between the external groups, and the range and the number of elements between each group, as closely as possible. Based on these characteristics and the distribution of health losses, NBC was suitable for classifying risk levels (Costa and Kahn, 2004). In this study, NBC was used to classify the PM2.5-related and O3-related health losses in hot cities from 2015 to 2020, which were each divided into six Grades as shown in Table 3.
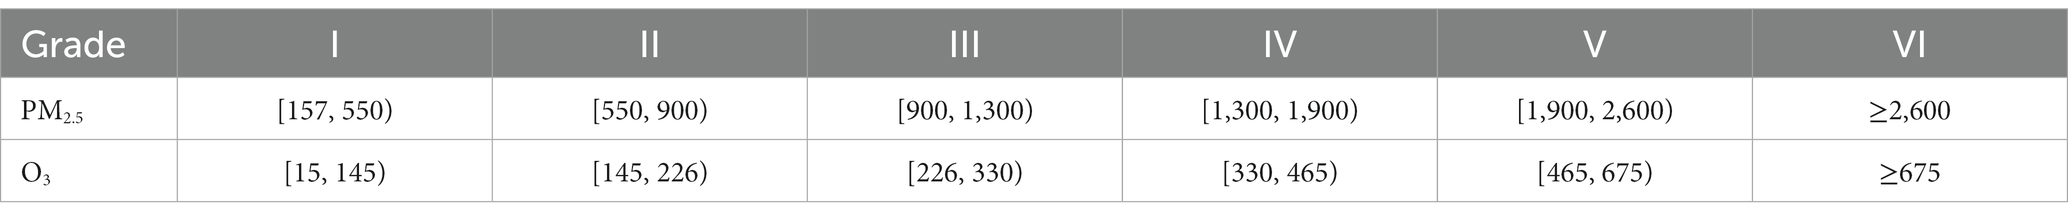
Table 3. Health loss risk levels of PM2.5 and O3.
Based on the classification of the PM2.5-related and O3-related health losses, the degrees of pollution, and the pollution trends in PM2.5 and O3 in six urban agglomerations were analyzed, and the pollution factors in hotspot cities were determined by further integrating their pollution characteristics.
1. Beijing–Tianjin–Hebei: From 2015 to 2020, health losses associated with the PM2.5 and O3 pollution, as driven by anthropogenic emissions in Baoding, Beijing, Handan, Shijiazhuang, and Tianjin, were all level V and above, indicating serious pollution, and both PM2.5 and O3 were high pollution factors. PM2.5-related and O3-related health losses in Anyang, Cangzhou, Tangshan, Hengshui, and Xingtai were also at high levels (Grade III and above), and the O3 pollution showed a fluctuating upward trend. Therefore, PM2.5 + O3 should also be taken as high pollution factor and coordinated corresponding countermeasures should be formulated. In 2015–2020, PM2.5-related health losses in Langfang showed a downward trend, and the level of decline was relatively high. The PM2.5-related economic losses associated with public health in Zhangjiakou had been at a low level (Grade I) in 2015–2020. However, the levels of the O3-related health losses in Zhangjiakou and Langfang were relatively high (Grade III and above) and showed increasing trends in 2018–2020. Therefore, O3 pollution was a hot pollution factor in Zhangjiakou and Langfang. The overall pollution levels of Chengde and Qinhuangdao were relatively low (Grade II and below), so they were not listed as priority control areas.
2. Shandong Peninsula: From 2015 to 2020, the PM2.5-related and O3-related health losses in Jinan, Jining, Linyi, and Weifang were at high levels (Grade IV and above), and both PM2.5 and O3 were high pollution factors. In addition, PM2.5-related and O3-related health losses in Dezhou, Qingdao, Tai’an, and Zibo in 2015–2020 were also at high levels (Grade III and above), and the O3 pollution showed a fluctuating upward trend, so PM2.5 + O3 should also be taken as a high pollution factor. In Binzhou, Rizhao, Weihai, and Yantai, PM2.5-related health losses had been fluctuating and declining in recent years and had fallen to a low level (Grade II and below), but the corresponding O3-related health losses had been increasing and had reached Grade III and above in 2020. Therefore, Weihai, Rizhao, Binzhou and Yantai were listed as O3 high pollution areas. The overall level of health loss in Dongying in recent years was at a relatively low level, so it was not listed as a priority control area.
3. The Central Plains: From 2015 to 2020, Fuyang, Heze, Liaocheng, Luoyang, Nanyang, Shangqiu, Zhoukou, and Zhumadian all had high levels of PM2.5-related and O3-related health losses (Grade IV and above) and had reached Grade V and above in 2020. The pollution was serious, and it was listed as priority control area for PM2.5 and O3 coordination. From 2015 to 2020, the PM2.5-related and O3-related health losses in Bozhou, Jiaozuo, Jinzhong, Kaifeng, Linfen, Pingdingshan, Puyang, Suzhou, Xinxiang, Xinyang, Xuchang, Yuncheng, and Changzhi were also high (Grade III and above), and PM2.5-related and O3-related health losses had fluctuated in 2019–2020. Therefore, it was also listed as a priority control area for PM2.5 and O3 coordination. In addition, although the O3-related health losses in Datong, Luliang, Taiyuan, and Xinzhou were low (Grade II and below), the PM2.5-related health losses showed a fluctuating upward trend and had reached Grade IV in 2019–2020, indicating that the anthropogenic PM2.5 pollution in these cities remained very high. Priority should be given to PM2.5 as a hot pollution factor. Bengbu, Hebi, Huaibei, Jincheng, Luohe, Sanmenxia, Shuozhou, and Yangquan had low levels of overall health losses (Grade II or below) and were not included in the priority control area.
4. Yangtze River Delta: From 2015 to 2020, the PM2.5-related and O3-related health losses in Hefei, Nanjing, Suqian, Taizhou, Xuzhou, Yancheng, and Yangzhou were all high (Grade III and above), and the O3-related health losses showed an increasing trend, so it was listed as a priority area for the coordinated control of PM2.5 and O3. Anqing, Chuzhou, Huai’an, Lianyungang, Lu’an, Wuhu, and Zhenjiang all had PM2.5-related health losses of Grade II or below and showed a downward trend. However, the corresponding O3-related health losses were rising, and the levels were relatively high (Grade III and above), so it was listed as a priority control area for O3 pollution. Huainan, Ma’anshan, and Tongling had low levels of health losses and were not included in the priority control area.
5. The middle reaches of the Yangtze River: From 2015 to 2020, the PM2.5-related and O3-related health losses in Wuhan were high (Grade IV and above), so it was listed as a priority area for the coordinated control of PM2.5 and O3. Although the overall health losses of PM2.5 and O3 in Xiangyang was not very high, it had shown an increasing trend in recent years, and the health losses reached Grade III or above, from 2019 to 2020. Therefore, Xiangyang was also listed as a priority control area for PM2.5 and O3 coordination. The overall O3-related health losses in Huanggang was high, reaching Grades III and IV. However, the PM2.5-related health losses showed a gradual decline, falling to Grade II in 2019–2020. Therefore, Huanggang was listed as an O3 priority control area. Jingmen, Shiyan, Suizhou, and Xiaogan had low levels of health losses and were not included in the priority control area, but they were still under control as hotspots of high pollution in China.
6. Guanzhong Plains: From 2015 to 2020, the PM2.5-related health losses in Linfen, Weinan, and Yuncheng were at a high level (Grade III and above). In addition, the O3-related health losses in cities were in a fluctuating upward trend, and the health losses also reached a high level of Grade III and above, from 2019 to 2020. Therefore, Linfen, Weinan, and Yuncheng were listed as priority control areas for PM2.5 and O3 coordination. In addition, the PM2.5-related health losses in Yulin were low (Grade I), but the O3-related health losses showed a fluctuating upward trend. Since 2017, the health losses reached Grade III, which was worthy of attention. Therefore, Yulin was listed as an O3 priority control area. Shangluo, Tongchuan, and Yan’an belonged to a low grade of health loss (Grade II and below) among hotspot cities, so they were not listed as a priority control area of hotspot cities.
7. In summary, the pollution types in each city in hot urban agglomerations were further divided, and the priority pollution factors were screened out. The hot cities in the six hot urban agglomeration were divided into the following three Grades: PM2.5 and O3 collaborative priority control zone, O3 priority control zone and PM2.5 priority control zone, as shown in Table 4.
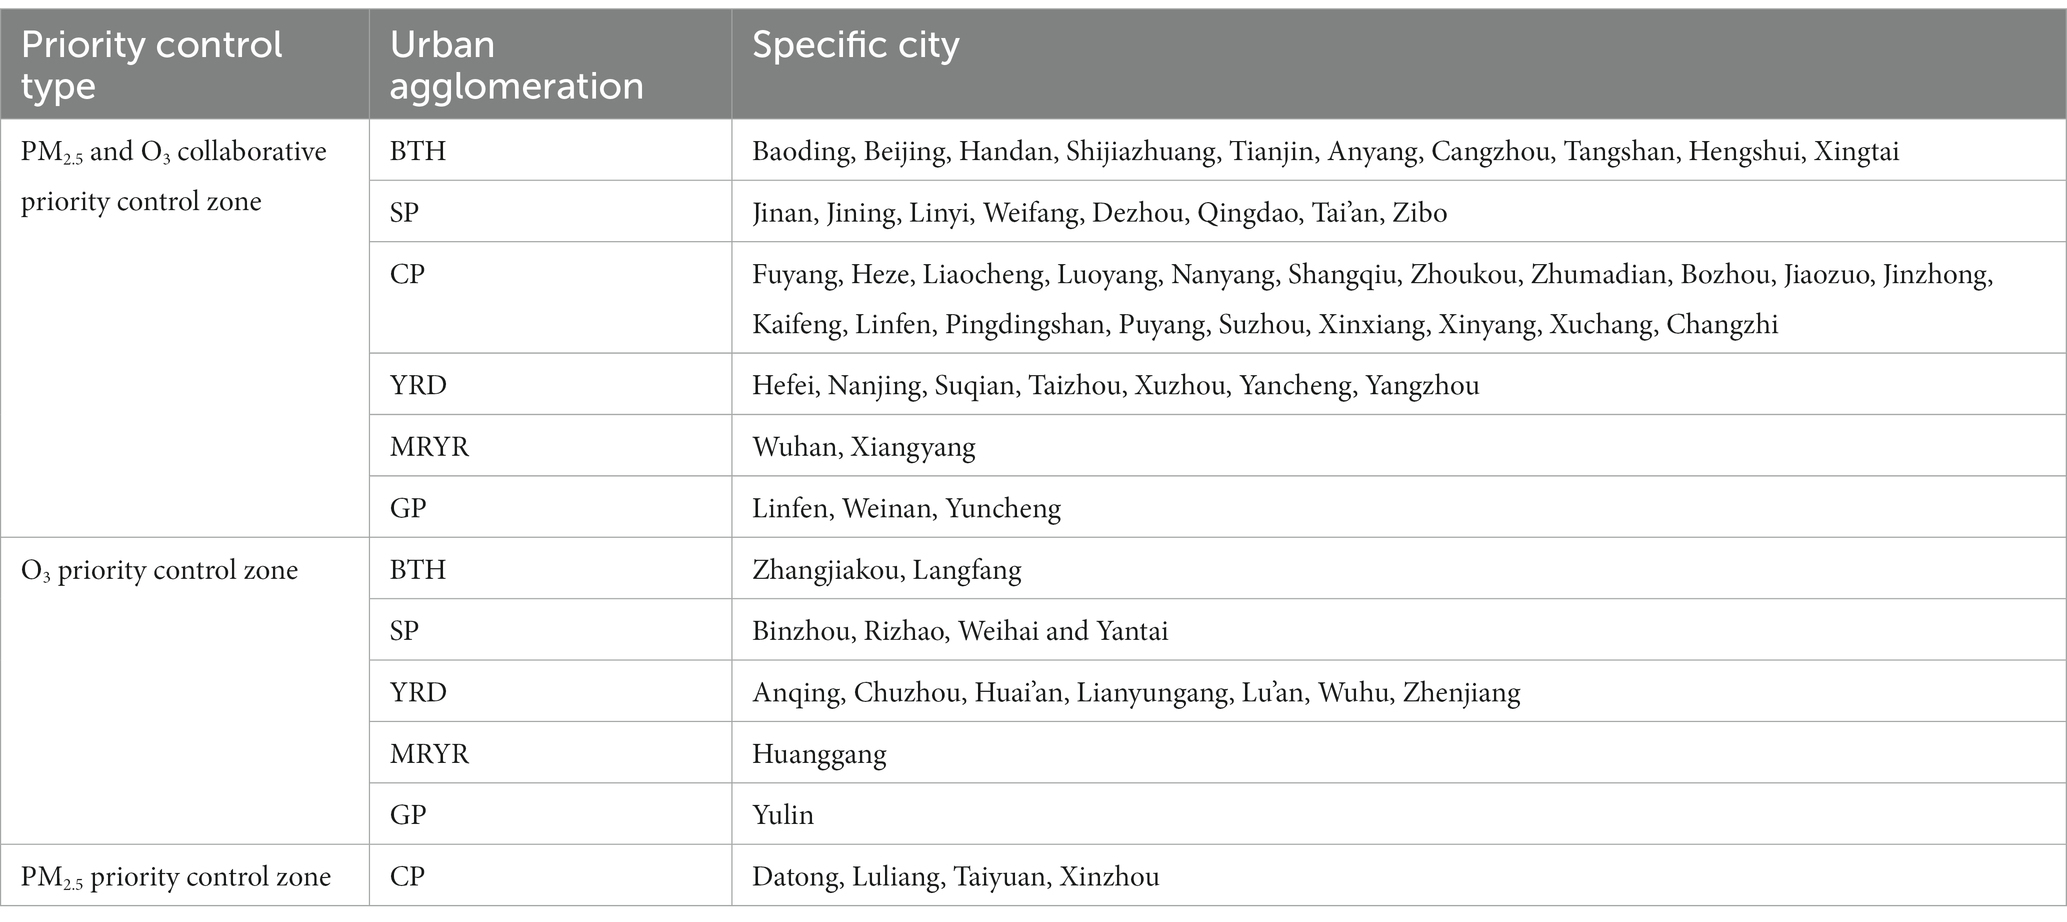
Table 4. Priority control types of hotspot cities.
From 2015 to 2020, the overall concentrated levels of PM2.5 pollution not only showed a trend of continuous decline, but in addition, the exceedence rates decreased year over year. Both the overall concentrated levels of O3 pollution and the exceedence rates showed trends of first increasing (2015–2018) and then decreasing (2018–2020). The driving factors had different distribution characteristics in China. The PM2.5 pollution was primarily driven by anthropogenic emissions. The fluctuations in the O3 pollution were influenced by meteorological fluctuations. The PM2.5-related health losses in CP from 2015 to 2020 were relatively high. The overall O3-related health loss showed an upward trend from 2015 to 2020. Targeted control countermeasures were proposed for different priority control areas, by type: (1) to establish refined pollution control indicators, develop differentiated air quality standards, and add O3 pollution control indicators; (2) to make overall plans for key areas for PM2.5 and O3 pollution prevention and control, such as in cities with high O3-related health losses due to anthropogenic emissions (Zhangjiakou, Rizhao, Weihai, Yantai, Huanggang, Yulin), which should also be included in key regions; (3) to promote emission reductions in NO x and VOCs in key industries and optimize their emission reduction ratios, and the study showed that the decrease in the PM2.5 reduced the heterogeneous absorption of the O3 precursors (HO2 free radicals, NOx, etc.), which required emission reduction as much as possible, from the perspective of the VOCs; (4) to establish a fine emission inventory of pollution sources and establish “grid supervision,” as well as to carry out information-based management and control in enterprise parks, establish a pollution early-warning mechanism, and the further curb and reduce air pollution at its source; and (5) to strengthen public education on the environment and health, as well as to raise public awareness of health protection. Based on the national policies for carbon neutrality and “carbon peaking,” it would be necessary to take carbon as the focus and promote coordinated carbon reduction. Future research should build a technical system of combined pollution prevention and control focused on PM2.5, O3, and greenhouse gasses, as well as promote collaborative management and control mechanisms.
The original contributions presented in the study are included in the article/Supplementary material, further inquiries can be directed to the corresponding authors.
Ethical review and approval was not required for the study of human participants in accordance with the local legislation and institutional requirements. Written informed consent from the participants was not required to participate in this study in accordance with the national legislation and the institutional requirements.
JG and JY structured and wrote the manuscript. SK analyzed the data and contributed with descriptive analysis. FL, ZQ, and TW reviewed the manuscript. All authors contributed to the article and approved the submitted version.
This study was supported by National Social Science Foundation of China (Youth Fund: 19CGL042), Hubei Provincial Outstanding Young Science and Technology Innovation Team Project (T2021032) and the Fundamental Research Funds for the Central Universities, Zhongnan University of Economics and Law (2722023EZ009; 202311416).
The authors declare that the research was conducted in the absence of any commercial or financial relationships that could be construed as a potential conflict of interest.
All claims expressed in this article are solely those of the authors and do not necessarily represent those of their affiliated organizations, or those of the publisher, the editors and the reviewers. Any product that may be evaluated in this article, or claim that may be made by its manufacturer, is not guaranteed or endorsed by the publisher.
The Supplementary material for this article can be found online at: https://www.frontiersin.org/articles/10.3389/fevo.2023.1192847/full#supplementary-material
DM, Daily mean; MDA8, Maximum daily average 8 h; AM, Annual mean; AT, Average temperature; AP, Atmospheric pressure; WS, Wind speed; WD, Wind direction; RH, Relative humidity; BTH, Beijing–Tianjin–Hebei urban agglomeration; CP, Central Plains urban agglomeration; GZP, Guanzhong Plain urban agglomeration; YRD, Yangtze River Delta urban agglomeration; TC, Middle reach of Yangtze River urban agglomeration; SDP, Shandong Peninsula urban agglomeration; ER, Exceedence rate; NBC, Natural breakpoint classification method.
Chen, D., Liu, Z., Ban, J. M., Zhao, P. S., and Chen, M. (2019). Retrospective analysis of 2015-2017 wintertime PM2.5 in China: response to emission regulations and the role of meteorology. Atmos. Chem. Phys. 19, 7409–7427. doi: 10.5194/acp-19-7409-2019
Costa, D., and Kahn, M. E. (2004). Changes in the value of life, 1940-1980. J. Risk Uncertain. 29, 159–180. doi: 10.1023/B:RISK.0000038942.18349.88
Gao, M., Han, Z., Liu, Z., Li, M., Xin, J., Tao, Z., et al. (2018). Air quality and climate change, topic 3 of the model inter-comparison study for Asia phase III (MICS-Asia III)-part 1: overview and model evaluation. Atmos. Chem. Phys. 18, 4859–4884. doi: 10.5194/acp-18-4859-2018
Gao, M., Liu, Z., Zheng, B., Ji, D., Sherman, P., Song, S. J., et al. (2020). China’s emission control strategies have suppressed unfavorable influences of climate on wintertime PM2.5 concentrations in Beijing since 2002. Atmos. Chem. Phys. 20, 1497–1505. doi: 10.5194/acp-20-1497-2020
Grange, S., and Carslaw, D. C. (2019). Using meteorological normalization to detect interventions in air quality time series. Sci. Total Environ. 653, 578–588. doi: 10.1016/j.scitotenv.2018.10.344
Han, H., Liu, J., Shu, L., Wang, T., and Yuan, H. L. (2020). Local and synoptic meteorological influences on daily variability in summertime surface ozone in eastern China. Atmos. Chem. Phys. 20, 203–222. doi: 10.5194/acp-20-203-2020
He, C., Mu, H., Yang, L., Wang, D., Di, Y. F., Yi, J. H., et al. (2021). Spatial variation of surface ozone concentration during the warm season and its meteorological driving factors in China. Environ. Sci. 42, 4168–4179. doi: 10.13227/j.hjkx.202009228
Kumar, R., Barth, M. C., Madronich, S., Naja, M., Carmichael, G., Pfister, G. G., et al. (2014). Effects of dust aerosols on tropospheric chemistry during a typical pre-monsoon season dust storm in northern India. Atmos. Chem. Phys. 14, 6813–6834. doi: 10.5194/acp-14-6813-2014
Li, K., Jacob, D. J., Liao, H., Shen, L., Zhang, Q., and Bates, K. H. (2019a). Anthropogenic drivers of 2013-2017 trends in summer surface ozone in China. Proc. Natl. Acad. Sci. 116, 422–427. doi: 10.1073/pnas.1812168116
Li, K., Jacob, D., Liao, H., Zhu, J., Shah, V., Shen, L., et al. (2019b). A two-pollutant strategy for improving ozone and particulate air quality in China. Nat. Geosci. 12, 906–910. doi: 10.1038/s41561-019-0464-x
Lim, S., Vos, T., Flaxman, A. D., Danaei, G. D., Shibuya, K., Adair-Rohani, H., et al. (2012). A comparative risk assessment of burden of disease and injury attributable to 67 risk factors and risk factor clusters in 21 regions, 1990-2010: A systematic analysis for the global burden of disease study 2010. Lancet 380, 2224–2260. doi: 10.1016/S0140-6736(12)61766-8
Lu, X., Zhang, S., Xing, J., Wang, Y. J., Chen, W. H., Ding, D., et al. (2020). Progress of air pollution control in China and its challenges and opportunities in the ecological civilization era. Engineering 6, 1423–1431. doi: 10.1016/j.eng.2020.03.014
Qu, Z. G., Wang, X. Y., Li, F., Li, Y. N., Chen, X. Y., and Chen, M. (2020). PM2.5-related health economic benefits evaluation based on air improvement action plan in Wuhan City, Middle China. Int. J. Environ. Res. Public Health. 17:620. doi: 10.3390/ijerph17020620
Tao, M., Wang, L. L., Chen, L. F., Wang, Z. F., and Tao, J. H. (2020). Reversal of aerosol properties in eastern China with rapid decline of anthropogenic emissions. Remote Sens. (Basel) 12:523. doi: 10.3390/rs12030523
Turner, M., Jerrett, M., Pope, C. A., Krewski, D., Gapstur, S. M., Diver, W. R., et al. (2016). Long-term ozone exposure and mortality in a large prospective study. Am. J. Respir. Crit. Care Med. 193, 1134–1142. doi: 10.1164/rccm.201508-1633OC
Wang, X., Dickinson, R. E., Su, L. Y., Zhou, C. L., and Wang, K. C. (2018). PM2.5 pollution in China and how it has been exacerbated by terrain and meteorological conditions. Bull. Am. Meteorol. Soc. 99, 105–119. doi: 10.1175/BAMS-D-16-0301.1
Wang, J., Gao, A. F., Li, S. R., Liu, Y. H., Zhao, W. F., Wang, P., et al. (2020). Regional joint PM2.5-O3 control policy benefits further air quality improvement and human health protection in Beijing-Tianjin-Hebei and its surrounding areas. J. Environ. Sci. 130, 75–84. doi: 10.1016/j.jes.2022.06.036
Xia, Z., Wang, X., Yu, S. Y., and Qian, Y. (2019). Meta-analysis of the association between PM2.5 pollution and total non-accidental mortality of residents in different regions in China. Environ. Pollut. Cont. 41, 891–895. doi: 10.15985/j.cnki.1001-3865.2019.08.005
Xing, L., Mao, X., and Duan, K. Q. (2022). Impacts of urban-rural disparities in the trends of PM2.5 and ozone levels in China during 2013-2019. Atmospheric. Pollut. Res. 13:101590. doi: 10.1016/j.apr.2022.101590
Xu, M., Qin, Z., Zhang, S., and Xie, Y. (2021). Health and economic benefits of clean air policies in China: A case study for Beijing-Tianjin-Hebei region. Environ. Pollut. 285:117525. doi: 10.1016/j.envpol.2021.117525
Yan, M., Li, T. T., Liu, X. T., Duan, H. Y., and Liu, Z. R. (2012). Human health effects of short-term ozone exposure: A review of Chinese epidemiological evidence. J. Environ. Health 29, 752–761. doi: 10.16241/j.cnki.1001-5914.2012.08.011
Yao, Y., Ma, K., He, C., Zhang, Y., Lin, Y. S., Fang, F. M., et al. (2023). Urban surface ozone concentration in mainland China during 2015-2020: spatial clustering and temporal dynamics. Int. J. Environ. Res. Public Health 20:3810. doi: 10.3390/ijerph20053810
Yin, P., Chen, R., Wang, L. J., Meng, X., Liu, C., Niu, Y., et al. (2017). Ambient ozone pollution and daily mortality: A nationwide study in 272 Chinese cities. Environ. Health Perspect. 125:117006. doi: 10.1289/EHP1849
Zeng, X., and Ruan, F. F. (2020). Analysis on the national economic impact of PM2.5-induced health effects in China. China Environ. Sci. 40, 3228–3238. doi: 10.19674/j.cnki.issn1000-6923.2020.0361
Zeng, X., Ruanm, F. F., and Jiang, Y. J. (2019). Spatial distribution and health effects of ozone pollution in China. China Environ. Sci. 39, 4025–4032. doi: 10.19674/j.cnki.issn1000-6923.2019.0472
Zhai, S., Jacob, D. J., Wang, X., Shen, L., Li, K., Zhang, Y. Z., et al. (2019). Fine particulate matter (PM2.5) trends in China, 2013-2018: separating contributions from anthropogenic emissions and meteorology. Atmos. Chem. Phys. 19, 11031–11041. doi: 10.5194/acp-19-11031-2019
Zhang, Z., and Wang, K. C. (2020). Stilling and recovery of the surface wind speed based on observation, reanalysis, and geostrophic wind theory over China from 1960 to 2017. J. Climate 33, 3989–4008. doi: 10.1175/JCLI-D-19-0281.1
Keywords: air quality, health economic, atmospheric prediction model, control measures, meteorological standardization
Citation: Guo J, Wang T, Li F, Qu Z, Yan J and Kong S (2023) Spatiotemporally anthropogenic PM2.5- and O3-related health economic losses via weather normalization technique and hierarchical policies in Chinese cities. Front. Ecol. Evol. 11:1192847. doi: 10.3389/fevo.2023.1192847
Edited by:
Tao Wang, Fudan University, ChinaReviewed by:
Shaohua Zhao, Ministry of Ecology and Environment Center for Satellite Application on Ecology and Environment, ChinaCopyright © 2023 Guo, Wang, Li, Qu, Yan and Kong. This is an open-access article distributed under the terms of the Creative Commons Attribution License (CC BY). The use, distribution or reproduction in other forums is permitted, provided the original author(s) and the copyright owner(s) are credited and that the original publication in this journal is cited, in accordance with accepted academic practice. No use, distribution or reproduction is permitted which does not comply with these terms.
*Correspondence: Teng Wang, d2FuZ3RlbmdoYnVlQDE2My5jb20=; Fei Li, bGlmZWlAenVlbC5lZHUuY24=
Disclaimer: All claims expressed in this article are solely those of the authors and do not necessarily represent those of their affiliated organizations, or those of the publisher, the editors and the reviewers. Any product that may be evaluated in this article or claim that may be made by its manufacturer is not guaranteed or endorsed by the publisher.
Research integrity at Frontiers
Learn more about the work of our research integrity team to safeguard the quality of each article we publish.