 Qiuhong Guo
 Weidong Huang
 Wen Sang
 Xiaosheng Chen
 Xingmin Wang1,2*
95% of researchers rate our articles as excellent or good
Learn more about the work of our research integrity team to safeguard the quality of each article we publish.
Find out more
ORIGINAL RESEARCH article
Front. Ecol. Evol. , 11 May 2023
Sec. Phylogenetics, Phylogenomics, and Systematics
Volume 11 - 2023 | https://doi.org/10.3389/fevo.2023.1191446
This article is part of the Research Topic Biology, Systematics, Taxonomy and Evolution of Insect Vectors - Volume II View all 8 articles
Bark and ambrosia beetles of Scolytinae are well-known forest pests which can cause significant economic losses to trees and timber. Comparative analyses of structural characteristics of mitochondrial genomes (mitogenomes) and phylogenetic analyses could significantly improve our understanding of mitogenomic evolution and evolutionary history of this important group. Here, we have assembled new mitogenome data of four taxa (Euwallacea interjectus, E. fornicatus, E. similis, and Xylosandrus sp.) and presented a comparative analysis with available mitogenomes of Scolytinae. Phylogenetic analyses of Scolytinae were also conducted with different methods and datasets. The four mitogenomes are 15,419–16,265 bp in length and contain 13 protein-coding genes (PCGs), 22 transfer RNA genes, two ribosomal RNA genes, and a control region, except for E. similis wherein the trnI is not detected. All PCGs initiate with either standard start codon of ATN or nonstandard GTG/TTG. TAA codon is used for termination more than TAG and incomplete T. The analysis of nonsynonymous/synonymous mutation ratio (Ka/Ks) of PCGs suggests the highest and lowest evolutionary rates are within nad4 and cox1, respectively. The heterogeneity analyses of different mitogenomic datasets show excluding the third-codon positions from the datasets largely reduce their heterogeneity. Our phylogenetic analyses derived from mitogenome data provide new evidence toward the revision of the distinguishing characteristics of related genera in this subfamily and highly supported most of nodes at deeper and shallow level. The present study highlights the utility of mitogenome data for resolving the phylogenetic framework of bark and ambrosia beetles, although more taxa sampling is needed to elucidate the complicated relationships of Scolytinae.
Bark and ambrosia beetle in the subfamily Scolytinae Latreille represents a highly diversified group of beetles with more than 6,000 described species, which is regarded as one of the greatest species radiation on earth (Oberprieler et al., 2007). The subfamily Scolytinae comprises 26 tribes and 246 genera (Hulcr et al., 2015; Pistone et al., 2018), which includes a variety of forest pests causing significant economic losses to trees and timber (Beaver, 1989; Hulcr and Stelinski, 2017). Bark and ambrosia beetles have gained more research interest recently because of their rapid invasion and severe damaging (Eskalen et al., 2013; O’Donnell et al., 2016). Almost all known ambrosia beetles possess specialized pockets called mycangia where they transport fungi from their natal galleries to newly colonized trees (Hulcr and Cognato, 2010). Some species of bark beetles are not found in logs and branches, but instead feed and reproduce in seeds, petioles, or seedlings of trees, occasionally in woody herbs and ferns, adding to the broad range of host plant relationships in this group of beetles (Kirkendall et al., 2015). Although Scolytinae is a very interesting group for many other kinds of evolutionary studies, resolving the phylogeny of this subfamily is a daunting task (Jordal et al., 2011; Jordal and Cognato, 2012). Similar molecular dataset, containing cox1, 28S, CAD, EF-1α, and ArgK has been used in inferring the phylogenetic relationship and evolutionary history of Scolytinae, including biogeographic patterns (Gohli and Jordal, 2017), divergence time (Jordal and Cognato, 2012; Gohli et al., 2017), and species diversification (Gohli et al., 2017). Some research argued that the development of more nuclear protein-coding (NPC) genes is necessary to obtain better resolution in deeper phylogenetic nodes of Scolytinae (Jordal et al., 2011; Jordal and Cognato, 2012). A genomic mining of phylogenetically informative NPC markers from 26 different weevil species resulted in 57 high phylogenetic signal targeted genes (Pistone et al., 2016). Subsequently, 13 of these NCP genes combined with previously used molecular dataset (cox1, 28S, CAD, EF-1α, and ArgK) to reconstruct phylogeny of Scolytinae, but still limited resolution of ancient divergences (Pistone et al., 2018). Therefore, more data are needed to obtain better resolution and node support for the phylogenetic framework.
Mitochondrial genomes (mitogenomes) have been extensively used as molecular markers for phylogenetic, phylogeographic and evolutionary genomic studies due to their features that include small genome size, fast evolutionary rates, rare recombination, and conserved gene products (Cameron, 2014; Du et al., 2019). In general, a complete mitogenome of insect is usually a circular DNA molecule with 15–21 kb in length. It features a relatively conserved gene content including 13 protein-coding genes (PCGs), 22 transfer RNA (tRNA) genes, and two ribosomal RNA (rRNA) genes, in addition to an AT-rich control region (Cameron, 2014). Compared to the individual mitochondrial genes, the complete mitogenome could provide not only more genetic information but also a series of evolutionary characters, such as RNA secondary structures, gene arrangements, and models of control of replication (San et al., 2006; Cameron, 2014). With the development of DNA sequencing technology, much more mitochondrial genomes of insect species have been sequenced (Guo et al., 2022a; Huang et al., 2023). However, available data on the mitogenomes of bark and ambrosia beetles remain limited. Sequencing more mitogenome from many important Scolytinae clades that remain poorly represented is needed to better understand the mitogenomic evolution of Scolytinae and further provide a new perspective on the phylogenetic relationship of this important pest group.
In this study, we determined four complete mitogenomes of bark beetles, including Euwallacea interjectus (Blandford, 1894), E. fornicatus (Eichhoff, 1868), E. similis (Ferrari, 1867), and Xylosandrus sp., and provided a comparative mitogenomic analysis of these species to explore the sequence variability and evolutionary traits of the Scolytinae. In addition, phylogenetic analyses with all available mitogenomes were performed to provide a better phylogenetic framework for Scolytinae.
Adult specimens of E. interjectus, E. fornicatus, E. similis, and Xylosandrus sp. were collected by hand from tea garden in Guangdong, China (23°85′11″N, 116°63′26″E) on July 7th, 2019. Specimens were preserved in 100% ethanol and stored at −20°C at South China Agricultural University (SCAU). We pretreated the specimens with 0.9% NaCl buffer before DNA extraction as outlined in a previous study (Huang et al., 2019). The genomic DNA was extracted from muscle tissues of thorax using the DNeasy Blood & Tissue Kit (Qiagen, Hilden, Germany), after which 1% agarose gel electrophoresis (AGE) was used to evaluate DNA quality.
Illuming TruSeq (San Diego, United States) libraries were prepared with an average insert size of 350 bp and sequenced using Illumina NovaSeq 6000 platform at Berry Genomics (Beijing, China) with 150 bp paired end (PE) reads. Prinseq version 0.20.4 (Edwards Lab, San Diego, United States; Schmieder and Edwards, 2011) was used to remove low-quality reads with poly-Ns (>15 bp Ns), or > 75 bp bases with a quality score ≤ 3. The remaining reads were applied in de novo assembly using IDBA-UD (Peng et al., 2012), with minimum and maximum k values of 41 and 141 bp, respectively. Clean reads were mapped to the mitogenome that we assembled using Geneious version 10.1.3 (Kearse et al., 2012) to evaluate assembly accuracy. These mitogenomes were annotated using MitoZ (Meng et al., 2019) with the invertebrate mitochondrial genetic code, and further corrected by aligning their sequences with homologous genes of other reference mitogenome of Scolytinae published in GenBank using Geneious. The secondary structure of each tRNA gene was identified through tRNAscan-SE Search Server v.1.21 (Lowe and Eddy, 1997). Putative tRNA genes that could not be found by tRNAscan-SE were identified by comparing its sequence with that of other Scolytinae tRNA genes.
The nucleotide composition, codon usage, and relative synonymous codon usage (RSCU) of protein-coding genes were calculated by MEGA 7.0 (Kumar et al., 2016). Strand asymmetry was calculated according to the following formulas: AT-skew = (A − T)/(A + T); GC-skew = (G − C)/(G + C) (Perna and Kocher, 1995). For each PCG of Scolytinae mitogenomes, the number of synonymous substitutions per synonymous site (Ks) and the number of nonsynonymous substitutions per nonsynonymous site (Ka) were calculated with DnaSP 5.0 (Librado and Rozas, 2009). The analysis of the nucleotide diversity with a sliding window of 100 bp and step size of 20 bp was also conducted using DnaSP.
Phylogenetic analyses were performed for 47 complete or nearly complete mitogenomes of bark and ambrosia beetles that have been published in GenBank. Three species from Curculioninae were used as outgroup according to previous studies (Pistone et al., 2018). Accession numbers and references of all mitogenomes used in this study were listed in Supplementary Table 1. Each PCG was aligned individually based on codon-based multiple alignments using MAFFT algorithm implemented in TranslatorX with L-INS-i strategy (Abascal et al., 2010). Two rRNA genes were individually aligned using MAFFT 7.0 online server with G-INS-I strategy (Katoh and Standley, 2013). GBlocks v0.91b was used to filter the ambiguous positions in the alignment of rRNAs with default settings (Castresana, 2000). All aligned sequences were concatenated as a dataset that included 15 genes in Geneious (Kearse et al., 2012).
We generated two datasets in this study, i.e., (1) PCGR dataset, including all three codon positions of 13 PCGs and two rRNA genes; (2) PCG12R dataset, including the first and second codon position of 13 PCGs and two rRNA genes. The heterogeneity of these two datasets was analyzed using AliGROOVE (Kück et al., 2014), following the parameter setting as employed in Song et al. (2016) and Liu et al. (2018).
PartitionFinder 2.1.1 (Lanfear et al., 2017) was used to infer the optimal partitioning and select the best model according to the Bayesian Information Criterion (BIC) for each data matrix. Maximum likelihood (ML) analysis was implemented in RAxML 8.2.8 with a GTR + G model and branch support for each node was evaluated with 1,000 replicates (Stamatakis, 2014). Bayesian inference (BI) analysis was performed using MrBayes 3.2.6 (Ronquist et al., 2012) with the following parameters: 40 million generations with sampling every 10,000 generations, four chains (one cold chain and three hot chains) and a burn-in of 25% trees. Results of all runs were examined by Tracer 1.7 (Effective sample sizes >200; Rambaut et al., 2018). Bayesian trees were also constructed using PhyloBayes MPI 1.4f (Lartillot et al., 2013) under the site-heterogeneous mixture model CAT + GTR. Before the analysis, we performed Bayesian cross-validation to test the fit of the site-heterogeneous mixture models (GTR-CAT) and site-homogeneous models (GTR). The result of cross-validation showed that the CAT + GTR model was the best fitting model for two datasets (Supplementary Table 4). Two independent trees were searched and the analysis was terminated after the two runs had satisfactory converged (maxdiff below 0.3). The initial 25% of each MCMC chain run was discarded as burn-in and a consensus tree was produced from the remaining trees combined from two runs. The final trees were visualized in Evolview 3 (Balakrishnan et al., 2019).
The complete mitogenome sequence of E. fornicatus was 16,265 bp, E. interjectus was 16,179 bp, E. similis was 15,419 bp, Xylosandrus sp. was 16,056 bp in length, respectively (Figure 1; Supplementary Table 2). Variations in the length of mitogenomes can be attributed to a variable number of repeats in the control regions. All the mitogenome contained 37 typical functional genes (i.e., 13 PCGs, 22 tRNA genes, and two rRNAs) and a control region (A + T-rich region), except for E. similis, wherein the trnI was not detected (Guo et al., 2022b; Xing et al., 2022). There was no difference between mitochondrial genes in order and orientation from the putative ancestral insect mitogenome (Cameron, 2014). A total of 23 genes (nine PCGs and 14 tRNAs) were located on the positive strand (N-strand), while the remaining 14 genes (four PCGs, eight tRNAs, and two rRNAs) were located on the reverse strand (J-strand).
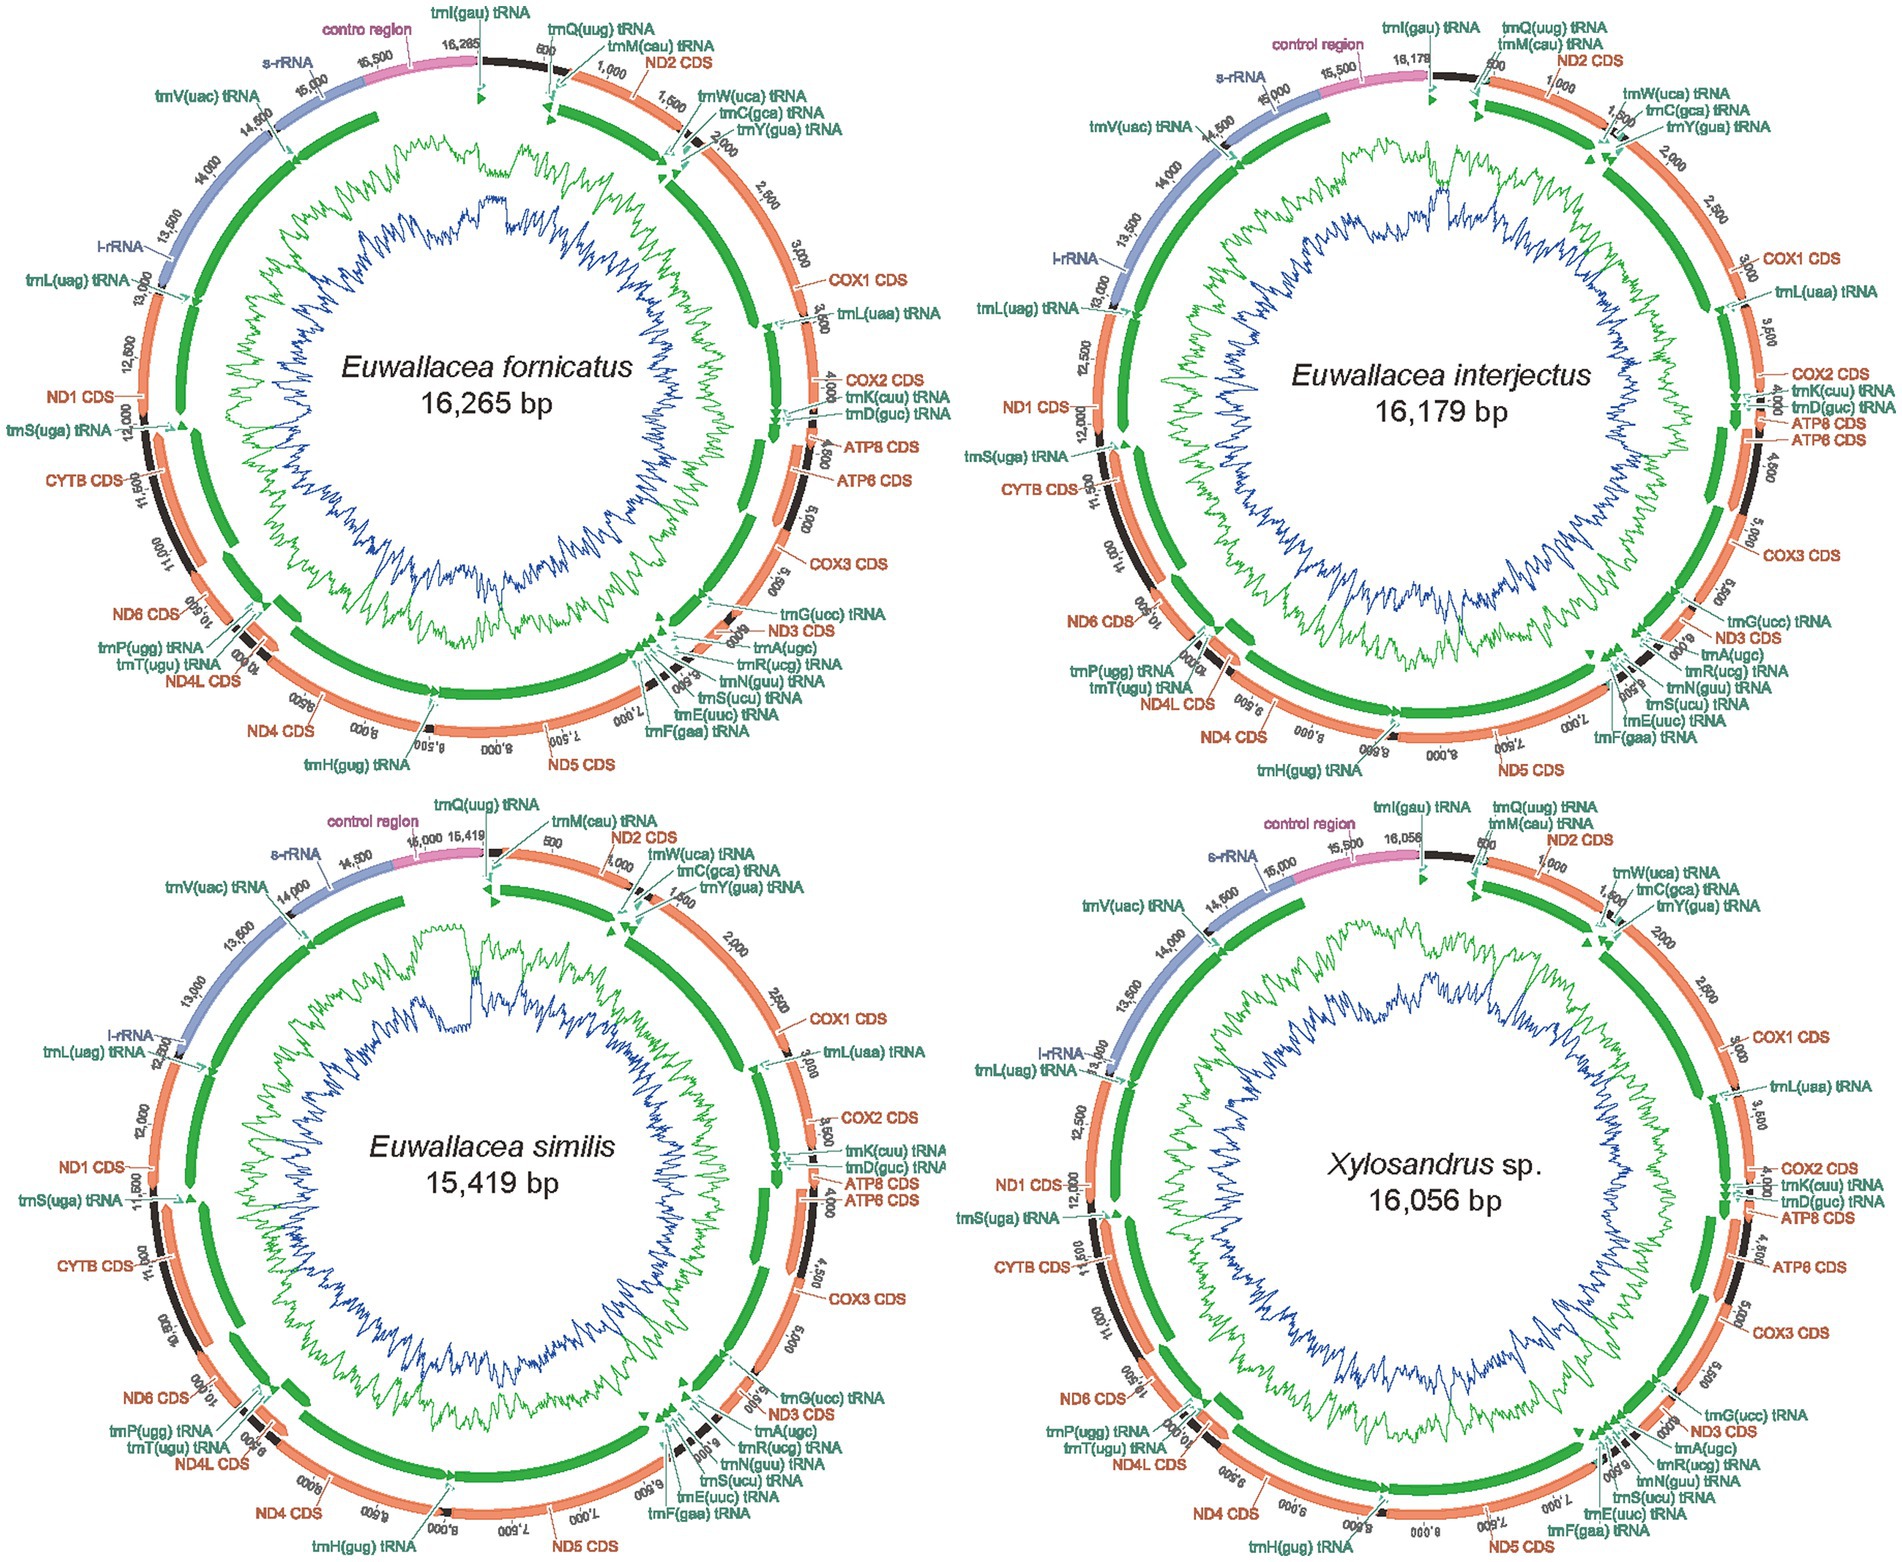
Figure 1. Mitochondrial maps of the four newly sequenced mitogenomes of Scolytinae. A standard abbreviation is used for the genes which encode proteins, ribosomes, and transfer RNA. Gene orientations are indicated by arrow directions.
The four mitogenomes exhibited a strong AT nucleotide bias, with an A + T% range from 70.7 to 73.4%: 73.4% in E. fornicatus, 72.0% in E. interjectus, 70.7% in E. similis, and 71.8% in Xylosandrus sp. (Supplementary Table 3). The composition skew analysis showed that all four Scolytinae species presented a positive AT skew and a negative GC skew in the whole mitogenome and had a higher AT content in tRNAs than in rRNAs. The AT content of control region was highest than PCGs, tRNAs, and rRNAs in all four mitogenomes, which was consistent with those comments that the control region is usually considered the most AT rich in mitogenomes (Cameron, 2014).
The PCGs of E. fornicatus, E. interjectus, E. similis, and Xylosandrus sp. were 11,105, 11,112, 11,125, and 11,131 bp in length, respectively. For the four newly sequenced mitogenomes, most PCGs initiated with the codon ATN (ATA/T/G), except for nad4 and nad1 initiating with the codon GTG and TTG, respectively. The complete termination codon TAA or TAG was utilized by most of the PCGs in these four mitogenomes, while the incomplete stop codon T was employed by nad4, nad5, cytb and cox3 (Supplementary Table 2). All three stop codons are common in the mitochondrial genomes of insects and the incomplete stop codons (TA/T) may be converted to the complete stop codon (TAA) through RNA polyadenylation (Ojala et al., 1981).
In summary, the RSCU of the four mitogenomes showed a strong bias toward the nucleotides A and T, especially the third codon position for all PCGs (Figure 2). The most frequently encoded amino acids in these four mitogenomes of Scolytinae were Ser2, Val, Gly, Leu2, Pro, Thr, and Val, which had the highest RSCU values, and the most common codons were UCU, GUA, UUA, and CGA. The most frequently noted codons in all amino acids comprised solely A or T, which reflected the high AT content of PCGs.
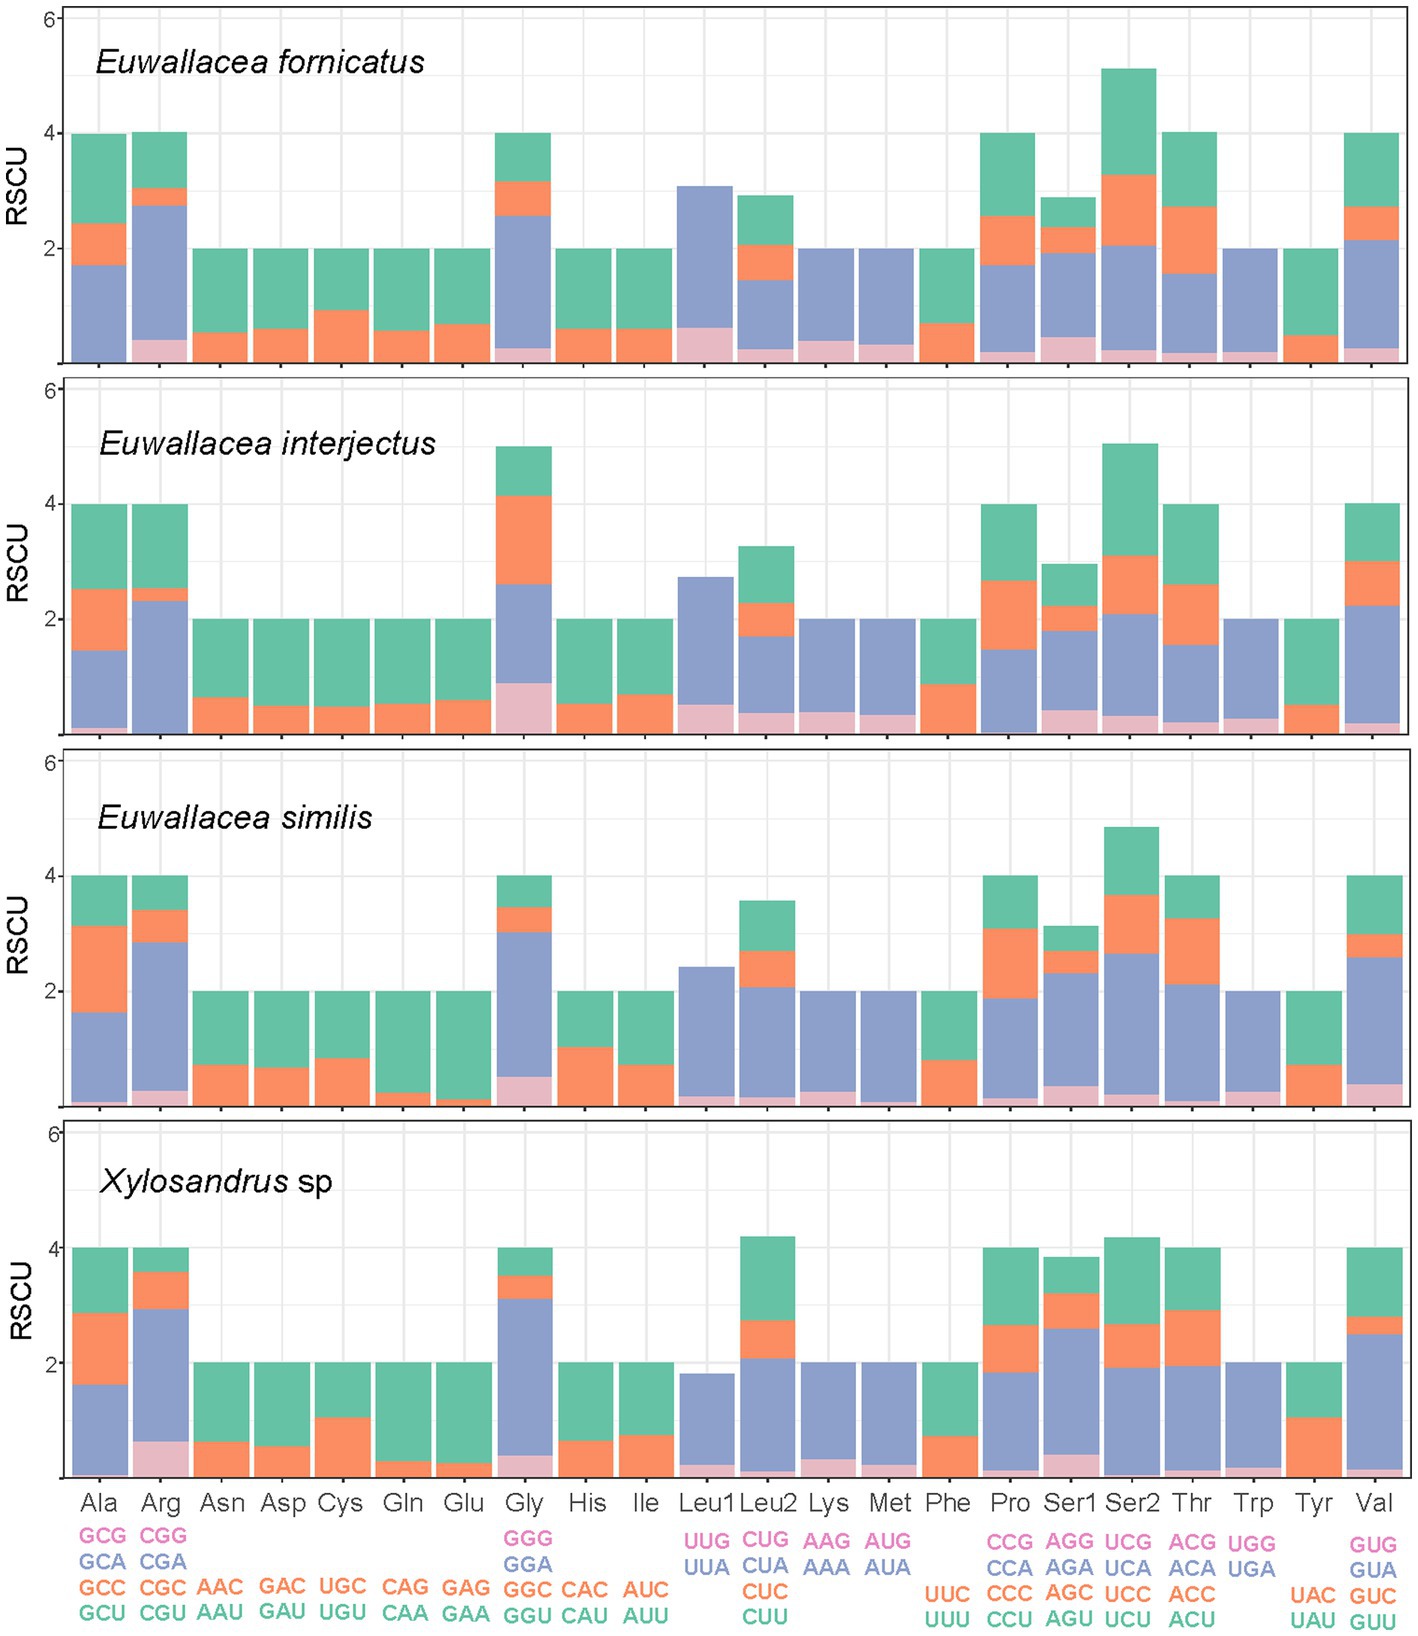
Figure 2. The relative synonymous codon usage (RSCU) in four mitogenomes of Scolytinae.
A total of 22 tRNA genes were identified and found to be discontinuously scattered throughout the mitogenome in the same location as hypothesized for the ancestral insect mitogenome, except for E. similis (trnI was not detected). The size of each tRNA gene for these newly determined mitogenomes was hardly different, ranging from 57 to 72 bp (Supplementary Table 2). In all four mitogenomes of Scolytinae, 21 tRNAs displayed the classic clover-leaf secondary structure, whereas trnS1 lacks the dihydrouridine (DHU) arm and forms a simple loop, which was common in other metazoan mitogenomes (Guo et al., 2022a; Huang et al., 2023). The AT content of the tRNA genes was slightly higher than that of the PCGs, and the combined tRNA genes exhibited positive AT skew and negative GC skew (Supplementary Table 3).
As reported in other insect mitogenomes, the 16S and 12S rRNA genes in Scolytinae species were encoded on the J-strand and located at conserved positions between trnL1 and trnV and between trnV and the control region, respectively (Guo et al., 2022b). The length of 16S ranged from 1,284 bp in E. similis to 1,477 bp in E. interjectus, and that of 12S varied from 777 bp in Xylosandrus sp. to 842 bp in E. similis. The AT content of two rRNAs ranged from 72.8 to 76.7% and two rRNA in these four mitogenomes showed a positive AT skew and negative GC skew.
The largest noncoding region in these mitogenomes of Scolytinae beetles as well as most insects is usually located between 12S rRNA and trnI. It might be identified as the putative control region according to the conserved region aligned with other Coleoptera mitogenomes (Zhang et al., 2021). The length of the control regions of the four mitogenomes vary widely, ranging from 681 bp in E. similis to 1,004 bp in Xylosandrus sp. The AT content of this region (more than 85%) was one of the highest within the whole mitogenomes (Supplementary Table 3). The ploy-T element ranged from 12 to 26 bp in length has been detected in three out of four mitogeomes (Figure 3), which was generally thought to play a role in the replication mechanism (Saito et al., 2005). Notably, three mitogenomes of Euwallacea new sequenced here have two ploy-T elements, whereas no ploy-T element has been found in mitogenome of Xylosandrus sp. The type of repeat unit was varied in these four control region of mitogenomes. Control region of two species contained only one type of repeat unit, while remaining two species contained two or three types (Figure 3). The longest repeat region in E. similis included three 136 bp repeat units and a partial sequence (13 bp). However, in E. interjectus, the tandem repeats was relatively short. One kind of tandem repeat, including a length of 38 bp presenting three complete copies and one 5 bp partial copy has been detected in E. interjectus. As in the bark and ambrosia beetles and other insect mitogenomes, tandem repeat regions are common and the variable length and copy number of repeat units point to a conspicuous divergence of control region (Zhang et al., 1995; Huang et al., 2023).
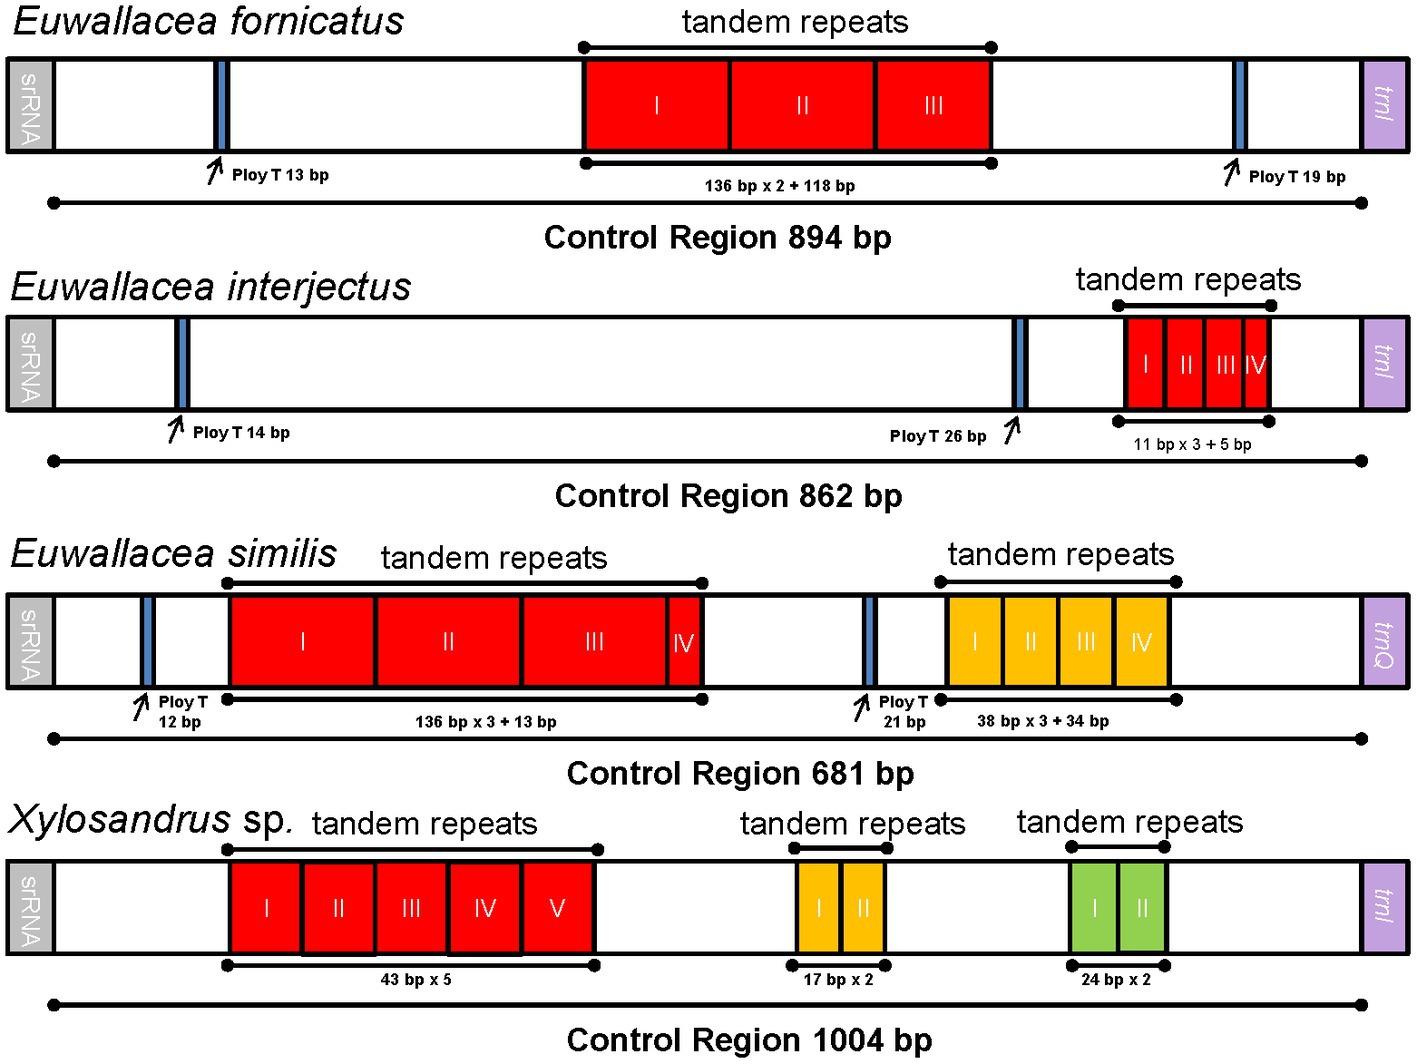
Figure 3. Organization of the control region in four newly sequenced mitogenomes. The location and copy number of tandem repeats are shown in red, yellow, and green with roman numerals inside.
The ratio of Ka/Ks was calculated to further analyze the evolutionary rate of 13 PCGs (Supplementary Figure 2). The ratio of Ka/Ks of most PCGs was less than 1, suggesting that these functional genes were all under strong purifying selection, which was consistent with previous reports in other insects (Du et al., 2021). However, the ratio of Ka/Ks value of nad4 was greater than 1, implying this gene under a positive selection. The NADH dehydrogenase subunits (nad1-6 and 4l) and ATP synthase subunits (atp8 and atp6) had higher Ka/Ks ratios than the cytochrome oxidase subunits (cox1, cox2, and cox3) and cytochrome b (cytb). This phenomenon suggested that different selection pressures have been exerted on various functional genes in the mitochondria of Scolytinae during the evolutionary process. Comparable patterns of mitochondrial gene evolution have also been reported in several insect clades, including Psilidae (Diptera; Zhou and Yang, 2022), Cicadellidae (Hemiptera; Xu et al., 2020), Tortricidae (Lepidoptera; Huang et al., 2023), and Chrysomelidae (Coleoptera; Zhang et al., 2021), this suggests that the evolutionary pattern of mitochondrial genes may be relatively conserved among insects.
The results of nucleotide diversity based on 13 PCGs for 52 sequenced mitogenomes of Scolytinae indicated that nucleotide diversity values range from 0.223 (cox1) to 0.400 (nad6; Supplementary Figure 3). Comparing each gene, nad6 (Pi = 0.400) presented the highest variability, followed by atp8 (Pi = 0.391) and nad2 (Pi = 0.362). However, cox1 (Pi = 0.223) and cox2 (Pi = 0.244) were the comparatively conserved genes in the 13 PCGs. As a result, cox1 could serve as a potential species identification marker since it was least variable (Hebert et al., 2003; Huang et al., 2020).
We examined the heterogeneity of pairwise sequence divergence (Figure 4) and found the PCGR datasets had a higher heterogeneous pairwise sequence divergence than the PCG12R datasets. Therefore, the third codon positions were the main reasons for such nucleotide heterogeneity, and consequently, excluding the third-codon positions from the datasets would reduce the degree of sequence heterogeneity. Moreover, some species possessed higher sequence heterogeneity in both datasets, including Corthylus rubricollis Blandford, 1904, Ips grandicollis (Eichhoff, 1868), and Xyleborus perforans (Wollaston, 1857). These species may be uncertainly or incorrectly placed in the phylogenetic trees as a result of the divergences between these taxa, as reported by previous studies which assumed the compositional heterogeneity of mitogenomes in certain groups may result in the incorrect grouping of unrelated taxa (Guo et al., 2022a). However, we found that the positions of these three species were stable in all our phylogenetic analyses (see below), and high heterogeneity did not affect the results of our analyses. We assume that it is the missing data of these three species that makes them have high heterogeneity, because of the mitogenomes of these three species are incomplete, and only 8, 12 and 12 genes from C. rubricollis, I. grandicollis, and X. perforans were extracted, respectively.
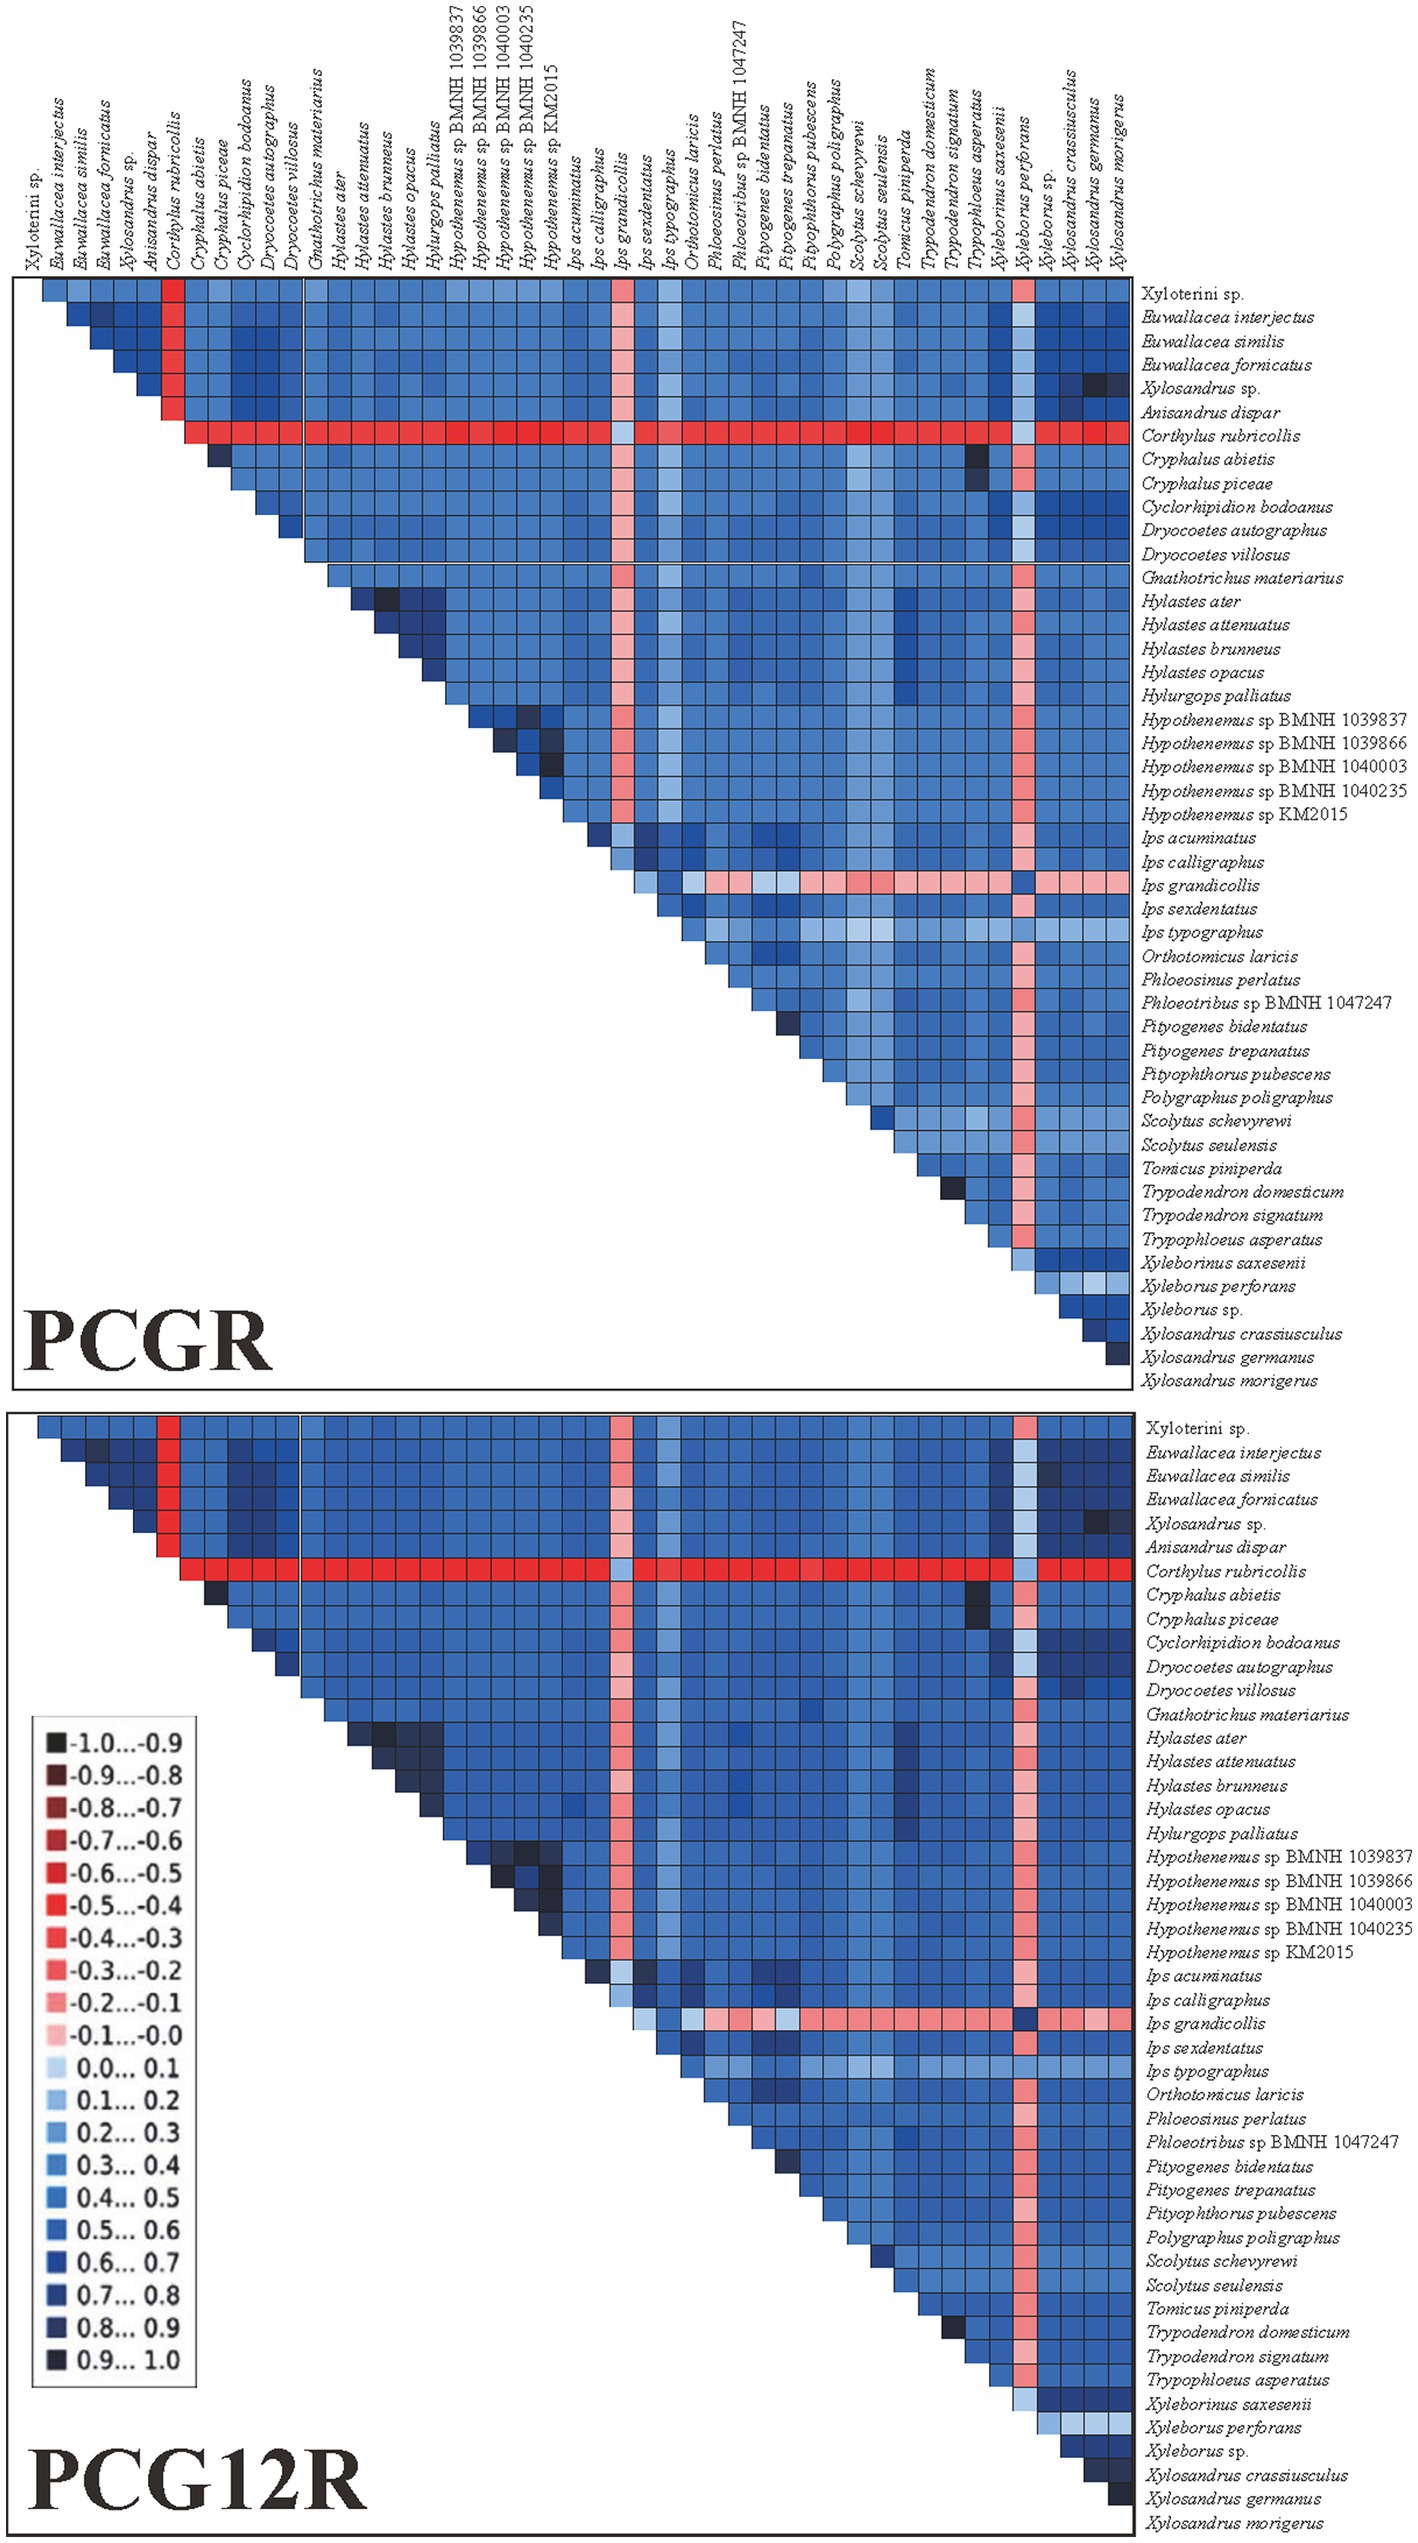
Figure 4. AliGROOVE analysis for two mitogenomic datasets. The mean similarity score between sequences is represented by a colored square, based on AliGROOVE scores ranging from −1, indicating a large difference in sequence composition from the remainder of the dataset (red coloration), to +1, indicating similarity to all other comparisons (blue coloration).
When we used the homogeneity model, both of analysis methods (RAxML and MrBayes) produced the same results, but these were inconsistent with the results using the heterogeneity model (Figures 5, 6; Supplementary Figures 4, 5). The weevil subfamily Scolytinae has been revealed as a monophyletic group with high support in our most of analyses (BS = 95, PP = 1; Figures 5, 6; Supplementary Figure 4), which was consistent with the results of previous phylogenetic studies based on different types of molecular data (Jordal et al., 2011; Jordal and Cognato, 2012; Gohli et al., 2017; Gohli and Jordal, 2017). However, the monophyly of Scolytinae was not recovered in the PhyloBayes analysis with PCG12R dataset (Supplementary Figure 5). The following seven genera with more than one species included in our study have also been recovered as monophyletic clades with strong support, i.e., Trypodendron Erichson 1836, Pityogenes Bedel, 1888, Ips De Geer, 1775, Scolytus Geoffroy 1762, Hypothenemus Westwood, 1836, Xyleborus Eichhoff, 1864, and Xylosandrus Reitter, 1913. The genus Hylastes Erichson, 1836 formed a monophyletic group only in the PhyloBayes analyses based on PCGR or PCG12R dataset. Notably, the monophyly of Xylosandrus was supported in our phylogeny, which was consistent with previous morphological studies of Jordal et al. (2000) and Hulcr et al. (2007). However, Dole et al. (2010) conducted phylogenetic analysis of 43 specimens representing 15 Xylosandrus species based on multiple gene loci recovered this genus as a polyphyletic lineage. The polyphyly of Xylosandrus was also suggested in Cognato et al. (2011), with both molecular and morphological data, where this genus was split in four morphologically distinct clades. Detailed examination of the prosternal morphology conducted by Cognato and Sperling (2000) suggested that the gap between coxae may have been derived from different modifications of prosternum, and is not necessarily homologous. Moreover, the precoxal and posterocoxal processes and the bridge between them are very different in different taxa. Hence, we cannot draw a definitive conclusion about their relationship.
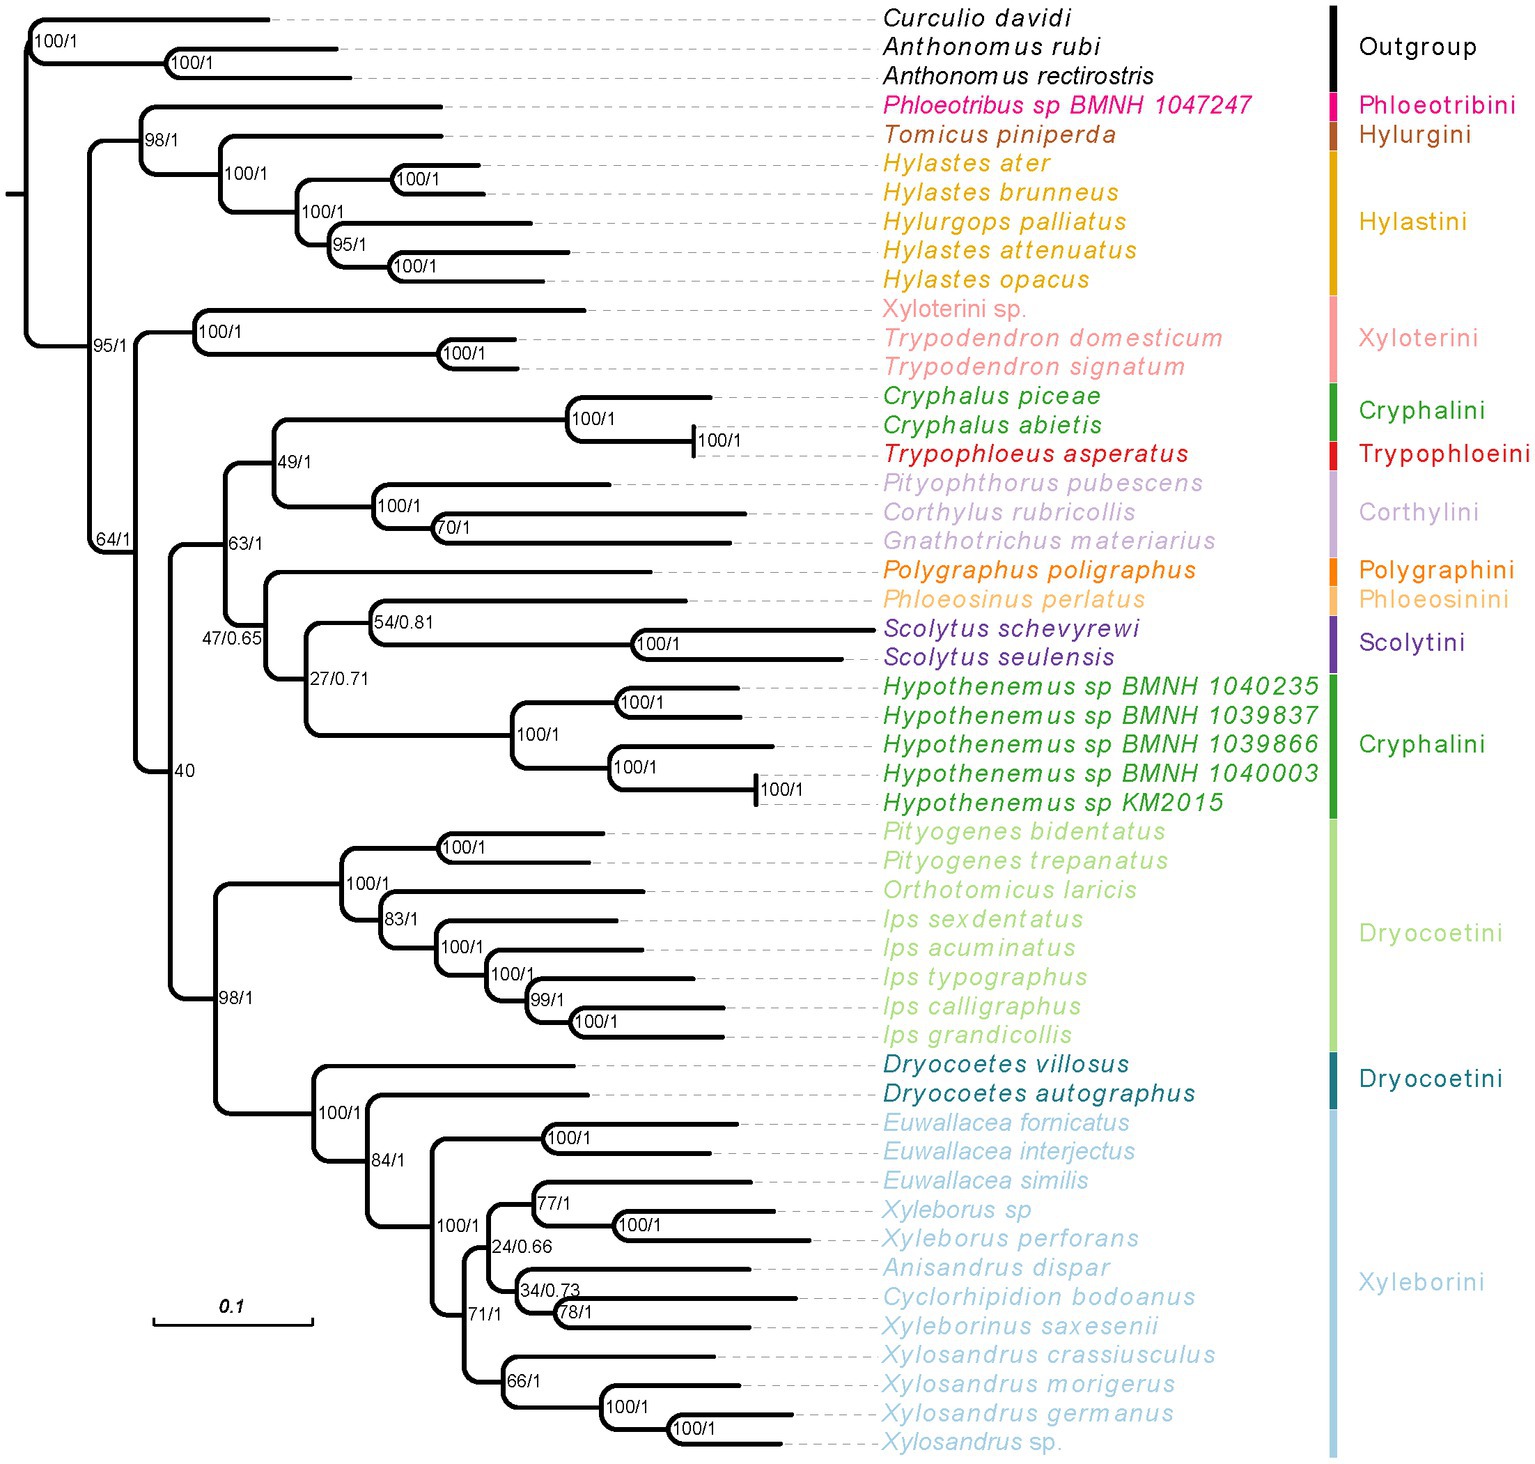
Figure 5. Phylogenetic tree inferred from RAxML and MrBayes analysis based on the concatenation data of PCGR matrix. The support rate of the branch from left to right represents bootstrap values and Bayesian posterior probabilities. Species name with different colors indicate different tribes.
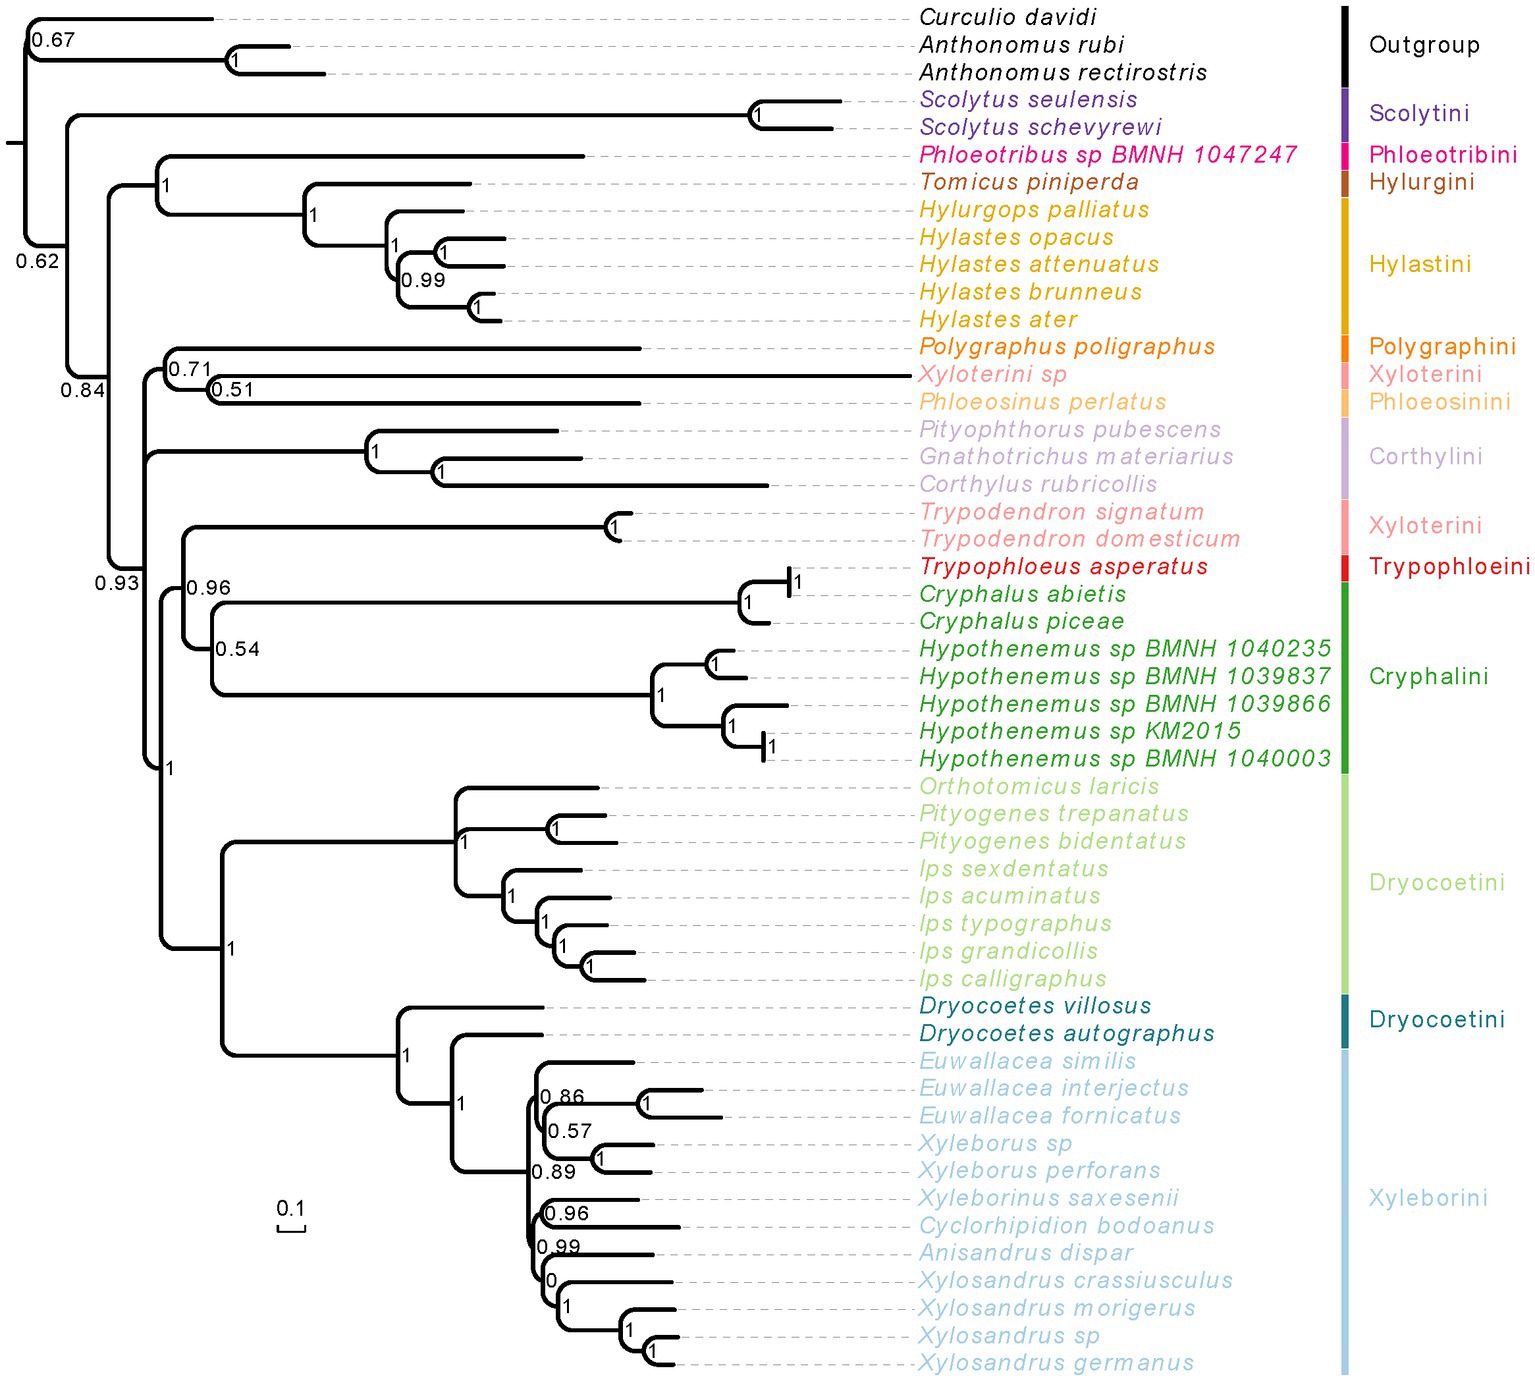
Figure 6. Phylogenetic tree inferred from PhyloBayes analysis based on the concatenation data of PCGR matrix. The support rate of the branch represents Bayesian posterior probabilities. Species name with different colors indicate different tribes.
The phylogenetic relationships within Ips were also controversial. There is uncertainty regarding the monophyly of Ips and its classification boundary with Orthotomicus (Cognato et al., 2011; Lv et al., 2017). In our study, five Ips species formed a clade with high node support (BS = 100, PP = 1) which had a sister relationship with Orthotomicus; this result was consistent with that in Lv et al. (2017). Jordal and Cognato (2012) applied nearly 4 kb sequence dataset including cox1, EF-1α, CAD, ArgK, and 28S and recovered three Ips species as a monophyletic clade, and a sister relationship between Pityogenes and Ips + Orthotomicus. These conclusions were accordance with our phylogenies inferred from mitogenomic sequences, which have also been reported in several recent phylogenetic studies (Gohli et al., 2017; Gohli and Jordal, 2017; Lv et al., 2017). However, another phylogenetic relationship reconstructed with 18 gene fragments and more sampling in Scolytinae recovered a sister relationship between Ips and Orthotomicus + Pityogenes (Pistone et al., 2018). Therefore, additional data and more comprehensive sampling will be of major importance to illuminate the phylogenetic relationship of Ips, Orthotomicus and Pityogenes.
In our all analyses, the genus Euwallacea was found paraphyletic. Both Euwallacea species of E. interjectus and E. fornicatus formed a clade with high node support (BS = 100, PP = 1), while the species E. similis clustered together with two Xyleborus species with moderate support (Figure 5). Previous cladistics review of generic taxonomic characters in Xyleborina based on 39 morphological characters revealed Euwallacea as a polyphyletic group (Hulcr et al., 2007). Similar conclusion was also brought up in Cognato and Sperling (2000), which indicated both morphological of flattened elytra and long pedicel were used to distinguished Euwallacea from other xyleborine genera is unreliable and vague. Moreover, characters associated with the elytra have been considered the least phylogenetically informative for generic-level relationships (Hulcr et al., 2007). Subsequently, to clarify generic boundary of Euwallacea and Wallacellus, Storer et al. (2015) tested reciprocal monophyly of the two genera using molecular phylogenetic. In their study, all species of Euwallacea and Wallacellus, as well as two species of Xyleborus, were monophyletic with high phylogenetic support. Therefore, all species of Wallacellus and two species of Xyleborus (formerly Xyleborus posticu and X. declivispinatus) have been transferred to Euwallacea, meanwhile Wallacellus was proposed as a junior synonym of Euwallacea according to the results of phylogenetic analysis and shared morphological characters. In fact, the species E. similis was transferred from Wallacellus (formerly Wallacellus similis) by Storer et al. (2015). In their presented results, the species E. similis formed a clade with E. posticus, a species transferred from Xyleborus (formerly X. posticu). Similar to our results inferred from mitogenome, the unexpected grouping of E. similis and two Xyleborus species, supported by our all analyses. Given our results, the phylogenetic hypotheses and taxonomic revisions suggested by Storer et al. (2015) may be problematic and are required to reevaluate through sampling more molecular markers and specimens. Considering the globally distribution of Euwallacea (Hulcr et al., 2015; Storer et al., 2015), sampling more species from different geographical regions is required to increase our understanding of the phylogenetic relationships within this genus.
In conclusion, the results of phylogenetic analyses based on mitogenomic sequences present here most of nodes at deeper and shallow level are high supported, some nodes albeit are low supported may due to incomplete sampling within that clades. We assume a higher number of mitogenomes sequenced within the subfamily Scolytinae will improve the accuracy of phylogenetic relationships. Additionally, we anticipate that future studies which combine morphological re-interpretation with dataset from more mitogenomes for larger samples will provide sufficient evidence on either tribe-level or genera-level of Scolytinae phylogenetic relationships.
The datasets presented in this study can be found in online repositories. The names of the repository/repositories and accession number(s) can be found in the article/Supplementary material.
The samples involved in this study are common species, not protected species in China. Ethical review and approval was not required for the study on animals in accordance with the local legislation and institutional requirements.
XC, QG, and XW conceived and designed the study and critically revised the manuscript. QG and WH performed the experiments and drafted the manuscript. QG, WH, and WS analyzed the data. WH and XW helped in the study design. All authors contributed to the article and approved the submitted version.
This work was supported by the Chaozhou Bureau of Agriculture and Rural Affairs, Guangdong Province (PZH019D021) and the Rural Revitalization Project from Department of Science and Technology of Guangdong Province (KTP20210104).
The authors declare that the research was conducted in the absence of any commercial or financial relationships that could be construed as a potential conflict of interest.
All claims expressed in this article are solely those of the authors and do not necessarily represent those of their affiliated organizations, or those of the publisher, the editors and the reviewers. Any product that may be evaluated in this article, or claim that may be made by its manufacturer, is not guaranteed or endorsed by the publisher.
The Supplementary material for this article can be found online at: https://www.frontiersin.org/articles/10.3389/fevo.2023.1191446/full#supplementary-material
Abascal, F., Zardoya, R., and Telford, M. J. (2010). TranslatorX: multiple alignment of nucleotide sequences guided by amino acid translations. Nucleic Acids Res. 38, W7–W13. doi: 10.1093/nar/gkq291
Balakrishnan, S., Shenghan, G., Lercher, M. J., Songnian, H., and Chen, W. (2019). Evolview v3: a webserver for visualization, annotation, and management of phylogenetic trees. Nucleic Acids Res. 47, W270–W275. doi: 10.1093/nar/gkz357
Beaver, R. A. (1989). “Insect–fungus relationships in the bark and ambrosia beetles,” in Insect–Fungus Interactions. eds. N. Wilding, N. M. Collins, P. M. Hammond, and J. F. Webber (London, UK: Academic Press).
Cameron, S. L. (2014). Insect mitochondrial genomics: implications for evolution and phylogeny. Annu. Rev. Entomol. 59, 95–117. doi: 10.1146/annurevento-011613-162007
Castresana, J. (2000). Selection of conserved blocks from multiple alignments for their use in phylogenetic analysis. Mol. Biol. Evol. 17, 540–552. doi: 10.1093/oxfordjournals.molbev.a026334
Cognato, A. I., Hulcr, J., Dole, S. A., and Jordal, B. H. (2011). Phylogeny of haplo-diploid, fungus-growing ambrosia beetles (Curculionidae: Scolytinae: Xyleborini) inferred from molecular and morphological data. Zool. Scr. 40, 174–186. doi: 10.1111/j.1463-6409.2010.00466.x
Cognato, A. I., and Sperling, F. A. (2000). Phylogeny of Ips DeGeer species (Coleoptera: Scolytidae) inferred from mitochondrial cytochrome oxidase I DNA sequcence. Mol. Phylogenet. Evol. 14, 445–460. doi: 10.1006/mpev.1999.0705
Dole, S. A., Jordal, B., and Cognato, A. I. (2010). Polyphyly of Xylosandrus Reitter inferred from nuclear and mitochondrial genes (Coleoptera: Curculionidae: Scolytinae). Mol. Phylogenet. Evol. 54, 773–782. doi: 10.1016/j.ympev.2009.11.011
Du, H., Fang, J., Shi, X., Zhang, S., Liu, F., Yu, C., et al. (2021). Comparative analysis of eight mitogenomes of bark beetles and their phylogenetic implications. Insects 12, 949–960. doi: 10.3390/insects12100949
Du, Z., Hasegawa, H., Cooley, J. R., Simon, C., Yoshimura, J., Cai, W., et al. (2019). Mitochondrial genomics reveals shared phylogeographic patterns and demographic history among three periodical cicada species groups. Mol. Biol. Evol. 36, 1187–1200. doi: 10.1093/molbev/msz051
Eskalen, A., Stouthamer, R., Lynch, S. C., Rugman-Jones, P. F., Twizeyimana, M., Gonzalez, A., et al. (2013). Host range of fusarium dieback and its ambrosia beetle (Coleoptera: Scolytinae) vector in southern California. Plant Dis. 97, 938–951. doi: 10.1094/pdis-11-12-1026-re
Gohli, J., and Jordal, B. H. (2017). Explaining biogeographical range size and measuring its effect on species diversification in bark beetles. J. Biogeogr. 44, 2132–2144. doi: 10.1111/jbi.13005
Gohli, J., Kirkendall, L. R., Smith, S. M., Cognato, A. I., Hulcr, J., and Jordal, B. H. (2017). Biological factors contributing to bark and ambrosia beetle species diversification. Evolution 71, 1258–1272. doi: 10.1111/evo.13219
Guo, Q., Liu, L., Huang, W., Sang, W., Chen, X., and Wang, X. (2022a). Characterization of the complete mitogenome of Trachylophus sinensis (Coleoptera: Cerambycidae: Cerambycinae), the type species of Trachylophus and its phylogenetic implications. J. Asia Pac. Entomol. 25, 101977–101986. doi: 10.1016/j.aspen.2022.101977
Guo, Q., Liu, L., Peng, F., Sang, W., Chen, X., and Wang, X. (2022b). First complete mitochondrial genome from the genus Coptodryas (Coleoptera: Curculionidae: Scolytinae) and its phylogenetic implications. Mitochondrial DNA B 7, 575–576. doi: 10.1080/23802359.2022.2055982
Hebert, P. D. N., Cywinska, A., Ball, S. L., and deWaard, J. R. (2003). Biological identifications through DNA barcodes. Proc. Biol. Sci. 270, 313–321. doi: 10.1098/rspb.2002.2218
Huang, W., Xie, X., Huo, L., Liang, X., Wang, X. M., and Chen, X. (2020). An integrative DNA barcoding framework of ladybird beetles (Coleoptera: Coccinellidae). Sci. Rep. 10, 10063–10010. doi: 10.1038/s41598-020-66874-1
Huang, W., Xie, X., Liang, X., Wang, X., and Chen, X. (2019). Effects of different pretreatments of DNA extraction from dried specimens of ladybird beetles (Coleoptera: Coccinellidae). Insects 10, 91–100. doi: 10.3390/insects10040091
Huang, W., Zhang, C., Zhang, T., Xu, Y., Xu, S., Tian, L., et al. (2023). Features and evolution of control regions in leafroller moths (Lepidoptera: Tortricidae) inferred from mitochondrial genomes and phylogeny. Int. J. Biol. Macromol. 236, 123928–123936. doi: 10.1016/j.ijbiomac.2023.123928
Hulcr, J., Atkinson, T. H., Cognato, A. I., Jordal, B. H., and McKenna, D. D. (2015). “Morphology, taxonomy and phylogenetics of bark beetles,” in Bark Beetles: Biology and Ecology of Native and Invasive Species. eds. F. E. Vega and R. W. Hofstetter (New York, USA: Elsevier Inc).
Hulcr, J., and Cognato, A. I. (2010). Repeated evolution of crop theft in fungus-farming ambrosia beetles. Evolution 64, 3205–3212. doi: 10.1111/j.1558-5646.2010.01055.x
Hulcr, J., Dole, S. A., Beaver, R. A., and Cognato, A. I. (2007). Cladistic review of generic taxonomic characters in Xyleborina (Coleoptera: Curculionidae: Scolytinae). Syst. Entomol. 32, 568–584. doi: 10.1111/j.1365-3113.2007.00386.x
Hulcr, J., and Stelinski, L. L. (2017). The ambrosia symbiosis: from evolutionary ecology to practical management. Annu. Rev. Entomol. 62, 285–303. doi: 10.1146/annurev-ento-031616-035105
Jordal, B. H., and Cognato, A. I. (2012). Molecular phylogeny of bark and ambrosia beetles reveals multiple origins of fungus farming during periods of global warming. BMC Evol. Biol. 12, 133–142. doi: 10.1186/1471-2148-12-133
Jordal, B. H., Normark, B. B., and Farrell, B. D. (2000). Evolutionary radiation of an inbreeding haplodiploid beetle lineage (Curculionidae, Scolytinae). Biol. J. Linn. Soc. 71, 483–499. doi: 10.1111/j.1095-8312.2000.tb01270.x
Jordal, B. H., Sequeira, A. S., and Cognato, A. I. (2011). The age and phylogeny of wood boring weevils and the origin of subsociality. Mol. Phylogenet. Evol. 59, 708–724. doi: 10.1016/j.ympev.2011.03.016
Katoh, K., and Standley, D. M. (2013). MAFFT multiple sequence alignment software version 7: improvements in performance and usability. Mol. Biol. Evol. 30, 772–780. doi: 10.1093/molbev/mst010
Kearse, M., Moir, R., Wilson, A., Stones-Havas, S., Cheung, M., Sturrock, S., et al. (2012). Geneious basic: an integrated and extendable desktop software platform for the organization and analysis of sequence data. Bioinformatics 28, 1647–1649. doi: 10.1093/bioinformatics/bts199
Kirkendall, L. R., Biedermann, P. H. W., and Jordal, B. H. (2015). “Evolution and diversity of bark and ambrosia beetles” in Bark Beetles: Biology and Ecology of Native and Invasive Species. eds. F. E. Vega and R. W. Hofstetter (New York, USA: Elsevier Inc), 85–136.
Kück, P., Meid, S. A., Groß, C., Wagele, J. W., and Misof, B. (2014). AliGROOVE-visualization of heterogeneous sequence divergence within multiple sequence alignments and detection of inflated branch support. BMC Bioinform. 15, 1–15. doi: 10.1186/1471-2105-15-294
Kumar, S., Stecher, G., and Tamura, K. (2016). MEGA7: molecular evolutionary genetics analysis version 7.0 for bigger datasets. Mol. Biol. Evol. 33, 1870–1874. doi: 10.1093/molbev/msw054
Lanfear, R., Frandsen, P. B., Wright, A. M., Senfeld, T., and Calcott, B. (2017). PartitionFinder2: new methods for selecting partitioned models of evolution for molecular and morphological phylogenetic analyses. Mol. Biol. Evol. 34, 772–773. doi: 10.1093/molbev/msw260
Lartillot, N., Rodrigue, N., Stubbs, D., and Richer, J. (2013). PhyloBayes MPI: phylogenetic reconstruction with infinite mixtures of profiles in a parallel environment. Syst. Biol. 62, 611–615. doi: 10.1093/sysbio/syt022
Librado, P., and Rozas, J. (2009). DnaSP v5: a software for comprehensive analysis of DNA polymorphism data. Bioinformatics 25, 1451–1452. doi: 10.1093/bioinformatics/btp187
Liu, Y. Q., Song, F., Jiang, P., Wilson, J., Cai, W. Z., and Li, H. (2018). Compositional heterogeneity in true bug mitochondrial phylogenomics. Mol. Phylogenet. Evol. 118, 135–144. doi: 10.1016/j.ympev.2017.09.025
Lowe, T. M., and Eddy, S. R. (1997). tRNAscan-SE: a program for improved detection of transfer RNA genes in genomic sequence. Nucleic Acids Res. 25, 955–964. doi: 10.1093/nar/25.5.955
Lv, F., Yang, W., Chen, Z., Xu, Q., Zhou, Y., and Du, Y. (2017). Three partial mitochondrial genomes from Ips (Coleoptera: Curculionidae, Scolytinae) contribute to the phylogeny of Scolytinae. J. Asia Pac. Entomol. 20, 1007–1013. doi: 10.1016/j.aspen.2017.07.012
Meng, G., Li, Y., Yang, C., and Liu, S. (2019). MitoZ: a toolkit for animal mitochondrial genome assembly, annotation and visualization. Nucleic Acids Res. 47:e63. doi: 10.1093/nar/gkz173
O’Donnell, K., Libeskind-Hadas, R., Hulcr, J., Bateman, C., Kasson, M. T., Ploetz, R. C., et al. (2016). Invasive Asian fusarium-Euwallacea ambrosia beetle mutualists pose a serious threat to forests, urban landscapes and the avocado industry. Phytoparasitica 44, 435–442. doi: 10.1007/s12600-016-0543-0
Oberprieler, R. G., Marvaldi, A. E., and Anderson, R. S. (2007). Weevils, weevils, weevils everywhere. Zootaxa 1668, 491–520. doi: 10.11646/zootaxa.1668.1.24
Ojala, D., Montoya, J., and Attardi, G. (1981). tRNA punctuation model of RNA processing in human mitochondria. Nature 290, 470–474. doi: 10.1038/290470a0
Peng, Y., Leung, H. C. M., Yiu, S. M., and Chin, F. Y. L. (2012). IDBA-UD: a de novo assembler for single cell and metagenomic sequencing data with highly uneven depth. Bioinformatics 28, 1420–1428. doi: 10.1093/bioinformatics/bts174
Perna, N. T., and Kocher, T. D. (1995). Patterns of nucleotide composition at fourfold degenerate sites of animal mitochondrial genomes. J. Mol. Evol. 41, 353–358. doi: 10.1007/bf00186547
Pistone, D., Gohli, J., and Jordal, B. H. (2018). Molecular phylogeny of bark and ambrosia beetles (Curculionidae: Scolytinae) based on 18 molecular markers. Syst. Entomol. 43, 387–406. doi: 10.1111/syen.12281
Pistone, D., Mugu, S., and Jordal, B. H. (2016). Genomic mining of phylogenetically informative nuclear markers in bark and ambrosia beetles. PLoS One 11:e0163529. doi: 10.1371/journal.pone.0163529
Rambaut, A., Drummond, A. J., Xie, D., Baele, G., and Suchard, M. A. (2018). Posterior summarisation in Bayesian phylogenetics using tracer 1.7. Syst. Biol. 67, 901–904. doi: 10.1093/sysbio/syy032
Ronquist, F., Teslenko, M., Van Der Mark, P., Ayres, D. L., Darling, A., Hohna, S., et al. (2012). MrBayes 3.2: efficient Bayesian phylogenetic inference and model choice across a large model space. Syst. Biol. 61, 539–542. doi: 10.1093/sysbio/sys029
Saito, S., Tamura, K., and Aotsuka, T. (2005). Replication origin of mitochondrial DNA in insects. Genetics 171, 1695–1705. doi: 10.1534/genetics.105.046243
San, M. D., Gower, D. J., Zardoya, R., and Wilkinson, M. (2006). A hotspot of gene order rearrangement by tandem duplication and random loss in the vertebrate mitochondrial genome. Mol. Biol. Evol. 23, 227–234. doi: 10.1093/molbev/msj025
Schmieder, R., and Edwards, R. (2011). Quality control and preprocessing of metagenomic datasets. Bioinformatics 27, 863–864. doi: 10.1093/bioinformatics/btr026
Song, F., Li, H., Jiang, P., Zhou, X., Liu, J., Sun, C., et al. (2016). Capturing the phylogeny of Holometabola with mitochondrial genome data and Bayesian site-heterogeneous mixture models. Genome Biol. Evol. 8, 1411–1426. doi: 10.1093/gbe/evw086
Stamatakis, A. (2014). RAxML version 8: a tool for phylogenetic analysis and post-analysis of large phylogenies. Bioinformatics 30, 1312–1313. doi: 10.1093/bioinformatics/btu033
Storer, C., Breinholt, J. W., and Hulcr, J. (2015). Wallacellus is Euwallacea: molecular phylogenetics settles generic relationships (Coleoptera: Curculionidae: Scolytinae: Xyleborini). Zootaxa 3974, 391–400. doi: 10.11646/zootaxa.3974.3.6
Xing, K., Chen, K., Zhao, X. J., and Zhao, F. (2022). The complete mitochondrial genome of Lixus subtilis Boheman, 1835 (Coleoptera, Curculionidae) and its phylogenetic implications. Mitochondrial DNA B 7, 35–36. doi: 10.1080/23802359.2021.2008278
Xu, D., Yu, T., and Zhang, Y. (2020). Characterization of the complete mitochondrial genome of Drabescus ineffectus and Roxasellana stellata (Hemiptera: Cicadellidae: Deltocephalinae: Drabescini) and their phylogenetic implications. Insects 11, 534–551. doi: 10.3390/insects11080534
Zhang, S., Sekerka, L., Liao, C., Long, C., Xu, J., Dai, X., et al. (2021). The first eight mitogenomes of leaf-mining Dactylispa beetles (Coleoptera: Chrysomelidae: Cassidinae) shed new light on subgenus relationships. Insects 12, 1005–1018. doi: 10.3390/insects12111005
Zhang, D. X., Szymura, J. M., and Hewitt, G. M. (1995). Evolution and structural conservation of the control region of insect mitochondrial DNA. J. Mol. Evol. 40, 382–391. doi: 10.1007/BF00164024
Keywords: Euwallacea, Xylosandrus, Scolytinae, Curculionidae, mitochondrial genome, phylogenetic analysis
Citation: Guo Q, Huang W, Sang W, Chen X and Wang X (2023) Characterization, comparative analyses, and phylogenetic implications of mitochondrial genomes among bark and ambrosia beetles (Coleoptera: Curculionidae, Scolytinae). Front. Ecol. Evol. 11:1191446. doi: 10.3389/fevo.2023.1191446
Edited by:
Cleber Galvão, Oswaldo Cruz Foundation (Fiocruz), BrazilReviewed by:
Liang Lü, Hebei Normal University, ChinaCopyright © 2023 Guo, Huang, Sang, Chen and Wang. This is an open-access article distributed under the terms of the Creative Commons Attribution License (CC BY). The use, distribution or reproduction in other forums is permitted, provided the original author(s) and the copyright owner(s) are credited and that the original publication in this journal is cited, in accordance with accepted academic practice. No use, distribution or reproduction is permitted which does not comply with these terms.
*Correspondence: Xingmin Wang, d2FuZ3htY25Ac2NhdS5lZHUuY24=
†These authors have contributed equally to this work
Disclaimer: All claims expressed in this article are solely those of the authors and do not necessarily represent those of their affiliated organizations, or those of the publisher, the editors and the reviewers. Any product that may be evaluated in this article or claim that may be made by its manufacturer is not guaranteed or endorsed by the publisher.
Research integrity at Frontiers
Learn more about the work of our research integrity team to safeguard the quality of each article we publish.