 Jiang Wu
 Shenshan Han1
- 1College of Geography and Environment, Xianyang Normal University, Xianyang, China
- 2Urban Planning and Design Research Institute, The Engineering Design Academy of Chang’an University Co. Ltd., Xi’an, China
- 3R&D and Quality Inspection Department, Shaanxi Dibo Jingyuan Surveying and Mapping Geographic Information Co., Ltd, Xi’an, China
As the primary contributor to the urban heat island effect, the construction land can be used to understand the spatial variation characteristics of the thermal landscape within the city at the microscopic scale. Taking the main urban area of Xi’an as the study area, this paper divides the minimum urban land unit by using OpenStreetMap (OSM) road network data and employs the kernel density analysis method based on Point of interest (POI) data to construct seven types of urban functional blocks. Furthermore, this paper also establishes a thermal landscape footprint characterization model to investigate the impact range of thermal landscape footprint for various types of functional blocks and quantitatively evaluate the spatial variation characteristics of urban thermal landscape, which is of great significance to the enhancement of urban ecological environment. The study indicates that: (1) The spatial distribution of urban functional blocks presents highly coupled characteristics with POI kernel density. (2) The surface thermal landscapes of seven types of urban functional blocks are predominantly medium-temperature and sub-high-temperature pixels, with the mean values of thermal fields ranked as logistics and storage blocks > industrial development blocks > transportation hub blocks > comprehensive service blocks > residential and living blocks > commercial and business blocks > strategic reserved blocks. (3) Apart from the strategic reserved blocks, the remaining urban functional blocks can produce thermal diffusion phenomena to the surrounding areas, and their thermal landscape footprints are obviously differentiated, with their influence ranges ranked as industrial development blocks > logistics and storage blocks > comprehensive service blocks > residential and living blocks > commercial and business blocks > transportation hub blocks. The findings of the study can provide scientific guidance for both the enhancement of urban ecological environment as well as the rational planning and layout of the city.
1 Introduction
The fundamental concept of “urban heat island” is defined as a phenomenon in which the temperature inside the city is significantly higher than that in the surrounding suburbs, and is mainly influenced by both natural and anthropogenic factors (Manley, 1958). As global warming intensifies over the years and urbanization continues to increase, the emergence of a series of issues such as resource shortage, environmental degradation, traffic congestion, and excessive population density has had a remarkable negative impact on urban development. In this regard, the “13th Five-Year Plan” for National Ecological Protection has pointed out that one of the major ecological issues faced by China is the limited role of urban ecosystems in mitigating the thermal environmental effects of cities. Furthermore, the “14th Five-Year Plan” also explicitly proposed to improve the planning and coordination mechanism in the field of ecological civilization, to build an ecological civilization system, and to promote the comprehensive green transformation of economic and social development. Against this background, mitigating the urban heat island effect has already become a critical link in promoting the well-being of humankind, new urbanization construction as well as green economic development.
Cities are the geospatial carriers of production and social activities conducted by human in the process of social development. Consequently, various ecological and environmental issues that arise in the urbanization process are closely related to the anthropogenic role of urban landscape patterns. Geographically, urbanization can be manifested as a change in the structure and function of land use/surface cover types, which is specifically characterized by the transformation of natural landscapes such as vegetation and water systems into artificial underlying surface composed of elements such as cement, asphalt and metals (Zhuang et al., 2019). During this process, the evapotranspiration of vegetation is diminished, the ground heat radiation, heat transfer and heat storage are changed, combined with the release and transmission of anthropogenic heat from human activities, resulting in significant effects on the spatial distribution of the urban thermal environment (Li et al., 2012; Chen et al., 2013; Yue and Xu, 2013; Rossi et al., 2014). As an interdisciplinary research field of geography, ecology and economics, urban thermal environment mainly involves various directions such as quantitative methods (Wan and Li, 1997; Qin et al., 2001), spatial and temporal evolution characteristics (Yao et al., 2017; Qiao et al., 2019), driving factors (Giorgio et al., 2017; Singh et al., 2017; Zheng and Weng, 2018) and different scales (Orlanski, 1975) according to the differences in the emphasis of each research direction. This paper mainly discusses the spatial variation of urban thermal landscape based on microscopic scale.
Abundant research findings have been achieved by a large number of scholars both domestically and internationally around the impact of land use/cover change on the urban thermal environment. Estoque et al. (2017) analyzed the relationship between surface temperature and impervious surface and greenfield spatial patterns in metropolitan areas such as Bangkok, Jakarta, and Manila. The findings indicated that the average surface temperature showed a significant positive correlation with impervious surfaces and was about 3 degrees Celsius higher than that of greenfield areas (Estoque et al., 2017). Singh et al. (2017) explored the effect of land use change on the urban thermal field, and the findings indicated that the temperature in areas with dense buildings was significantly higher than that in areas covered by vegetation and water bodies, and the ecological index was worst in highly urbanized areas in the central part of the city. Through analyzing the dynamic change characteristics of urban heat island effect and the relationship between heat island effect and land change in Wuhan City in the last 10 a, Liu et al. (2017) showed that the heat island area presented a trend of expansion from the old city to the new city, and the increase in the area of construction land was an important influencing factor for the expansion of urban heat island intensity area. According to the investigation of the relationship between the distribution of heat island effect grades and land cover types in three cities of Jinan, Wuhan and Chongqing by Yi et al. (2018), it was found that urban construction land was the major contributor to the urban heat island effect, however, the land cover types that could best mitigate the urban heat island effect were not exactly the same. Guo et al. (2020) revealed that NDBI was highly correlated with surface temperature via analyzing the relationship between changes in different land use types and surface temperature in Ganjingzi District, Dalian City, and that the expansion of urban areas had a greater role in influencing the thermal environment. By using Xi’an city as the study area, Huang et al. (2022) conducted a systematic analysis of the relationship among changes in land use scale, structure and morphology and changes in the thermal environment, whose findings pointed out that changes in the area share of arable land and construction land were positively correlated with changes in surface temperature, and that the high dominance and agglomeration of the patchy landscape of these two was a critical factor in the increase in surface temperature and the deterioration of the thermal environment, while forest and grassland as well as water bodies had a significant cooling effect (Huang et al. 2022). Qiao et al. (2022) proposed an algorithm for the contribution of urban thermal environment change based on land use type, and quantified the contribution of land use type change to urban thermal environment change for each city in the Beijing-Tianjin-Hebei urban agglomeration on this basis. Furthermore, the study also pointed out that the contribution of arable land, urban construction land and rural settlements to urban thermal environment change was more significant, and the unit contribution intensity of human activities to urban thermal environment change was much higher than that of natural climate (Qiao et al., 2022). To summarize, as a collection containing various types of land (residential land, public administration and public service land, commercial and service land, industrial and mining land, etc.), the significant influence of construction land on the spatial distribution of urban thermal environment is self-explanatory. By studying the influence of different types of construction land on the urban thermal landscape, the spatial variation characteristics of the thermal landscape within the city can be learned at the microscopic scale, which provides scientific guidance for the improvement of the urban ecological environment and the rational planning and layout of the city.
Over recent years, numerous scholars have been using point-of-interest (POI) (Zhang et al., 2021; Li et al., 2022), social media data (Chen et al., 2018; He et al., 2020), mobile phone signaling data (Zhong et al., 2017; Wang et al., 2020), vehicle trajectory data (Yang et al., 2020) and other massive amounts of big data for “urban computing” (Zheng, 2015), to achieve urban functional block identification, population movement characteristics research, and so forth. In particular, the POI is a point-like spatial data for representing geographical entities (government, schools, hospitals, shops, neighborhoods, etc.) in GIS, each of which consists of objective attribute features (name, address, type, etc.) and location features, and the geographical entities it represents are mostly the primary places of human activities in the city. By recording the precise geographical coordinates of urban facilities and quantitative information on human activities, this data can reflect the intensity and type of human activities at a fine scale. According to existing studies on urban heat island effect, POI data can reflect the heat source intensity of human activities in cities, and can be complemented with remote sensing imagery as an effective data source for fine-scale studies on the urban heat island (Han et al., 2017). On this basis, this paper identifies different types of functional blocks in the city based on POI data, and studies the spatial variability characteristics of the thermal landscape of different functional blocks in the city. The identification of urban functional blocks requires the acquisition of the minimum urban land unit, and in urban planning and design, the land unit formed by road network connections is generally taken as the fundamental urban unit. The land unit divided on the basis of the road network takes into account the actual distribution of urban roads and, for the identification of urban functional blocks, units with the same socio-economic function are more meaningful and the block division is more reasonable.
With the main urban area of Xi’an as the study area, this study uses Landsat 8 remote sensing imagery to invert the urban surface temperature and divides the minimum urban land unit by using OpenStreetMap (OSM) road network data. Meanwhile, this study also combines the urban zoning standards of territorial spatial planning, constructs seven types of urban functional blocks by using the kernel density analysis method based on POI data, and creates the thermal landscape footprint characterization model. Moreover, this study also investigates the impact range of the thermal landscape footprint of each type of functional blocks, quantitatively evaluates the spatial variation characteristics of the urban thermal landscape, and achieves the exploration of the urban thermal landscape from the whole to the local and from the macro to the micro, which is of great significance to the enhancement of the urban ecological environment.
2 Data and methods
2.1 Overview of the study area
The study area of this paper covers the main urban area of Xi’an, which is mainly the area within the Xi’an Ring Expressway, including seven districts within Xi’an (Xincheng District, Beilin District, Lianhu District, Weiyang District, Yanta District, Baqiao District and Chang’an District) as well as a small part of Qindu District in Xianyang City, with a total area of about 457km². Located in the Guanzhong Basin in the central Weihe River Basin, Xi’an is characterized by a warm-temperate semi-humid continental monsoon climate with warm and dry springs, hot and rainy summers, mild autumns, and cold and foggy winters. The schematic diagram of the study area is shown in Figure 1.
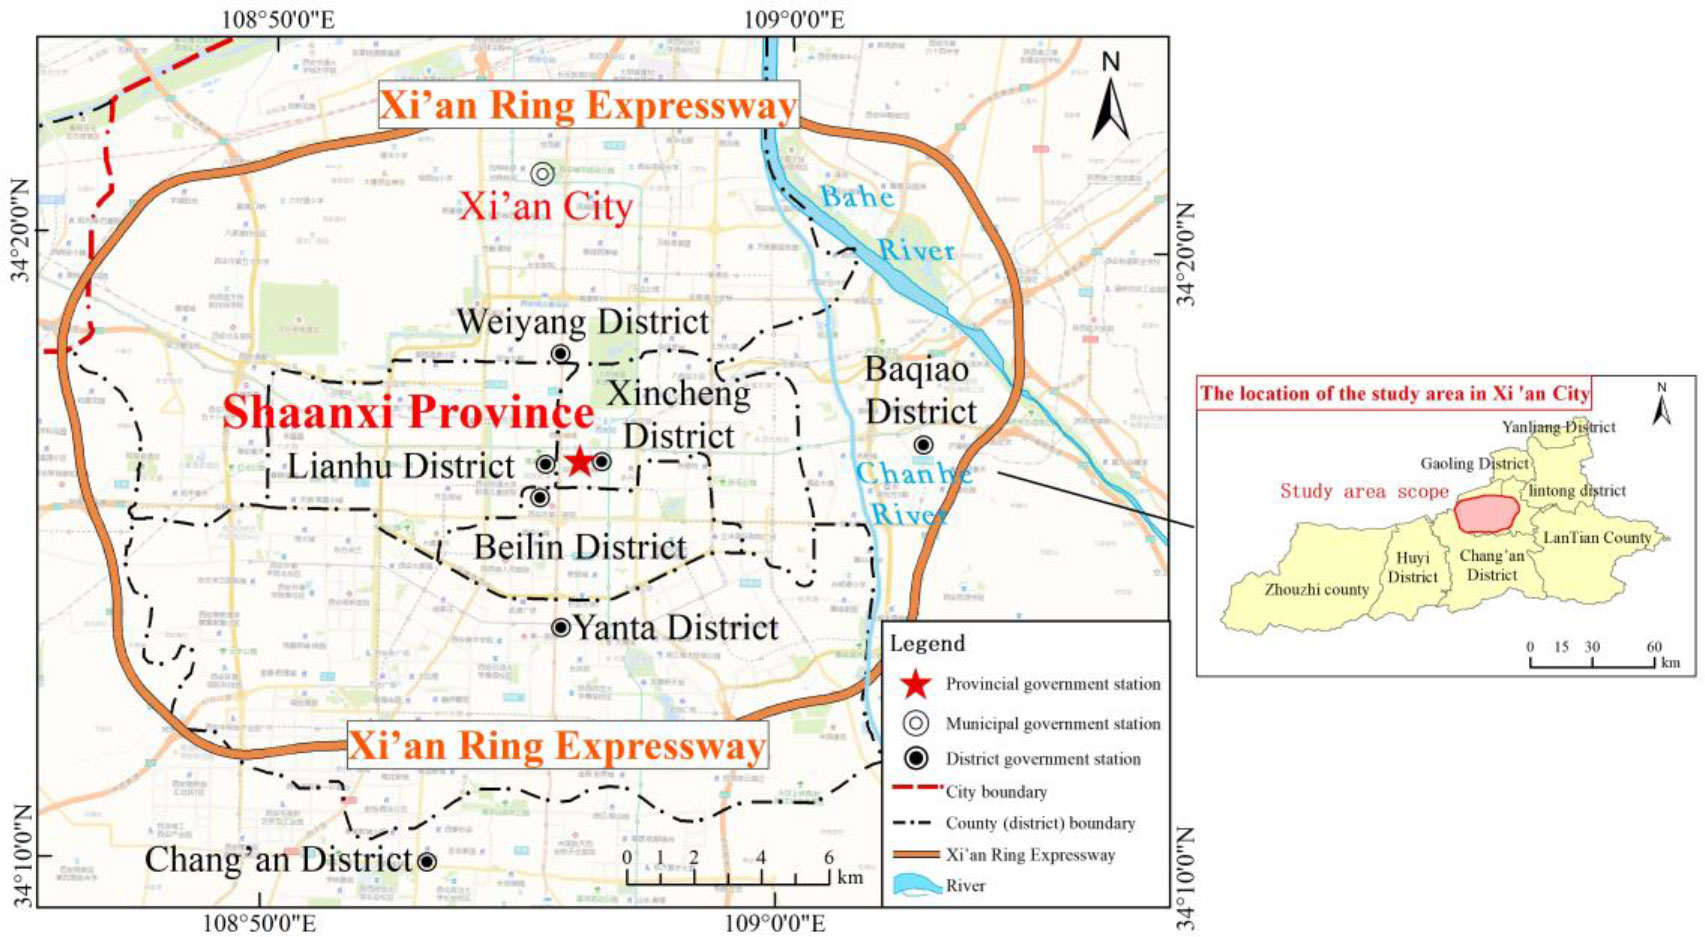
Figure 1 Overview of the study area.
With the rapid development of the city in recent years, Xi’an has faced increasingly serious ecological and environmental issues, with high temperatures in summer hitting record levels several times. In 2017, Xi’an became the first provincial capital city whose high temperature in summer exceeded 40°C and ranked among the top three cities in China in terms of the number of high temperature days in a row. Hence, it is of great significance to study the evolutionary characteristics of the thermal landscape in the main urban area of Xi’an and propose mitigation measures.
2.2 Data sources
2.2.1 Remote sensing data
This paper used the Landsat 8 remote sensing imagery data (satellite orbit number Path&Row: 127-365) to perform the inversion of the surface temperature of Xi’an City. Based on the imaging, this study selected the imagery of May 30, 2021, with the satellite transit time around 03:19 (GMT+8). The imagery data were of high quality at this time and were basically cloud-free within the study area, which could better reflect the actual conditions of the surface. The Landsat imagery data were downloaded from the United States Geological Survey (USGS) website (https://glovis.usgs.gov) and were pre-processed for radiometric calibration and atmospheric correction.
This article selects MODIS land surface temperature product MOD11A1 to verify the accuracy of the surface temperature retrieved from Landsat data. Its spatial resolution is 1km, and its temporal resolution is 1 day, including daytime and nighttime temperatures. MODIS data is downloaded from the United States Geological Survey website (https://glovis.usgs.gov).
2.2.2 POI data
The POI data (including name, type and coordinate attributes) used in this paper were all programmatically captured through the application programming interface provided by Baidu Maps and were obtained on June 1, 2021. A total of 165,739 POI data in JSON format of 28 types, including restaurants, shopping centers, schools, residences, and others, were captured under the coordinate system of Baidu Maps. After analyzing the JSON data, this study obtained the POI point vector data in ESRI Shape format and established the geographic coordinate system.
OSM road network data: OSM is designed to provide users with free and easily accessible digital map resources, and is the most preferred spontaneous geographic information at present. OSM road data has high accuracy in positioning and topology, and can be downloaded from the official website of OpenStreetMap.
2.3 Methods
2.3.1 Surface temperature inversion
The mono-window algorithm was derived by Qin et al. (2001) as an algorithm to invert the surface temperature using the Landsat TM/ETM+ 6th band data based on the surface thermal radiation transport and conduction equation, which requires three parameters: the average atmospheric operating temperature, the atmospheric transmittance, and the surface emissivity. The calculation formula is as follows:
Where Ts is the actual surface temperature (K); a and b are constants, being −67.355351 and 0.458606, respectively; C and D are intermediate variables, C = ϵτ and D = (1 − τ)[1 + (1 − ϵ)τ], in which ϵ is the surface emissivity and τ is the atmospheric transmittance; T6 is the brightness temperature (K) of the pixel detected by the sensor at the satellite altitude; Ta is the average atmospheric operating temperature.
In order to verify the surface temperature results obtained from inversion, this paper used MODIS data from the corresponding time period, with imaging time on the same day as Landsat data. Meteorological station data is discrete data, and there are few stations with uneven distribution. Considering the difficulty and practicality of data acquisition, this article does not use meteorological station data as the verification object. Due to the MODIS data resolution of 1km and the Landsat inversion of surface temperature data resolution of 30m, the study area was divided into a grid of 3000m×3000m using fishing net tools in ArcGIS software, and the average MODIS surface temperature values and Landsat surface temperature values within each grid were calculated and compared for their differences.
2.3.2 Urban thermal landscape grading
The mean-standard deviation method classifies urban thermal landscape grades by using the combination of the mean value of surface temperature and different standard deviation multiples. The thermal landscape grades in this paper are divided into 6 levels, namely: low temperature zone, sub-medium temperature zone, medium temperature zone, sub-high temperature zone, high temperature zone and extra-high temperature zone, which are assigned with values of 1–6 respectively. The classification criteria are shown in Table 1.
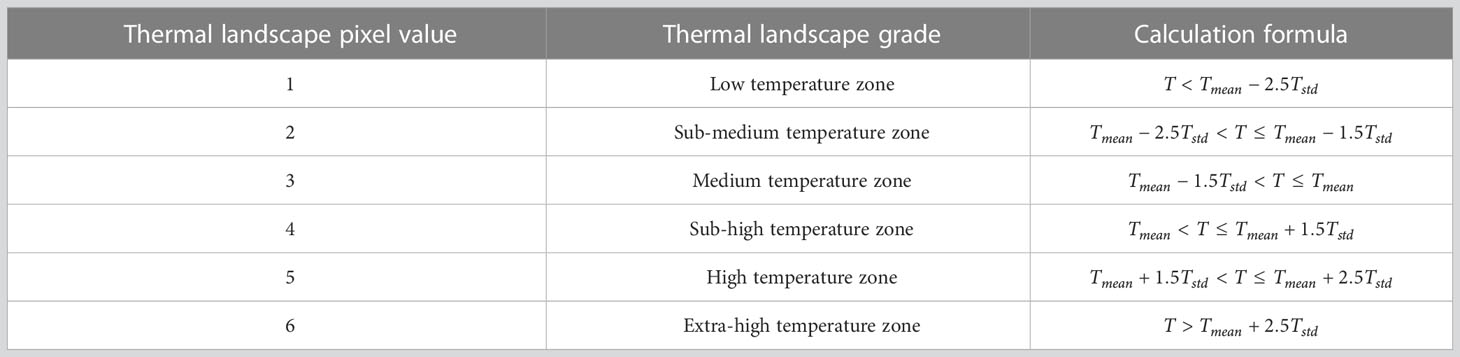
Table 1 The grade classification of urban thermal landscape.
2.3.3 Classification of urban functional blocks
2.3.3.1 Classification of the minimum urban unit based on OSM road network
The irregular grid composed by the road network was used as the fundamental unit to undertake urban functions. Since the original OSM road network data was too redundant and the trunk roads were bi-directional, there were some topological errors and invalid data, so it was necessary to optimize the original OSM road network data. In this study, the highways, trunk roads, first-class roads, second-class roads and third-class roads in the OSM road network data were extracted, and the topology of the road network was processed, which mainly included extending the unconnected roads and trimming the suspended roads, and the centerline of the original two-lane trunk roads were extracted and simplified to form a clearly connected urban road network, as well as generating the minimum urban unit surface. After visual interpretation and comparison of the optimized OSM road network data with the Gaode map, the overall consistency is high and can be used for subsequent analysis. The OSM road network before and after optimization is shown in Figure 2.
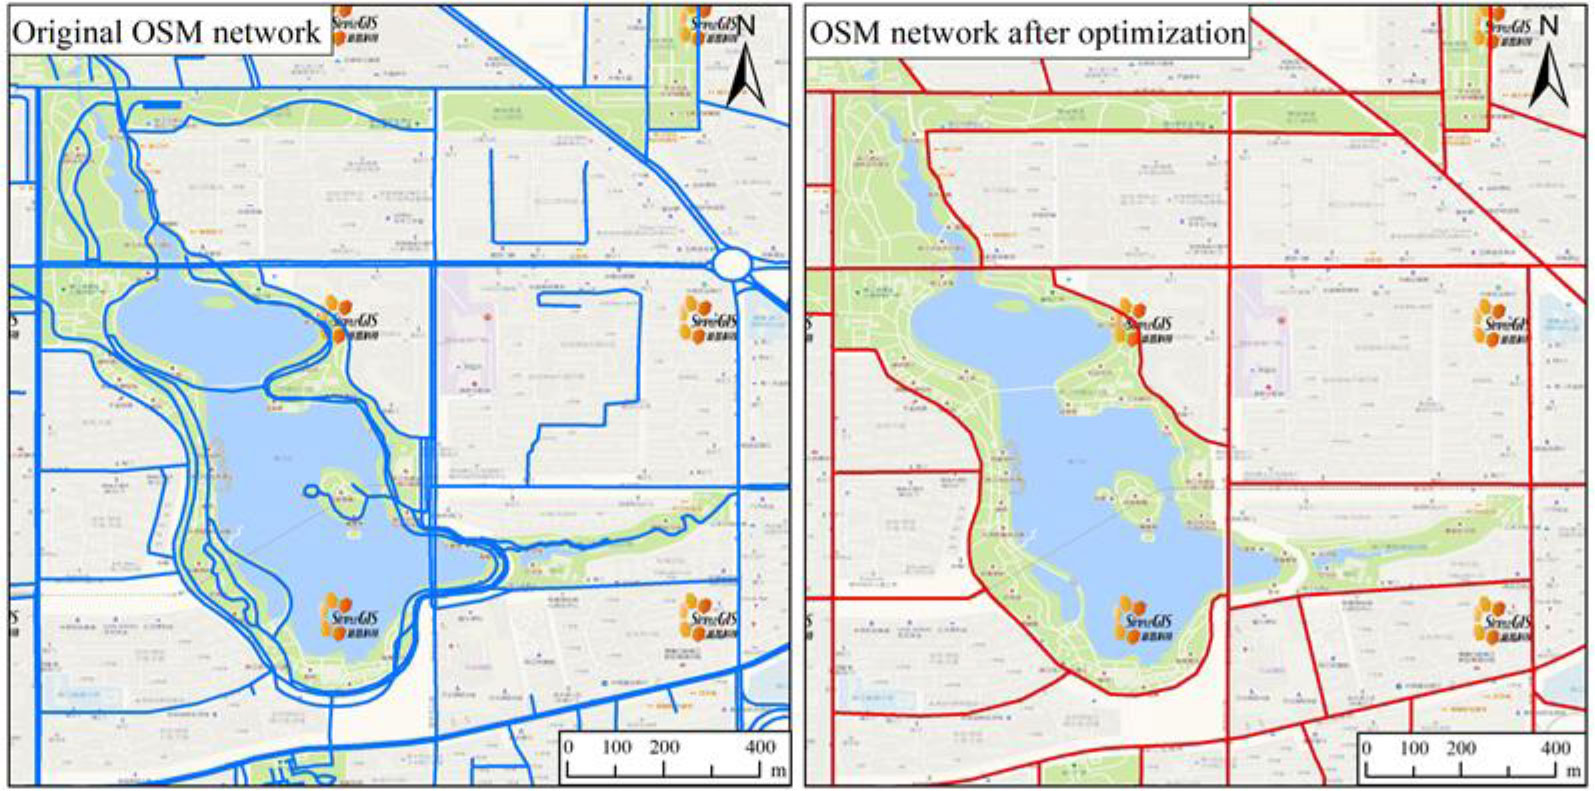
Figure 2 The comparison chart before and after OSM road network data optimization.
2.3.3.2 Kernel density analysis
The kernel density analysis method derived from the Tobler’s First Law of Geography, that is, the closer the location to the core elements the greater the density expansion value it obtains (Wang et al., 2019), which reflects the characteristics of spatial heterogeneity and the decay of central intensity with distance. Not only can this method reflect the detailed features, but also can avoid the interference of subjective disturbing factors in a limited way (Yu et al., 2016), and it is widely used in the field of density estimation of geographic phenomena with typical continuous geographic characteristics, such as urban infrastructure services and risk assessment of traffic sections (Elgammal et al., 2002). The kernel density analysis is calculated as follows:
Where f(s) is the kernel density estimation function located at position s, h is the attenuation value, also known as the bandwidth; ci is the position of the ith POI point; n is the number of POI points whose path distance from position s is no more than h; and φ is the predetermined kernel function.
According to the different distribution conditions of each POI point, the formula of bandwidth h can be deduced as follows:
Where SD is the standard distance between the average center of the point and all points, which is calculated as formula (4); Dm is the median distance between the average center of the point and all points; N is the total number of POIs.
Where SD and N have the same meaning as above; xi and yi are the coordinates of the ith POI point; X and Y are the average central point coordinates of the POI point, respectively.
2.3.3.3 Quantitative identification of urban functional blocks
This paper divided the POI data into the following seven categories of functional blocks according to the “Guidelines for the Preparation of Municipal Land and Space General Planning” and the “Guidelines for the Land and Space Survey, Planning & Use Control and Classification of Land and Sea Use”. Furthermore, this paper also combined with AMAP for fine optimization, and supplemented the information of some block units in the suburbs of cities where POI was not captured. The specific classification criteria are shown in Table 2.
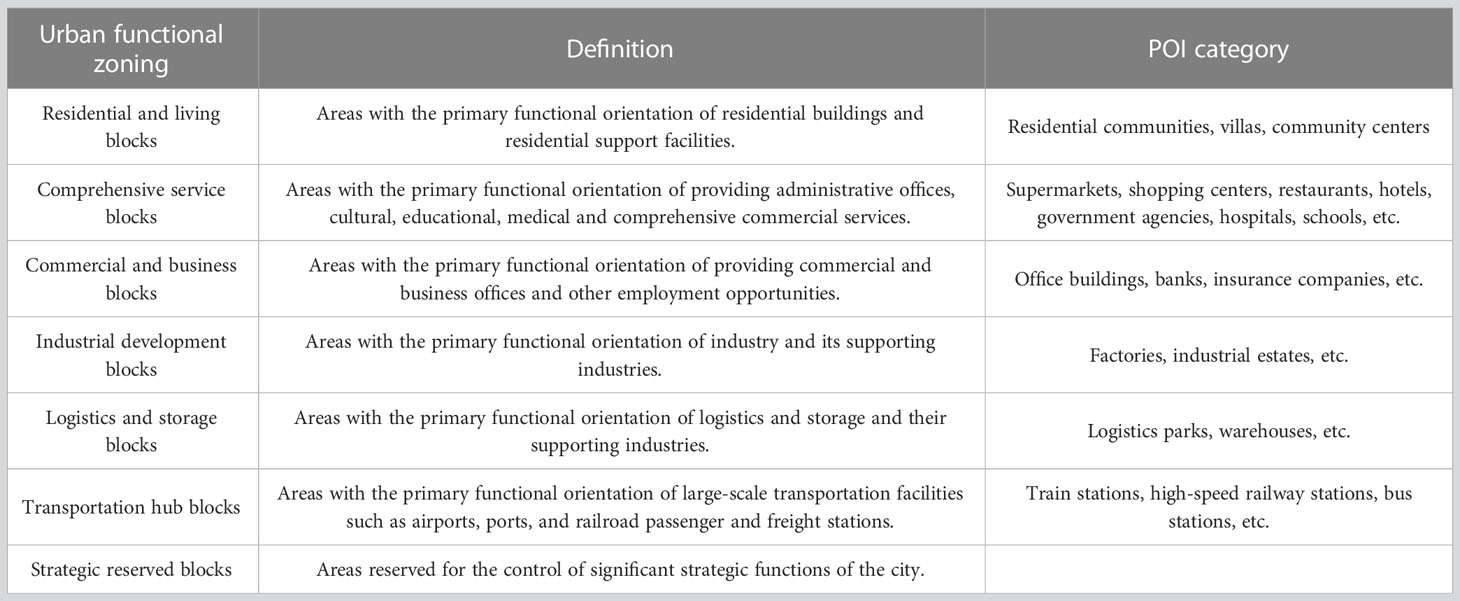
Table 2 POI data classification.
The kernel density of POIs with different densities was segmented according to the urban unit divided by OSM data, and then the proportion of the kernel density for each type of POI within the road network unit was calculated for identifying each functional block. The calculation formula is as follows:
Where Mi is the frequency density of type i POI; Ni is the sum of the kernel density of type i POI; D is the sum of all kernel densities.
When the frequency density of a certain type of POI is ≥ 50%, the unit is identified as a single functional block; when the frequency density of a certain type of POI is < 50%, the block is subdivided in combination with AMAP; and when the frequency density of all types of POI is 0, which means that the block has no POI data temporarily and is generally an area to be developed, then it is identified as a strategic reserved block.
2.3.4 Thermal landscape footprint characterization model
The actual impact area in the high temperature urban areas covered by construction land often exceeds its physical coverage boundary. The concept of urban heat island effect footprint was first proposed by Zhou et al. (2015). It was defined as a continuous distribution area with significant urban heat island effect on a gradient from urban built-up areas to rural or suburban areas. By developing an urban thermal landscape footprint characterization model, this paper investigates the impact range of thermal landscape footprint of different types of urban functional blocks. The multi-ring buffer zone (ring spacing is 500m and the number of rings is 10) was established based on various types of urban functional blocks obtained from OSM road network and POI data, and the gradient change characteristics of thermal landscape on various types of blocks were quantitatively analyzed. The calculation formula is as follows:
Where ΔTi is the difference of thermal field averages between the ith ring buffer of the urban functional block and the whole study area; Tik is the kth pixel thermal landscape level of the ith ring buffer of the urban functional block; N is the total number of pixels in the ith ring buffer; Tak is the kth pixel thermal landscape level in the study area; M is the total number of pixels in the study area. ΔTi can reflect the impact range of the thermal landscape footprint of the urban functional block; when ΔTi>0, the average value of the thermal field within the buffer area i is larger than the average value of the whole area, then the buffer area belongs to the impact range of the thermal landscape footprint of the urban functional block; when ΔTi<0, it is considered that the thermal landscape footprint of the urban functional block cannot affect this area.
2.4 Study framework
This article takes the main urban area of Xi’an as the research area, uses OSM road network data to divide the minimum urban land use units, constructs 7 types of urban functional blocks based on POI data of interest points, and establishes a thermal landscape footprint characterization model to study the impact range of thermal landscape footprints of various functional blocks, and finally quantitatively evaluates the spatial differentiation characteristics of urban thermal landscape. The overall research framework of this study is shown in Figure 3.
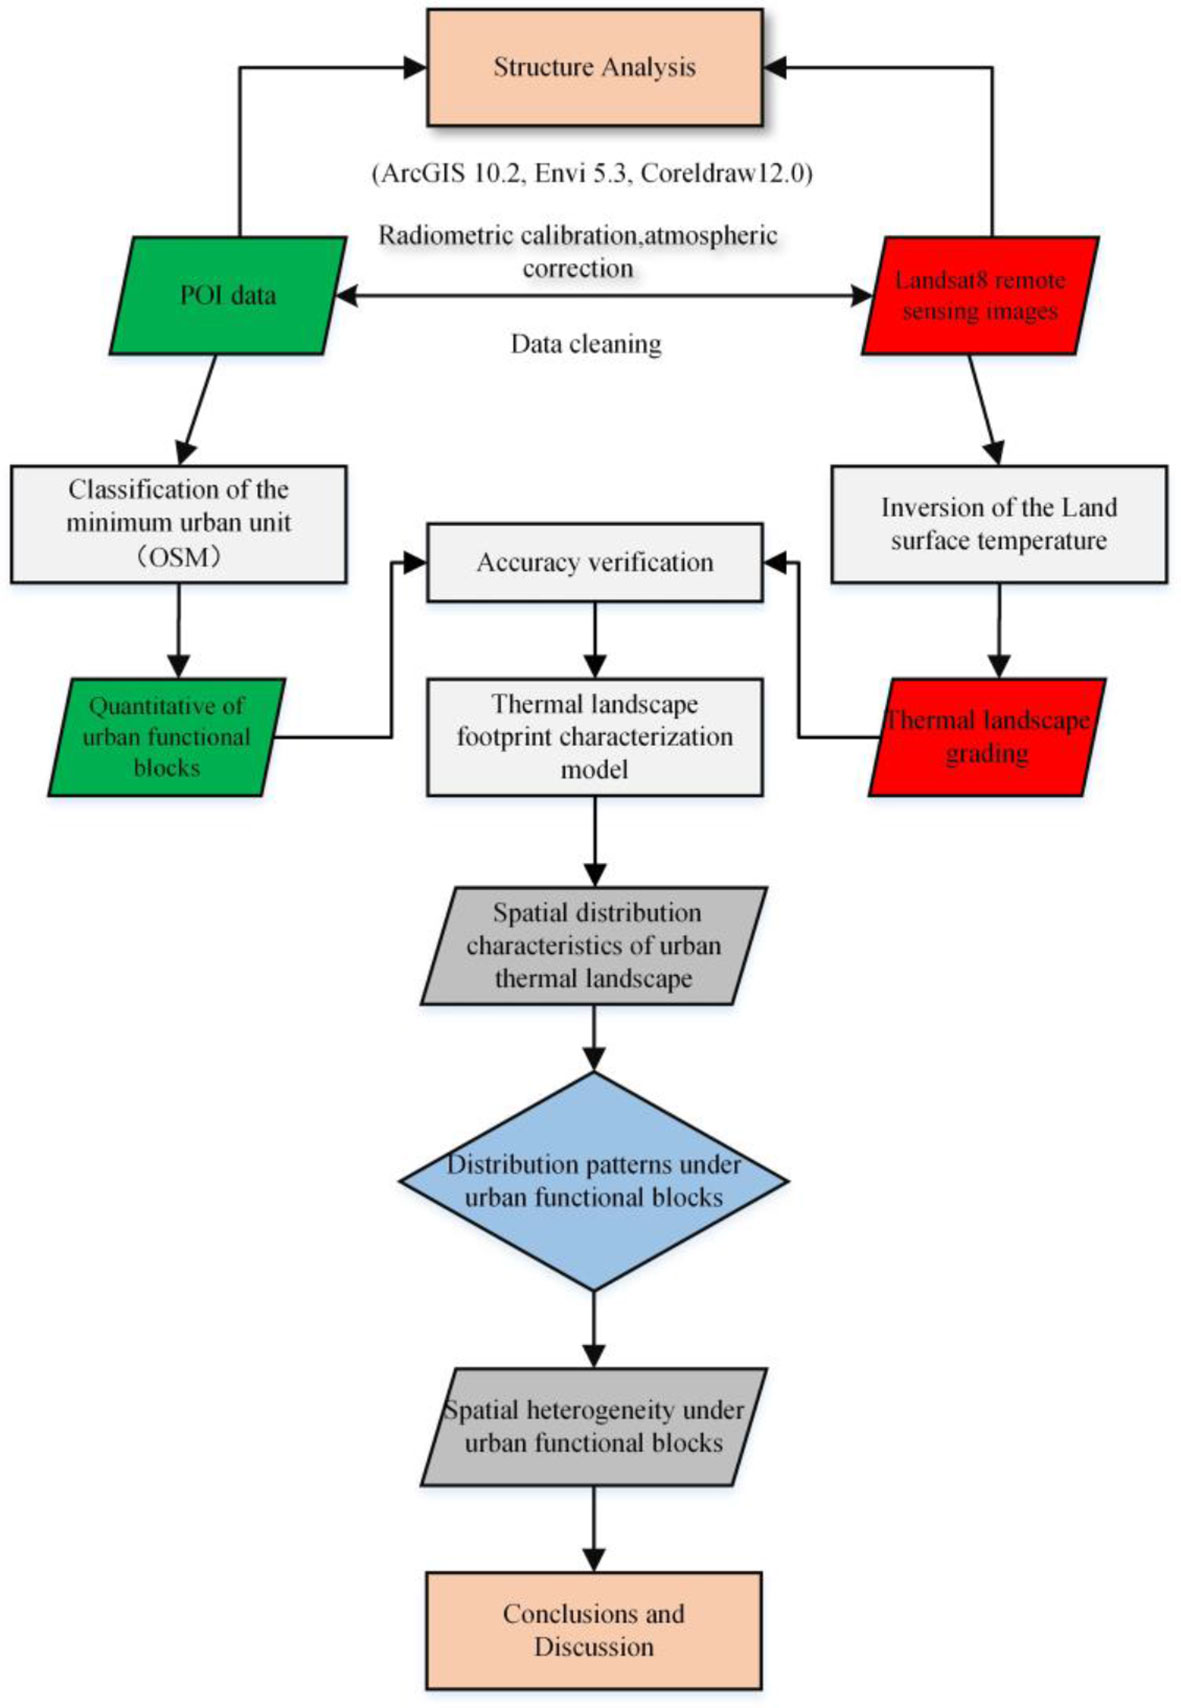
Figure 3 Research framework diagram.
3 Spatial distribution characteristics of urban thermal landscape
The surface temperature of the study area on May 30, 2021 was obtained in this study based on Landsat imagery data with the inversion of the above-mentioned mono-window algorithm developed by Qin Zhihao. The blue area in the figure indicates the area with lower surface temperature, and the gradual change from blue to red indicates the progressive increase of surface temperature, as shown in Figure 4. According to the inversion results, the average surface temperature in the study area was 38.93°C, with the lowest being 23.34°C and the highest being 55.19°C. After statistics, the average difference between the land surface temperature retrieved based on Landsat and the land surface temperature of MODIS products is 0.16°C, which indicates that the land surface temperature retrieved by Landsat has a high accuracy and is suitable for the study of urban thermal landscape. Simultaneously, the mean-standard deviation method was used to classify the thermal landscape grades, as shown in Figure 5A. Since water bodies, woodlands, and others can cover the influence of construction land on the surface temperature (Zhu et al., 2017), it is necessary to remove the woodlands and water bodies and other pixels when calculating and analyzing the thermal landscape footprint, as shown in Figure 5B.
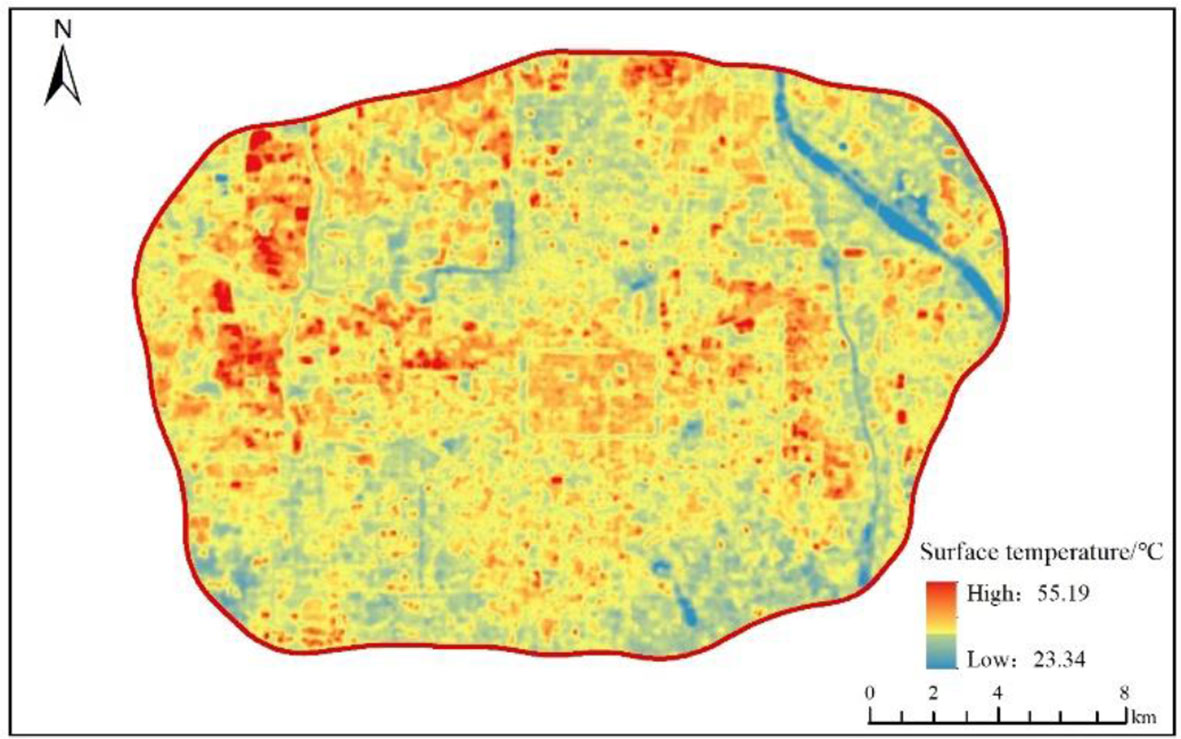
Figure 4 Surface temperature inversion results.
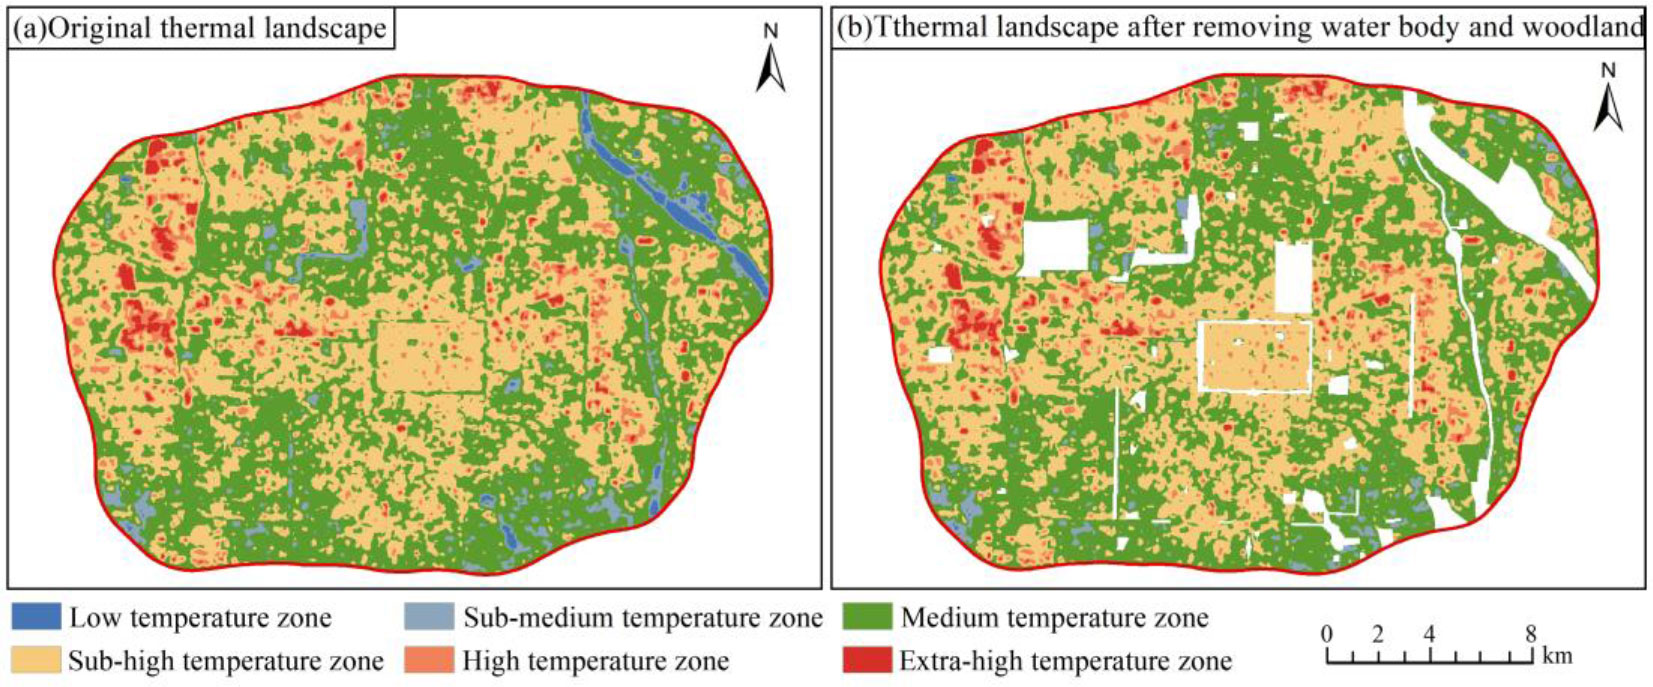
Figure 5 The spatial distribution of the thermal environment landscape. (A) Original thermal landscape. (B) Thermal landscape after removing water body and woodland.
Among the six types of thermal landscapes, the sub-high temperature zone, high temperature zone and extra-high temperature zone are the dominant factors in the urban heat island, and these three types of thermal landscapes jointly constitute the “urban heat island landscape”. As can be observed from Figure 5B, a large number of low and sub-medium temperature zones in the original thermal landscape are found near water bodies (Ba River, Chan River, Hancheng Lake, etc.) and green land parks (Tang Paradise, Qujiang Pool Relic Park, Xi’an Botanical Garden, etc.). The “urban heat island landscape” is formed in the center of the city, in particular, the industrial and logistic parks in the western and northern suburbs of the city gather a large number of pixels from extra-high temperature zones. After eliminating the pixels of water bodies, woodlands and grasslands, the spatial distribution characteristics of the thermal landscape changed significantly. Statistics of the thermal landscape pixels before and after elimination (Table 3) indicated that the number of pixels in the low and sub-medium temperature zones decreased significantly, the urban heat island landscape pixels changed slightly, and the percentage of high temperature pixels all increased. After the quantitative statistics of the mean value of thermal landscape pixels, it was found that the mean value of the original thermal landscape pixels was 3.50, and the mean value of the thermal landscape pixels after eliminating water bodies and woodlands was 3.58. Consequently, water bodies, woodlands and other surfaces have a certain covering effect on the urban thermal landscape, and the elimination of these pixels can make the subsequent study more precise.
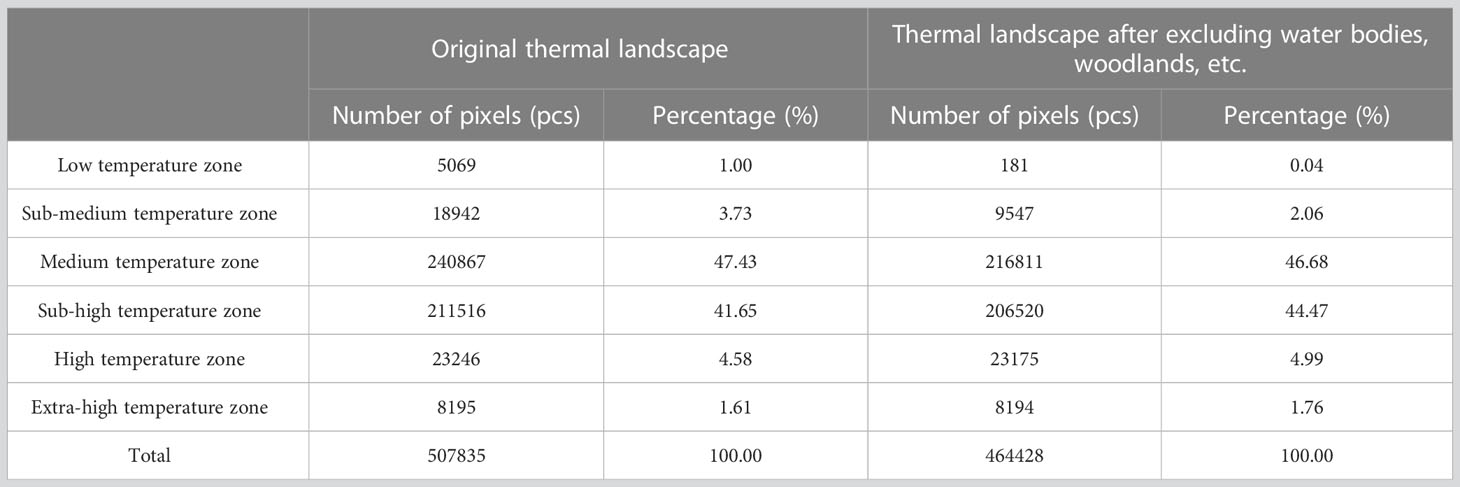
Table 3 The grade classification of urban thermal landscape.
4 Spatial distribution characteristics of urban thermal landscape
4.1 Distribution characteristics of urban functional blocks
This paper divided different types of functional blocks in the study area based on OSM road network and POI data, and compare the identification results of urban functional blocks with the planning map of the “Xi’an Overall Plan (2008–2020)”, indicating a high overall consistency as shown in Figure 6. This paper divided different types of functional blocks in the study area based on OSM road network and POI data, as shown in Figure 6. Among the seven types of functional blocks, the relationship of area share is residential and living blocks (59.78%) > comprehensive service blocks (16%) > strategic reserved blocks (12.44%) > industrial development blocks (6.20%) > commercial and business blocks (3.35%) > logistics and storage blocks (1.42%) > transportation hub blocks (0.82%). Among them, the residential and living blocks have a wide coverage and are densely distributed, and are the major functional blocks of the study area; the comprehensive service blocks mainly provide supporting services to the residential and living blocks, and thus form a spatial pattern of continuous distribution in the center and small blocks with multiple cores near the residential and living blocks; as the Hi-tech Industries Development Zone is the economic and industrial center of Xi’an, it is also a gathering place for commercial and administrative enterprises, and thus the commercial and business blocks present a spatial pattern with the Hi-tech Industries Development Zone as the core and other areas as the scattered distribution; the industrial development blocks, logistics and storage blocks as well as the strategic reserved blocks have similar distribution characteristics and are far away from the densely populated areas of the downtown, mainly distributed in the relatively less densely populated areas around the Ring Expressway, with more distribution in Weiyang District and the western part of Yanta District.
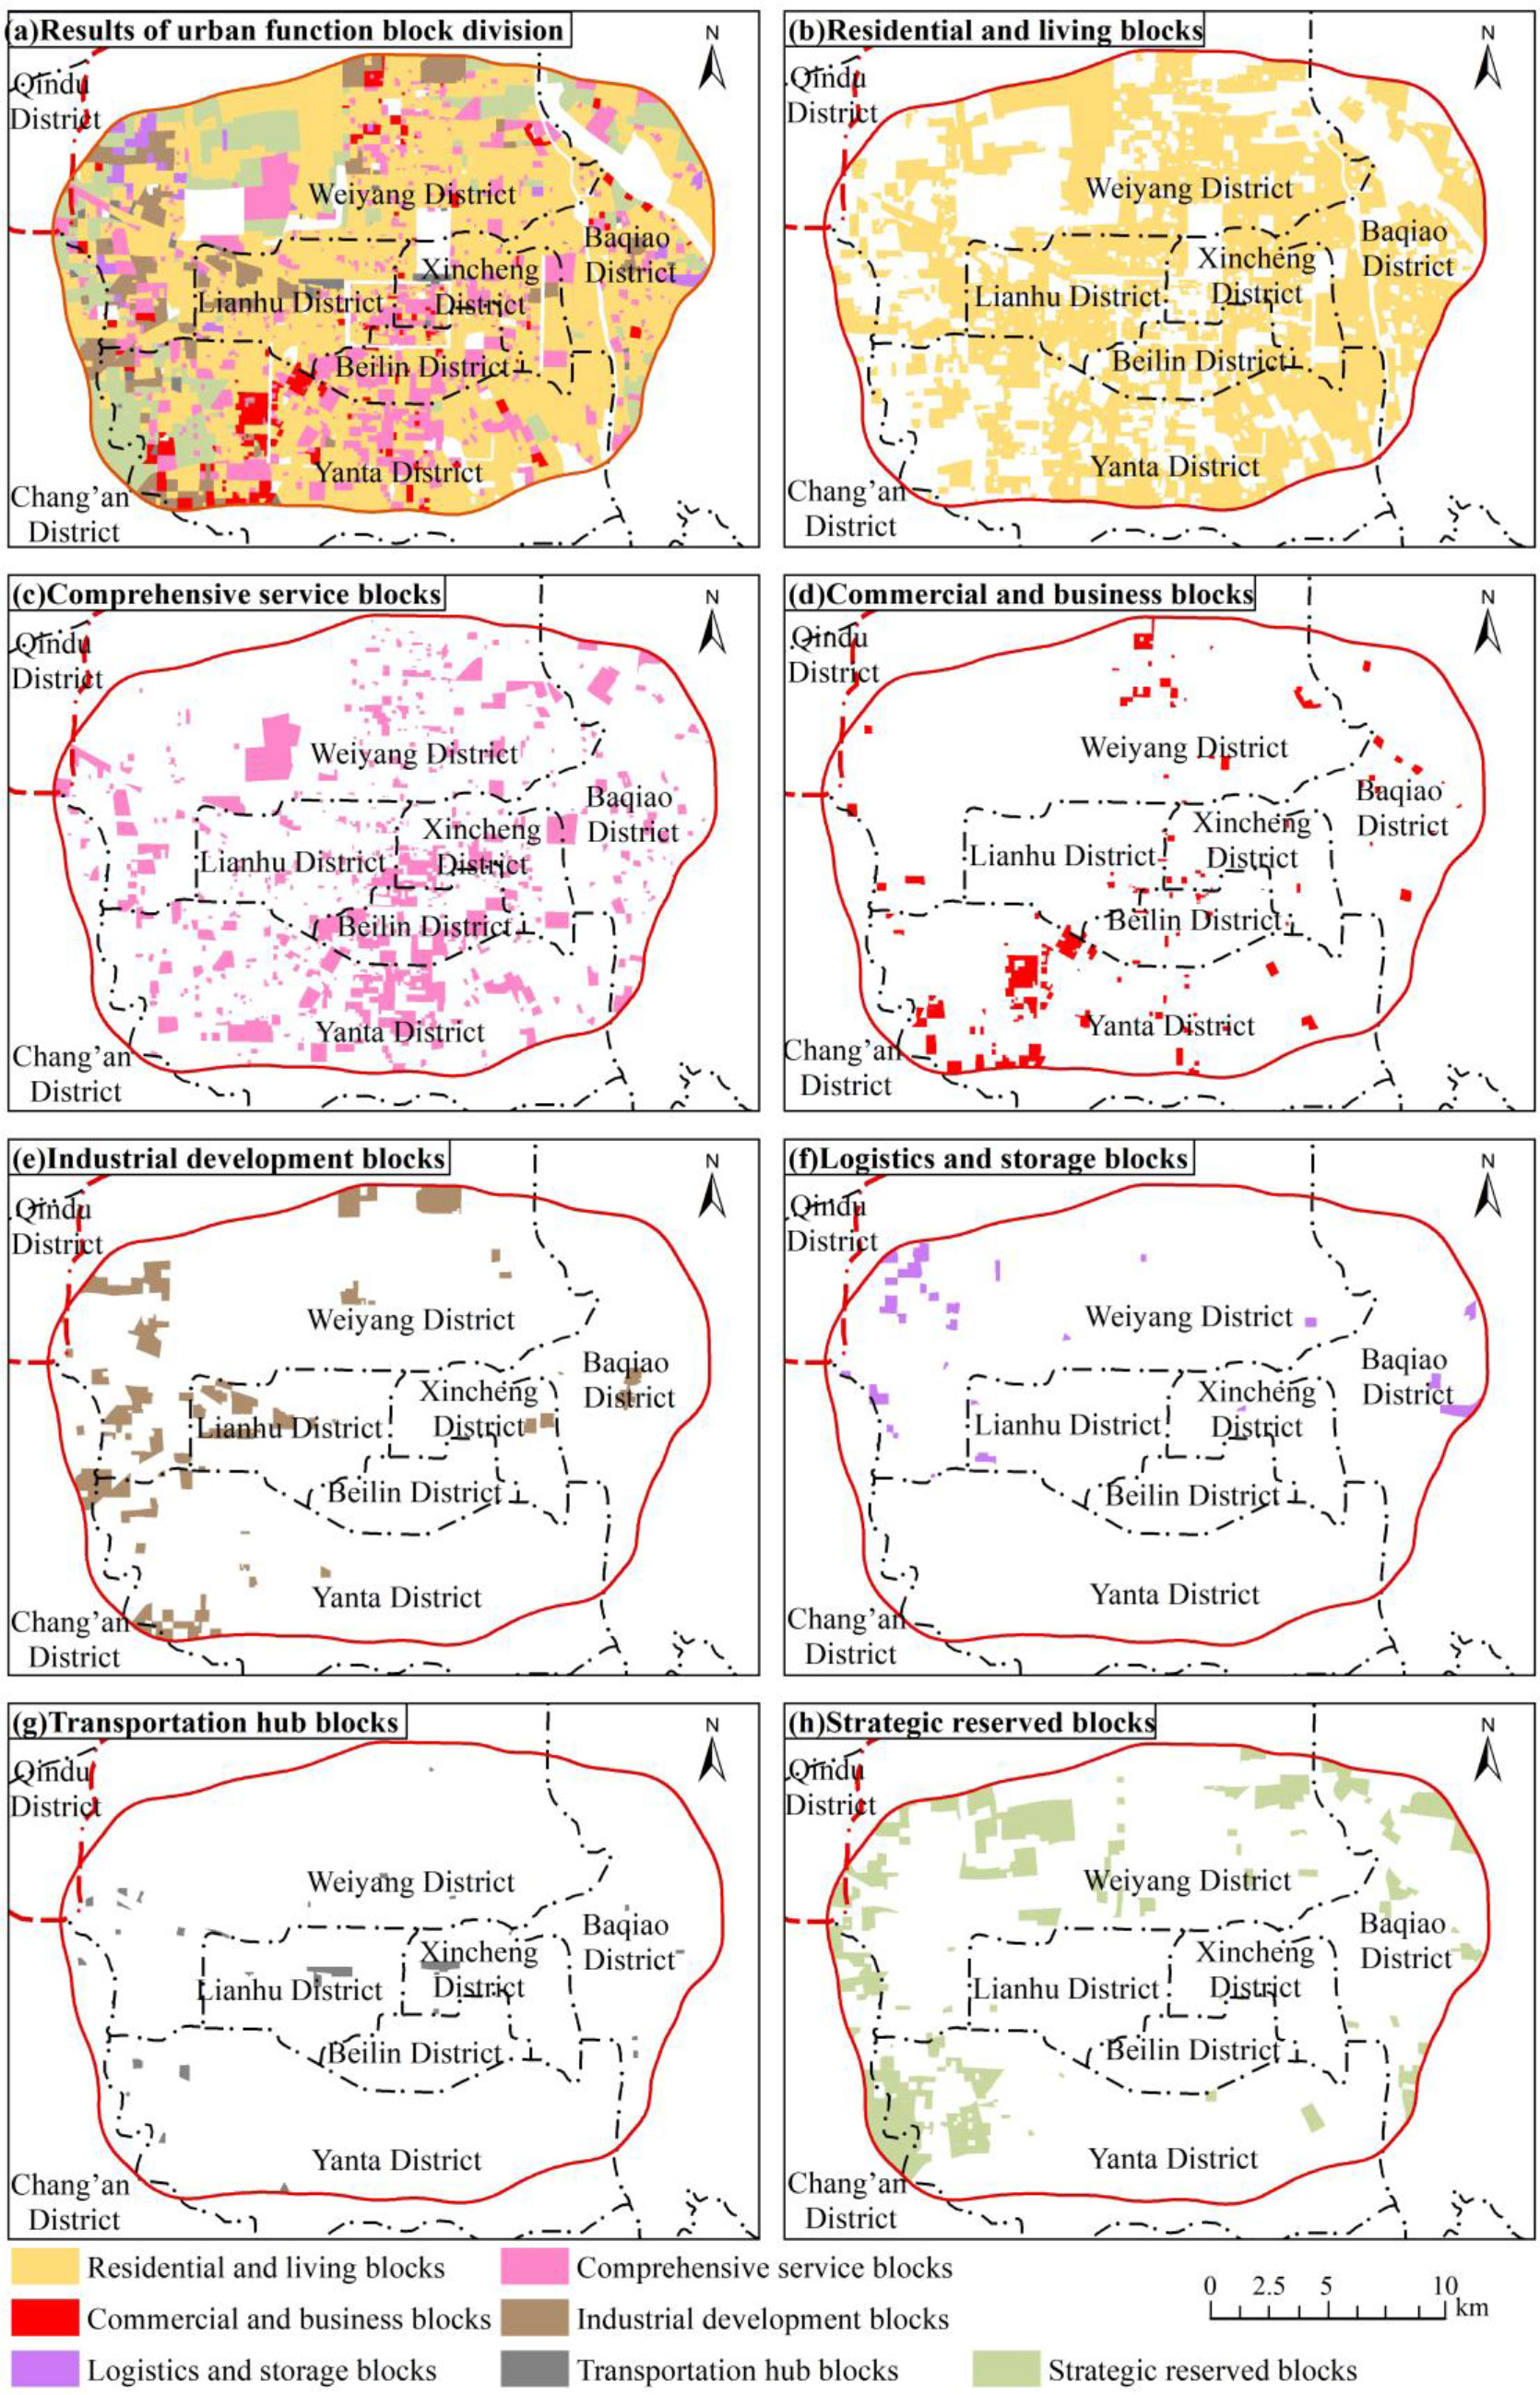
Figure 6 The spatial distribution of urban functional blocks. (A) Results of urban function block division. (B) Residential and living blocks. (C) Comprehensive service blocks. (D) Commercial and business blocks. (E) Industrial development blocks. (F) Logistics and storage blocks. (G) Transportation hub blocks. (H) Strategic reserved blocks.
4.2 Spatial pattern characteristics of thermal landscape in different urban functional blocks
This paper categorized and obtained the distribution pattern of thermal landscape under various types of urban functional blocks based on the data of urban thermal landscape and functional blocks, and counted the thermal landscape grade data under various types of urban functional blocks. As shown in Table 4, the average values of surface thermal landscape of different types of urban functional blocks are significantly different, and the relationship of their sizes is logistics and storage blocks (4.19) > industrial development blocks (4.15) > transportation hub blocks (3.73) > comprehensive service blocks (3.69) > residential and living blocks (3.53) > commercial and business blocks (3.48) > strategic reserved blocks (3.33). The surface thermal landscape within the seven types of urban functional blocks is dominated by the medium temperature and sub-high temperature zone pixels, and the distribution of thermal landscape pixels in the low temperature zone is not significant. Among them, the percentage distribution of surface thermal landscape grade in residential and living blocks, commercial and business blocks, and strategic reserved blocks is relatively similar, and the percentage of urban heat island landscape pixels all exceed 50% and the percentage of medium temperature zone pixels is higher. This can be attributed to the fact that most of the residential communities are internally covered with landscaping (the national standard is not less than 30%), while the strategic reserved blocks are basically undeveloped bare land or grassland, so the ground cover as green land provides a certain degree of cooling effect to the city. Industrial development blocks, logistics and storage blocks and transportation hub blocks are covered by more high temperature pixels, and industrial production activities with high energy consumption and high emission are the dominant activities inside the industrial estates, whose daily production of exhaust gas and wastewater have a greater impact on the urban thermal environment. At the same time, as the most significant and basic activity in logistics, a large number of logistics vehicles in transportation emit greenhouse gases, including carbon dioxide. For this reason, the high temperature phenomenon on the surface of the logistics and storage blocks is more remarkable. Inside the transportation hub blocks are the railway station, high-speed railway station and long-distance bus station, which are responsible for the external transportation of the city, and the daily flow of people is large and crowded, so the heat generation is also relatively high.
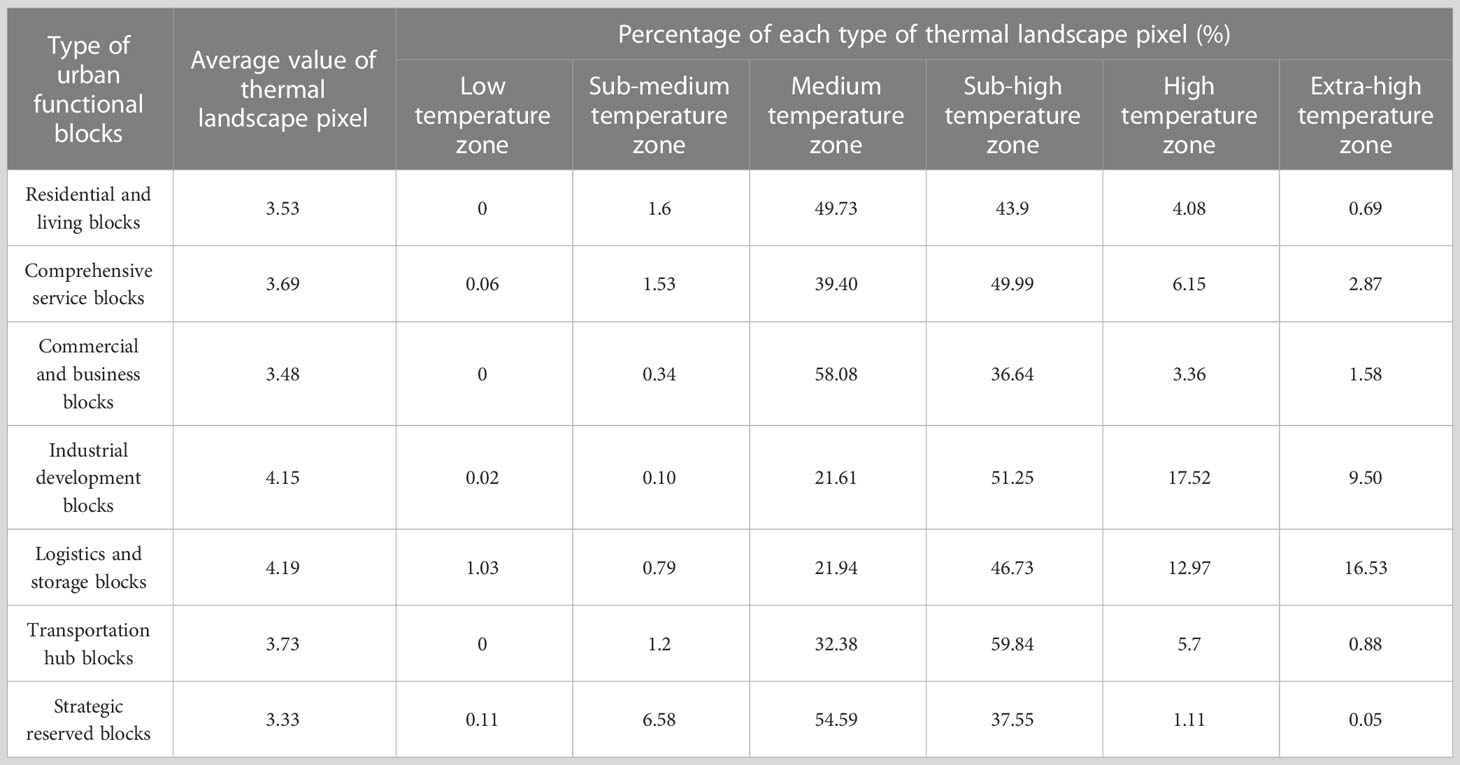
Table 4 The grade classification of Urban thermal landscape.
As shown in Figure 7, in terms of spatial pattern distribution, the residential and living blocks, the comprehensive service blocks and the commercial and business blocks form a more significant heat island landscape pattern, basically presenting a distribution pattern of high temperature in the center and gradually lower in the periphery. The high temperature pixels of the industrial development blocks and the logistics and storage blocks are in the area around the Ring Expressway, which coincides with the distribution pattern of industrial POI within their functional blocks. The thermal landscape pixels at all grades in the transportation hub blocks and the strategic reserved blocks are relatively well distributed, with no significant differences in spatial structure.
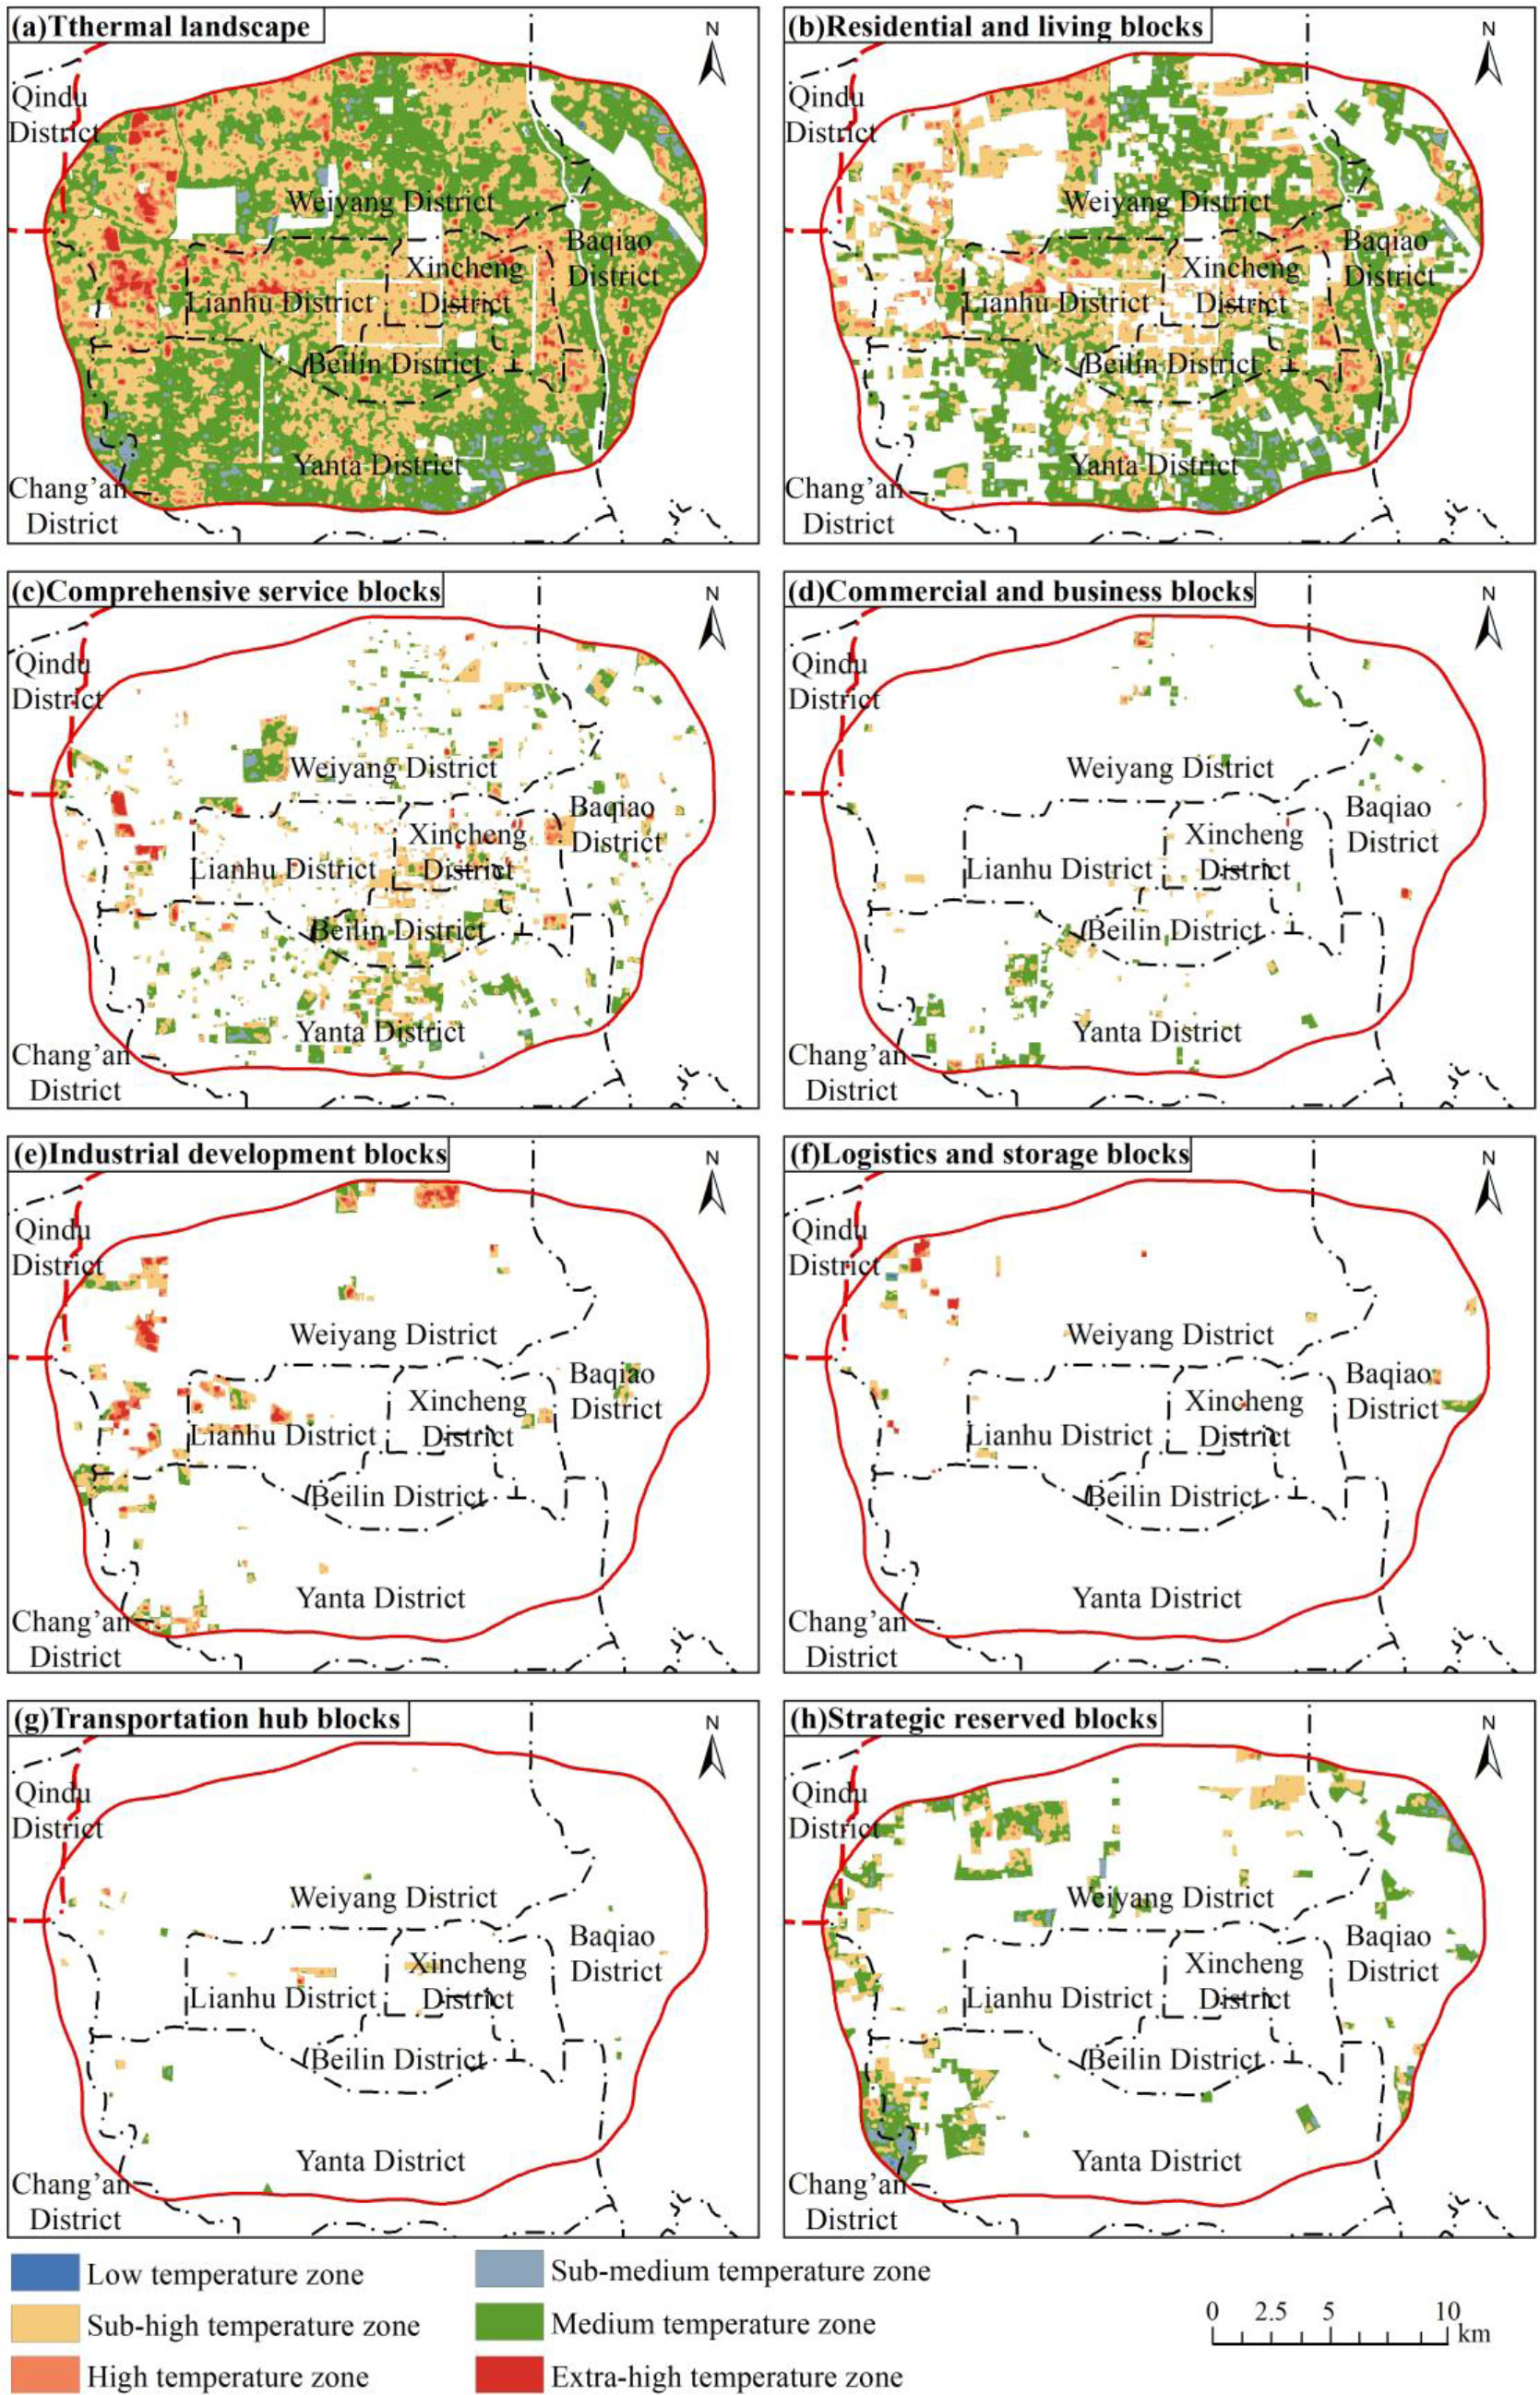
Figure 7 The spatial distribution of thermal landscape of various urban functional blocks. (A) Results of urban function block division. (B) Residential and living blocks. (C) Comprehensive service blocks. (D) Commercial and business blocks. (E) Industrial development blocks. (F) Logistics and storage blocks. (G) Transportation hub blocks. (H) Strategic reserved blocks.
5 Characteristics of thermal landscape footprint variability under urban functional blocks
The actual impact range of the high temperature area on the surface of urban construction land is generally larger than its physical boundary, where thermal diffusion phenomenon exists. This paper generated a multi-ring buffer zone of 300–3000m (with a spacing of 300m and a total of 10 rings) with seven types of urban functional blocks as the core, constructed a thermal landscape footprint characterization model, and explored the variability characteristics of the surface thermal landscape footprint of various types of urban functional blocks. The mean value of surface thermal field under each ring buffer was statistically calculated for each urban functional block, and its changing trend was analyzed as shown in Table 5 and Figure 8.
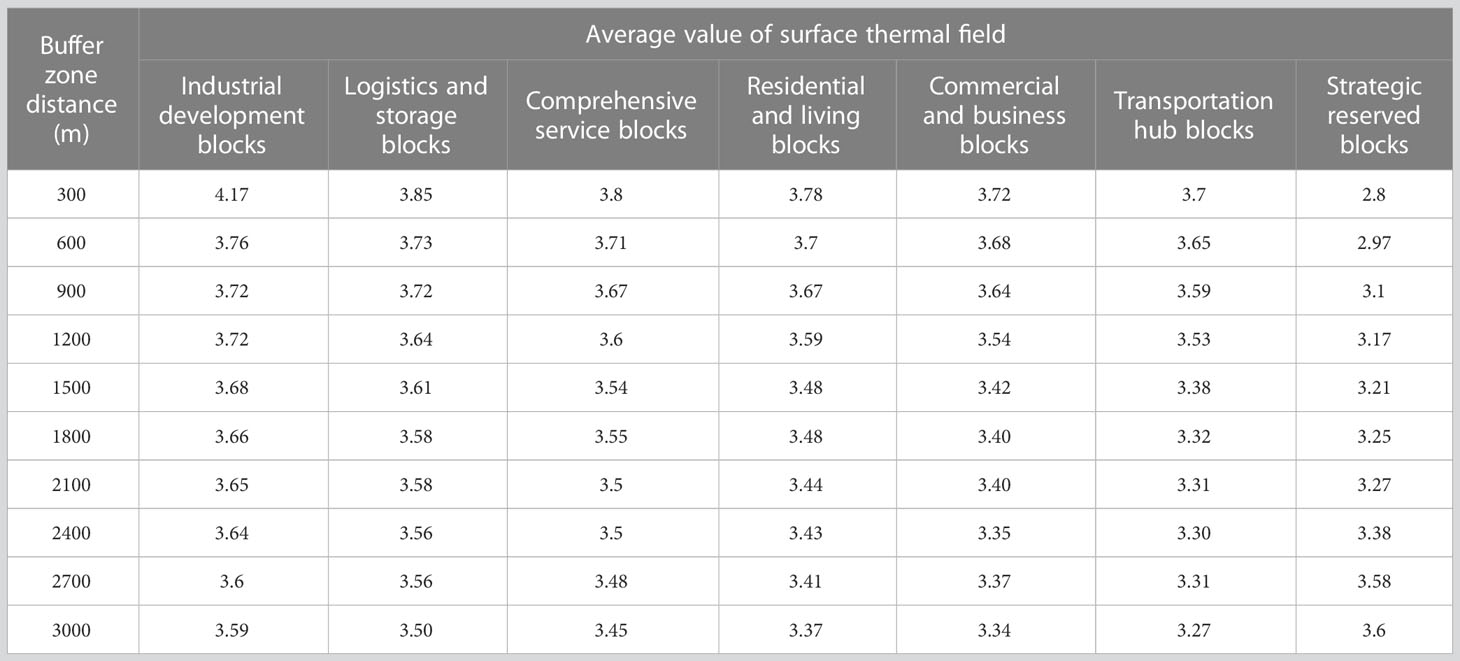
Table 5 The statistical table of the average value of surface thermal field under the buffer zone of urban functional blocks.
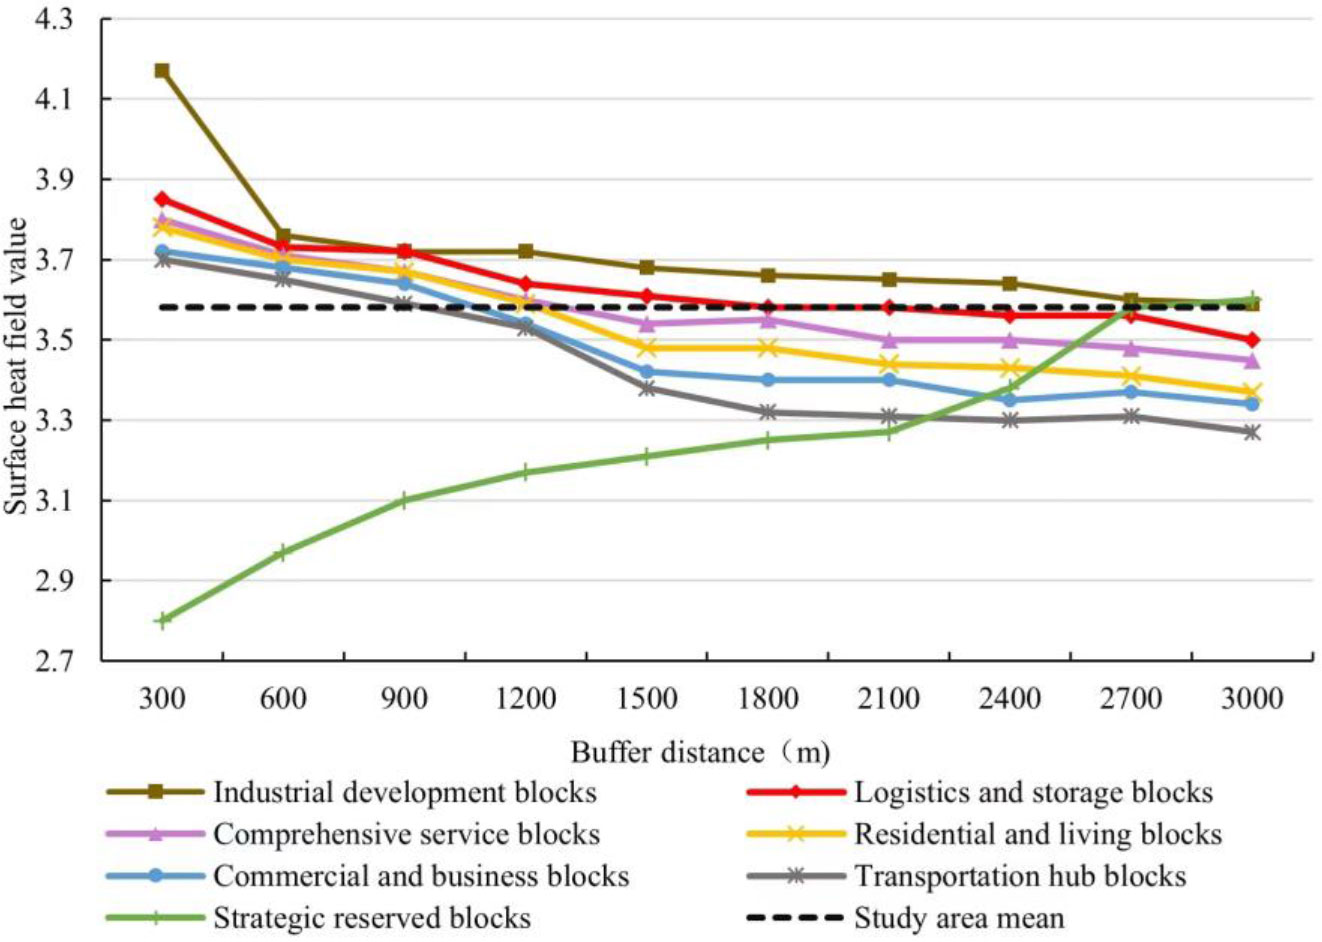
Figure 8 The variation trend of the mean value of surface thermal field with buffer distance.
As the distance of the buffer zone increases, the mean value of thermal field in the buffer zone of all urban function blocks, excluding the strategic reserved blocks, tends to decrease progressively, and the decreasing rate is basically from fast to flat. Among them, the mean value of the thermal field of the industrial development block decreases the most in the 2nd ring buffer zone, reaching 0.41, and then the decrease tends to be stable, fluctuating around 0.2, and the overall decrease of the mean value of the thermal field reaches 0.58, which is much higher than that of other urban functional blocks; under the logistics and storage blocks as well as the comprehensive service blocks, the decreasing rate of the mean thermal field of the buffer zone reaches the peak in the 4th ring buffer zone and decreases significantly, after which it gradually stabilizes; the decreasing rate of the mean value of the thermal field in the buffer zone of the residential and living blocks, the commercial and business blocks and the transportation hub blocks reaches the highest in the 5th ring buffer zone. The mean value of thermal field in the buffer zone of the strategic reserved blocks tends to increase due to the relatively low temperature of its internal thermal field, and basically shows a fast and then steady growth trend. The above quantitative analysis reveals that the surface thermal landscape within the seven types of urban functional blocks can have significant impacts on the surrounding areas, yet their impact range varies and the thermal landscape footprint has obvious heterogeneity. When comparing the mean value of thermal field in the 10th ring buffer zone of six types of urban functional blocks (except the strategic reserved blocks), it is indicated that the industrial development blocks have the largest mean value of thermal field, which means that their thermal landscape footprint may have the widest impact.
The mean value of the thermal field in the study area is 3.58. It is determined that when the mean value of the thermal field in the buffer zone is greater than that in the study area, the buffer zone is still within the impact range of the thermal landscape of the urban functional blocks at that time. The mean value of the thermal field in the buffer zone of the industrial development blocks is always higher than the mean value of the thermal field in the study area, as shown in Figure 8, indicating that its thermal landscape footprint has a wider impact and the thermal diffusion to the outside is obvious. Both the residential and living blocks and the comprehensive service blocks have a mean value of thermal field larger than 3.58 in the 4th ring buffer zone, and the mean value of thermal field of the comprehensive service blocks is slightly larger than that of the residential and living blocks, so the impact range of the thermal landscape footprint of the comprehensive service blocks is slightly larger than that of the residential and living blocks; the thermal landscape footprint of the logistics and storage blocks is impacted up to the 5th ring buffer zone, second only to the industrial development blocks; in the 3rd ring buffer zone of the commercial and business blocks and the transportation hub blocks, the mean value of their thermal fields is larger than that of the study area, and the impact range of the thermal landscape footprint of the transportation hub blocks is smaller, with less obvious effect of thermal diffusion outward. Based on the above quantitative analysis, the impact range of thermal landscape footprint of six types of urban functional blocks (except strategic reserved blocks) is ranked as industrial development blocks > logistics and storage blocks > comprehensive service blocks > residential and living blocks > commercial and business blocks > transportation hub blocks.
6 Conclusion and discussion
6.1 Conclusion
This paper inverts the urban surface temperature based on Landsat 8 remote sensing imagery, and uses OpenStreetMap (OSM) road network data to divide the minimum urban land unit, and constructs seven types of urban functional blocks based on POI data using the kernel density analysis method. Meanwhile, this paper also establishes the thermal landscape footprint characterization model to study the impact range of thermal landscape footprint of various types of functional blocks and quantitatively evaluates the spatial variation characteristics of urban thermal landscape. The following conclusions are mainly drawn from this study:
(1)The spatial distribution of urban functional blocks identified based on POI data presents a high coupling with the POI kernel density, and the area share of seven types of urban functional blocks in the study area is ranked as residential and living blocks > comprehensive service blocks > strategic reserved blocks > industrial development blocks > commercial and business blocks > logistics and storage blocks > transportation hub blocks.
(2)The surface thermal landscape of the seven types of urban functional blocks is dominated by the pixels of medium and sub-high temperature zones, while the distribution of thermal landscape pixels of low temperature zones is not significant. The mean values of surface thermal landscape of different types of urban functional blocks are significantly dissimilar, and the relationship among their sizes is logistics and storage blocks > industrial development blocks > transportation hub blocks > comprehensive service blocks > residential and living blocks > commercial and business blocks > strategic reserved blocks.
(3)Apart from the strategic reserved blocks, the surface thermal landscape within the other six types of urban functional blocks can produce thermal diffusion to the surrounding areas, yet the impact range varies and the thermal landscape footprint has obvious heterogeneity. The impact range of the thermal landscape footprint is ranked as industrial development blocks > logistics and storage blocks > comprehensive service blocks > residential and living blocks > commercial and business blocks > transportation hub blocks.
6.2 Discussion
This paper integrates OpenStreetMap (OSM) and POI data to divide urban functional blocks, which breaks through the limitation of traditional land classification using remote sensing imagery, constructs a thermal landscape footprint characterization model, and achieves a fine quantitative analysis of the surface thermal environment affected by different construction lands.
As the political and cultural center of Shaanxi Province, as well as the core area of the “the Belt and Road” and the heart of the Eurasian Continental Bridge Economic Belt, Xi’an’s rapid urbanization has not only provided rapid GDP growth, but also caused a series of environmental problems. Therefore, in this context, this paper explores the impact mechanism and spatial pattern of urban spatial structure on urban thermal environment from a small scale, which is of great significance for scientific guidance of urban planning and construction, mitigation of Urban heat island effect, and promotion of sustainable urban development. At the same time, it provides scientific reference for the planning and management of urbanization development in other regions of Shaanxi Province with Xi’an as the center.
The innovation of this article mainly lies in the accurate division of urban functional blocks by combining OSM road network data and POI data. Based on this, constructing a thermal landscape footprint characterization model to explore the spatial differentiation characteristics of urban thermal landscape is more refined, which can quantify the spatial pattern of urban thermal environment from a smaller scale, providing more accurate support for related research in this field. Furthermore, this paper reveals that the thermal environmental effects of different subtypes of construction lands have obvious differences, as manifested in the mean value of thermal landscape, grade distribution and the impact range of thermal landscape footprint significantly varied within different types of urban functional blocks. The impact range of the thermal landscape footprint of industrial development blocks and logistics and storage blocks is relatively wide, which is mainly related to their high energy-consuming and high-emission production activities, and the heat emission is obvious and concentrated in the surrounding area, making the local surface thermal environment change to form the heat island effect. The surface heat comes not only from industrial energy emissions, but also from anthropogenic heat emissions from residential life and human’s own metabolism, and it is greatly influenced by population density and intensity of human activities, hence the surface thermal environment of residential and living blocks and comprehensive service blocks, which are closely related to human life, changes significantly.
Although this paper has a certain degree of scientific and innovative study on the surface thermal landscape effect of different types of construction lands at the microscopic scale, some issues still exist for further consideration and improvement due to the complex formation mechanism and influencing factors of urban heat island effect. With the development of network technology, the POI database is still in the process of continuous expansion, and the data accuracy and information richness are also upgraded accordingly, and the rich information in POI data of users still needs to be further explored. For instance, the impact of human activities on the surface thermal field cannot be reflected in some remote mountainous areas due to the lack of POI data. Therefore, it is necessary to further enrich the POI data and to consider adding other factors to improve the validity of the model for thermal landscape analysis. Meanwhile, the surface thermal field has the characteristics of dynamic changes of day–night and seasonal, and has periodic changes even on both weekdays and non-weekdays. In the subsequent work, the study of spatial variability of urban thermal landscape under different time scales should be deepened.
Data availability statement
The original contributions presented in the study are included in the article/supplementary material. Further inquiries can be directed to the corresponding author.
Author contributions
JW is responsible for the original idea. JW performed the experiments and wrote the paper. LS and QH contributed to analysis of the data. SH contributed to revising the paper. All authors contributed to the article and approved the submitted version.
Funding
This study is funded by the Xianyang Normal University Research Initiation Fund (2022XSYB031).
Acknowledgments
The authors are grateful to the editor and reviewers for spending their valuable time on constructive comments and suggestions that improved the quality of the manuscript considerably.
Conflict of interest
Author QH was employed by the company Shaanxi Dibo Jingyuan Surveying and Mapping Geographic Information Co., Ltd.
The remaining authors declare that the research was conducted in the absence of any commercial or financial relationships that could be construed as a potential conflict of interest.
Publisher’s note
All claims expressed in this article are solely those of the authors and do not necessarily represent those of their affiliated organizations, or those of the publisher, the editors and the reviewers. Any product that may be evaluated in this article, or claim that may be made by its manufacturer, is not guaranteed or endorsed by the publisher.
References
Chen L., Sun R., Liu H. (2013). Eco-environmental effects of urban landscape pattern changes: progresses, problems, and perspectives. Acta Ecologica Sin. 33 (4), 1042–1050. doi: 10.5846/stxb201205070659
Chen X., Zhang Z. A., Hu X., Huang Z., Lv L. (2018). Characteristics of tourists flow in scenic spots based on Weibo Check-in big data: A case study of zhongshan scenic spot in Nanjing city. Economic Geogr. 2018 (9), 206–214. doi: 10.15957/j.cnki.jjdl.2018.09.024
Elgammal A., Duraiswami R., Harwood D., Davis L. S. (2002). Background and foreground modeling using nonparametric kernel density estimation for visual surveillance. Proc. IEEE 90 (7), 1151–1163. doi: 10.1109/JPROC.2002.801448
Estoque R. C., Murayama Y., Myint S. W. (2017). Effects of landscape composition and pattern on land surface temperature: An urban heat island study in the megacities of Southeast Asia. Sci. Total Environ. 577, 349–359. doi: 10.1016/j.scitotenv.2016.10.195
Giorgio G. A., Ragosta M., Telesca V. (2017). Climate variability and industrial-suburban heat environment in a Mediterranean area. Sustainability 9 (5), 775. doi: 10.3390/su9050775
Guo A., Yang J., Sun W., Xiao X., Cecilia J. X., Jin C., et al. (2020). Impact of urban morphology and landscape characteristics on spatiotemporal heterogeneity of land surface temperature. Sustain. Cities Soc. 63, 102443. doi: 10.1016/j.scs.2020.102443
Han S., Wei S., Zhou W., Zhang M., Tao T., Qiu L., et al. (2017). Quantifying the spatial pattern of urban thermal fields based on point of interest data and Landsat images. Acta Ecologica Sin. 37 (16), 5305–5312. doi: 10.5846/stxb201605301037
He L., Pan J., Dong L. (2020). Study on the spatial identification of housing vacancy. Remote Sens. Technol. Appl. 35 (4), 820–831.
Huang X., Song T., Wang B., Zheng D., Qi M. (2022). Study on the influence of land use evolution of scale, structure and pattern on urban thermal environment: A case study of Xi’an. Scientia Geographica Sin. 42 (5), 926–937. doi: 10.13249/j.cnki.sgs.2022.05.018
Li J., Qi X., Yuan W. (2022). Spatial differentiation of multi-functional mixed use of construction land based on points of interest. Prog. Geopraphy 41 (2), 239–250. doi: 10.18306/dlkxjz.2022.02.005
Li Y., Zhang H., Kainz W. (2012). Monitoring patterns of urban heat islands of the fast-growing Shanghai metropolis, China: Using time-series of Landsat TM/ETM+ data. Int. J. Appl. Earth Observations Geoinformation 19, 127–138. doi: 10.1016/j.jag.2012.05.001
Liu H., Shen G., Huang Q. (2017). Evolution of urban heat island effect and its relationship with land use change in Wuhan in recent 10 years. Resour. Environ. Yangtze Basin 26 (9), 1466–1475. doi: 10.11870/cjlyzyyhj201709019
Manley G. (1958). On the frequency of snowfall in metropolitan England. Q. J. R. Meteorological Soc. 84 (359), 70–72. doi: 10.1002/qj.49708435910
Orlanski I. (1975). A rational subdivision of scales for atmospheric processes. Bull. Am. Meteorological Societ, 527–530. doi: 10.1234/12345678
Qiao Z., He T., Lu Y., Sun Z., Hu X., Yang J. (2022). Quantifying the contribution of land use change based on the effects of global climate change and human activities on urban thermal environment in the Beijing-Tianjin-Hebei urban agglomeration. Geographical Res. 41 (7), 1932–1947. doi: 10.11821/dlyj020210787
Qiao Z., Huang N.-Y., Xu X., Sun Z., Wu C., Yang J. (2019). Spatio-temporal pattern and evolution of the urban thermal landscape in metropolitan Beijing between 2003 and 2017. Acta Geographica Sin. 74 (3), 475–489. doi: 10.11821/dlxb201903006
Qin Z.-H., Zhang M.-H., Karnieli A., Berliner P. (2001). Mono-window algorithm for retrieving land surface temperature from Landsat TM6 data. Acta Geographica Sin. 56 (4), 456–466. doi: 10.1142/S0252959901000401
Rossi F., Pisello A. L., Nicolini A., Filipponi M., Palombo M. (2014). Analysis of retro-reflective surfaces for urban heat island mitigation: A new analytical model. Appl. Energy 114, 621–631. doi: 10.1016/j.apenergy.2013.10.038
Singh P., Kikon N., Verma P. J. S. C. (2017). Impact of land use change and urbanization on urban heat island in Lucknow city, Central India. A Remote Sens. based estimate. 32, 100–114. doi: 10.1016/j.scs.2017.02.018
Wan Z., Li Z.-L. (1997). A physics-based algorithm for retrieving land-surface emissivity and temperature from EOS/MODIS data. IEEE Trans. Geosci. Remote Sens. 35 (4), 980–996. doi: 10.1109/36.602541
Wang B., Wang L., Liang Y., Yang B., Huang X., Yang M. (2020). Characteristics of jobs-housing spatial distribution in Beijing based on mobile phone signaling data. Prog. Geogr. 39 (12), 2028–2042. doi: 10.18306/dlkxjz.2020.12.006
Wang J., Ye Y., Fang F. (2019). A study of urban functional zoning based on kernel density dstimation and fusion data. Geogr. Geo-Information Sci. 35 (3), 66–71.
Yang W., Meng F., Li Y., Tang M. (2020). Research on passenger travel characteristics based on OD data analysis of vehicle trajectory. GEOMATICS&SPATIAL Inf. Technol. 43 (1), 144–147,150. doi: 10.3969/j.issn.1672-5867.2020.z1.044
Yao R., Wang L., Huang X., Niu Z., Liu F., Wang Q. (2017). Temporal trends of surface urban heat islands and associated determinants in major Chinese cities. Sci. Total Environ. 609, 742–754. doi: 10.1016/j.scitotenv.2017.07.217
Yi C., Hu J., Li X. (2018). Response analysis of land cover type to urban heat island effect. Bull. Surveying Mapp. 2018 (1), 72–76. doi: 10.13474/j.cnki.11-2246.2018.0013
Yu W., Ai T., Yang M., Liu J. (2016). Detecting”Hot Spots”of facility POIs based in kernel density estimation and spatial autocorrelation technique. Geomatics Inf. Sci. Wuhan Univ. 41 (2), 221–227. doi: 10.13203/j.whugis20140092
Yue W., Xu L. (2013). Thermal environmental effects of typical urban water landscape. Acta Ecologica Sin. 33 (6), 1852–1859. doi: 10.5846/stxb201112141915
Zhang J., Shi W., Xiu C. (2021). Urban research using points of interest data in China. Scientia Geographica Sin. 41 (1), 140–148. doi: 10.13249/j.cnki.sgs.2021.01.015
Zheng Y. (2015). Introduction to urban computing. Geomatics Inf. Sci. Wuhan Univ. 40 (1), 1–13. doi: 10.13203/j.whugis20140718
Zheng Y., Weng Q. (2018). High spatial-and temporal-resolution anthropogenic heat discharge estimation in Los Angeles County, California. J. Environ. Manage. 206, 1274–1286. doi: 10.1016/j.jenvman.2017.07.047
Zhong W., Wang D., Xie D., Yan L. (2017). Dynamic characteristics of Shanghai’s population distribution using cell phone signaling data. Geographical Res. 36 (5), 972–984. doi: 10.11821/dlyj201705013
Zhou D., Zhao S., Zhang L., Sun G., Liu Y. (2015). The footprint of urban heat island effect in China. Sci. Rep. 5 (1), 1–11. doi: 10.1038/srep11160
Zhu X., Wang X., Zhou Y., Wu W., Liu Z. (2017). Spatial variability of thermal environment in Xi’an under the build-up area expansion. Chin. J. Ecol. 36 (12), 3574–3583. doi: 10.13292/j.1000-4890.201712.015
Keywords: POI, OSM, thermal landscape, urban functional blocks, spatial variation
Citation: Wu J, Han S, Shi L and Hui Q (2023) Study on the spatial variability of thermal landscape in Xi’an based on OSM road network and POI data. Front. Ecol. Evol. 11:1187591. doi: 10.3389/fevo.2023.1187591
Received: 16 March 2023; Accepted: 21 July 2023;
Published: 25 August 2023.
Edited by:
Cletah Shoko, University of the Witwatersrand, South AfricaReviewed by:
Aliya Baidourela, Xinjiang Agricultural University, ChinaSheng Hu, Northwest University, China
Copyright © 2023 Wu, Han, Shi and Hui. This is an open-access article distributed under the terms of the Creative Commons Attribution License (CC BY). The use, distribution or reproduction in other forums is permitted, provided the original author(s) and the copyright owner(s) are credited and that the original publication in this journal is cited, in accordance with accepted academic practice. No use, distribution or reproduction is permitted which does not comply with these terms.
*Correspondence: Jiang Wu, ZGJ3dWppYW5nQDEyNi5jb20=