 Weixuan Wei
 Jingyi Cao
 Nan Wang
 Yuhui Qian
94% of researchers rate our articles as excellent or good
Learn more about the work of our research integrity team to safeguard the quality of each article we publish.
Find out more
ORIGINAL RESEARCH article
Front. Ecol. Evol., 15 June 2023
Sec. Interdisciplinary Climate Studies
Volume 11 - 2023 | https://doi.org/10.3389/fevo.2023.1185911
Introduction: The precise detection of vegetation in urban parks is crucial for accurate carbon sink calculations and planting assessments, particularly in high-density cities. Unlike traditional methods designed for forest vegetation, the detection and classification of urban park vegetation face challenges such as unclear boundaries, multiple vegetation categories, low image resolution, labor-intensive manual calculations, and unreliable modeling results. However, by utilizing unmanned aerial vehicles (UAVs) equipped with high-resolution visible and multispectral (MS) remote sensing cameras, it becomes possible to label images with green normalized difference vegetation index (GNDVI) and full-spectral three-channel information.
Methods: By employing a dual attention convolutional neural network (DANet) model that incorporates image fusion, DANet, and feature decoding networks, the high-precision detection of urban park vegetation can be significantly improved.
Results: Empirical validation carried out in Jinhai Park since 2021 has provided evidence of the effectiveness of the DANet model when utilizing early fusion and feature fusion techniques. This model achieves an accurate detection rate of 88.6% for trees, 92.0% for shrubs, 92.6% for ground cover, and 91.8% for overall vegetation. These detection rates surpass those achieved using only visible images (88.7%) or GNDVI images (86.6%).
Discussion: The enhanced performance can be attributed to the intelligent capabilities of the double-in network. This high-precision detection model provides more precise scientific and technical support for subsequent park carbon sink calculations, assessments of existing vegetation for planting designs, and evaluations of urban ecological impacts.
The issue of global climate change caused by increasing carbon emissions has emerged as a significant challenge in the discussion surrounding global resources and ecological environments (IPCC, 2022; Cheng et al., 2023). The sustainable enhancement of carbon sinks has been identified as a crucial solution to address this problem and to limit global greenhouse gas emissions, as outlined in the Kyoto Protocol. Traditionally, efforts to enhance carbon sinks have focused on natural regulation, primarily through the utilization of carbon-rich forests (Liu and Wang, 2010, 2015). However, the substantial carbon reserves present in urban green infrastructure, such as parkland, are often underestimated (Wang et al., 2021).
With continuous urbanization in the post-industrial era, carbon emissions in megacities have been on the rise. The reduction of forested areas in urban land use planning has diminished the overall carbon sink capacity. However, compensating for this reduction through the presence of extensive green plants in public, community, and wilderness parks can play an indispensable role in enhancing carbon sinks. The IPCC (2006) Guidelines for National Greenhouse Gas Inventories and A/R CDM Projects have provided supportive methods for calculating vegetative carbon sinks (IPCC, 2006). These methods categorize urban vegetation based on land use, including perennial herbaceous vegetation (e.g., lawn grass and garden plants), as well as trees found in home courtyards, urban streets, and parkland. However, the evaluation of vegetation canopy coverage, particularly for shrubs and herbaceous vegetation, remains a challenge, and their biomass growth is often ignored. Additionally, the use of default values based on natural forest land parameters can lead to high uncertainty when calculating tree coverage and biomass in urban areas, where data on carbon pool variation is limited. The general uncertainty associated with carbon pool valuation in urban areas is estimated to be 30%–50% higher than the average value (IPCC, 2006). Consequently, there is an urgent need for the development of practices for testing and classifying carbon sinks in urban parks, particularly with regard to high-precision detection of trees, shrubs, and grass coverages (Miao et al., 2022).
Furthermore, accurate detection of urban park vegetation plays a significant role in the sustainable assessment of planting designs and low-carbon engineering practices (Escobedo et al., 2010; Dunea et al., 2021). The precise detection of indicators such as the boundaries, scale, and growth of trees, shrubs, and ground covers is crucial for effective urban parkland management. In recent years, mapping urban vegetation distribution has garnered significant interest due to its connection to various research fields, such as urban climate, quality of life, and Sustainable Development Goals (SDGs; Richards and Belcher, 2019; Biswas et al., 2020; Rumora et al., 2020; Abdollahi and Pradhan, 2021). However, the detection methods for park vegetation differ from traditional forest detection methods, as park vegetation is more diverse, varied, and complex in nature. Existing methods, including field investigation and design drawings, have limitations in evaluating the dynamic growth status of different plants, resulting in less reliable calculations of carbon sinks (Yu et al., 2021). Currently, satellite remote sensing imagery is widely used for vegetation detection in urban areas, supplemented by Light Detection and Ranging (LiDAR) on Unmanned Aerial Vehicles (UAVs) and hyperspectral imagery (Alonzo et al., 2016; Song et al., 2020; Chivasa et al., 2021). However, the use of medium spatial resolution images often leads to mixed pixel problems, making it challenging to effectively separate different vegetation types from other land covers (Myint, 2006; Zhang et al., 2010; Ren et al., 2015; Anchang et al., 2016). Therefore, the application of high spatial resolution images is being considered to reduce the mixed pixel problem (Castillejo-González et al., 2009; Łuców et al., 2021). However, increased spatial resolution can introduce greater internal variability within the same land cover type, leading to decreased classification accuracy (Munechika et al., 1993; Hsieh et al., 2001; Jia and Richards, 2002; Pu et al., 2011; Hirayama et al., 2018). Hence, developing advanced and accurate methods for urban park vegetation detection using high-resolution imagery is of paramount importance.
Recent advancements in remote sensing technology, particularly the availability of high-resolution satellite images and aerial photography, have opened up new possibilities for urban park vegetation detection. These technologies provide detailed and fine-grained spatial information, enabling better discrimination and classification of various vegetation types within urban parks. Additionally, the integration of advanced image processing techniques, such as object-based image analysis (OBIA) and machine learning algorithms, has shown promising results in accurately detecting and mapping urban vegetation (Wang et al., 2021). These approaches utilize the spectral, textural, and contextual information extracted from high-resolution imagery to differentiate between different vegetation classes.
OBIA is a widely adopted approach for urban vegetation detection due to its ability to consider not only pixel-level information but also object-level characteristics. By segmenting the image into meaningful objects based on their spectral and spatial properties, OBIA allows for more accurate classification and mapping of urban vegetation. Furthermore, OBIA facilitates the integration of auxiliary data, such as digital elevation models (DEMs) and LiDAR data, which can provide additional information about the vegetation structure and height (Wang and Gao, 2019).
Machine learning algorithms, including support vector machines (SVM), random forests (RF), and convolutional neural networks (CNNs), have shown great potential in urban vegetation detection (Hinton et al., 2006; Zhao et al., 2017; Yao et al., 2020; Yi et al., 2021; Zhao et al., 2021; Huang et al., 2022; Zhou et al., 2022). These algorithms can learn from labeled training data to classify and identify different vegetation types based on their spectral signatures and spatial patterns. Additionally, deep learning techniques, such as CNNs, have demonstrated superior performance in image classification tasks by automatically learning hierarchical features from raw data (Liu Y. et al., 2018). Moreover, in recent years, research in this field has been focused on two main approaches for the classification of multispectral (MS) data. The first approach involves pan-sharpening the MS data to generate a fused image, followed by classification. Several studies have employed this method, including those by Shackelford and Davis (2003), Castillejo-González et al. (2009), Amro et al. (2011), Shingare et al. (2014), Huang et al. (2015, 2021), Masi et al. (2016), Zhong et al. (2016), and Liu X. et al. (2018). The second approach entails extracting distinct features from both the panchromatic (PAN) and MS data, which are subsequently fused for classification. This methodology has been explored in the works of Moser and Serpico (2011), Moser et al. (2016), Mao et al. (2016), and Zhang et al. (2016). These developments indicate that by leveraging the power of machine learning and deep learning algorithms, accurate and efficient detection of urban park vegetation can be achieved (Li et al., 2017).
Meanwhile, the literature has several limitations; first, due to the presence of various objects of different sizes within the same scene, the existing satellite remote sensing resolution makes it challenging to accurately detect the natural boundaries of diverse flora spaces artificially designed and planted in urban parks (Soundararajan and Bovik, 2013; Taddeo et al., 2019). Additionally, the use of pixel-centric image patches as training samples can lead to confusion in the training of classification networks, as pixels with similar patch information but belonging to different categories may have very close Euclidean distances (Zhu et al., 2020). Second, the current multispectral analysis techniques in urban areas often rely on mixed images from specific wavelengths or spectrums, which may not adapt well to the expression of vegetation features. This can result in the misidentification of non-vegetative spaces such as building roofs and decorated lawns. Therefore, addressing these challenges requires a focus on the DANet (Dual Attention Network) mechanism in high-precision images, which can effectively integrate distinctive vegetation features across multiple resolutions. The DANet mechanism incorporates attention modules, including the channel attention module and position attention module. The former analyzes the information correlation among layers by extracting channel information independently and synthesizing it, while the latter focuses on the spatial perception plan by calculating correlations between pixels to determine important features. These modules are combined in a parallel manner, allowing for the assignment of attention weights to pixels in different vectors and spaces. The DANet mechanism enhances the analysis of information in wide areas and improves feature differentiation, making it suitable for multispectral and full-spectral three-channel visible image detection (Figure 1).
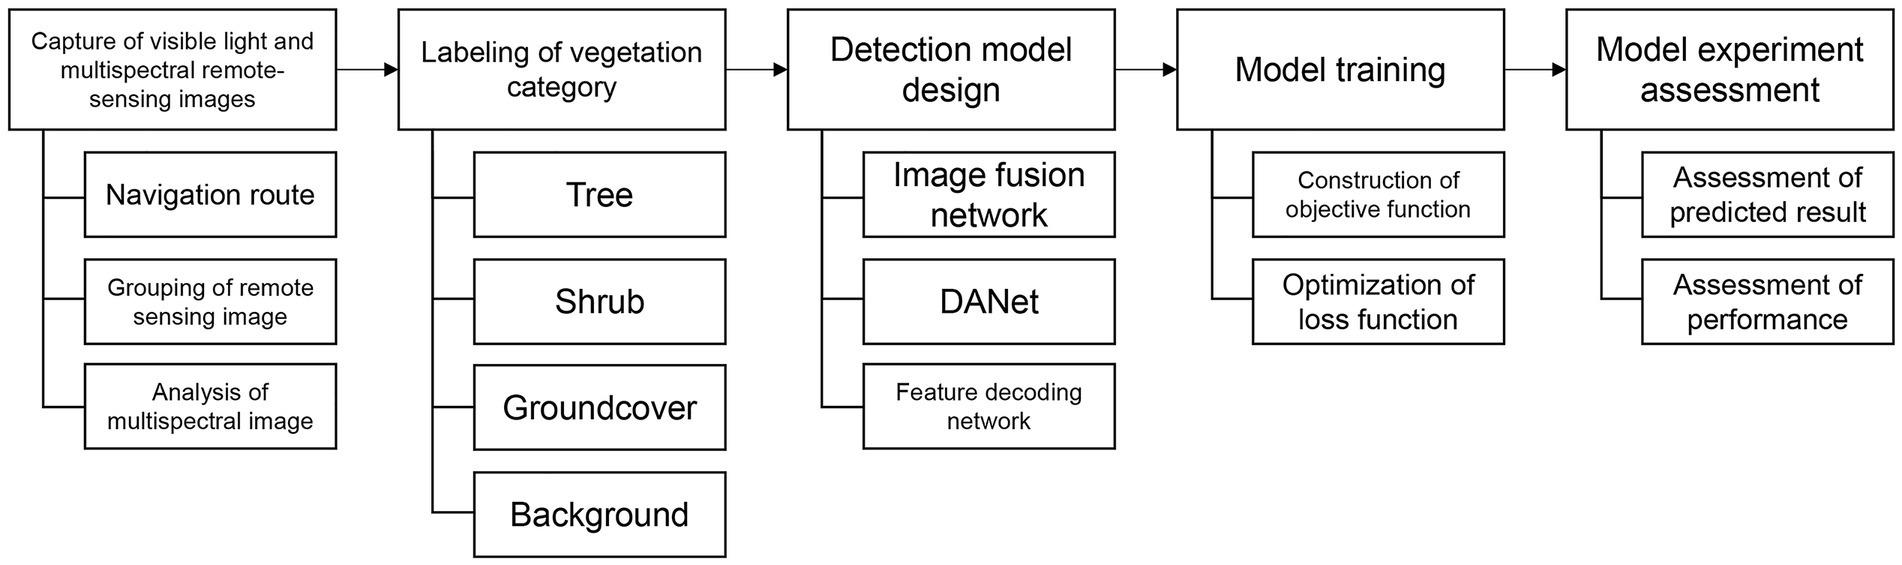
Figure 1. High-precision detection framework for urban park vegetation using DANet.
Overall, it can be deduced from the above discussion that the accurate detection and mapping of urban park vegetation play a crucial role in assessing carbon sinks, managing urban green spaces, and implementing low-carbon strategies (Amro et al., 2011; Casalegno et al., 2017; Chakraborty et al., 2020; Yuan et al., 2022). High-resolution remote sensing imagery, combined with advanced image processing techniques such as OBIA and machine learning algorithms, offers significant potential for improving the precision and reliability of urban park vegetation detection. Further research and development in this field are needed to enhance the accuracy, efficiency, and scalability of these methods. By effectively leveraging remote sensing technology and image analysis approaches, we can contribute to the sustainable management of urban ecosystems and mitigate the impact of climate change. Based on the foregoing discussion, this study aims to achieve the following objectives: (1) selection of appropriate equipment and indicators; (2) data collection in Jinhai Lake Park and labeling using Labelme; (3) accurate detection of shrubs and groundcover in park vegetation through image fusion, feature fusion, and DANet modeling; (4) investigation of the impact of vegetation height on experimental precision. The novelty of this study lies in the development of a high-precision detection model for urban park vegetation using an unarmed aerial vehicle (UAV) equipped with very high-resolution visible and multispectral remote sensing cameras, which overcomes the limitations of traditional methods and improves the accuracy of carbon sink calculation, planting assessment, and urban ecological impact evaluation in high-density cities. The proposed modifications and optimizations of this model aim to enhance the accuracy of carbon sink calculations and planting assessments, serving as a mathematical prerequisite for addressing urban carbon sink issues in high-density cities.
The methodology employed in this study follows a systematic workflow comprising several key steps to analyze urban park vegetation in Bubble Park, located in Fengxian District, Shanghai. First, a very high-resolution aerial survey was designed, utilizing an unmanned aerial vehicle (UAV) equipped with a DJI ZENMUSE P1 full-frame aerial camera and a YUSENCE MS600Pro multispectral camera. This survey aimed to capture high-quality images with millimeter-level resolution, focusing on distinct boundaries of tree canopies, shrubs, and ground covers. The UAV was flown at a height of 100 m to capture images with six bands, requiring clear remote sensing zones with ample sunlight for optimal image quality. The collected images underwent preprocessing steps, including calibration, correction for geometric and radiometric distortions, and removal of noise or artifacts. Standardized labeling software was then used to label the original images, distinguishing trees as green, shrubs as yellow, and ground covers as red, which was crucial for training the neural network model accurately. To facilitate training and forecasting, the large-scale images were sliced into smaller 512 × 512 pixel slices with a 50% overlap between adjacent slices to improve the training scale and reduce fringe effects. Data augmentation techniques were employed to introduce diversity into the training dataset. The neural network model, consisting of an image fusion network, DANet, and a feature decoding network, was developed for analyzing the labeled images and detecting vegetation categories. This model incorporated a feature pyramid network and position and channel attention modules for spatial and channel analysis. It was trained using a multi-scale loss function and optimized with the Adam optimization algorithm to enhance accuracy in identifying and classifying vegetation categories. Finally, prediction results were validated or assessed based on several key performance indicators (KPIs). By following this systematic workflow, the study ensured a comprehensive and efficient analysis of urban park vegetation in Bubble Park, encompassing data acquisition, preprocessing, labeling, data preparation, neural network model development, and model training, ultimately providing valuable insights into the park’s vegetation composition.
The Bubble Park, located in Fengxian District, Shanghai, is a vibrant urban public green space characterized by its abundant vegetation (Figure 2). This park is situated in a subtropical monsoon climate zone, encompassing both temperate and subtropical urban landscape vegetation, making it a suitable and versatile location for relevant studies. With a total area of 19.35 hectares, the park boasts a remarkable 78% green space ratio and 22% pavement ratio. Surrounded by water bodies, ecological and botanical gardens, grasslands, and dense forests, Bubble Park has been recognized as one of the Top 10 Characteristic Vegetation Zones for Parks in Shanghai in both 2020 and 2021. Therefore, due to its excellent and diverse vegetation categories, this park serves as an ideal and representative site for studying urban park vegetation.
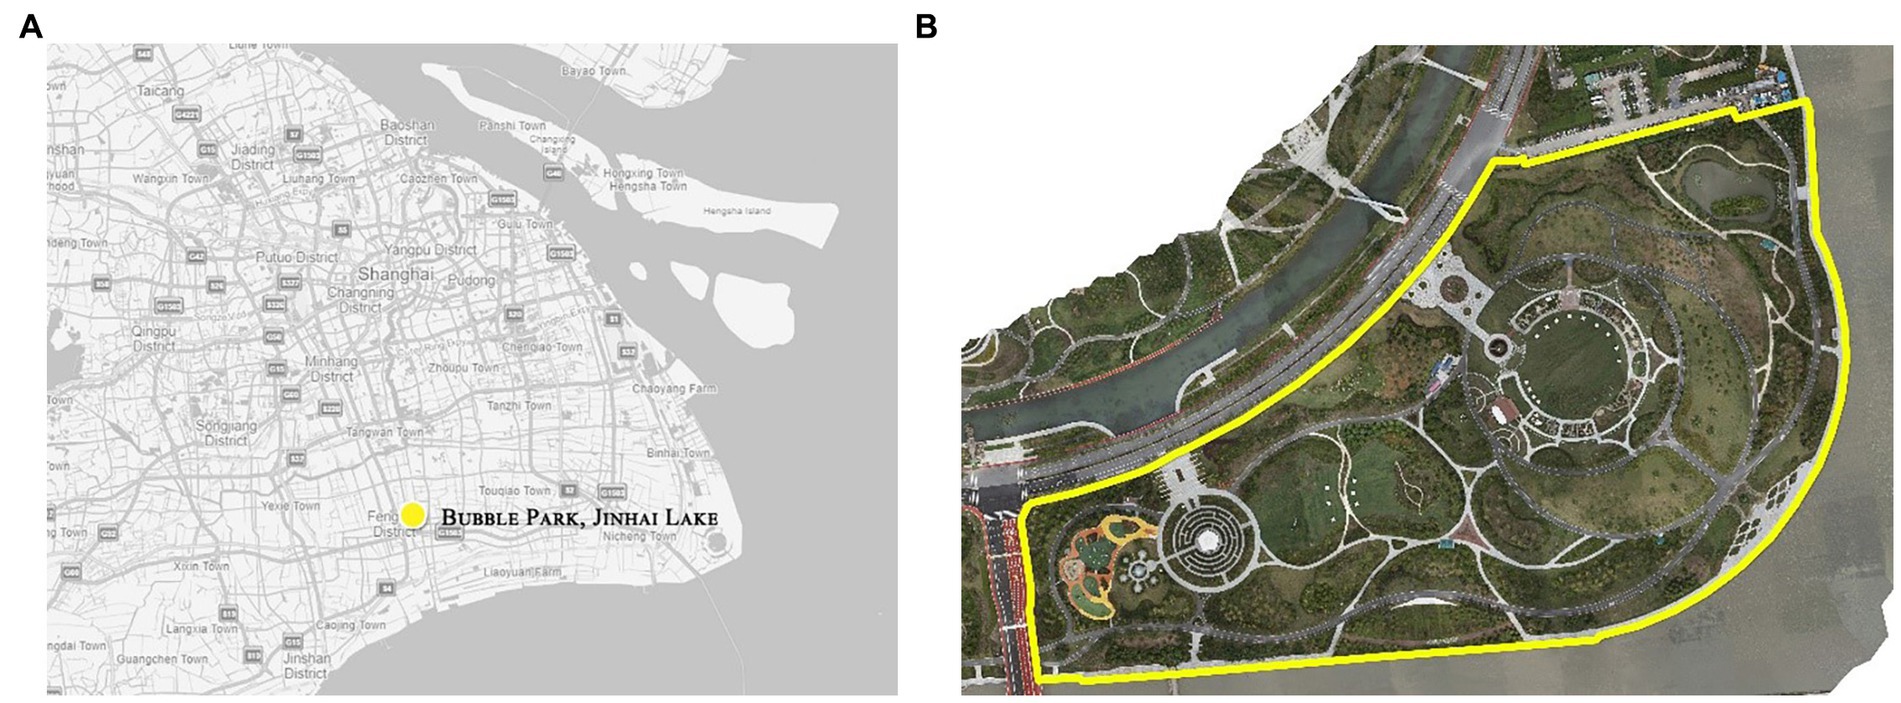
Figure 2. Study area (A) site zone, (B) orthoimage research range.
To gather comprehensive data, a highly detailed visible and multispectral aerial survey was conducted using unmanned aerial vehicles (UAVs) during May, June, and July of 2021. Only the image data from clear days were selected for analysis. The survey involved capturing six bands of data at a height of 100 m, including wavelengths of 450, 555, 660, 720, 750, and 840 nm. The resulting acquired images had a resolution of 2.54 cm per pixel. Specific spatial conditions were considered during the aerial survey, including the need for clear remote sensing zones with ample sunlight. Additionally, it was important to ensure distinct boundaries between tree canopies, allowing for differentiation between evergreen and deciduous trees. Furthermore, the survey aimed to capture clear distinctions between shrubs and ground covers, enabling the identification of various vegetation types such as wooden shrubs, grass, shrub groups, isolated shrubs, and more.
Acquiring high-resolution visible images is crucial to ensure the accurate detection of urban park vegetation. However, this process faces various challenges, including signal interference from aircraft, lighting clearance, wind speed, resolution, data transfer, and equipment weight. Overcoming these challenges, the combination of the DJI ZENMUSE P1 full-frame aerial camera and the YUSENCE MS600Pro multispectral camera carried by the DJI M300RTK UAV offers technical advantages such as high light sensitivity, wind resistance, a full-frame sensor, and a global shutter to minimize the jelly effect and ensure picture quality. Additionally, the customized APP and DJI Terra software used in this study enabled simultaneous flight planning and efficient acquisition of large-area image data. The multispectral sensor used in this study is a type of remote sensing sensor that captures data in multiple bands of the electromagnetic spectrum beyond what is visible to the human eye. It was equipped with a very high-resolution visible and multispectral remote sensing camera that captured the green normalized difference vegetation index (GNDVI) images and full-spectral three-channel images of the urban park vegetation. The sensor’s data was processed using a dual attention convolutional neural network (DANet) to improve the high-precision detection of vegetation in the study area. In this study, the focus is on the vegetation in urban parkland, which differs from natural forests and requires a more accurate prediction method than the commonly used NDVI. Therefore, the GNDVI was adopted as a more stable and accurate vegetation index, calculated using multiple bands, to analyze the multispectral three-channel visible light image. The GNDVI formula, defined as (NIR-Green)/(NIR + Green), where NIR represents the 840 nm near-infrared band and Green represents the 555 nm green band, helps in understanding the vegetation characteristics.
The original visible image, multispectral GNDVI image, and labeled result are shown in Figure 3. The experimental images encompass multispectral GNDVI images and full-spectral three-channel visible light images, with a resolution of 10,486 × 7,328 pixels, focusing on tree, shrub, and ground cover elements. Standardized labeling software, Labelme, was used to label the original images, distinguishing trees as green, shrubs as yellow, and ground covers as red (Figure 4). To handle the large image size, the original image was sliced into 512 × 512 pixel sections for training and forecasting. The slicing process included an overlapping plan, with adjacent slices overlapping by 50%, enhancing the training scale and reducing the fringe effect. In this study, a total of 13,590 sliced images were generated. Among these, 11,010 sliced images were utilized for training the model, 1,352 for testing, and 1,228 were reserved for validation purposes. Further, GDAL was used for image processing, and ArcGIS and ENVI were used, respectively, for a geographical information system (GIS) and spatial data analysis.
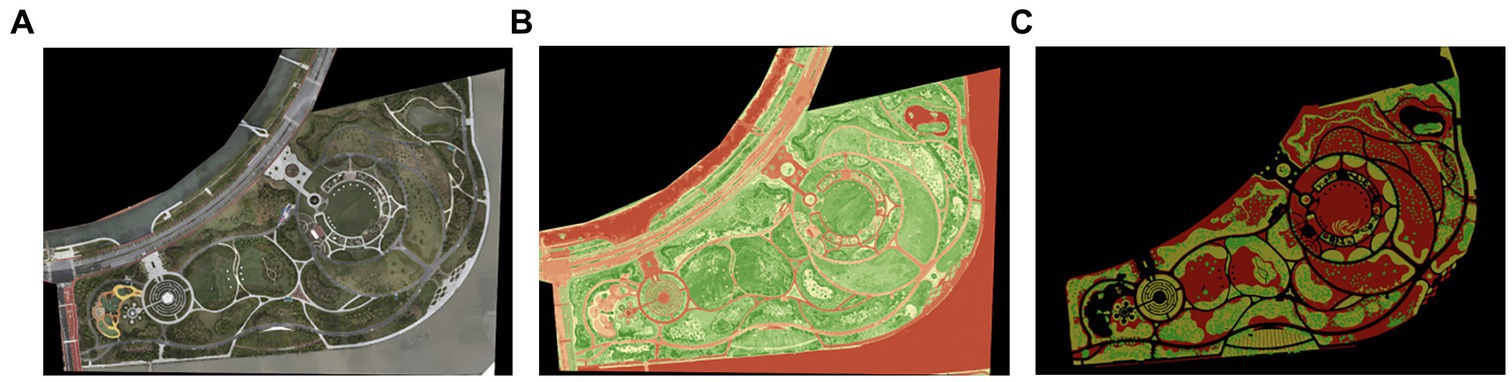
Figure 3. Comparison of collected images: (A) original three-channel visible light image, (B) multispectral GNDVI image, (C) labeled image.
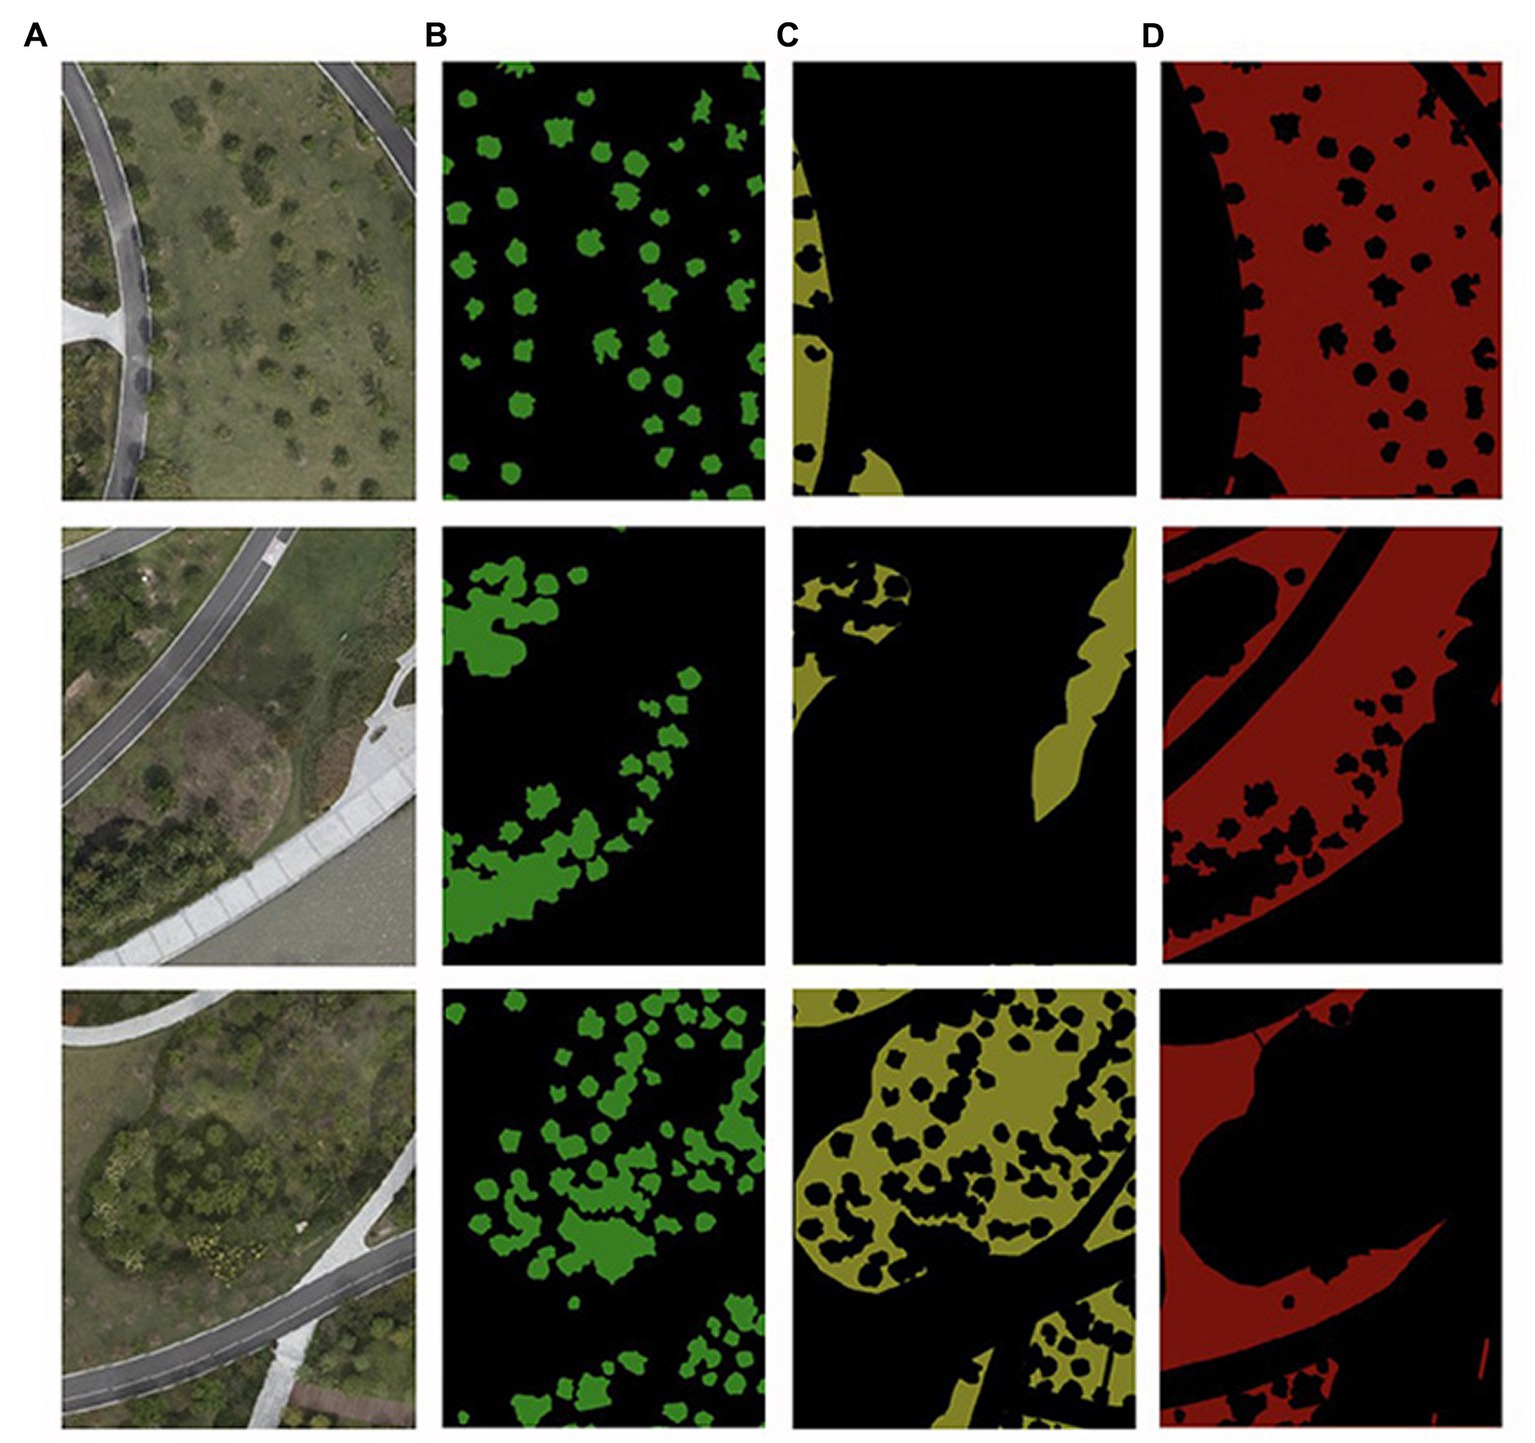
Figure 4. Image labeling overview: (A) original image, (B) tree labeling, (C) shrub labeling, (D) ground cover labeling.
For the evaluation and testing sets, a unique approach was taken to handle the large-scale images. Two independent 1,500 × 1,500 pixel images were randomly selected as part of the test set, while the remaining images were sliced into 512 × 512 pixel images with overlapping sections. To simulate real-world conditions, the experiment results were assessed after fusing the overlapped slices. The dataset was proportionally categorized to ensure an 8:1:1 ratio between the training set, validation set, and test set. The sample distribution of different categories of concern in the training set, verification set, and test set is illustrated in Table 1. To enhance the diversity of the training data, data augmentation techniques such as scaling, rotating, color-shifting, and adding Gaussian noise were applied to both the generated slices and their corresponding labeled images.
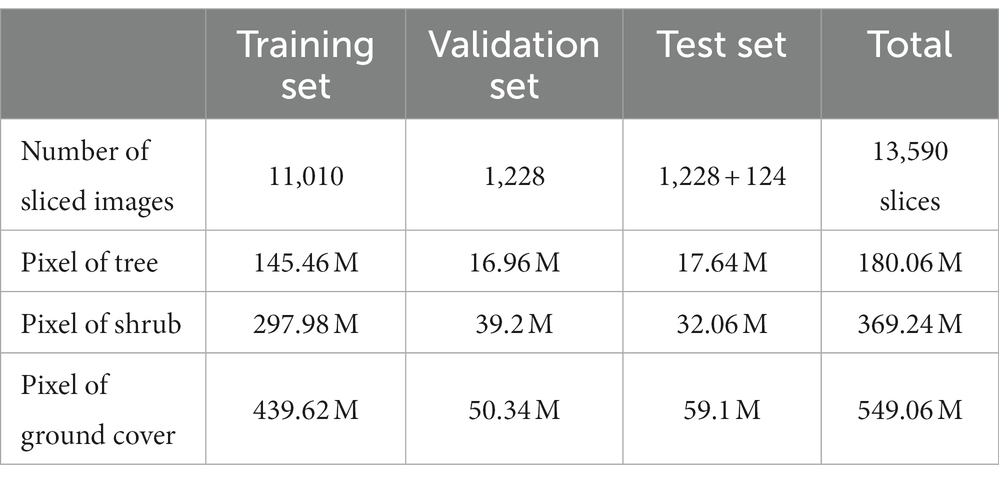
Table 1. Distribution of samples (pixel) in the training set, validation set, and test set.
The network structure included three parts (Figure 5): image fusion network, DANet, and feature decoding network. The integral structure was based on the encoder-decoder network. The encoder patch extracted the input feature spectrum from top to bottom. The decoder optimized the input feature from bottom to top, generating the interpreted result to satisfy the training requirement. Considering the multiple scales of the image, this network adopted a feature pyramid network (FPN) to separate and optimize basic features. In terms of lateral connection, features of the encoder and decoder were fused, and the elaboration of semantic segmentation was realized by combining the abstract semantic feature in the top layers and the high-resolution detail feature in the bottom layers. Meanwhile, it is important to mention that for the programming of machine learning algorithms, Python was employed.

Figure 5. Integral network structure overview.
Image fusion network extracted and fused basic features from the GNVDI images generated by multispectral images and visible images. The early fusion module worked by fusing two images through channels and then imputing features into the basic feature extraction network; the feature fusion module worked by fusing features extracted from symmetry basic features extraction networks.
In the early fusion module, the W, H, and C in the original image and GNDVI image , respectively, refer to width, height, and the number of channels. After channel fusion, the two images generated a preliminary fusion feature , and then was compacted by two convolutional layers to generate . Then, was transferred as the input of the basic feature extraction network to generate the multi-level features , in which is the downsampling coefficient, is the hierarchy number of convolutional blocks of the pyramid structure and is the number of output channels in the basic feature extraction network. Basic features were extracted through ResNet50.
In the feature fusion module, the dual-branch construction was conducted through a Siamese structure. and were adopted to generate basic image feature pairs, and , through two parallel encoders. These two encoders shared the parameters and constructed the Siamese network in a symmetric structure. The outputs of the Siamese network were fused by channel concatenation. Then, features were arranged through the convolutional layer in similar ways, forming the data processing link of , in which represents concatenation, , and . The generated was fused with the outputs of the encoder to acquire information about multiple scales.
extracted from the ResNet module in the basic feature network, regardless of whether it came from the early fusion module or the feature fusion module, served as the input for a dual attention module. Multiple dual attention modules established unilateral connections and constructed a multi-scale feature pyramid, facilitating the skip-connection of features between the encoder and decoder. Each dual attention module comprised a position attention module and a channel attention module (Figure 6).
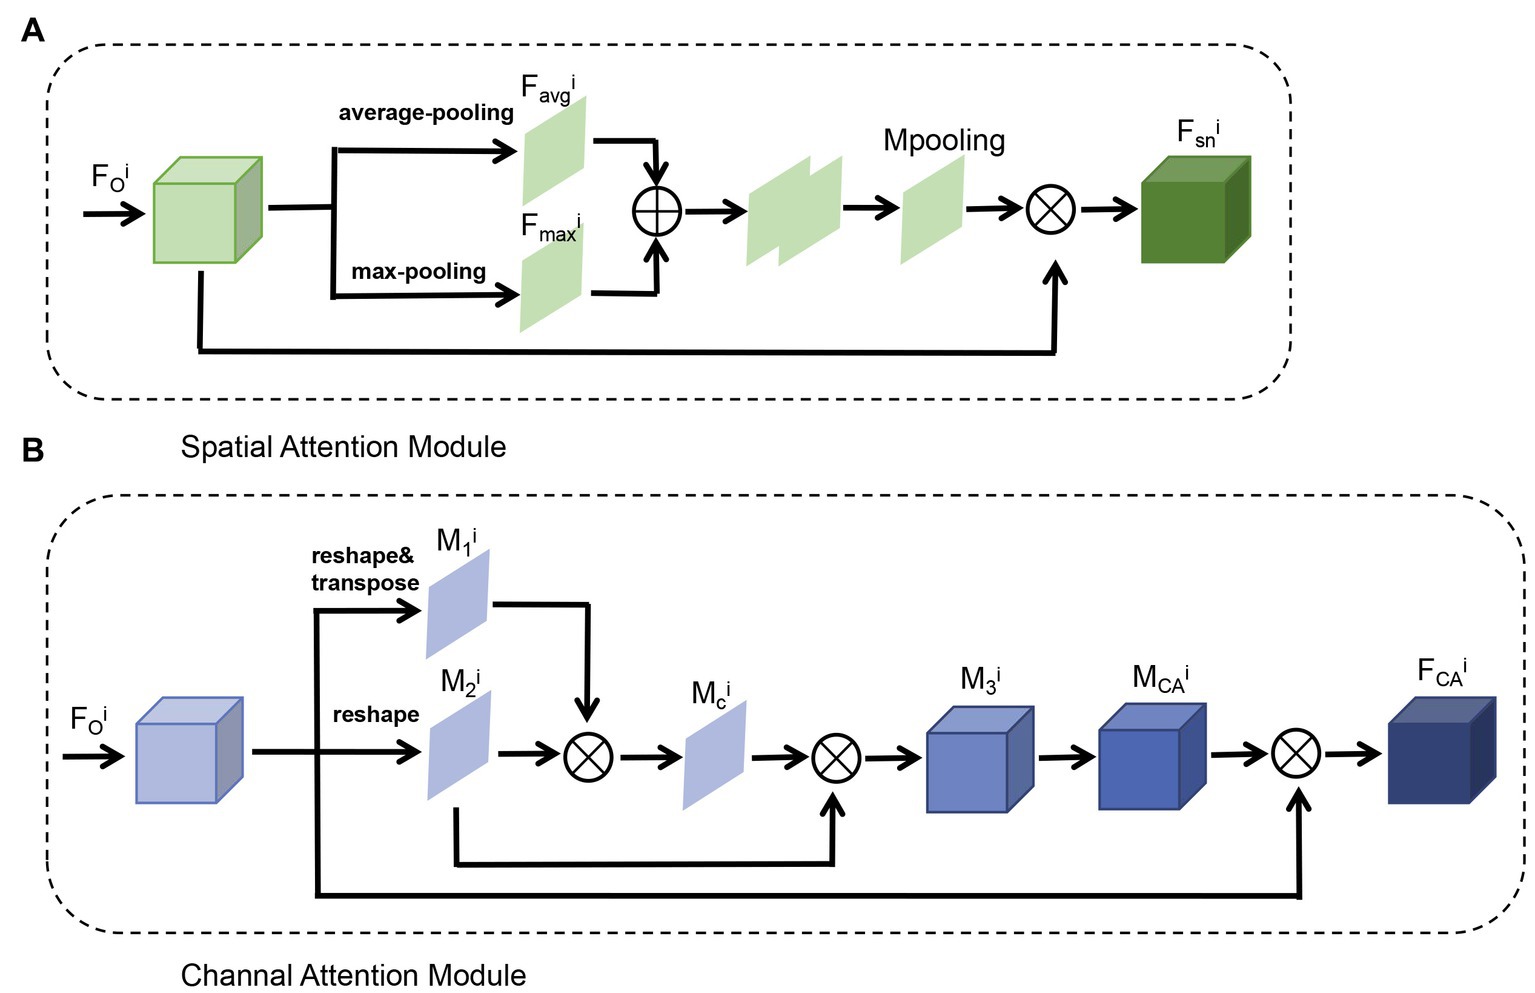
Figure 6. Structure of DANet for skip-connect and multi-scale feature pyramid. (A) Spatial attention module. (B) Channel attention module.
In images, trees were usually enclosed by shrubs, and the grounds occupied a relatively large scale. This abstract visual observation result could be specified as the model parameter of the neural network. The spatial attention mechanism gave the network the ability to analyze the spatial relationship, connect neighborhood features, and enhance object features. In the position attention module (Figure 4A), the channel information in each layer acquired from the basic feature network was compressed by max pooling and average pooling to generate global spatial information and , which were fused by channel superposition and then generated a central matrix of spatial features by CNN. controllled spatial information of positions for different pixels, in which pixels about objects were stressed by higher weight, while background features were inhibited by lower weight. The ELU was used on the element-wise sum results of matrixes and the original output features to stimulate relevant neurons. Eventually, were generated to represent the final position attention features:
In which represents the feature convolution with 3 × 3 convolutional kernel, represents the feature layer link, and represents the element-wise sum.
For images with multiple spectrums, different channels represent different information, and the combination of channels can display various information about waterbody, vegetation, pavement, etc., so the channel attention module was trained to master the combination relationship among different channels (Figure 4B). For the traditional convolutional strategies, their convolutional kernels possessed independence in the channel, which led the network to not make full use of the spectral features of multiple layers in the Full-spectral three-channel visible light image. Therefore, we chose the channel attention module to specifically model the spatial relevance of channels. Feature split into three branches after deformation and transposing, one branch of which generated a channel-pixel association feature matrix , while the second branch generated its shape-transposed matrix , where . Operated by convolution and softmax activation function, the channel association matrix was used to analyze the relationship between channels. Later on, features were modified for the fusion of and original feature : first, wass convoluted by to generate ; second, it was transposed into the channel central matrix , which strengthens channel information from UAV, focuses on the correlation between channels, and inhibits irrelevant channel information; finally, the fusion of this matrix of original features produced the spatial attention feature :
All pixels at different positions were considered by the position attention module, in which weight sum was adopted to aggregate characteristics of each position selectively. No matter how far between them, similar features were mutually correlated. The channel attention module selectively emphasized interdependent channel mappings by integrating relevant features from all channel mappings. Finally, the outputs of two attention modules were added and processed by several 3 × 3 convolutional neural layers to get the input features corresponding to the decoder of each layer:
Attention features of different layers converted channel numbers through 1 × 1 convolution, and then resized the feature diagram by up-sampling, preparing for the subsequent feature fusion with the bottom features. Repetitively, the bottom-to-top feature fusion was realized step by step, which accelerated the expression of features and optimized the result of segmentation:
After obtaining of each layer, the probability graphs were acquired through the convolution of 1 × 1 × C and softmax, which interpreted the presence of each object. The probability graphs had the same scale as the original label to guarantee the accuracy of calculation, in which C is the number of categories to be distinguished, and i is the hierarchy index of the feature pyramid.
With the aim of loss acquisition of multiple scales, the training of the model was based on supervised learning. Decoding feature diagram in each fused layer was compared with the labeled object diagram to construct the multi-scale loss function, in which is the downsampled labeled product. The structure of objective function is shown below:
where is the probability of the nth object in the ith layer; represents whether this position has been labeled as the nth category after downsampling as if it has been labeled, . L is the number of convolutional blocks included in the basic network, and N is the number of general categories.
During training, the objective function was optimized by the Adam function, and the learning rate was renewed by cosine annealing with an initial learning rate of , weight descent of , and 60,000 times iterative training with a batch size of 4.
To balance the samples, the loss function was optimized by weighted cross entropy theory, which meant different objects were applied with different loss weights. The weight of small samples, such as trees, was elevated to improve their contribution to the loss function; the frequent samples, such as environmental context (including surrounding environment and black pixels in clipping), made less contribution to the loss function. We mainly modified the weight of the positive sample; the optimized loss function is shown below:
where w is the self-adapted weight parameter, calculated by the pixel distribution probability of the corresponding category of training images. And, n in represents different categories.
The urban park scene provides observations of vegetation, with shrubs typically below 3 meters in height, trees ranging from 3 to 20 m, and grass usually less than 30 cm. The variation in vegetation height plays a crucial role in distinguishing different categories. Traditionally, elevation information is obtained through laser radar, which measures the elevation of ground objects based on echo feedback (Quiros et al., 2021). Radar data offers detailed spatial distribution information, making it the preferred data source for measuring forest structure parameters. However, the use of high-density LIDAR data increases the cost of scene representation and interpretation, while acquiring high-precision DSM and DEM for scene observation is more cost-effective.
The remote sensing images used for segmentation were derived from orthodiagraphic concatenation, and the oblique images captured by the oblique camera were also valuable. To extract elevation information, we employed multi-stereo vision technology to process the oblique images, creating an oblique photographic model that captured detailed features of the scene. The resulting scene model is depicted in Figure 7A.
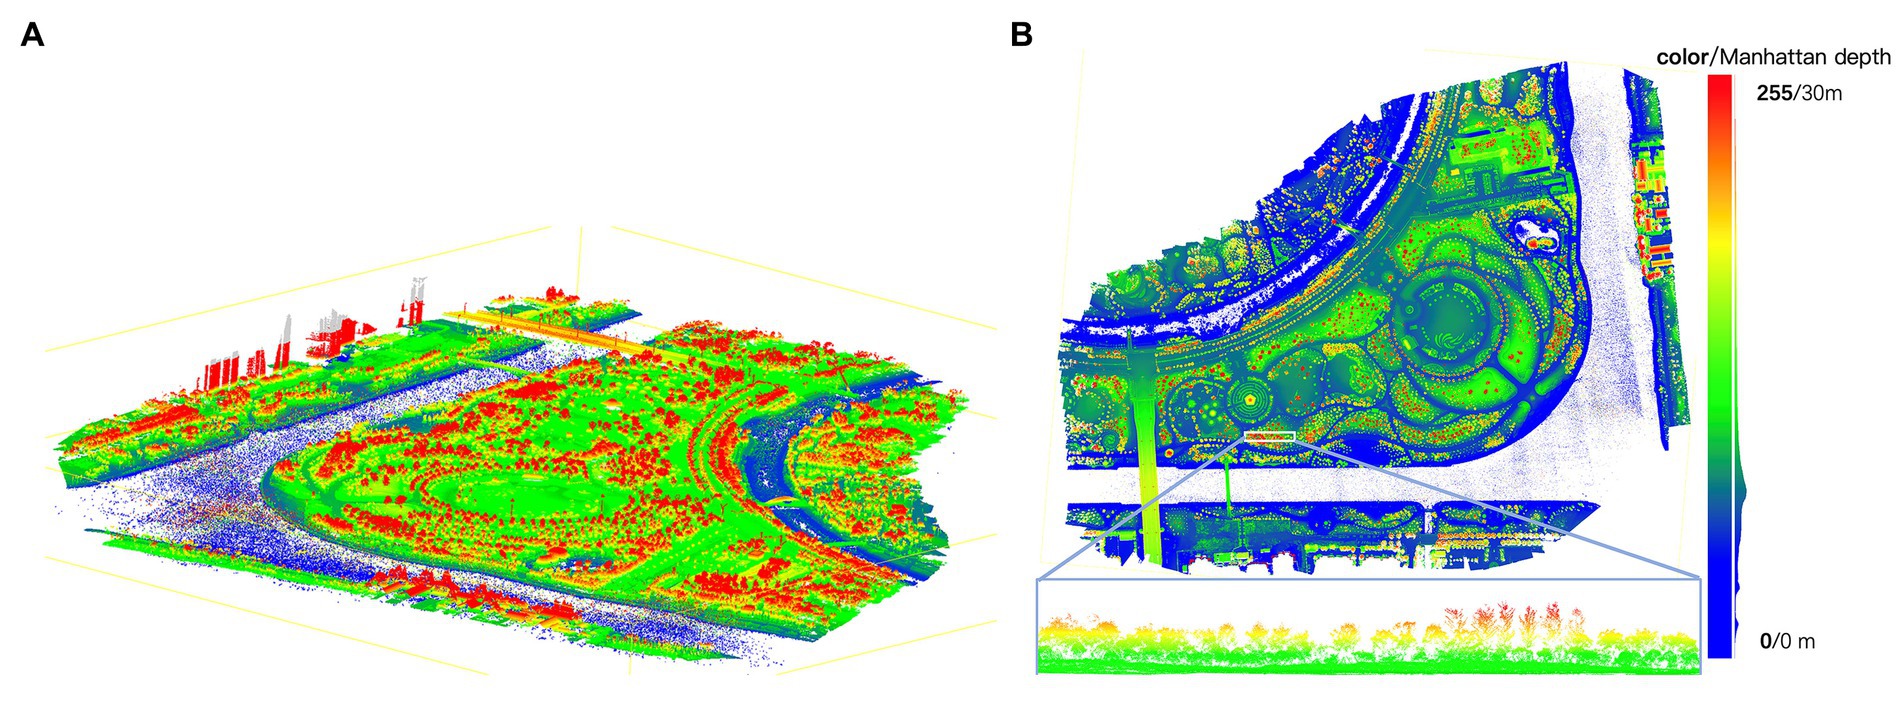
Figure 7. Scene model visualization. (A) Panorama dense point cloud generated based on oblique images. (B) Height map generated by point cloud projection.
Using the Manhattan plane constraint method, we determined the absolute direction of the ground and projected the dense point cloud onto the ground direction through an overlooking scheme to generate a height map (Figure 7B). The lowest point of the fitted Manhattan plane served as the horizontal plane of the observation park, with the maximum observation elevation set at 25 m. For simplicity, we converted the elevation values to a grayscale map within the range of 0 to 255. As seen in Figure 7B, the grayscale map was transformed into the RGB color space for better visualization.
Elevation data provides information about the vertical structure of the vegetation scene. Utilizing this information effectively in vegetation classification tasks is the primary focus of this section. An elevation distribution histogram was obtained by analyzing the distribution of elevation images through regression from 0 to 255 and fitting the distribution curve with a Gaussian function (Figure 8). However, contrary to prior knowledge, the elevation distribution did not follow a linear pattern and exhibited regional overlap in the analysis data. The differentiation in pixel heights alone was insufficient to determine vegetation species, often leading to confusion between small trees and tall shrubs. Additionally, due to the undulating background (with height differences greater than that of shrubs), distinguishing between grass and shrubs based on height alone was challenging.
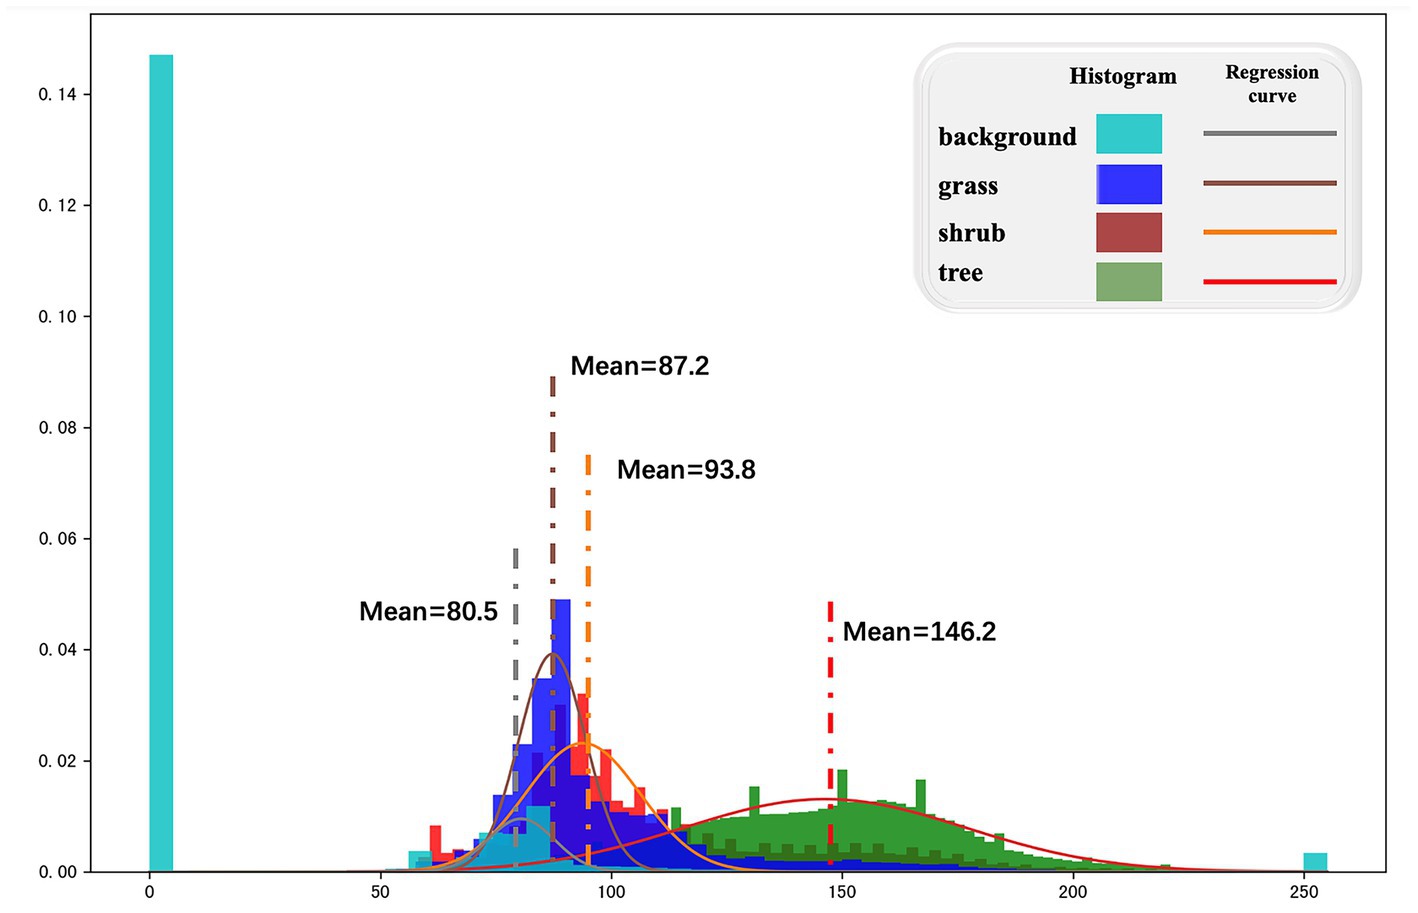
Figure 8. Elevation distribution histogram and Gaussian fitting curve calculated based on elevation gray map.
In light of the aforementioned considerations, our study proposed three distinct methodologies for effectively extracting elevation information in the context of vegetation analysis. The first approach, referred to as hard division based on elevation (Figure 9A), involved partitioning the vegetation into four categories, including the background, by utilizing the mean value obtained from the Gaussian fitting function. This method provided a clear delineation of different vegetation types based on their respective elevation levels. The second method, termed soft partition based on elevation confidence (Figure 9B), took advantage of the Gaussian fitting function to derive category-specific confidence values. These values were then weighted by the logistic results generated from the segmentation process. By assigning the pixel to the category with the highest probability, this approach allowed for a more nuanced and probabilistic division of the vegetation based on elevation information. Finally, the decision fusion based on soft partition (Figure 9C) method combined the classification results obtained from both the segmentation process and the soft partition approach. This fusion took place at the decision level and aimed to leverage the advantages offered by elevation information, particularly in the classification of tree objects. By integrating the insights from both segmentation and elevation-based analysis, this approach enhanced the accuracy and reliability of vegetation classification in the presence of varying elevation levels. While the first method forced the elevation range to determine plant species, Figure 9 demonstrates that elevation overlap exists among multiple vegetation classes, making the forced classification approach less accurate. Comparatively, the second method was more reliable. By fitting the Gaussian function curve generated by the histogram to the confidence probability of each class, we could define the confidence probability functions for our case as follows.
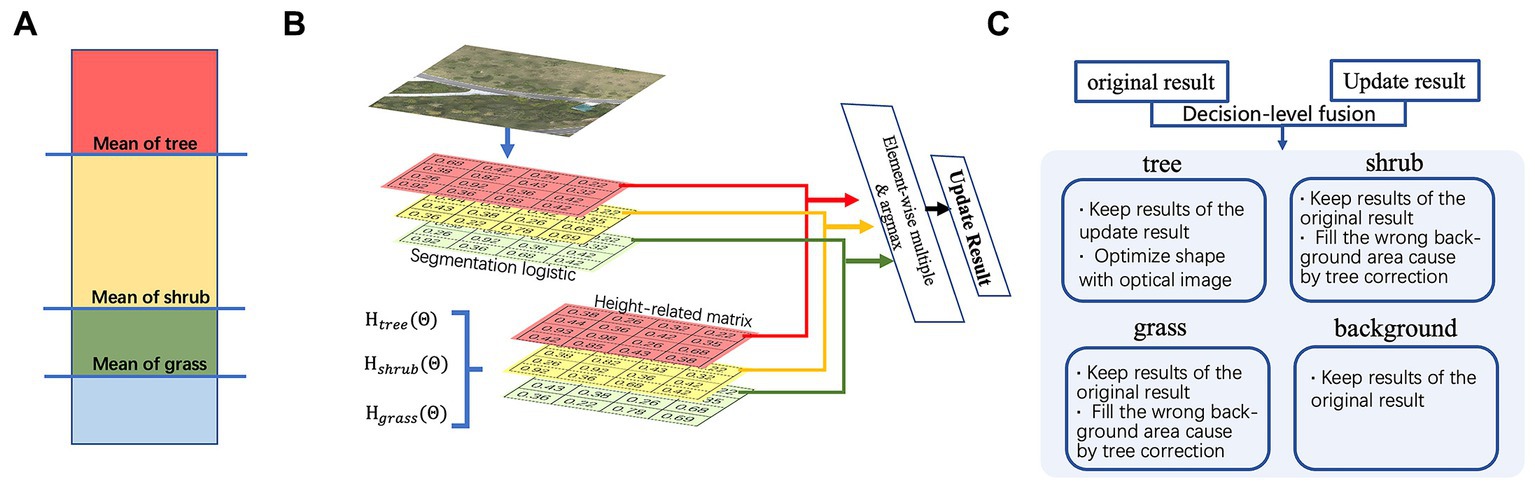
Figure 9. Schematic depictions illustrating three distinct methodologies for the fusion of elevation information. (A) Hard division based on elevation. (B) Soft partition based on elevation confidence. (C) Decision fusion based on soft partition.
The construction of the height-related matrix for different categories was based on the pixel height of each image. By performing an element-wise multiplication of the height-related matrix and the logistic probability distribution matrix obtained through segmentation, updated probability distribution results were obtained. Each pixel was then assigned an updated category based on the argMax operation. It should be noted that although this approach effectively integrates elevation information into the segmentation model, we did not optimize the probability of the background. As a result, some uncertain vegetation areas may have had a lower logistic probability compared to the background after invoking the confidence probability, leading to the absence of certain vegetation areas. This will be further examined in Experiment 3.3. Specifically, we observed that the performance of the shrubs and grass classes did not improve compared to the original image-based interpretation, while the indicators for the background were less satisfactory. Only the tree category showed significant improvement.
Since tree stock is a key indicator for evaluating carbon emissions, we considered decision fusion based on soft partitioning and the original segmentation results to achieve comprehensive segmentation and incorporate elevation information. Different strategies were applied to constrain different categories. In particular, we found that GNDVI results significantly enhanced the differentiation between vegetation and the background, indicating the reliability of the segmentation results for vegetation extraction. Therefore, the decision-level fusion was based on the assumption that the background segmentation remains unchanged, while only the vegetation categories are updated. For trees, the soft partition-based predictions were considered accurate, and their boundaries were optimized using a conditional random field (CRF). As for shrubs and grass, we maintained the original segmentation results based on visible images. However, changes in the tree category may result in the loss of category in certain areas, as shown in the red circle in Figure 10 in section 3.3. Therefore, based on the categories of surrounding pixels (considering only grass and shrub categories), the missing pixels were assigned the highest confidence category. In summary, by utilizing segmentation and elevation optimization results, we can obtain a vegetation distribution map specific to the observation area.
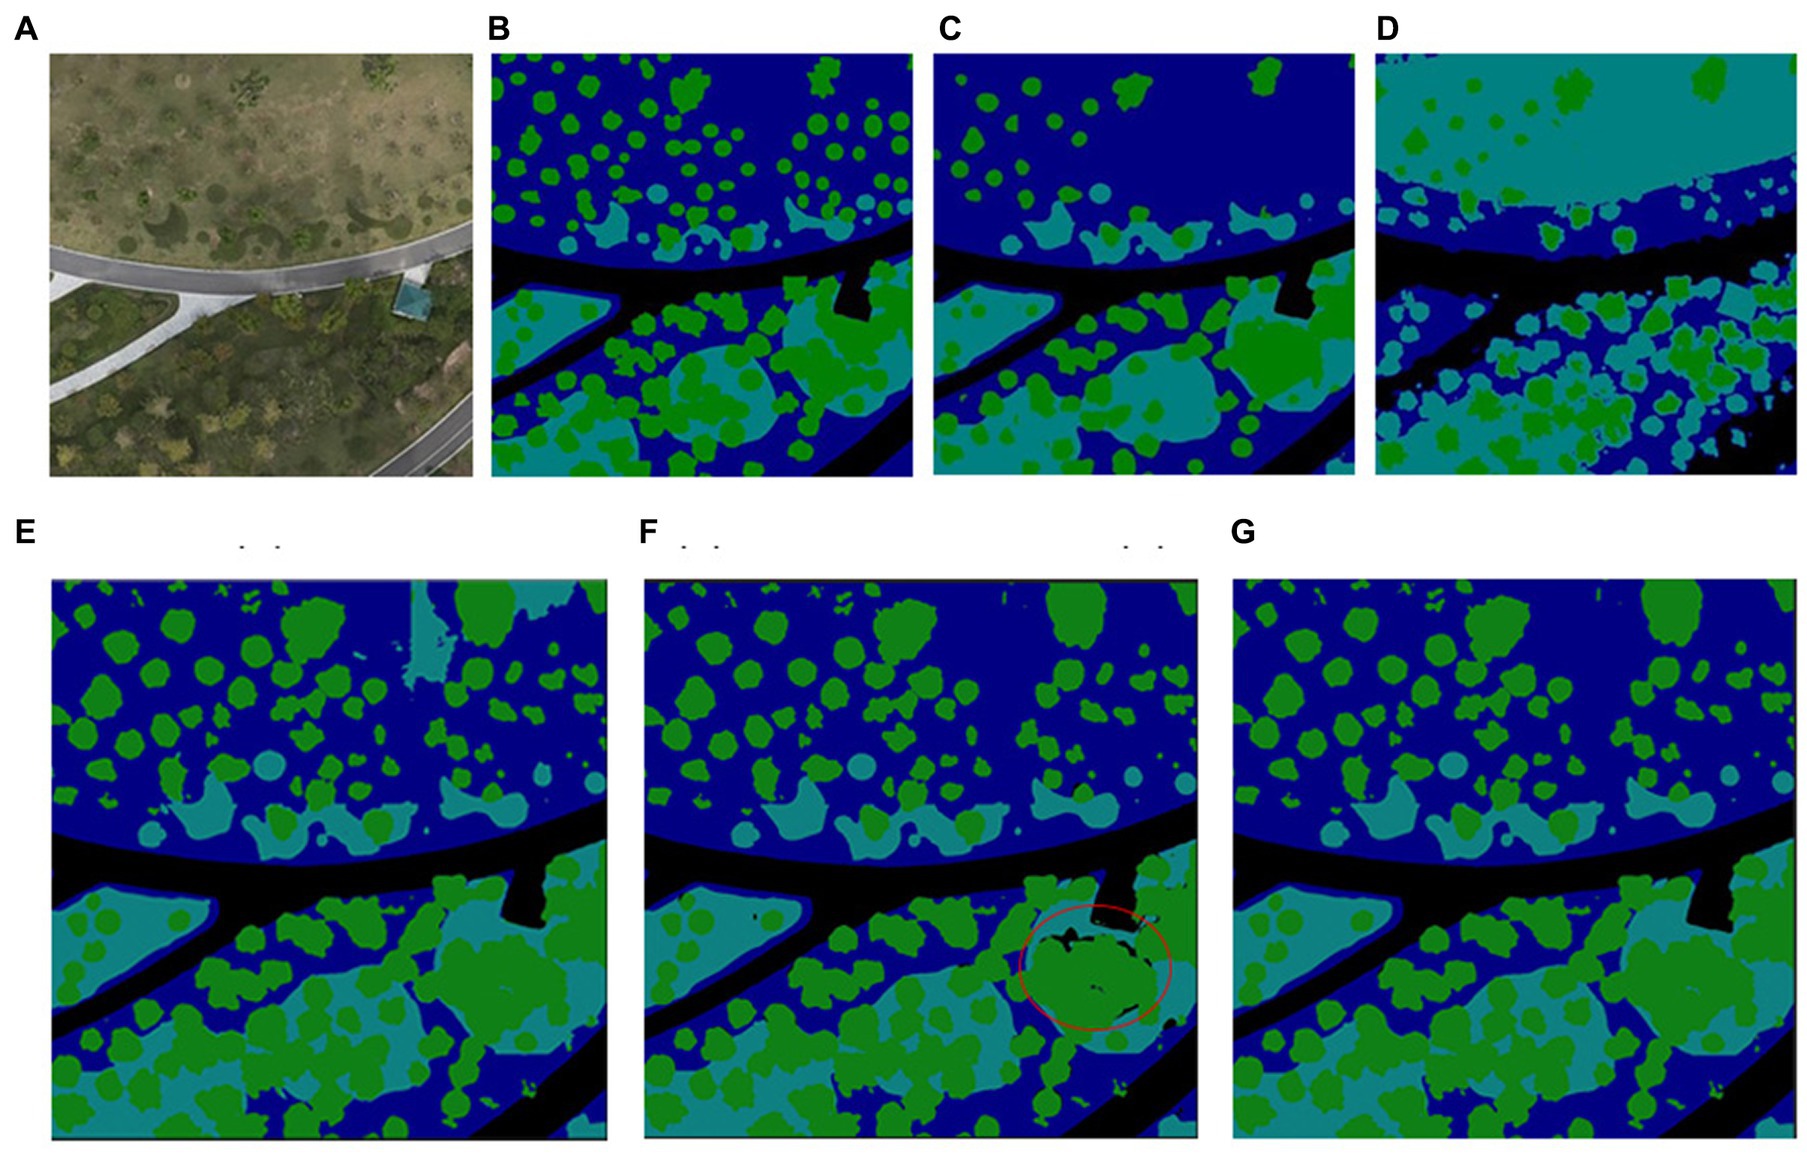
Figure 10. Evaluation of elevation fusion methods (A) original visible image, (B) label, (C) original segmentation results, (D) hard partitioning results based on elevation, (E) soft partitioning based on elevation confidence (Background optimization not completed), (F) soft partitioning based on elevation confidence (after background optimization), (G) decision fusion based on soft partitioning and background optimization.
The performance of various approaches was evaluated using the ResNet50 basic network and consistent training hyperparameters. Precision (P), Recall (R), and F1-score were employed as key performance indicators (KPIs) to assess the effectiveness of each approach. P measures the accuracy of category discrimination by the model, while R indicates the model’s ability to correctly identify and locate objects of interest. The following equations were used to compute P, R, and F1-score.
where TP refers to the number of pixels successfully predicted as the object with the correct category, FN refers to the number of pixels predicted as the background but that is actually the object, and FP refers to the number of pixels predicted as the object but that is actually the background.
We compared the test results of different approaches using the same ResNet50 basic network and fixed training hyperparameters (Figure 5). Based on the analysis of the segmentation results, several key observations can be made. First, when solely utilizing the visible image for training and prediction, a substantial loss of tree information occurred, leading to poor discrimination between different types of vegetation. Second, employing only the GNDVI image resulted in a more pronounced loss of tree objects, primarily due to the absence of detailed material features. Furthermore, the objects in the segmentation appeared as clusters rather than distinct individual entities. However, the advantage of this approach was evident in segmenting the green environment from the surrounding hard pavement. The dual image fusion approach, whether it was early fusion or feature fusion, performed better in separating trees and shrubs. However, in the case of early fusion, the objects still appeared too clustered, possibly due to the forced fusion of early features and insufficient extraction of abstract features. Feature fusion, which conducted independent feature fusion in each phase using a multi-scale feature extraction network and dual attention module, effectively utilized the advantages of both visible and GNDVI images in object segmentation. It successfully extracted detailed information from the images with better results.
To ensure critical reliability and accuracy verification of image processing and on-site measurements, we conducted physical verification using a 3D oblique photographic scanning model with high-precision aerial imagery at a centimeter scale. Comparisons and verifications with highly dense point cloud data showed that the results obtained through this detection method were generally consistent with the results measured by humans on-site (Figure 11).
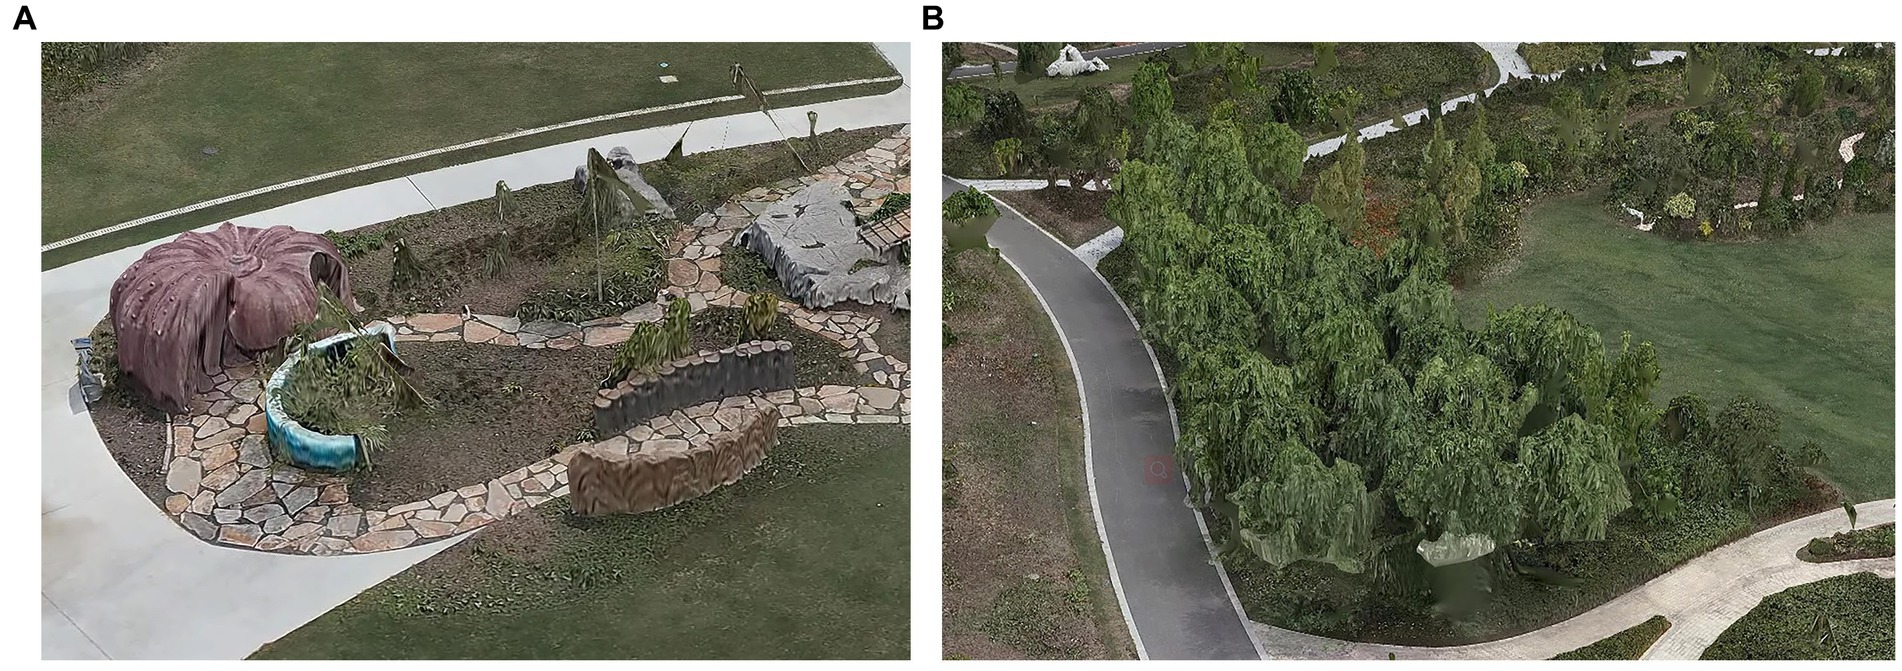
Figure 11. Two proofread image example depicting the 3D oblique photographing model.
The evaluation of different image inputs revealed that the GNDVI image demonstrated inferior performance in P, R, and F1-score when compared to the visible light image, as evidenced by the results presented in Table 2. However, the GNDVI image excelled in distinguishing the background from the objects. Moreover, the performance of the dual network architecture surpassed that of the single network architecture (Figure 12). Specifically, in the case of tree classification, the early fusion approach improved precision by 5.09% compared to the single visible light image input and achieved a 21.15% precision improvement over the single GNDVI fusion method. Furthermore, the feature fusion approach demonstrated even better performance, with a 5.44% precision improvement compared to the single visible light input. The results obtained from visualization and digitalization techniques both confirmed that the combination of the two types of images in the input network consistently yields better performance. Notably, the feature layer fusion technique, which accurately detected 91.8% of the park vegetation, outperformed direct fusion at the image layer in terms of precision and accuracy.
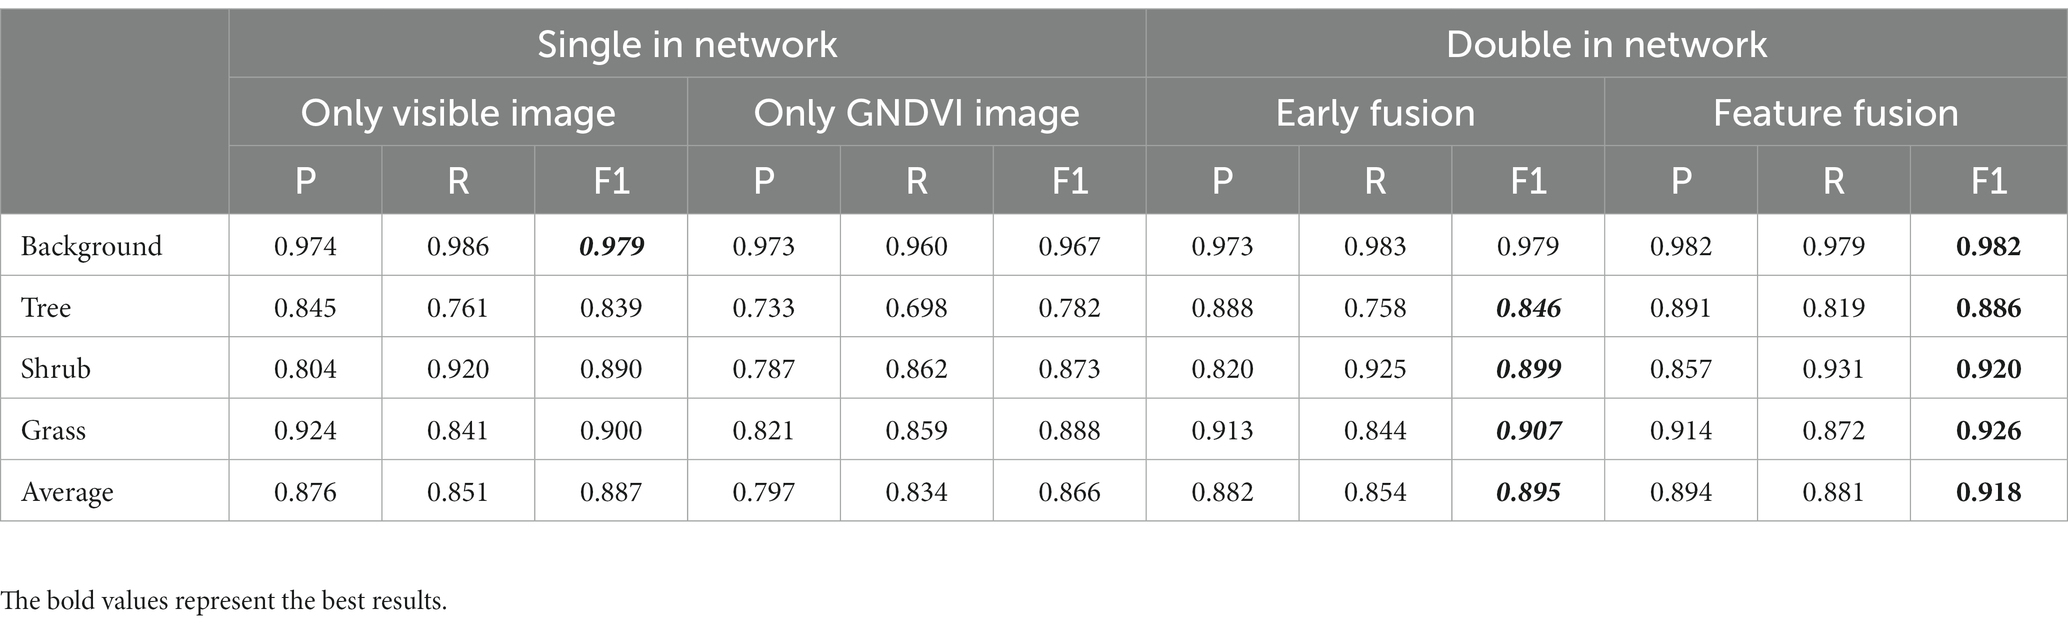
Table 2. Performance analysis of models (units: %).
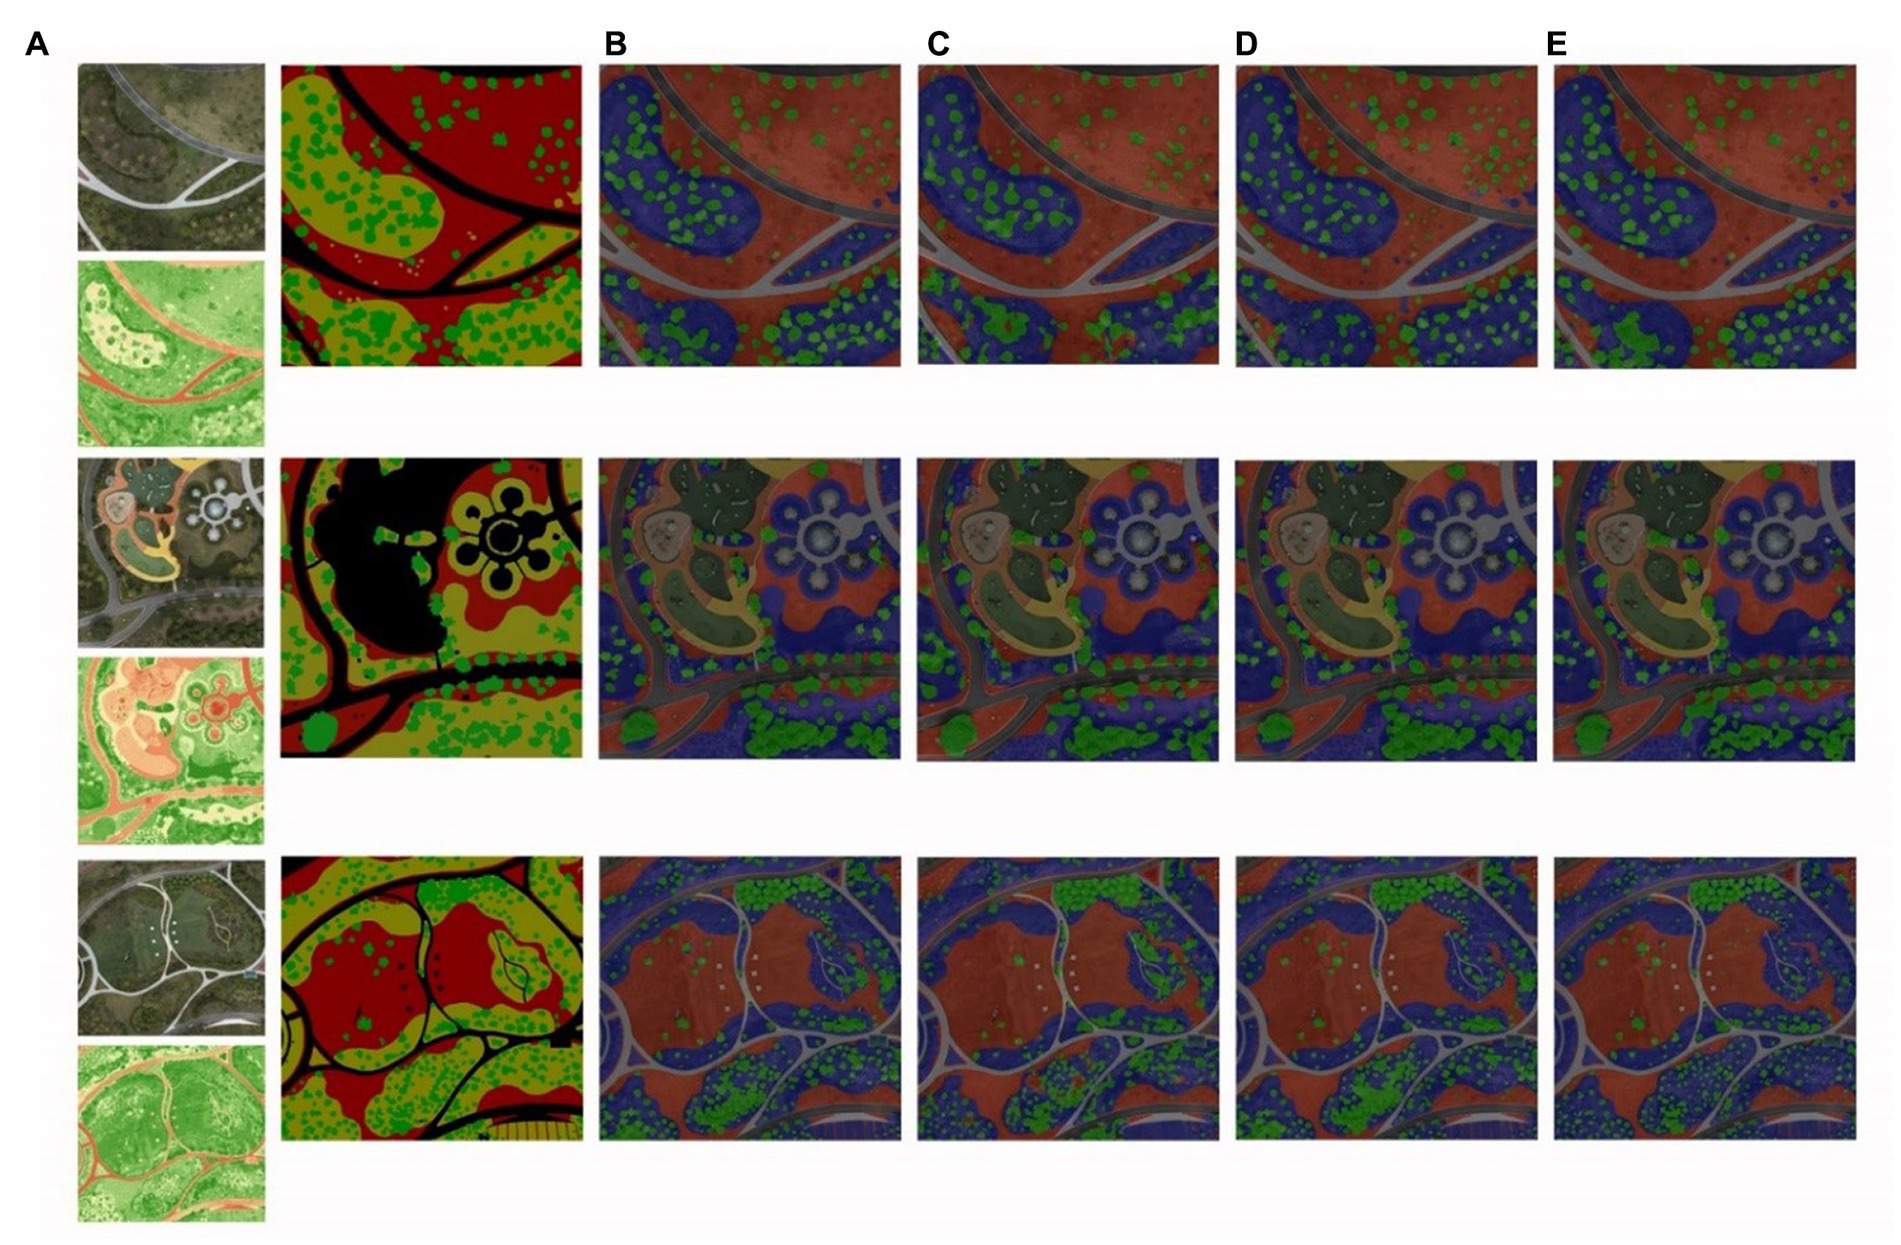
Figure 12. Comparative analysis of various models: (A) visible light image, GNDVI image, and labeled image, (B) only visible light image, (C) only GNDVI image, and (D) early fusion (E) feature fusion.
During the experiment, some deficiencies were found. Our segmentation model could not accurately extract newly planted trees, which did not yet have branches and leaves. For this purpose, we specially selected an area with newly planted trees for evaluating different elevation fusion methods. The patch size was 1,000*1,000, which was almost the worst-performing slice in the original performance evaluation. As shown in Figure 10, three schemes for combining elevation information were compared. We took the representative slice to characterize the ability of our method to recognize the whole scene. For the hard partition based on elevation, as discussed in method 2.7, the classification of shrubs and grass was extremely poor, and some trees were missing, as shown in Figure 10D. For the soft partitioning method in Figure 10E, though most grass vegetation was recognized, there were many recognition failures due to the wrong height condition. We then tested the decision fusion scheme. As shown in Figure 10F, the shrubs and grass maintained the original segmentation results based on the visible and GNDVI images, but the trees were updated. Some areas, such as the red circle, showed a loss of category after optimizing the surrounding background. The wrong background holes caused by tree change were unignorable. Therefore, we optimized the result through decision fusion, and the result is shown in Figure 10G. Obviously, the overall segmentation effect is better.
We evaluated the abovementioned approaches using indicators (Table 3). The original segmentation method achieved the best results on the background. Once elevation information was added, the recognition effectiveness of all vegetation and background decreased, except for trees. This was in line with our expectations. The results of the soft partition, in particular, decreased significantly on shrubs and grass. Combining the advantages of multiple data, our proposed decision fusion based on soft partition not only maintained the ability of visible light and GNDVI data to distinguish among various vegetation but also realized the high-precision identification of trees with the help of elevation. Significant detection improvement, from 0.722 to 0.850, was observed, especially for some bald trees that humans cannot easily detect by color, which proved that our method combining neural network segmentation and elevation was effective.
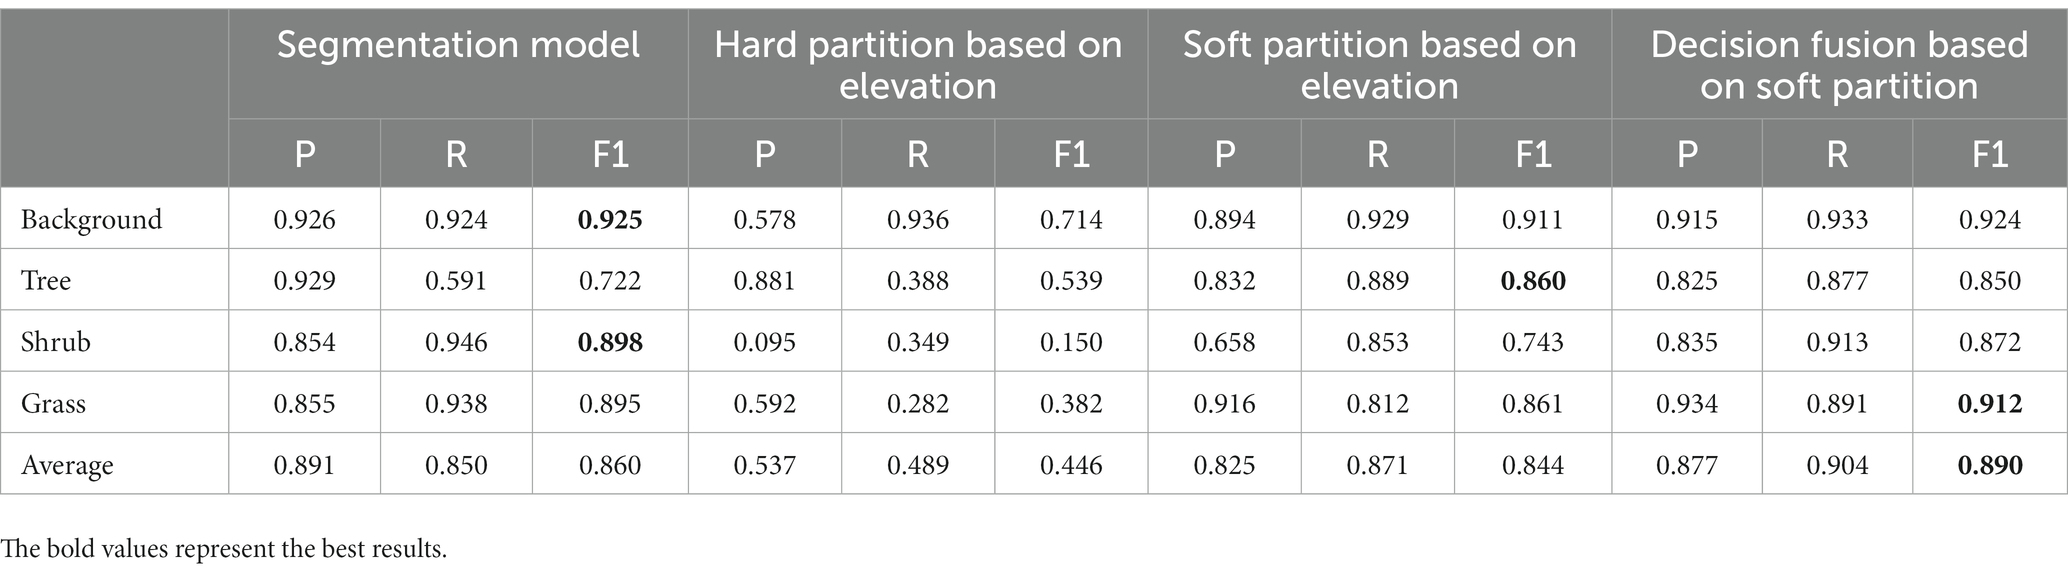
Table 3. Performances of different height-based post-processing methods.
This study primarily focused on the extraction of three objects, namely, trees, shrubs, and ground cover, which exhibit similar color spectra and blurred distribution boundaries, leading to difficulties in their direct detection using the visible light spectrum. In recent years, the integration of information theory in image processing technology has gained prominence, as it suggests that higher digital information variance often yields more valuable information. However, the visible light spectrum, particularly the green wave band, has limited variance in the image information of the targeted vegetation categories. To address this limitation, additional material information is considered to supplement the original information, thereby enhancing the influence of information variance on the subsequent output in an end-to-end network (Jung et al., 2014). In this study, near-infrared wavelength bands were incorporated to increase the information content (Glenn et al., 2010; Zhang and Li, 2016). The Green Normalized Difference Vegetation Index (GNDVI) was chosen as the experimental focus due to its robustness in distinguishing vegetation from non-vegetation and its low sensitivity to soil background variance.
Experimental comparisons between fusion approaches and using only visible images in the same encode-decode network revealed distinct differences in their effectiveness. While using only visible images could separate vegetation from multiple categories, the results differed significantly from those obtained through fusion. Specifically, the recall for trees was 11.83% below the average level, resulting in a significant loss of tree samples. The precision for shrubs was 8.95% lower than the average level, leading to its potential misinterpretations as other categories. These findings highlight the limitations of using only visible images for testing. In contrast, fusion approaches, such as feature fusion, showed notable improvements, with a 7.5% average increase in tree recall and a 4.32% improvement in shrub precision, among other enhancements. A total improvement of 3.49% was observed in the overall F1 scores for trees, shrubs, and groundcover, which increased by 5.60%, 3.37%, and 2.89%, respectively. Notably, the detection of trees was significantly improved after information fusion, indicating that the addition of mutual information between the green and near-infrared spectra improves the network’s capacity to detect vegetation and improves its response to variance information in various categories, enabling better utilization of the red and blue spectral information.
To address the question of whether GNDVI information provides more data than visible images alone, a similar experiment was conducted. The results indicated that using only GNDVI images performed worse than using only visible images. The overall performance of GNDVI input was 2.37% lower, with a decrease of 2.00% in recall and a decrease of 9.02% in precision compared to using visible images alone. Specifically, for trees, the mean recall value decreased from 3.54% to 8.03%, precision increased from 10.58% to 16.31%, and the overall F1 score increased from 5.41% to 9.70%, indicating a significant degradation in performance (Rehman et al., 2022). However, while visible images outperformed GNDVI images in terms of precision and recall, the scenario differed for shrubs, with precision decreasing from 8.22% to 1.25% (compared to the decrease in the mean value), but the mean value of the overall detection rate increased from 0.34% to 0.81%. Similarly, for ground cover, the mean value of the overall detection rate (F1 score) increased from 1.47% to 2.54%. The inferior performance of GNDVI images compared to visible images can be attributed to the limited initial information in GNDVI, which only includes green and infrared spectral information, in contrast to the three-spectral information present in visible images. Particularly for trees, the similarity in the green spectrum makes it challenging to distinguish them from surrounding vegetation. However, despite the performance degradation in tree detection, the improvement observed in shrub and ground cover categories suggests that GNDVI information can effectively enhance the network’s attention toward discriminating large-scale shrubs and ground cover.
Overall, whether using visible images or GNDVI, incorporating fused information into the DANet (Dual Attention Network) yielded superior results compared to using a single type of data. This superiority was reflected in the improved ability to distinguish between vegetation and non-vegetation, as well as in the discrimination of different vegetation materials assisted by the red and blue spectra in visible light, without interference from the green spectrum. Therefore, the fusion-based approach significantly leveraged the strengths of both types of data, leading to enhanced vegetation detection and classification performance.
The accurate detection of urban vegetation plays a critical role in calculating urban carbon storage (Zhang et al., 2022). To accurately estimate carbon sink, it is essential to detect and measure trees, shrubs, and ground cover (IPCC, 2006). The high-precision detection of vegetation in urban parkland addresses the challenge posed by complex vegetation compositions and artificial environments. Consequently, the model developed in this study can be applied to similar urban ecological spaces such as urban green spaces, office parks, and suburban green areas. The precise measurement of carbon sink vegetation facilitates a better understanding of ecological aspects in park restoration projects. Additionally, the GNDVI index can serve as a reference for studying the relationship between vegetation growth and climate change (Morshed and Fattah, 2021). Moreover, the high-precision vegetation detection provided by DANet is valuable for calculating carbon sink in low-carbon office parks. The concept of net-zero emissions extends beyond energy-efficient buildings and encompasses detailed carbon sink calculations for landscapes (Feng and Liu, 1991). In rural and suburban areas, the construction of large parks and ecological woodlands is a widespread global trend. However, these areas often combine elements such as streets, residential areas, and transportation spaces. Therefore, the model developed in this study has the potential to be extensively applied in the construction and assessment of low-carbon rural areas and ecological wilderness parks.
Currently, there is a growing emphasis on low-carbon planning, particularly in comprehensive regional planning initiatives such as the Yangtze River Delta Strategy in China. Many provinces and cities have established explicit indicators for assessing and promoting carbon sinks in urban and forestry planning. By calibrating and optimizing the double-input DANet model with high-precision, multi-resolution remote sensing imagery, more accurate spatial alignment can be achieved for urban planning and management using GIS.
The double-input DANet model proposed in this study can also be applied to the detection and recognition of vegetation in microenvironments and microclimates of green spaces. This has significant implications for calculating indicators proposed by green space administration, such as land scale, heat island intensity, microclimate effects, and growth parameters (Chen B. et al., 2022; Fernández et al., 2022). Furthermore, the model can facilitate spatial studies involving multiresolution street-view images with vegetation (Chen H. S. et al., 2022), which offer better-matching potential compared to low-resolution satellite imagery. Vegetation coverage in microenvironments operates on an even smaller scale than in urban parks, making the model effective in accurately detecting the precise boundary layout of vegetation. Additionally, when combined with dense point cloud elevation data, the model enables comparisons of 3D spatial characteristics, providing valuable references for green vision ratio, view corridors, and the assessment of vegetation growth health, among other aspects. The collection of long-term image data allows for the reasonable assessment of vegetation coverage and growth trends, which are instrumental in municipal vegetation planning and ecological service appraisal.
The focus of the double-input DANet model in this study was primarily on high-resolution data assessment. However, the challenges of image processing in environmental monitoring arise when dealing with low or medium-resolution images, making it even more difficult to differentiate between tree, shrub, and ground cover categories. Therefore, future efforts will be directed toward enhancing the detection capabilities for images with low or medium resolution, with a particular emphasis on capturing detailed features. It is important to note that this neural network-based method relies on big data for optimal performance. Consequently, the model’s ability to distinguish categories may inevitably decline when encountering different scenes or seasonal changes. However, the robustness of the model can be improved through the supplementation of data and consistent training.
Regarding vegetation height, the elevation distribution did not exhibit a linear relationship, and there were instances of regional overlap in the analysis data. Pixel-level height differentiation alone cannot accurately reflect vegetation species, and distinguishing between small trees and tall shrubs, as well as differentiating grass and shrub categories based solely on height, can be challenging. While incorporating height-related matrices into the segmentation model effectively integrates elevation information, it was observed that the performance of shrubs and grass classes was not superior to the original results obtained through image-based interpretation. Moreover, indicators related to the background were less ideal, whereas the tree category experienced a significant improvement.
In terms of information supplementation, this study found that the inclusion of near-infrared or other wave spectrums was still insufficient. In addition to the GNDVI, other scientific calculation plans, such as the LCI (leaf chlorophyll index), NDRE (normalized difference vegetation index), and OSAV (optimized soil-adjusted vegetation index), can be considered to enhance vegetative information. Although this research paper emphasizes the significance of segmenting multiple data into different categories using GNDVI, it acknowledges that other possibilities will be explored in future research. While the double-input DANet model has demonstrated effectiveness in the high-precision detection of vegetation in urban parks, its broad application to carbon sink calculation, assessment of existing vegetation for planting design, and evaluation of urban ecological impacts require specific optimization tailored to different practical projects.
With the increasing emphasis on reducing greenhouse gas emissions and enhancing vegetation carbon sink, the study of biomass estimation for various types of vegetation in urban parks has become a crucial factor in calculating carbon sink in urban green spaces. The accurate detection of vegetation coverage serves as the foundation for such calculations. To address this challenge, a DANet model is proposed, which leverages very high-resolution visible and multispectral images obtained from UAVs equipped with remote sensing cameras. This model significantly improves the high-precision detection of urban park vegetation, thus providing a solution for accurate carbon sink calculations. In the analysis of vegetation elevation, post-processing techniques based on height information can enhance the detection rate of trees from 0.722 to 0.850. However, the effectiveness of these techniques for shrubs and grass categories is not superior to the original results obtained through image-based interpretation. Empirical verification conducted in Jinhai Park demonstrates that the DANet model, employing early fusion and feature fusion approaches, achieves accurate detection rates of 88.6% for trees, 92.0% for shrubs, 92.6% for ground cover, and 91.8% for overall vegetation. These findings provide robust scientific support for subsequent carbon sink calculations and vegetation assessments.
The original contributions presented in the study are included in the article/supplementary material, further inquiries can be directed to the corresponding author.
WW: conceptualization, investigation, visualization, data curation, and writing—review and editing. JC: software, modeling, and data curation. NW: methodology, validation, supervision, writing-draft, review and editing, data curation, and funding acquisition. YQ: writing—review and editing. All authors contributed to the article and approved the submitted version.
This work was supported by the National Science Foundation of China (grant number 72104106).
WW was employed by Jizhi Architecture Planning and Design Co., Ltd.
The remaining authors declare that the research was conducted in the absence of any commercial or financial relationships that could be construed as a potential conflict of interest.
All claims expressed in this article are solely those of the authors and do not necessarily represent those of their affiliated organizations, or those of the publisher, the editors and the reviewers. Any product that may be evaluated in this article, or claim that may be made by its manufacturer, is not guaranteed or endorsed by the publisher.
Abdollahi, A., and Pradhan, B. (2021). Urban vegetation mapping from aerial imagery using explainable AI (XAI). Sensors 21:4738. doi: 10.3390/s21144738
Alonzo, M., McFadden, J. P., Nowak, D. J., and Roberts, D. A. (2016). Mapping urban forest structure and function using hyperspectral imagery and lidar data. Urban For. Urban Green. 17, 135–147. doi: 10.1016/j.ufug.2016.04.003
Amro, I., Mateos, J., Vega, M., Molina, R., and Katsaggelos, A. K. (2011). A survey of classical methods and new trends in pansharpening of multispectral images. EURASIP J Adv Signal Process 2011, 1–22. doi: 10.1186/1687-6180-2011-79
Anchang, J. Y., Ananga, E. O., and Pu, R. (2016). An efficient unsupervised index based approach for mapping urban vegetation from IKONOS imagery. Int. J. Appl. Earth Obs. Geoinf. 50, 211–220. doi: 10.1016/j.jag.2016.04.001
Biswas, S., Huang, Q., Anand, A., Mon, M. S., Arnold, F. E., and Leimgruber, P. (2020). A multi sensor approach to Forest type mapping for advancing monitoring of sustainable development goals (SDG) in Myanmar. Remote Sens. (Basel) 12:3220. doi: 10.3390/rs12193220
Casalegno, S., Anderson, K., Hancock, S., and Gaston, K. J. (2017). Improving models of urban greenspace: from vegetation surface cover to volumetric survey, using waveform laser scanning. Methods Ecol. Evol. 8, 1443–1452. doi: 10.1111/2041-210x.12794
Castillejo-González, I. L., López-Granados, F., García-Ferrer, A., Peña-Barragán, J. M., Jurado-Expósito, M., de la Orden, M. S., et al. (2009). Object- and pixel-based analysis for mapping crops and their agro-environmental associated measures using QuickBird imagery. Comput. Electron. Agric. 68, 207–215. doi: 10.1016/j.compag.2009.06.004
Chakraborty, M., Khot, L. R., and Peters, R. T. (2020). Assessing suitability of modified center pivot irrigation systems in corn production using low altitude aerial imaging techniques. Information Process Agricult 7, 41–49. doi: 10.1016/j.inpa.2019.06.001
Chen, B., Feng, Q., Niu, B., Yan, F., Gao, B., Yang, J., et al. (2022a). Multi-modal fusion of satellite and street-view images for urban village classification based on a dual-branch deep neural network. Int. J. Appl. Earth Obs. Geoinf. 109:102794. doi: 10.1016/j.jag.2022.102794
Chen, H. S., Lin, Y. C., and Chiueh, P. T. (2022b). High-resolution spatial analysis for the air quality regulation service from urban vegetation: a case study of Taipei City. Sustain. Cities Soc. 83:103976. doi: 10.1016/j.scs.2022.103976
Cheng, F., Tian, J., He, J., He, H., Liu, G., Zhang, Z., et al. (2023). The spatial and temporal distribution of China’s forest carbon. Front. Ecol. Evol. 11:1110594. doi: 10.3389/fevo.2023.1110594
Chivasa, W., Mutanga, O., and Burgueño, J. (2021). UAV-based high-throughput phenotyping to increase prediction and selection accuracy in maize varieties under artificial MSV inoculation. Comput. Electron. Agric. 184:106128. doi: 10.1016/j.compag.2021.106128
Dunea, D., Bretcan, P., Purcoi, L., Tanislav, D., Serban, G., Neagoe, A., et al. (2021). Effects of riparian vegetation on evapotranspiration processes and water quality of small plain streams. Ecohydrol Hydrobiol 21, 629–640. doi: 10.1016/j.ecohyd.2021.02.004
Escobedo, F., Varela, S., Zhao, M., Wagner, J. E., and Zipperer, W. (2010). Analyzing the efficacy of subtropical urban forests in offsetting carbon emissions from cities. Environ. Sci. Policy 13, 362–372. doi: 10.1016/j.envsci.2010.03.009
Feng, J. Z., and Liu, B. Y. (1991). Rationalization: research on the census method of landscape resources. Architect J 05, 38–43.
Fernández, I., Pérez-Silva, R., and Villalobos-Araya, E. (2022). Vegetation cover within and around schools in Santiago de Chile: are schools helping to mitigate urban vegetation inequalities? Urban For. Urban Green. 70:127520. doi: 10.1016/j.ufug.2022.127520
Glenn, E. P., Nagler, P. L., and Huete, A. R. (2010). Vegetation index methods for estimating evapotranspiration by remote sensing. Surv. Geophys. 31, 531–555. doi: 10.1007/s10712-010-9102-2
Hinton, G. E., Osindero, S., and Teh, Y. W. (2006). A fast learning algorithm for deep belief nets. Neural Comput. 18, 1527–1554. doi: 10.1162/neco.2006.18.7.1527
Hirayama, H., Sharma, R. C., Tomita, M., and Hara, K. (2018). Evaluating multiple classifier system for the reduction of salt-and-pepper noise in the classification of very-high-resolution satellite images. Int. J. Remote Sens. 40, 2542–2557. doi: 10.1080/01431161.2018.1528400
Hsieh, P. F., Lee, L. C., and Chen, N. Y. (2001). Effect of spatial resolution on classification errors of pure and mixed pixels in remote sensing. IEEE Trans. Geosci. Remote Sens. 39, 2657–2663. doi: 10.1109/36.975000
Huang, F., Huang, W. L., and Wu, X. Y. (2021). Pan-sharpening algorithm based on spatial and spectral information preservation. J Fuzhou Univ 03, 285–294.
Huang, Z. H., Li, W. J., Wang, J., and Zhang, T. (2015). Face recognition based on pixel-level and feature-level fusion of the top-level’s wavelet sub-bands. Information Fusion 22, 95–104. doi: 10.1016/j.inffus.2014.06.001
Huang, K., Peng, L., Wang, X., and Chen, T. (2022). Integrating landscape connectivity and natural-anthropogenic interaction to understand karst vegetation restoration: a case study of Guizhou Province, China. Front. Ecol. Evol. 10:844437. doi: 10.3389/fevo.2022.844437
IPCC. (2006). Guidelines for National Greenhouse gas Inventories. Available at: https://www.ipcc.ch/report/2006-ipcc-guidelines-for-national-greenhouse-gas-inventories/
IPCC. (2022). Climate change 2022: Mitigation of climate change. Available at: https://www.ipcc.ch/report/ar6/wg3/
Jia, X. P., and Richards, J. (2002). Cluster-space representation for hyperspectral data classification. IEEE Trans. Geosci. Remote Sens. 40, 593–598. doi: 10.1109/tgrs.2002.1000319
Jung, T., Vogiatzian, F., Har-Shemesh, O., Fitzsimons, C., and Quax, R. (2014). Applying information theory to neuronal networks: from theory to experiments. Entropy 16, 5721–5737. doi: 10.3390/e16115721
Li, S., Kang, X., Fang, L., Hu, J., and Yin, H. (2017). Pixel-level image fusion: a survey of the state of the art. Information Fusion 33, 100–112. doi: 10.1016/j.inffus.2016.05.004
Liu, Y., Chen, X., Wang, Z., Wang, Z. J., Ward, R. K., and Wang, X. (2018). Deep learning for pixel-level image fusion: recent advances and future prospects. Information Fusion 42, 158–173. doi: 10.1016/j.inffus.2017.10.007
Liu, X., Jiao, L., Zhao, J., Zhao, J., Zhang, D., Liu, F., et al. (2018). Deep multiple instance learning-based spatial–spectral classification for PAN and MS imagery. IEEE Trans. Geosci. Remote Sens. 56, 461–473. doi: 10.1109/tgrs.2017.2750220
Liu, B. Y., and Wang, N. (2010). New type of human settlements construction research of arid area in West China responding to climate change. Chin Landscape Architect 08, 8–12.
Liu, B. Y., and Wang, N. (2015). Ecological water-green win-win spatial modes of semi-arid area in loess plateau. J Hum Settlements West China 04, 23–28. doi: 10.13791/j.cnki.hsfwest.20150406
Łuców, D., Lamentowicz, M., Kołaczek, P., Łokas, E., Marcisz, K., Obremska, M., et al. (2021). Pine Forest management and disturbance in northern Poland: combining high-resolution 100-year-old Paleoecological and remote sensing data. Front. Ecol. Evol. 9:898. doi: 10.3389/fevo.2021.747976
Mao, T., Tang, H., Wu, J., Jiang, W., He, S., and Shu, Y. (2016). A generalized metaphor of Chinese restaurant franchise to fusing both panchromatic and multispectral images for unsupervised classification. IEEE Trans. Geosci. Remote Sens. 54, 4594–4604. doi: 10.1109/tgrs.2016.2545927
Masi, G., Cozzolino, D., Verdoliva, L., and Scarpa, G. (2016). Pansharpening by convolutional neural networks. Remote Sens. (Basel) 8:594. doi: 10.3390/rs8070594
Miao, C., Cui, A., Xiong, Z., Hu, Y., Chen, W., and He, X. (2022). Vertical evaluation of air quality improvement by urban forest using unmanned aerial vehicles. Front. Ecol. Evol. 10:937. doi: 10.3389/fevo.2022.1045937
Morshed, S. R., and Fattah, M. A. (2021). Responses of spatiotemporal vegetative land cover to meteorological changes in Bangladesh. Remote Sens Appl 24:100658. doi: 10.1016/j.rsase.2021.100658
Moser, G., De Giorgi, A., and Serpico, S. B. (2016). Multiresolution supervised classification of panchromatic and multispectral images by Markov random fields and graph cuts. IEEE Trans. Geosci. Remote Sens. 54, 5054–5070. doi: 10.1109/tgrs.2016.2547027
Moser, G., and Serpico, S. B. (2011). “Joint classification of panchromatic and multispectral images by multiresolution fusion through Markov random fields and graph cuts” in 2011 17th international conference on digital signal processing (DSP) (IEEE), 1–8.
Munechika, C. K., Warnick, J. S., Salvaggio, C., and Schott, J. R. (1993). Resolution enhancement of multispectral image data to improve classification accuracy. Photogramm. Eng. Remote. Sens. 59, 67–72.
Myint, S. W. (2006). Urban vegetation mapping using sub-pixel analysis and expert system rules: a critical approach. Int. J. Remote Sens. 27, 2645–2665. doi: 10.1080/01431160500534630
Pu, R., Landry, S., and Yu, Q. (2011). Object-based urban detailed land cover classification with high spatial resolution IKONOS imagery. Int. J. Remote Sens. 32, 3285–3308. doi: 10.1080/01431161003745657
Quiros, E., Polo, M. E., and Fragoso-Campon, L. (2021). GEDI elevation accuracy assessment: a case study of Southwest Spain. IEEE J Select Topics Appl Earth Observ Remote Sens 14, 5285–5299. doi: 10.1109/jstars.2021.3080711
Rehman, Z., Khalid, U., Ijaz, N., Mujtaba, H., Haider, A., Farooq, K., et al. (2022). Machine learning-based intelligent modeling of hydraulic conductivity of sandy soils considering a wide range of grain sizes. Eng. Geol. 311:106899. doi: 10.1016/j.enggeo.2022.106899
Ren, Z., Zheng, H., He, X., Zhang, D., Yu, X., and Shen, G. (2015). Spatial estimation of urban forest structures with Landsat TM data and field measurements. Urban For. Urban Green. 14, 336–344. doi: 10.1016/j.ufug.2015.03.008
Richards, D. R., and Belcher, R. N. (2019). Global changes in urban vegetation cover. Remote Sens. (Basel) 12:23. doi: 10.3390/rs12010023
Rumora, L., Majić, I., Miler, M., and Medak, D. (2020). Spatial video remote sensing for urban vegetation mapping using vegetation indices. Urban Ecosyst. 24, 21–33. doi: 10.1007/s11252-020-01002-5
Shackelford, A., and Davis, C. (2003). A hierarchical fuzzy classification approach for high-resolution multispectral data over urban areas. IEEE Trans. Geosci. Remote Sens. 41, 1920–1932. doi: 10.1109/tgrs.2003.814627
Shingare, P. P., Hemane, P. M., and Dandekar, D. S. (2014). “Fusion classification of multispectral and panchromatic image using improved decision tree algorithm” in In 2014 international conference on signal propagation and computer technology (ICSPCT 2014) (IEEE), 598–603.
Song, P., Zheng, X., Li, Y., Zhang, K., Huang, J., Li, H., et al. (2020). Estimating reed loss caused by Locusta migratoria manilensis using UAV-based hyperspectral data. Sci. Total Environ. 719:137519. doi: 10.1016/j.scitotenv.2020.137519
Soundararajan, R., and Bovik, A. C. (2013). Survey of information theory in visual quality assessment. SIViP 7, 391–401. doi: 10.1007/s11760-013-0442-5
Taddeo, S., Dronova, I., and Depsky, N. (2019). Spectral vegetation indices of wetland greenness: responses to vegetation structure, composition, and spatial distribution. Remote Sens. Environ. 234:111467. doi: 10.1016/j.rse.2019.111467
Wang, V., and Gao, J. (2019). Importance of structural and spectral parameters in modelling the aboveground carbon stock of urban vegetation. Int. J. Appl. Earth Obs. Geoinf. 78, 93–101. doi: 10.1016/j.jag.2019.01.017
Wang, N., Wei, W. X., and Liu, B. Y. (2021). Walking and jogging physical activity efficiency Oriented Park trail design: a case study of Park Trail in Nanjing Fishmouth Wetland Park. Chin Landscape Architect 02, 48–53. doi: 10.19775/j.cla.2021.02.0048
Yao, J. H., Wu, J. M., Yang, Y., and Shi, Z. X. (2020). Segmentation in multi-spectral remote sensing images using the fully convolutional neural network. J Image Graph 01, 180–192.
Yi, S., Li, J., and Yuan, X. (2021). DFPGAN: dual fusion path generative adversarial network for infrared and visible image fusion. Infrared Phys. Technol. 119:103947. doi: 10.1016/j.infrared.2021.103947
Yu, T. Y., Ni, W. J., Liu, J. L., and Zhang, Z. Y. (2021). Detection of scattered dead standing trees based on UAV visible images acquired in the Daxinganling Forest. Natl Remote Sens Bull 03, 725–736.
Yuan, Y., Sun, B., and Liu, G. (2022). Dual attention and dual fusion: an accurate way of image-based geo-localization. Neurocomputing 500, 965–977. doi: 10.1016/j.neucom.2022.05.013
Zhang, X., Feng, X., and Jiang, H. (2010). Object-oriented method for urban vegetation mapping using IKONOS imagery. Int. J. Remote Sens. 31, 177–196. doi: 10.1080/01431160902882603
Zhang, Z., Gao, X., Zhang, S., Gao, H., Huang, J., Sun, S., et al. (2022). Urban development enhances soil organic carbon storage through increasing urban vegetation. J. Environ. Manage. 312:114922. doi: 10.1016/j.jenvman.2022.114922
Zhang, L., and Li, J. (2016). Development and prospect of sparse representation-based hyperspectral image processing and analysis. J. Remote Sens 20, 1091–1101.
Zhang, J., Li, T., Lu, X., and Cheng, Z. (2016). Semantic classification of high-resolution remote-sensing images based on mid-level features. IEEE J Selected Topics Appl Earth Observ Remote Sens 9, 2343–2353. doi: 10.1109/jstars.2016.2536943
Zhao, S., Jiang, X., Li, G., Chen, Y., and Lu, D. (2021). Integration of ZiYuan-3 multispectral and stereo imagery for mapping urban vegetation using the hierarchy-based classifier. Int. J. Appl. Earth Obs. Geoinf. 105:102594. doi: 10.1016/j.jag.2021.102594
Zhao, W., Jiao, L., Ma, W., Zhao, J., Zhao, J., Liu, H., et al. (2017). Superpixel-based multiple local CNN for panchromatic and multispectral image classification. IEEE Trans. Geosci. Remote Sens. 55, 4141–4156. doi: 10.1109/tgrs.2017.2689018
Zhong, J., Yang, B., Huang, G., Zhong, F., and Chen, Z. (2016). Remote sensing image fusion with convolutional neural network. Sens Imaging 17, 1–16. doi: 10.1007/s11220-016-0135-6
Zhou, E. S., Wei, W. X., and Wang, N. (2022). Application of RTK multispectral remote sensing technology in carbon sink measurement of urban parks. Xiandai Horticult 09, 47–49. doi: 10.14051/j.cnki.xdyy.2022.09.003
Keywords: convolutional neural network, dual-attention, high-precision detection, landscape carbon sink, multispectral remote sensing, urban park vegetation
Citation: Wei W, Cao J, Wang N and Qian Y (2023) Multispectral remote sensing and DANet model improve the precision of urban park vegetation detection: an empirical study in Jinhai Park, Shanghai. Front. Ecol. Evol. 11:1185911. doi: 10.3389/fevo.2023.1185911
Edited by:
Guojie Wang, Nanjing University of Information Science and Technology, ChinaReviewed by:
Milad Janalipour, Ministry of Science, Research, and Technology, IranCopyright © 2023 Wei, Cao, Wang and Qian. This is an open-access article distributed under the terms of the Creative Commons Attribution License (CC BY). The use, distribution or reproduction in other forums is permitted, provided the original author(s) and the copyright owner(s) are credited and that the original publication in this journal is cited, in accordance with accepted academic practice. No use, distribution or reproduction is permitted which does not comply with these terms.
*Correspondence: Nan Wang, c2luZHl3YW5nMTIxNUBxcS5jb20=
Disclaimer: All claims expressed in this article are solely those of the authors and do not necessarily represent those of their affiliated organizations, or those of the publisher, the editors and the reviewers. Any product that may be evaluated in this article or claim that may be made by its manufacturer is not guaranteed or endorsed by the publisher.
Research integrity at Frontiers
Learn more about the work of our research integrity team to safeguard the quality of each article we publish.