 Yanfang Lyu
 Leifeng Zhang
 Dong Wang
- 1School of Statistics, Institute of Quantitative Economics, Huaqiao University, Xiamen, China
- 2School of Business, Minnan Normal University, Zhangzhou, China
Carbon emissions from human activities are the main cause of climate warming. Under the background of economic and social digital transformation, accurately assessing the carbon emission reduction effect of the development of the digital economy is of great significance for countries to deal with climate warming in the post-COVID-19 era. This paper constructs a dynamic evaluation model of orthogonal projection to measure the level of digital economy development at the provincial level in China from 2007 to 2019. On this basis, the panel fixed effects model and mediation model are used to empirically test the impact of digital economy development on carbon emission intensity and its mechanism. The results indicate that: (1) The development of China’s digital economy is unbalanced among regions, showing a geospatial pattern of decreasing from east to west. (2) China’s carbon emission intensity has a trend of decreasing year by year, and there are geospatial differences of “high in the west and low in the east” and “high in the north and low in the south.” (3) The digital economy development can effectively reduce regional carbon emission intensity through industrial structure optimization effect and resource allocation effect, and the industrial structure optimization effect can suppress carbon emission intensity more obviously. (4) The development of digital economy in different regions has different degrees of reducing carbon emission intensity. The development of digital economy in the eastern region has a stronger inhibitory effect on carbon emission intensity than that in the middle and western regions, and the development of digital economy in economically developed regions can suppress carbon emission intensity more. This paper provides enlightenment for policy makers to deal with climate warming.
1. Introduction
Global warming has seriously affected the living environment of human beings, and coping with climate warming has become a common issue faced by all countries in the world (Liu et al., 2021). Existing studies have shown that carbon dioxide emitted by human economic activities is the main cause of climate warming (An et al., 2021). Therefore, controlling carbon dioxide emissions is the main way for countries around the world to cope with climate warming. As the world’s second largest economy, China is a major emitter of global carbon dioxide (Yu et al., 2021). According to statistics from the British Petroleum database, China’s carbon emissions reached 6.926 billion tons in 2006, surpassing the United States to become the world’s largest carbon emitter; and in 2021, China’s carbon emissions rose to 10.523 billion tons, accounting for about 33% of global carbon emissions. As a responsible major country, China has taken the initiative to take responsibility for carbon emission reduction. At the seventy-fifth session of the United Nations General Assembly, the Chinese government made it clear: “China strives to achieve carbon peak by 2030 and achieve carbon neutrality by 2060.” The proposal of the “dual carbon goal” shows China’s determination to cope with climate warming, which is also in line with the green development concept advocated by China (Wang et al., 2023). However, according to the enlightenment brought by the environmental Kuznets curve and the practical experience of the carbon emission reduction process of developed countries, there are multiple challenges in achieving the “dual carbon goal” in China (Shi et al., 2021). Compared with developed countries, China not only faces the pressure of carbon emission growth brought by incremental energy demand, but also needs to improve the low-carbon substitution of stock energy. At the same time, the huge development differences between regions in China also constitute the constraints of achieving the “dual carbon goal” (Guo et al., 2023).
It is worth noting that the systematic promotion stage of the “dual carbon goal” is also the stage of rapid development of the digital economy. At present, digital technology represented by information and communication technology, cloud computing, the Internet and artificial intelligence has made innovative breakthroughs and achieved deep integration with the real economy. According to the White Paper on the Development of China’s Digital Economy (2022), the scale of China’s digital economy accounted for more than 1/3 of the gross domestic product (GDP) in 2021, and the average annual growth rate was higher than the growth rate of GDP. With the rapid development of the digital economy, the environmental effects of the digital economy have received extensive attention from the academic community. Some scholars believe that the information and communication technology industry and e-commerce industry in the digital economy, as environmentally friendly industries, can optimize the industrial structure by squeezing out industries with high energy consumption and high emissions, thus promoting economic and social low-carbon development (Zhang W. et al., 2022; Lyu et al., 2023). Other scholars believe that the wide application of digital technology increases electricity consumption and thus has a negative impact on the environment (Salahuddin and Alam, 2015; Lin and Huang, 2023). So, what is the impact of digital economy development on carbon emission intensity? What is its impact mechanism? Clarifying this issue not only helps to accurately assess the carbon emission reduction effect of the digital economy, but also provides useful suggestions for China to achieve the “dual carbon goal.”
Based on this, this paper measures the carbon emission intensity of Chinese provinces in 2007–2019 under the IPCC sectoral accounting algorithm. In addition, a framework for measuring the development level of digital economy development at the provincial level in China was constructed, and a dynamic evaluation method based on orthogonal projection was used to measure the development level of digital economy in 30 provinces (excluding Tibet, Hong Kong, Macao, and Taiwan) in China. On the basis of examining the evolution trend of China’s regional carbon emission intensity and digital economy development level, the panel fixed effects model and mediation model were used to empirically test the impact and mechanism of digital economy development on carbon emission intensity.
The possible contributions of this paper are as follows: First, this paper incorporates the digital economy and carbon emission intensity into the same analytical framework, and divides the development of the digital economy into the digital industrialization dimension and the industrial digitization dimension, and respectively examines their impact on carbon emission intensity. Second, this paper constructs the index system of digital economy development level at the provincial level, and uses the dynamic evaluation method based on orthogonal projection to measure the digital economy development level of each province in China, which enriches the research content of existing digital economy measurement. Third, this paper further examines the impact mechanism of digital economy development on carbon emission intensity, and finds that digital economy reduces carbon emission intensity through industrial structure optimization effect and resource allocation effect.
2. Literature review and theoretical hypothesis
2.1. Digital economy development and carbon emission intensity
With the increasing prominence of global warming, carbon emission reduction has received continuous attention from the academic community (Liu et al., 2021; Yi et al., 2022). Among them, the influencing factors of carbon emissions are the focus of scholars’ research (Liu et al., 2022). Domestic and foreign scholars have discussed the influencing factors of carbon emissions with different methods and from different angles (Cai et al., 2021; He et al., 2022). Scholars mainly use Kaya identity (Ma and Cai, 2018; Eskander and Nitschke, 2021), Divisia index method (Ma and Cai, 2018; Eskander and Nitschke, 2021), and Laspeyres index decomposition method (González and Martínez, 2012; Chen et al., 2021) decompose the influencing factors of carbon emissions. Although the conclusions of different methods are different, it is generally believed that technological innovation (Zhang G. et al., 2022), energy structure (Pui and Othman, 2019), industrial structure (Han and Jiang, 2022), and economic growth (Xiao and Peng, 2023) are the main factors affecting carbon emissions.
With the development of the digital economy, scholars have begun to pay attention to the relationship between the digital economy and carbon emissions (Yang et al., 2022). The relationship between digital economy development and carbon emissions is complex. The development of digital economy has both positive and negative effects on the environment (Moyer and Hughes, 2012; Dong et al., 2022). Although the application of digital technology improves the efficiency of energy conservation and emission reduction and reduces the loss in the production process, the expansion of production scale increases energy demand and may lead to an increase in total carbon emissions (Zhou et al., 2019; Wang et al., 2022b). Andrae and Edler (2015) found that the rapid development of information and communication technology (ICT) has been accompanied by an exponential increase in total carbon emissions. Salahuddin and Alam (2015) argued that the wide application of digital technology has increased data generation, transmission and processing, resulting in an increase in demand for electricity, which in turn increases carbon emissions.
Other scholars believe that the industrial linkage emission reduction effect produced by the development of the digital economy plays a greater role than the incremental effect of energy consumption (Koomey et al., 2013; Yi et al., 2022). Yi et al. (2022) used provincial panel data to evaluate the relationship between digital economy and carbon emissions, and found that the development of digital economy has significant carbon emission reduction effects. The research of Niu et al. (2022) shows that digital investment improves energy efficiency, which in turn reduces carbon emissions in the production process. Zhang W. et al. (2022) believes that the development of the digital economy has produced more new clean industries, which has a crowding-out effect on industries with high energy consumption and high emissions, thereby reducing carbon emissions. Han and Jiang (2022) further examined the relationship between digital economy and carbon production efficiency, and found that the digital economy development reduced energy consumption per unit of GDP and improved carbon productivity. Based on the differences in the existing research conclusions, this paper further examines the environmental effects of the development of digital economy. Different from the existing research, this paper examines the impact and mechanism of digital economy development on carbon emission intensity from the regional level, and further considers the heterogeneity of geospatial differences and economic development differences. Based on the above literature conclusions, this paper proposes hypothesis 1.
H1: The digital economy development has positive and negative effects on carbon emissions, but an inhibitory effect on regional carbon emission intensity.
2.2. Impact mechanism of digital economy development on carbon emission intensity
As a new economic form, digital economy has become a new driving force for the upgrading of industrial structure (Chen et al., 2022). Existing research shows that the digital economy promotes the upgrading of industrial structure through industrial integration effect and technology diffusion effect (Hao et al., 2023). The internal logic of industrial upgrading shows that the emergence of new industries and new models will gradually replace traditional industries and traditional economic models, and drive the upgrading of traditional industries through input-output linkages, thus realizing the comprehensive optimization of industrial structure. In the digital age, the speed of technology diffusion and change is faster than ever before, which provides favorable conditions for industrial organization innovation, but also enhances the competition mechanism and promotes the continuous optimization of industrial organization (Tang and Li, 2022). Industrial digitalization will also accelerate the elimination of inefficient enterprises, thereby improving the overall production efficiency of the industry and realizing the optimization of the industrial structure. The optimization of industrial structure improves the efficiency of energy utilization, which has a positive impact on reducing carbon emission intensity (Hao et al., 2023). Based on this, hypothesis 2 is proposed.
H2: The digital economy development reduces carbon emission intensity by optimizing industrial structure.
The internal structure of economic form determines the efficiency of resource allocation, and the allocation and combination mode of various production factors is the main factor affecting carbon emission intensity (Wang et al., 2021). Under the digital economic form, economic entities can obtain more adequate market information, and the matching between supply and demand is more accurate, which can improve the resource search efficiency of market entities (Wu et al., 2022). At the same time, the application of digital technology can improve the utilization efficiency of production factors by optimizing the production process (Zhang Z. et al., 2022). Intelligent production process reduces energy waste, and improves energy utilization. Digital economy improves resource allocation by improving resource search and resource utilization efficiency, which helps to reduce undesired output in the production process and reduce carbon emission intensity (Chen, 2022). Based on this, hypothesis 3 is proposed.
H3: The digital economy development reduces carbon emission intensity by improving resource allocation.
Digital industrialization and industrial digitization provide a collaborative environment for innovation activities and accelerate the progress of carbon emission reduction technology (Yin and Yu, 2022). The improvement of innovation efficiency depends on the efficient interconnection of information (Niu et al., 2023). The digital economy based on information and communication technology provides an efficient way for innovation subjects to obtain information and enriches the information resource elements needed for innovation (Kohli and Melville, 2019). In addition, the improvement of innovation efficiency requires efficient collaboration between innovation subjects (Zhuo and Chen, 2023). Compared with the traditional economic form, the digital economy makes the innovation subjects more closely linked and more likely to produce collaborative innovation effects (Li et al., 2023). The application of digital innovation achievements in traditional production methods has an indirect impact on improving efficiency and reducing pollution (Gao et al., 2022). Based on this, hypothesis 4 is proposed.
H4: The digital economy development reduces carbon emission intensity by improving innovation efficiency.
3. Materials and methods
3.1. Measurement of level of digital economy development
3.1.1. Method
In order to ensure the objectivity and accuracy of the measurement results, and consider the degree of difference of the evaluation index values, this paper uses a dynamic evaluation method based on orthogonal projection to measure the digital economy development level of 30 provinces in China.
It is assumed that the digital economy development level of v1,v2,…,vn in a period of time should be measured. Therefore, it is necessary to collect the original data of all the evaluated objects, which includes m indicators during t1,t2,…,tN. Based on this, the panel data matrix xij(tk)(i = 1,2,…,n;j = 1,2,…,m;k = 1,2,…,N) can be obtained. Since the dimensions are different between the data, the original data needs to be adjusted to dimensionless. This paper uses a globally improved normalization method to process the data, which results in a standardized matrix Y(tk) = yij(tk). In the process of calculating the weighted normalization matrix, this paper first uses the entropy value method to determine the index weight, and then determines the ideal solution and the negative ideal solution. In all periods and all evaluated objects, the maximum value of the j -item indicator is called the ideal solution of the indicator, while the minimum value is called the negative ideal solution of the indicator. Finally, the “vertical” distance Pi(tk) of the ideal solution of each region is calculated. For each evaluated object, the distance between the negative ideal solution and the ideal solution is constant, so there are:
where a represents the ideal solution F+ after translation, that is, vector, and b represents the negative ideal solution F− after translation. Further simplifying Equation 1, we can get:
where Pi(tk) values are smaller, the better. The Pi(tk) is standardized to obtain the final evaluation value. After standardization Pi(tk) becomes , as follows:
where is the dynamic evaluation score of the evaluated object i in period tk. Further, pairs are weighted twice to calculate the comprehensive evaluation score of the evaluated object i in the period from t1 to tN. Based on the research of Zhu and Lei (2012), the time weight (wk) is calculated by using the idea of “thick today and thin ancient”. That is, within the time period [t1,tN], the weight of the tk period is as follows:
where, and wk > 0. According to the Equation 4, the weight values at different times can be calculated, and then the secondary weighted weight value can be obtained. Therefore, the total evaluation value si of i in the time period [t1,tN] is:
where, wk represents the time weight value at time tk; represents the evaluation value of evaluation object i at the tk moment, and its size and ranking can be calculated by Equation 3. The evaluation value and total ranking of the ith evaluation object in the time period [t1,tN] can be calculated by Equation 5.
3.1.2. Indicators
Based on the consideration of the comprehensiveness, representativeness and availability of evaluation indicators, and combined with relevant literature (Chen et al., 2022; Wang et al., 2022a; Zhang L. et al., 2022), this paper constructs the measurement system of digital economy development in various provinces in China around digital industrialization and industrial digitalization, and the specific indicators are shown in Table 1. The data comes from the “China Statistical Yearbook,” “China Information Yearbook,” and CSMAR digital economy database.
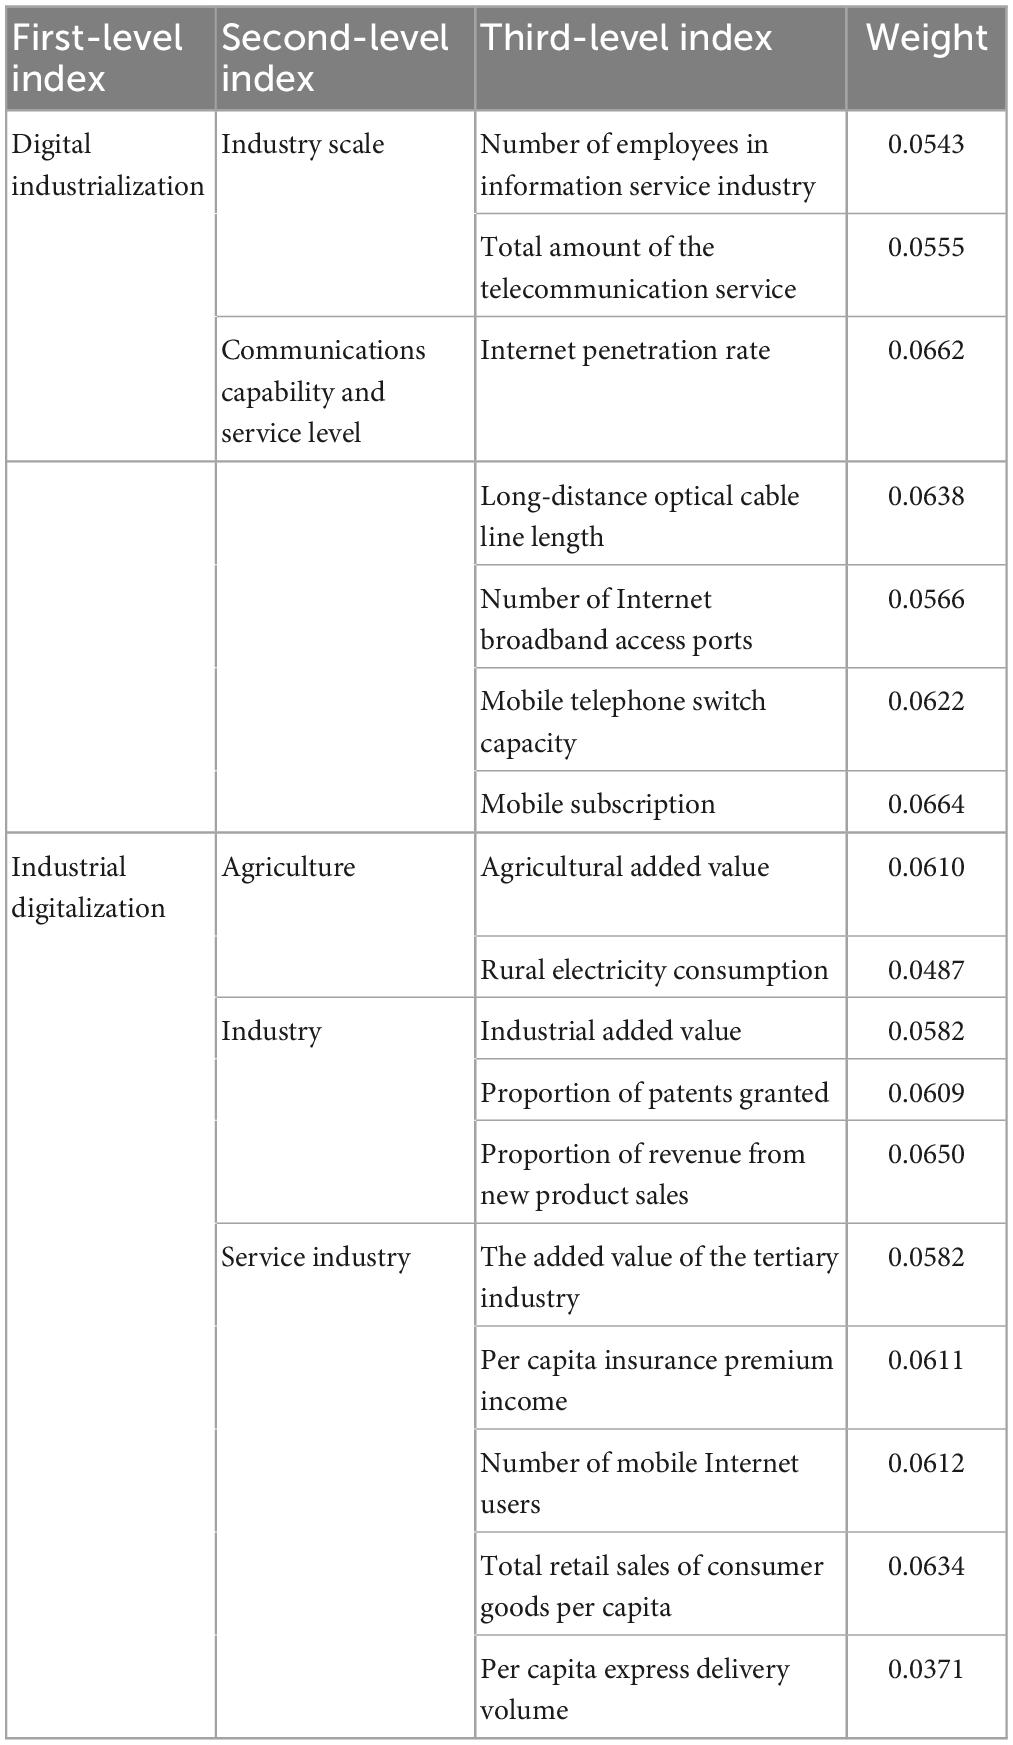
Table 1. Evaluation index system of digital economy development.
3.1.3. Results
Table 2 shows the score of digital economy development level of 30 provinces in China from 2007 to 2019. The results show that the score of digital economy development level in each province has an obvious growth trend in 2007–2019. From the perspective of time nodes, 2007–2015 is the initial period of digital economy development. This period is the stage of rapid integration of digital technology and real economy, and the growth rate of digital economy is slow. 2016–2019 is the stage of rapid development of the digital economy, which is mainly due to the government’s strong investment in digital construction.
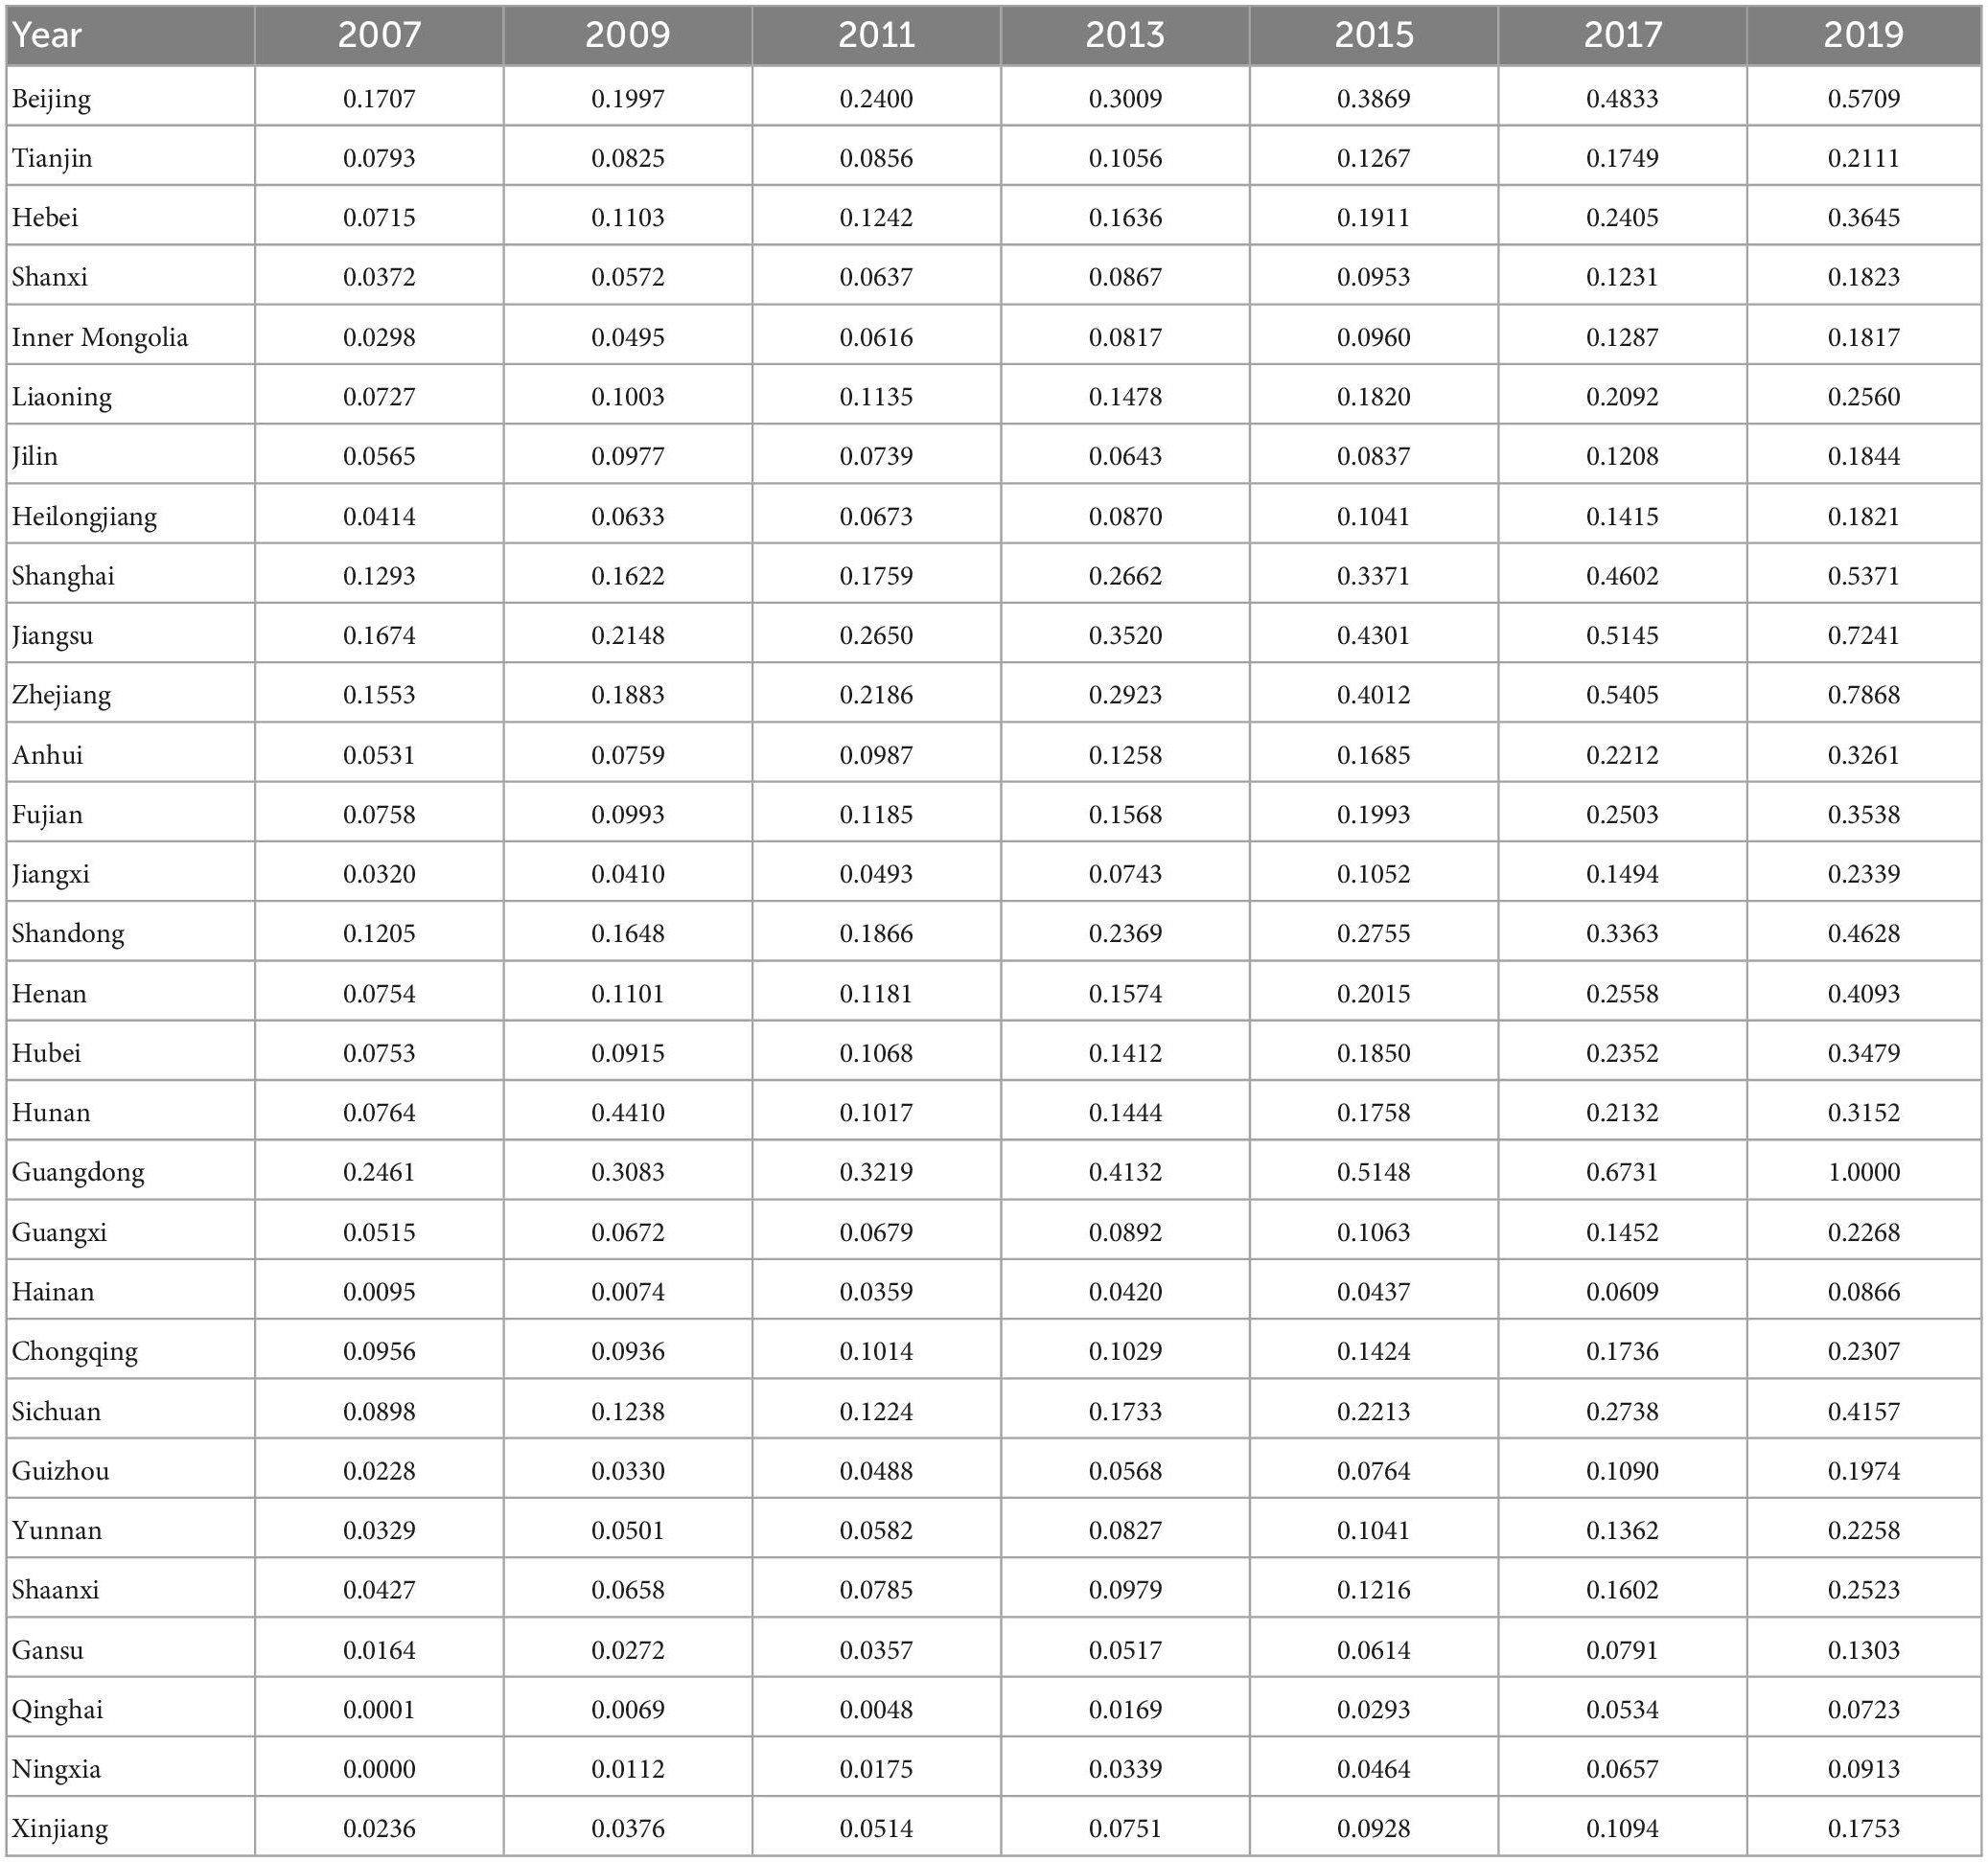
Table 2. Score of digital economy development level.
In order to show the differences in the development level of digital economy among different regions, ArcGis software was used to draw the spatial pattern distribution map of digital economy development in each province of China in 2007, 2013, and 2019. It can be seen from Figure 1 that the development of China’s digital economy is uneven among regions, showing a geographical spatial pattern of decreasing in the east, middle and west, and obvious differences between the east and the west. From the time dimension, the development level of digital economy in the east, middle and west regions have a trend of increasing year by year. This reflects the phenomenon of “digital divide” caused by the imbalance of development between regions in the era of digital economy, and advanced regions have more advantages in the development of digital economy than backward regions.
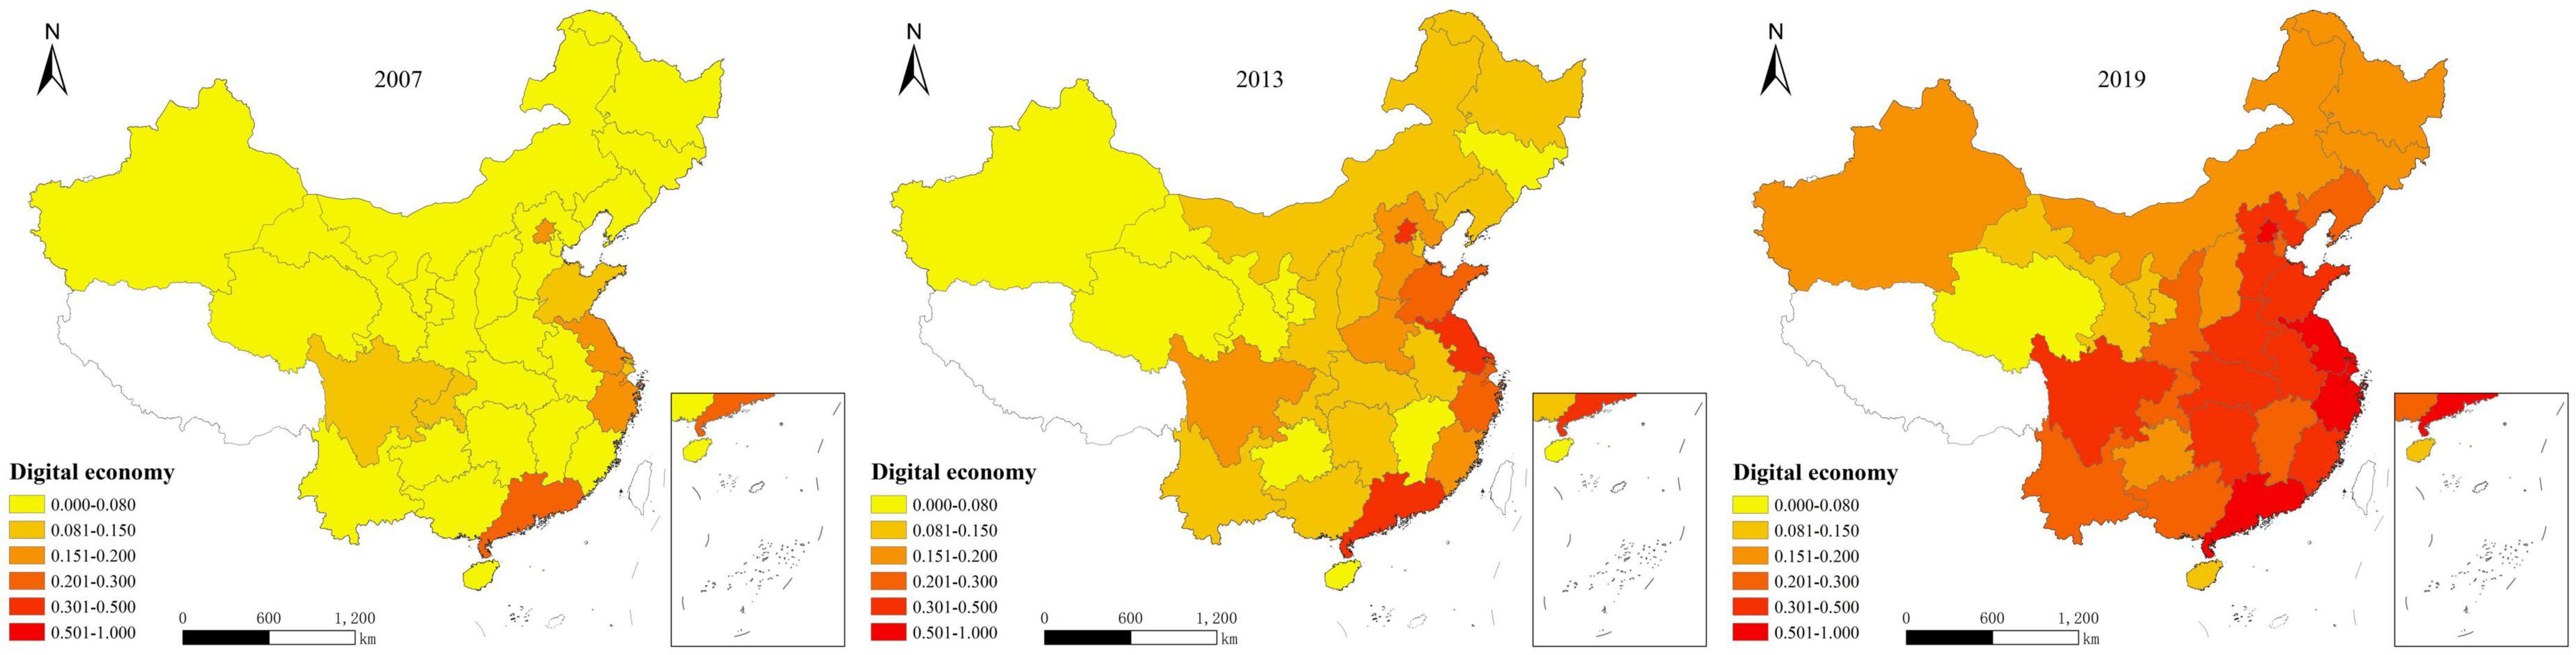
Figure 1. Spatial distribution of China’s digital economy development level in 2007, 2013, and 2019.
3.2. Measurement of carbon emission intensity
3.2.1. Method
To study the impact of the digital economy on carbon emissions under the “dual carbon goal”, we must first measure the carbon emissions. In this paper, the carbon emission coefficient method is used to measure China’s interprovincial carbon emissions. The required data are the amount of energy consumption in each province and city and the corresponding carbon emission factor. Among them, the main types of energy consumption that cause carbon emissions are coal, gasoline, kerosene, crude oil, coke, diesel, fuel oil and natural gas. Among them, the carbon emission factors of various energy sources need to be estimated. In this paper, the carbon emissions of each province are measured under the IPCC sectoral accounting algorithm. The calculation formula is as follows:
among them, Cit represents the estimated carbon emissions of province i in t year; Eijt represents j energy consumption of province i in t year; δj is the average low calorific value of j energy; ηj is the carbon emission coefficient of j energy, and the relevant values are shown in Table 3.

Table 3. Average low calorific value and carbon emission coefficient of various energy sources.
Carbon emission intensity is the CO2 emission per unit of real GDP, and its calculation formula is as follows:
among them, CIit is the carbon emission intensity of i province in t year; Cit represents the carbon emissions of province i in t year; GDPit represents the real GDP of province i in t year.
3.2.2. Results
According to the calculated carbon emission intensity data of each province, the spatial distribution map of carbon emission intensity of each province in China in 2007, 2013, and 2019 is drawn. As shown in Figure 2, China’s carbon emission intensity shows the geographical spatial differences of “high in the west and low in the east” and “high in the north and low in the south.” Resource-based provinces bear more carbon emissions, and the carbon emission intensity in economically developed regions is lower, indicating that there is a “profit and loss deviation” phenomenon in China’s carbon emissions. From the time dimension, the carbon emission intensity in various regions of China has a trend of decreasing year by year. This shows that since the 18th CPC National Congress, the concept of low-carbon development advocated by China has been well implemented.
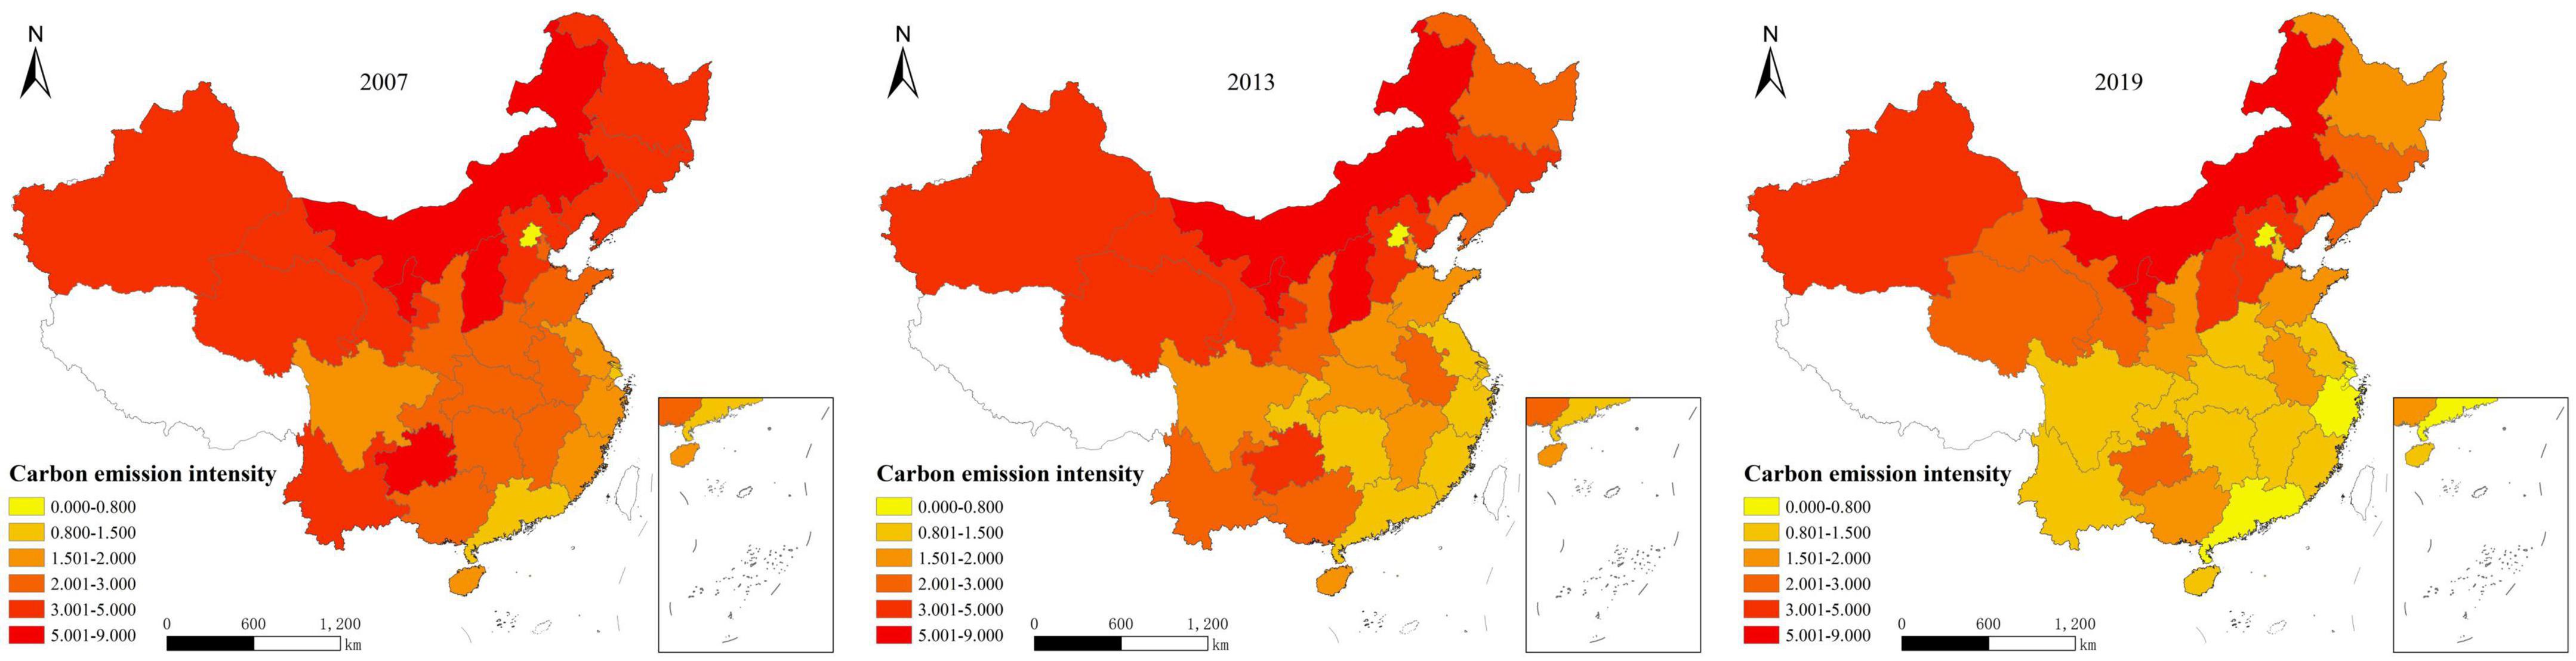
Figure 2. Spatial distribution of China’s carbon emission intensity in 2007, 2013, and 2019.
3.3. Research design
3.3.1. Model design
This paper constructs the following panel fixed effects model to study the impact of digital economy development on carbon emission intensity:
In Equation 8, i, t represent province and year, respectively; CIit is the dependent variable, namely carbon emission intensity. The independent variable digitalit is the level of digital economic development. Xit is the control variable; β0 is the intercept term; δt is the year-fixed effects; ζi is the individual (province)-fixed effects; εit is the random disturbance term. The research goal of this paper is to test the impact of digital economy development on carbon emission intensity at the provincial level in China, so it focuses on the significance, direction and size of the coefficient β1.
3.3.2. Variables and data sources
The dependent variable is carbon emission intensity (CI). The independent variable is the level of digital economic development (digital). Mechanism variables include: Industrial structure optimization (indust). Industrial structure optimization is represented by the ratio of the tertiary industry to the secondary industry (Zhao and Xi, 2022). Resource allocation (tfp). Resource allocation is measured by total factor productivity of each province (Xi and Mei, 2022). Innovation efficiency (innov). Innovation efficiency is measured by DEA method (Li et al., 2018). According to the existing research conclusions, this paper selects the following control variables: Energy structure (es). Energy structure is an important factor affecting the carbon emission intensity of region. The energy structure with too high proportion of coal often has higher carbon emission intensity. Therefore, it is expressed by the ratio of coal consumption to total energy consumption (Guan et al., 2023). Population density (popu). Regions with higher population density have greater demand for energy consumption and more frequent socio-economic activities (He et al., 2023), which are more likely to affect carbon emission intensity. Foreign direct investment (fdi). Foreign direct investment is expressed by the ratio of foreign direct investment to real GDP. Openness to the outside (open). Openness to the outside is expressed by the ratio of total import and export to real GDP (Tiba and Belaid, 2020). Environmental regulation (er). Environmental regulation is expressed by the proportion of environmental pollution control investment in real GDP.
The data sources of this paper are “China Statistical Yearbook”, “China Social Statistical Yearbook” and statistical yearbooks of various provinces and cities, the website of the National Bureau of Statistics, CNRDS database, CEADs database, and Wind database. Considering the availability of data, the panel data of 30 provinces in China (except Tibet and Hong Kong, Macao, and Taiwan) from 2007 to 2019 are finally selected. Descriptive statistics of variables are shown in Table 4.
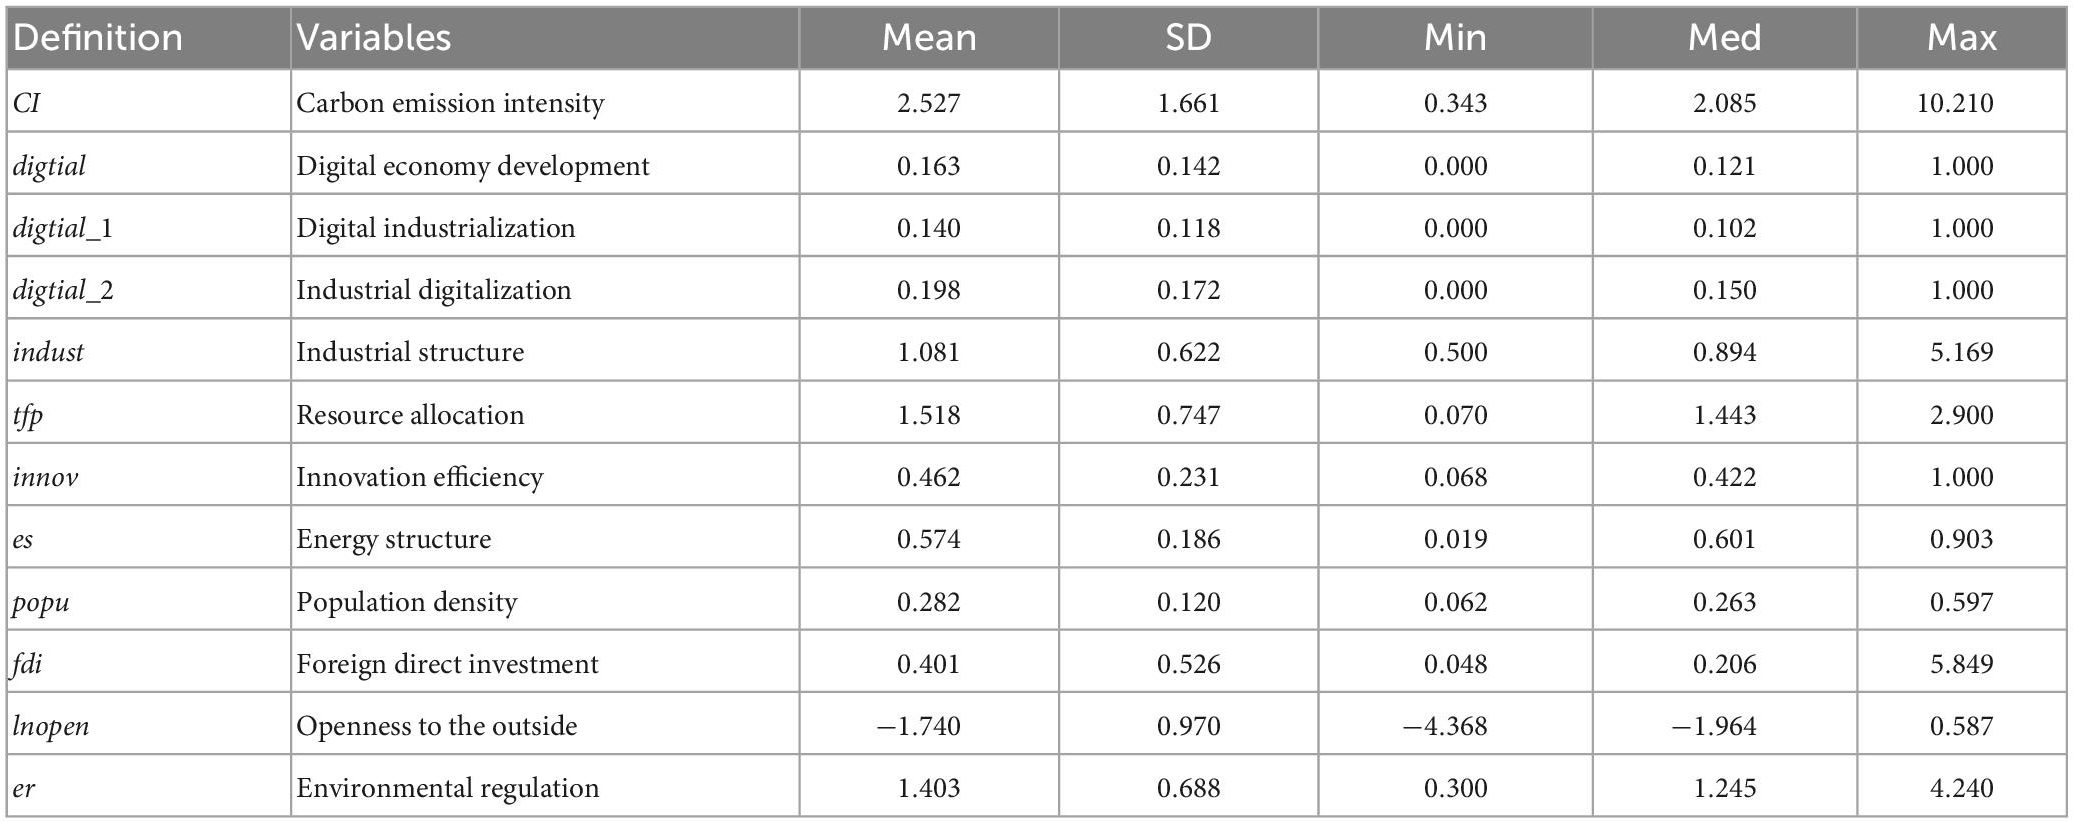
Table 4. Descriptive statistics of variables.
4. Results and discussion
4.1. Benchmark regression results
Considering that regional differences and time factors may affect the estimation results, this paper uses the fixed effect model to estimate the parameters, and the results are shown in Table 5. It can be seen from columns (1) and (2) of Table 5 that the regression coefficient of digital economy development (digital) is negative at the 1% significance level, indicating that the improvement of digital economy development level in each region can promote the reduction of carbon emission intensity. The core explanatory variables in columns (3) and (4) were digital industrialization, and the core explanatory variables in columns (5) and (6) were industrial digitalization, and the results showed that the regression coefficients of digital industrialization and industrial digitalization were significantly negative, indicating that both inhibited the increase of carbon emission intensity. However, there are differences in the inhibitory effect of the two on carbon emission intensity. The absolute value of the regression coefficient of digital industrialization is greater than that of industrial digitization, indicating that digital industrialization has a greater inhibitory effect on carbon emission intensity. In the integration stage of digital economy and real economy, the process of industrial digitization often lags behind digital industrialization, which is the main reason for the difference in impact.
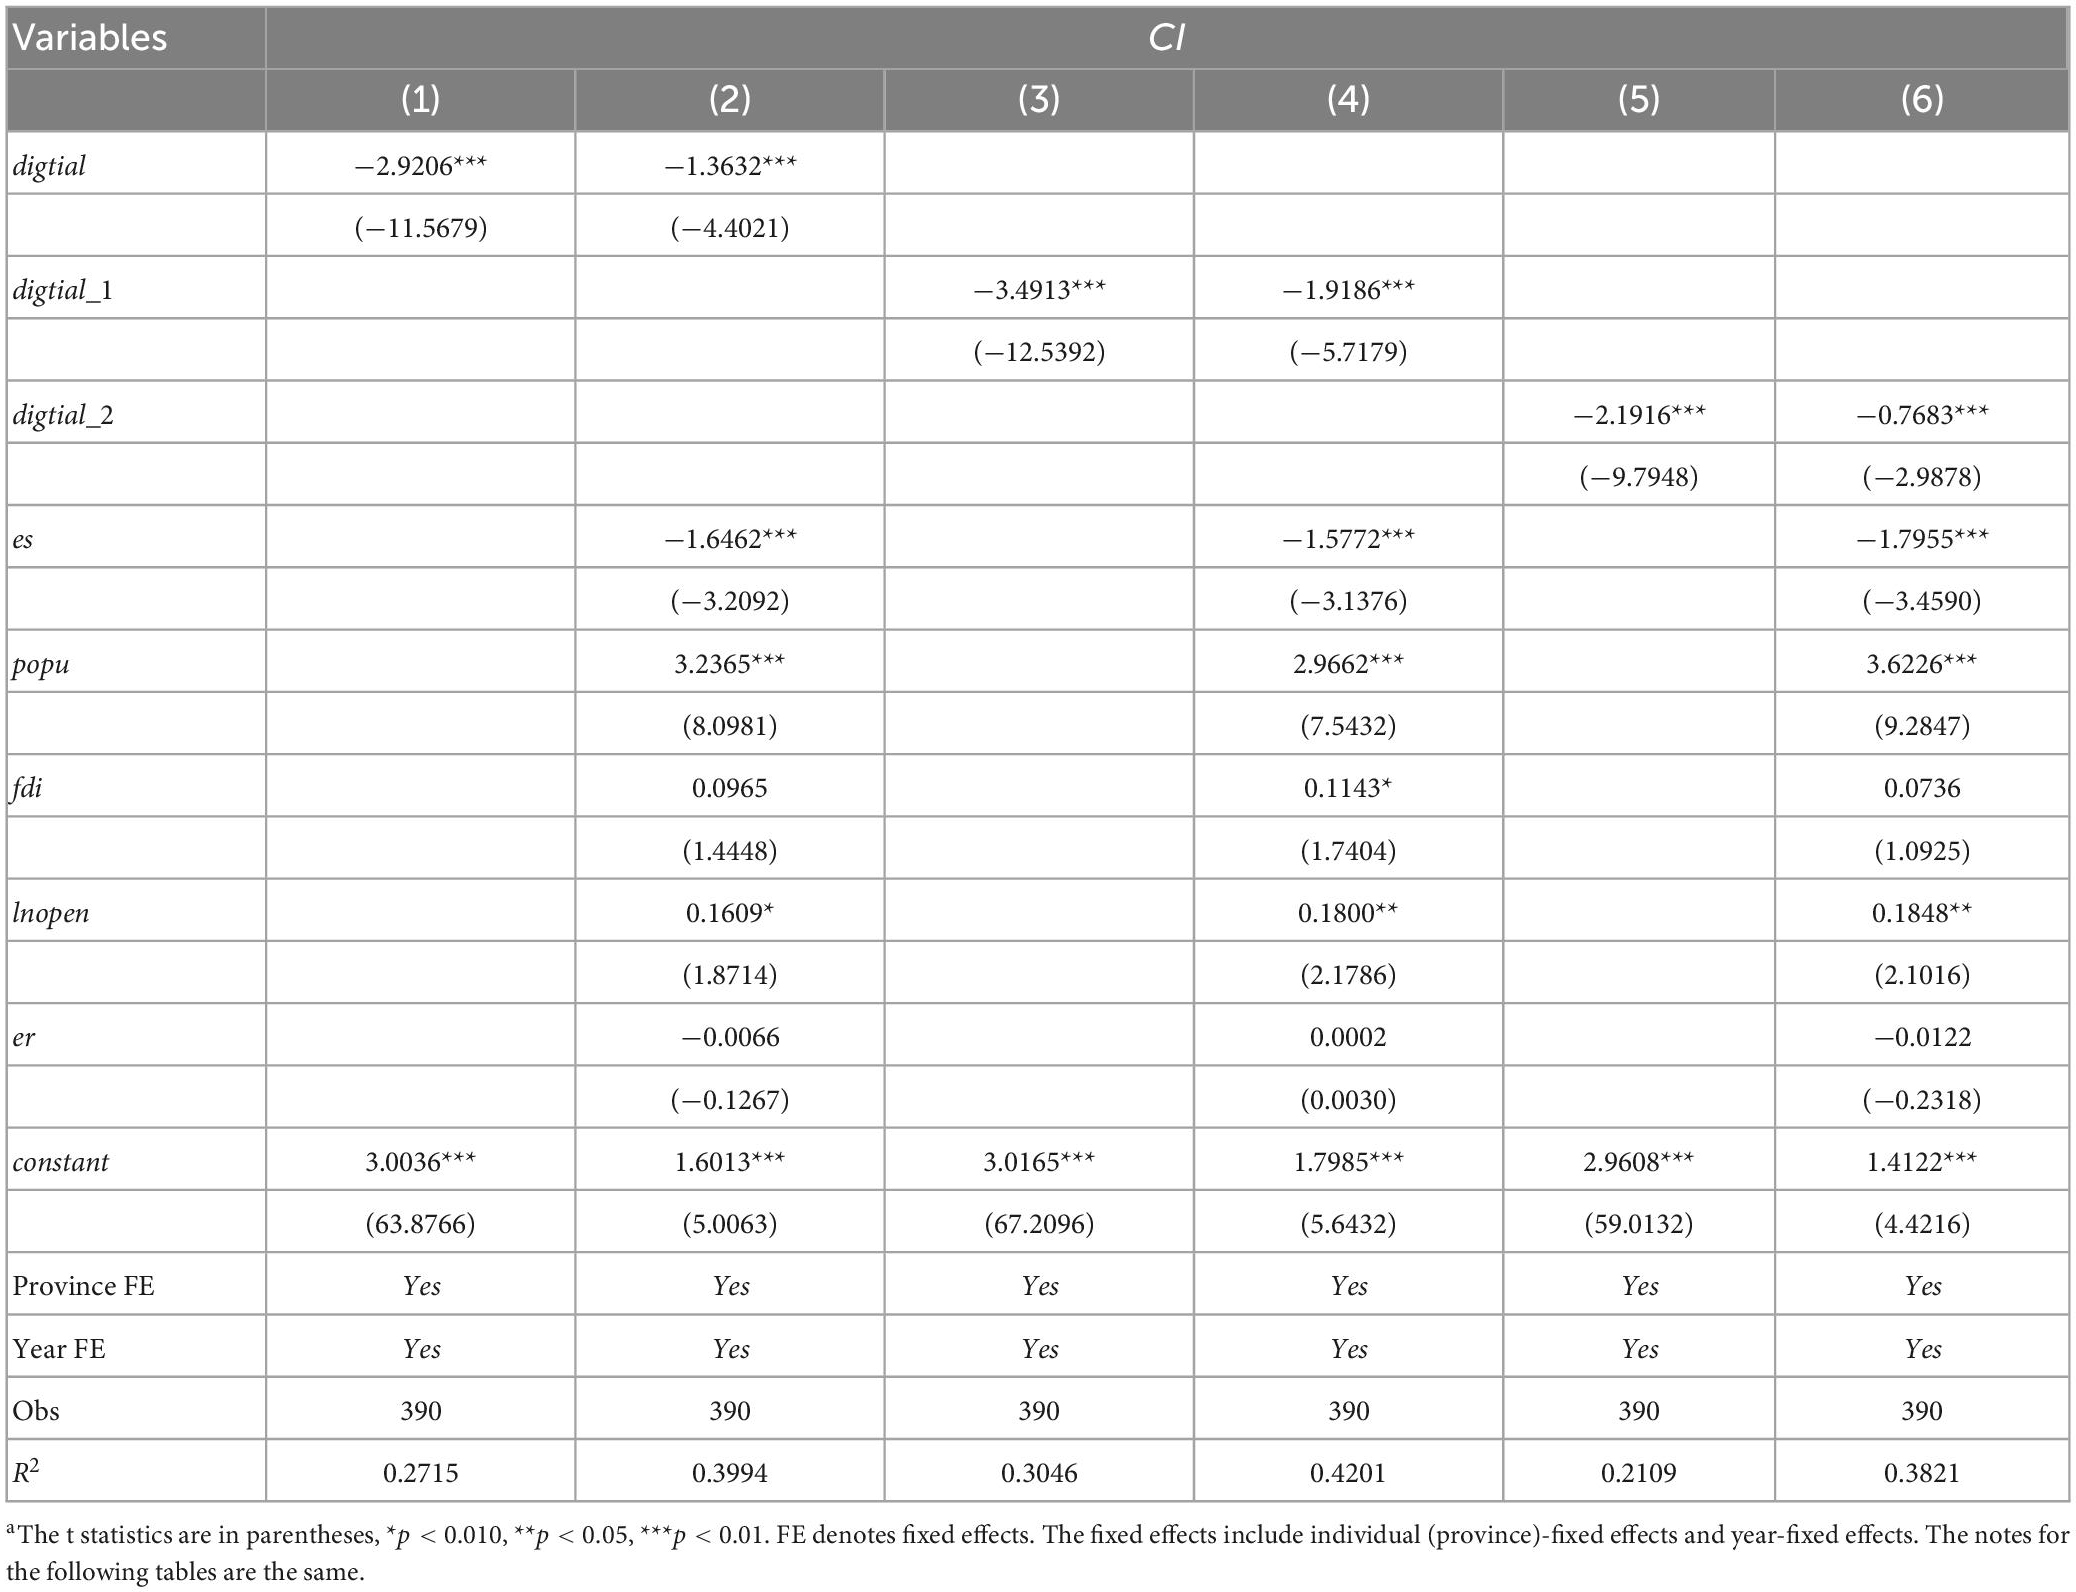
Table 5. Benchmark regression resultsa.
4.2. Endogenous treatment
Although carbon emission intensity is a relative quantity index, which can alleviate endogenous problems to a certain extent, it cannot rule out endogenous problems caused by missing variables. If the factors that affect both the digital economy and the carbon emission intensity are not controlled, it will lead to endogenous problems, such as relevant policies and technological changes. First, using fixed effects model can alleviate endogenous problems to a certain extent. Second, construct the instrumental variables of digital economy development to reduce endogenous bias. The previous benchmark regression uses fixed effects, which alleviates endogeneity to some extent.
Construct instrumental variables to alleviate endogenous problems. Refer to the practice of Bartik (2006) to construct instrumental variables, that is, the first-order difference (Δdigitalit) of the development of the digital economy and the intersection (digitalit–1) of the lag phase (Δdigitalit = digitalit−1) of the development of the digital economy are used as instrumental variables. The considerations for constructing the instrumental variable are as follows: Firstly, carbon emission intensity will not affect the development of the digital economy in the previous period. Choosing a lag period can effectively avoid the endogeneity that may be caused by reciprocal causation, which also shows that the instrumental variable satisfies the exogenous hypothesis. Secondly, the level of development of the digital economy in the previous period will affect the current period. Choosing the intersection of the lag phase of the digital economy and the first-order difference as the instrumental variable can meet the correlation assumption (Lyu et al., 2023). This paper uses the two-stage least squares method of instrumental variables to estimate.
In order to ensure the reliability of the endogenous test results, this paper also takes the carbon emission intensity measured by the apparent method as the dependent variable for regression. The estimation results are shown in Table 6. Columns (1) and (2) are based on the carbon emission intensity calculated by the IPCC sector accounting method as the dependent variable; columns (3) and (4) are based on the carbon emission intensity calculated by the apparent method as the dependent variable. The results show that the instrumental variable has a significant strong correlation with the independent variable. The F statistic in the weak IV test is much larger than the judgment value at the 10% level. The instrumental variable satisfies the correlation hypothesis and there is no weak correlation problem. In addition, the digital economy development (digtial) is significantly negative at the significance level of 10%, indicating that the results are still robust after controlling endogenous problems.
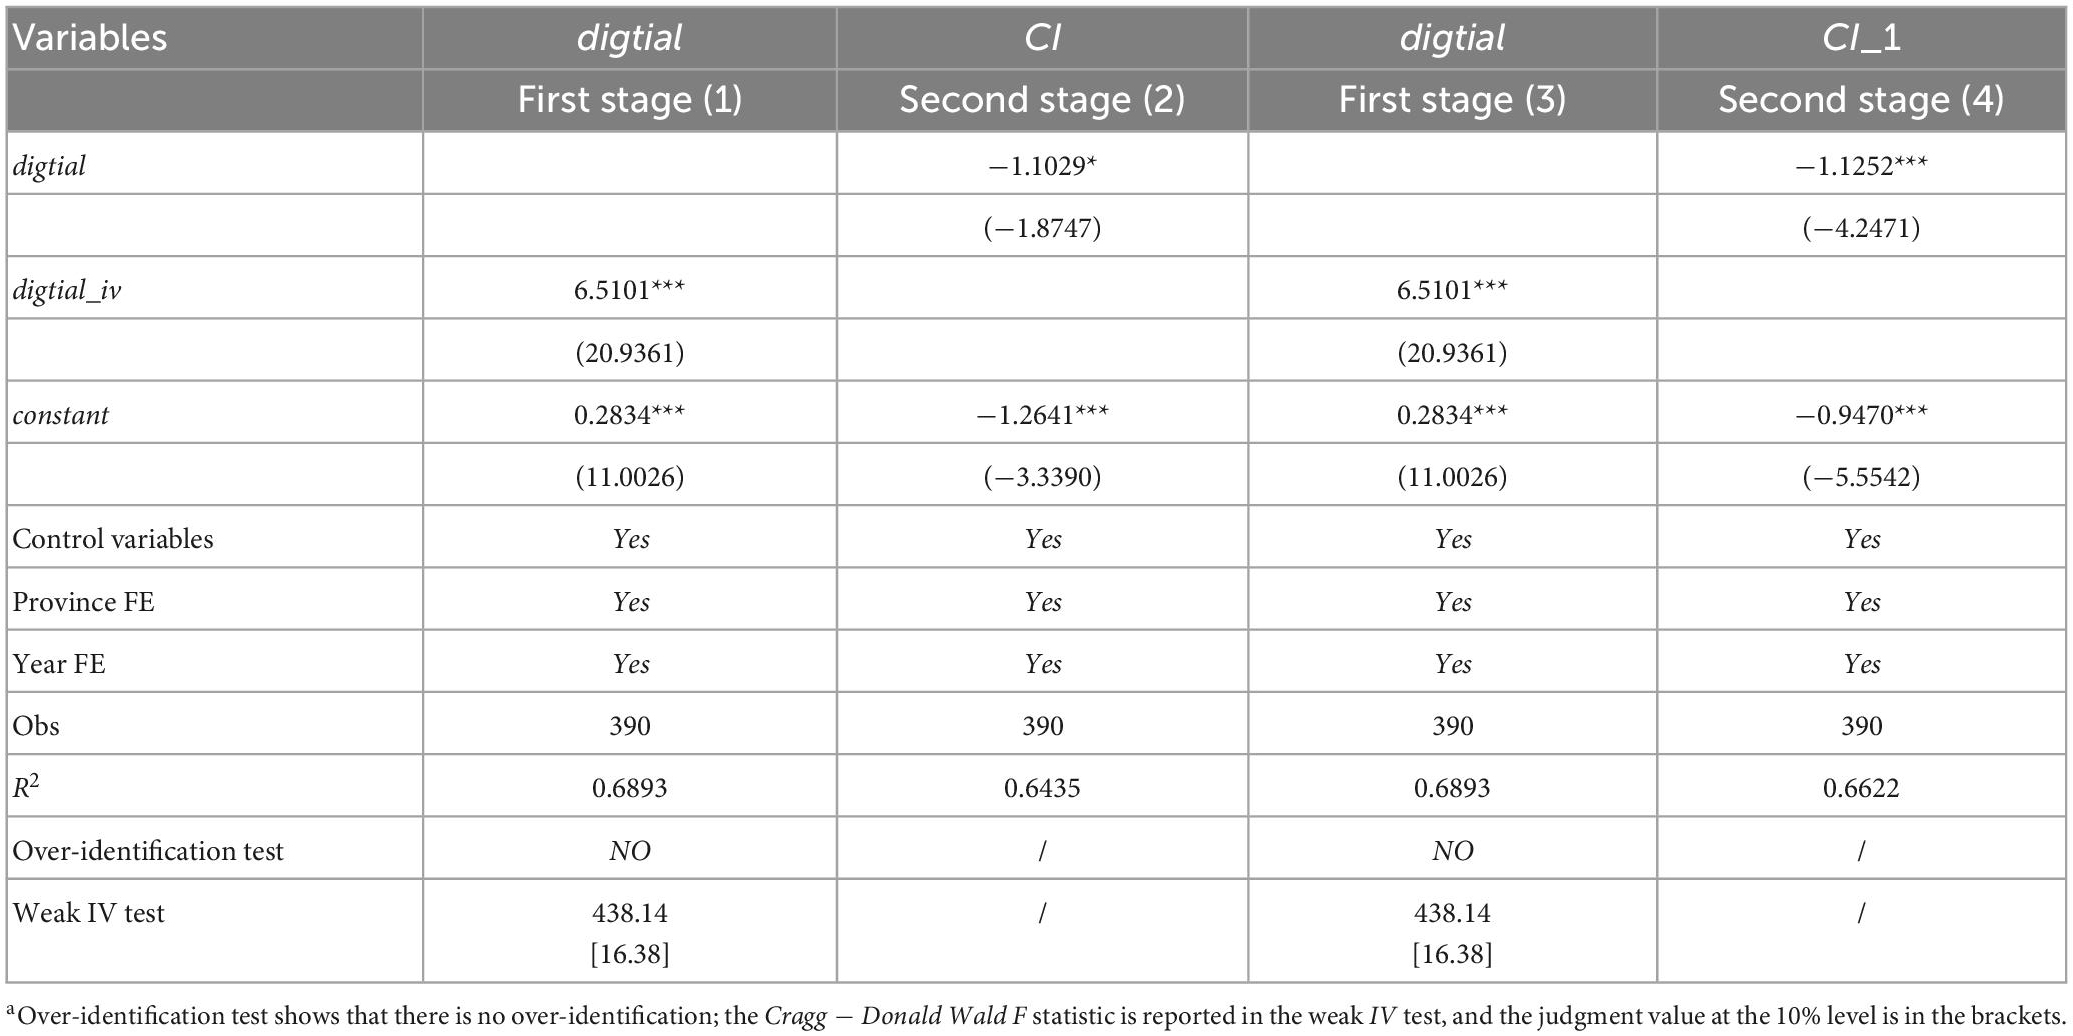
Table 6. Endogenous test resultsa.
4.3. Robustness test
Referring to the existing research, the model robustness test was carried out by substituting variables and removing outliers. One is to replace the dependent variable. The carbon emission intensity of each province calculated by the apparent method calculated by the apparent method in the CEADs database was selected as the replacement variable. The second is to eliminate outliers. That is, the values in the carbon intensity data are replaced by values that are 5% below the average and 95% above the average. In Table 7, columns (1), (3), and (5) are listed as the regression results of the dependent variable after tail shrinking. Columns (2), (4), and (6) are the regression results after replacing the dependent variable. After tail shrinking and replacing the dependent variable, the independent variable were still significant, and the direction and magnitude of the coefficients were consistent with the benchmark estimates, indicating that the model estimation had high confidence and proved the robustness of the research conclusions.
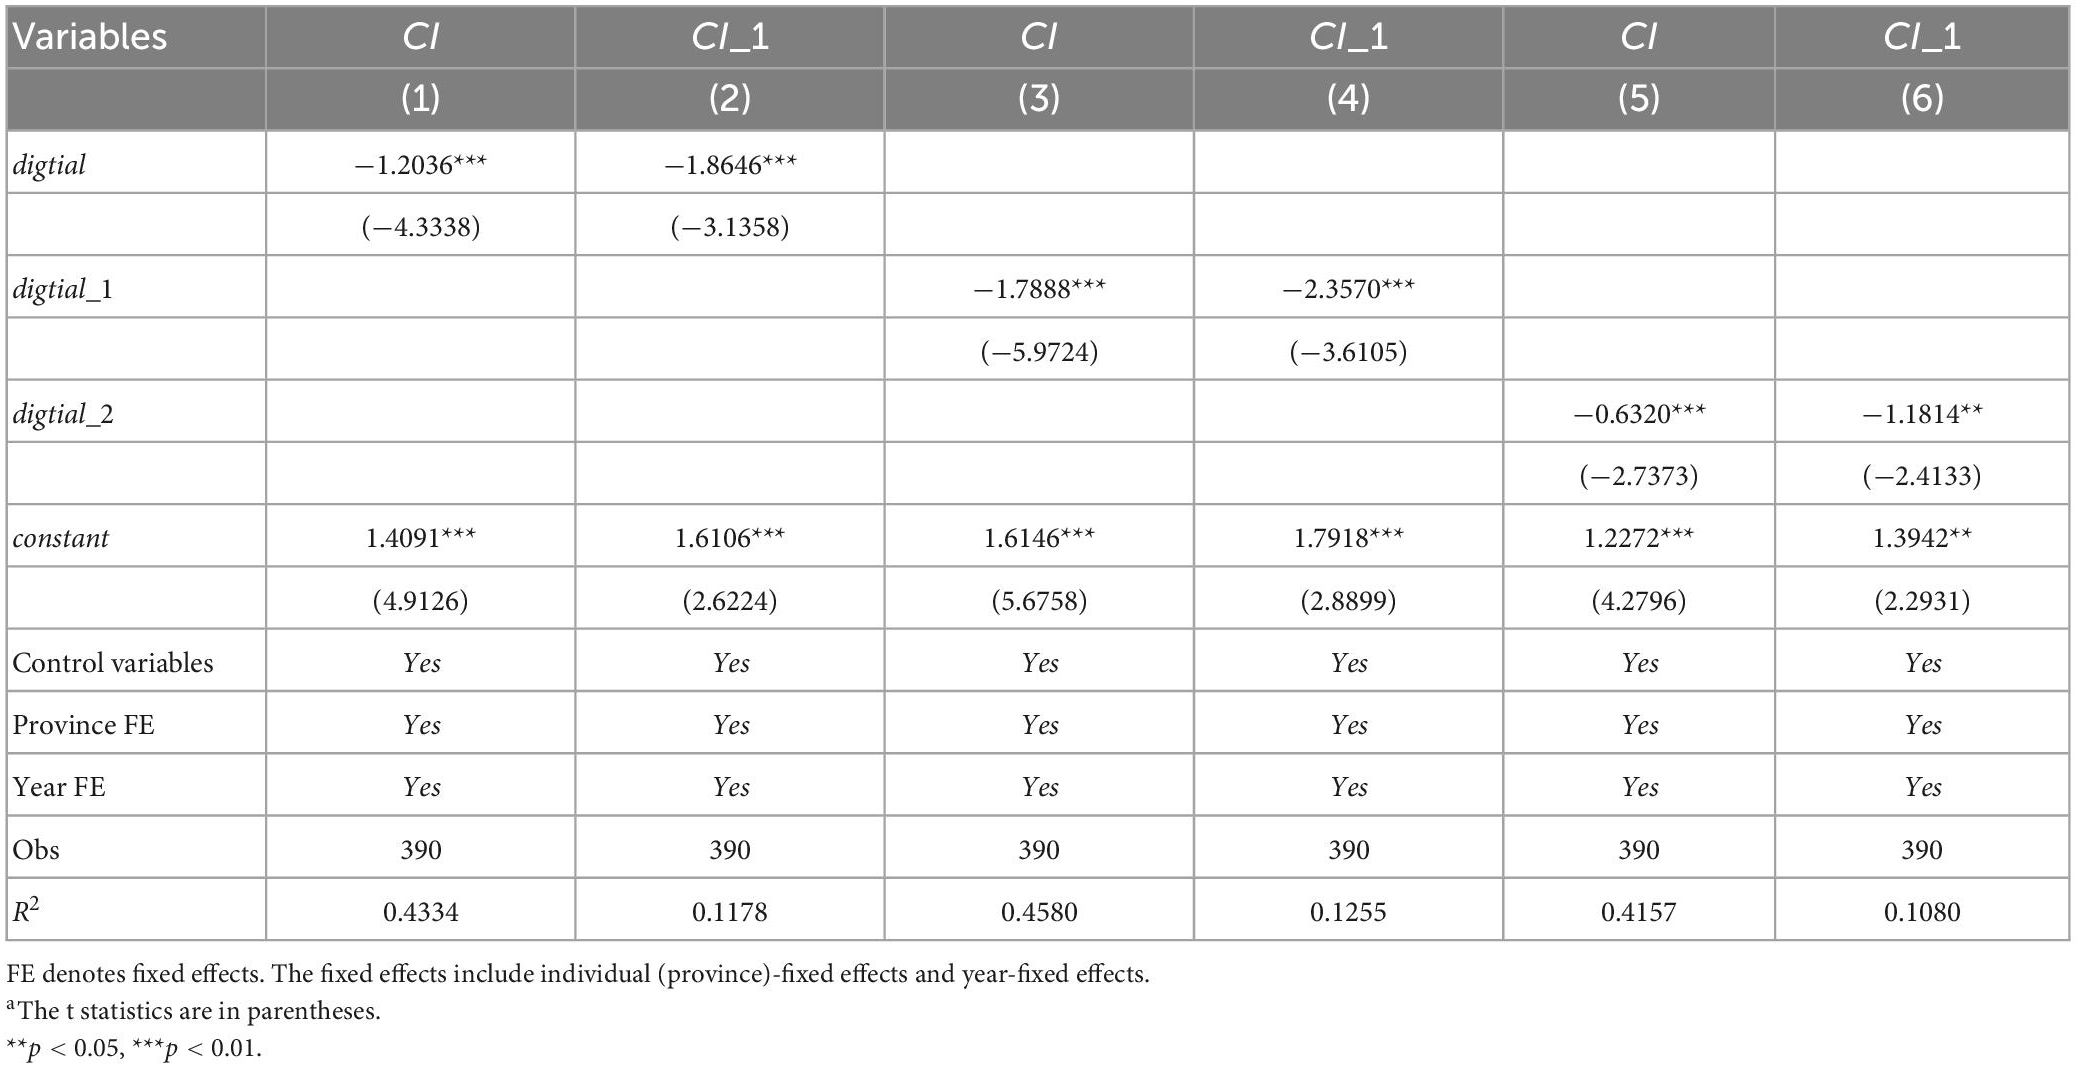
Table 7. Robustness test results.
4.4. Heterogeneity analysis
4.4.1. Analysis of geospatial differences
In order to examine the regional differences in the impact of digital economy development on carbon emission intensity, this paper divides the sample into eastern, middle and western regions, and still uses the panel fixed effects model for regression. As shown in Table 8, there are significant spatial differences in the impact of digital economy development on carbon emission intensity. Compared with the east, the impact of the development of digital economy in the middle and western regions on reducing carbon emission intensity is more obvious. The reason may be that the eastern regions is economically developed, the carbon emission intensity is much lower than that of the middle and western regions, and the space for reduction is limited, so the role of the digital economy in reducing carbon emissions is not as good as that of the middle and western regions.
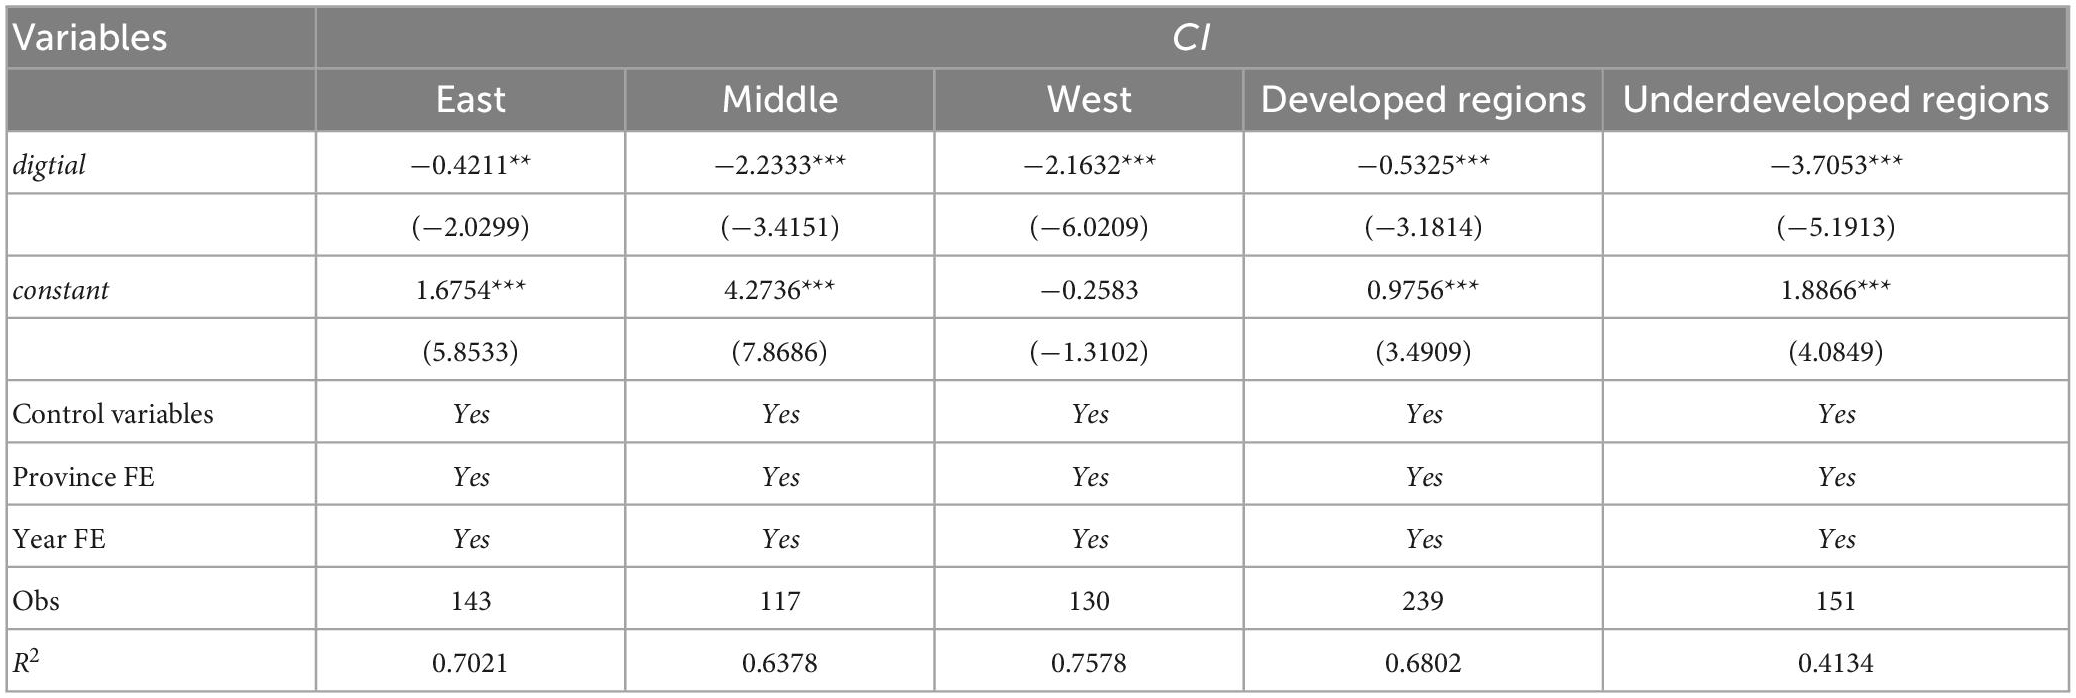
Table 8. Heterogeneity analysis results.
4.4.2. Analysis of differences in economic development
Is there a difference in the impact of digital economy on carbon emission intensity under different economic development levels? This paper divides the samples into economically developed regions and economically underdeveloped regions based on the average per capita GDP of each province. The grouping regression results are shown in Table 8. The regression results of developed and underdeveloped regions are significantly negative at the level of 1%, but the absolute value of the regression coefficient in underdeveloped regions is greater than that in developed regions. It shows that the digital economy has a more obvious effect on reducing the carbon emission intensity in underdeveloped regions. The results of heterogeneity analysis provide guidance for policymakers to achieve the “dual carbon goals”.
4.5. Mechanism test
According to mechanism analysis, the development of digital economy reduces carbon emissions per unit output through industrial structure optimization effect, resource allocation effect and innovation effect. This section tests the above influence mechanism. The test process is divided into three steps: Firstly, the independent variable are regressed with the mechanism variables, and the regression coefficients represent the impact of the digital economy on the intermediary variables. Secondly, the digital economy and carbon emission intensity are regressed to verify the impact of the digital economy on carbon emission intensity. Finally, the digital economy, intermediary variables and carbon emission intensity are regressed to verify whether the digital economy has an impact on carbon emission intensity through intermediary variables. The mechanism test model is constructed as follows:
among them, mechanismit contains three mechanism variables: industit, tfpit and innovit, which verify the industrial structure optimization effect, resource allocation effect and innovation effect, respectively, and the other variables are the same as the Equation 8. Equation 9 is used to verify the impact of the digital economy on the intermediary variables; Equation 10 is used to verify the impact of the digital economy on carbon emission intensity, that is, the benchmark regression; Equation 11 is used to verify the mechanism effect of the digital economy on carbon emission intensity.
Table 9 shows the results of the mechanism test. The results of columns 1, 3, and 5 demonstrate that the development of digital economy can promote the upgrading of industrial structure, improve total factor productivity and improve innovation efficiency. Among them, the impact of digital economy development on promoting industrial structure upgrading and improving total factor productivity has passed the 1% significance level, but the innovation efficiency has not passed the significance test. The results of columns 2 and 4 demonstrate that the industrial structure optimization effect and resource allocation effect have passed the 5% significance level, which proves the existence of intermediary effect. The coefficient of structural optimization effect and resource allocation effect is significantly negative, which verifies the previous theoretical mechanism analysis. This shows that the digital economy suppresses carbon emission intensity through the industrial structure optimization effect and resource allocation effect, which verifies H2 and H3. However, the innovation efficiency does not play an inhibitory role in reducing carbon emission intensity. The possible reason is that China’s current innovation efficiency mechanism has not yet played a role, even at the expense of the environment.
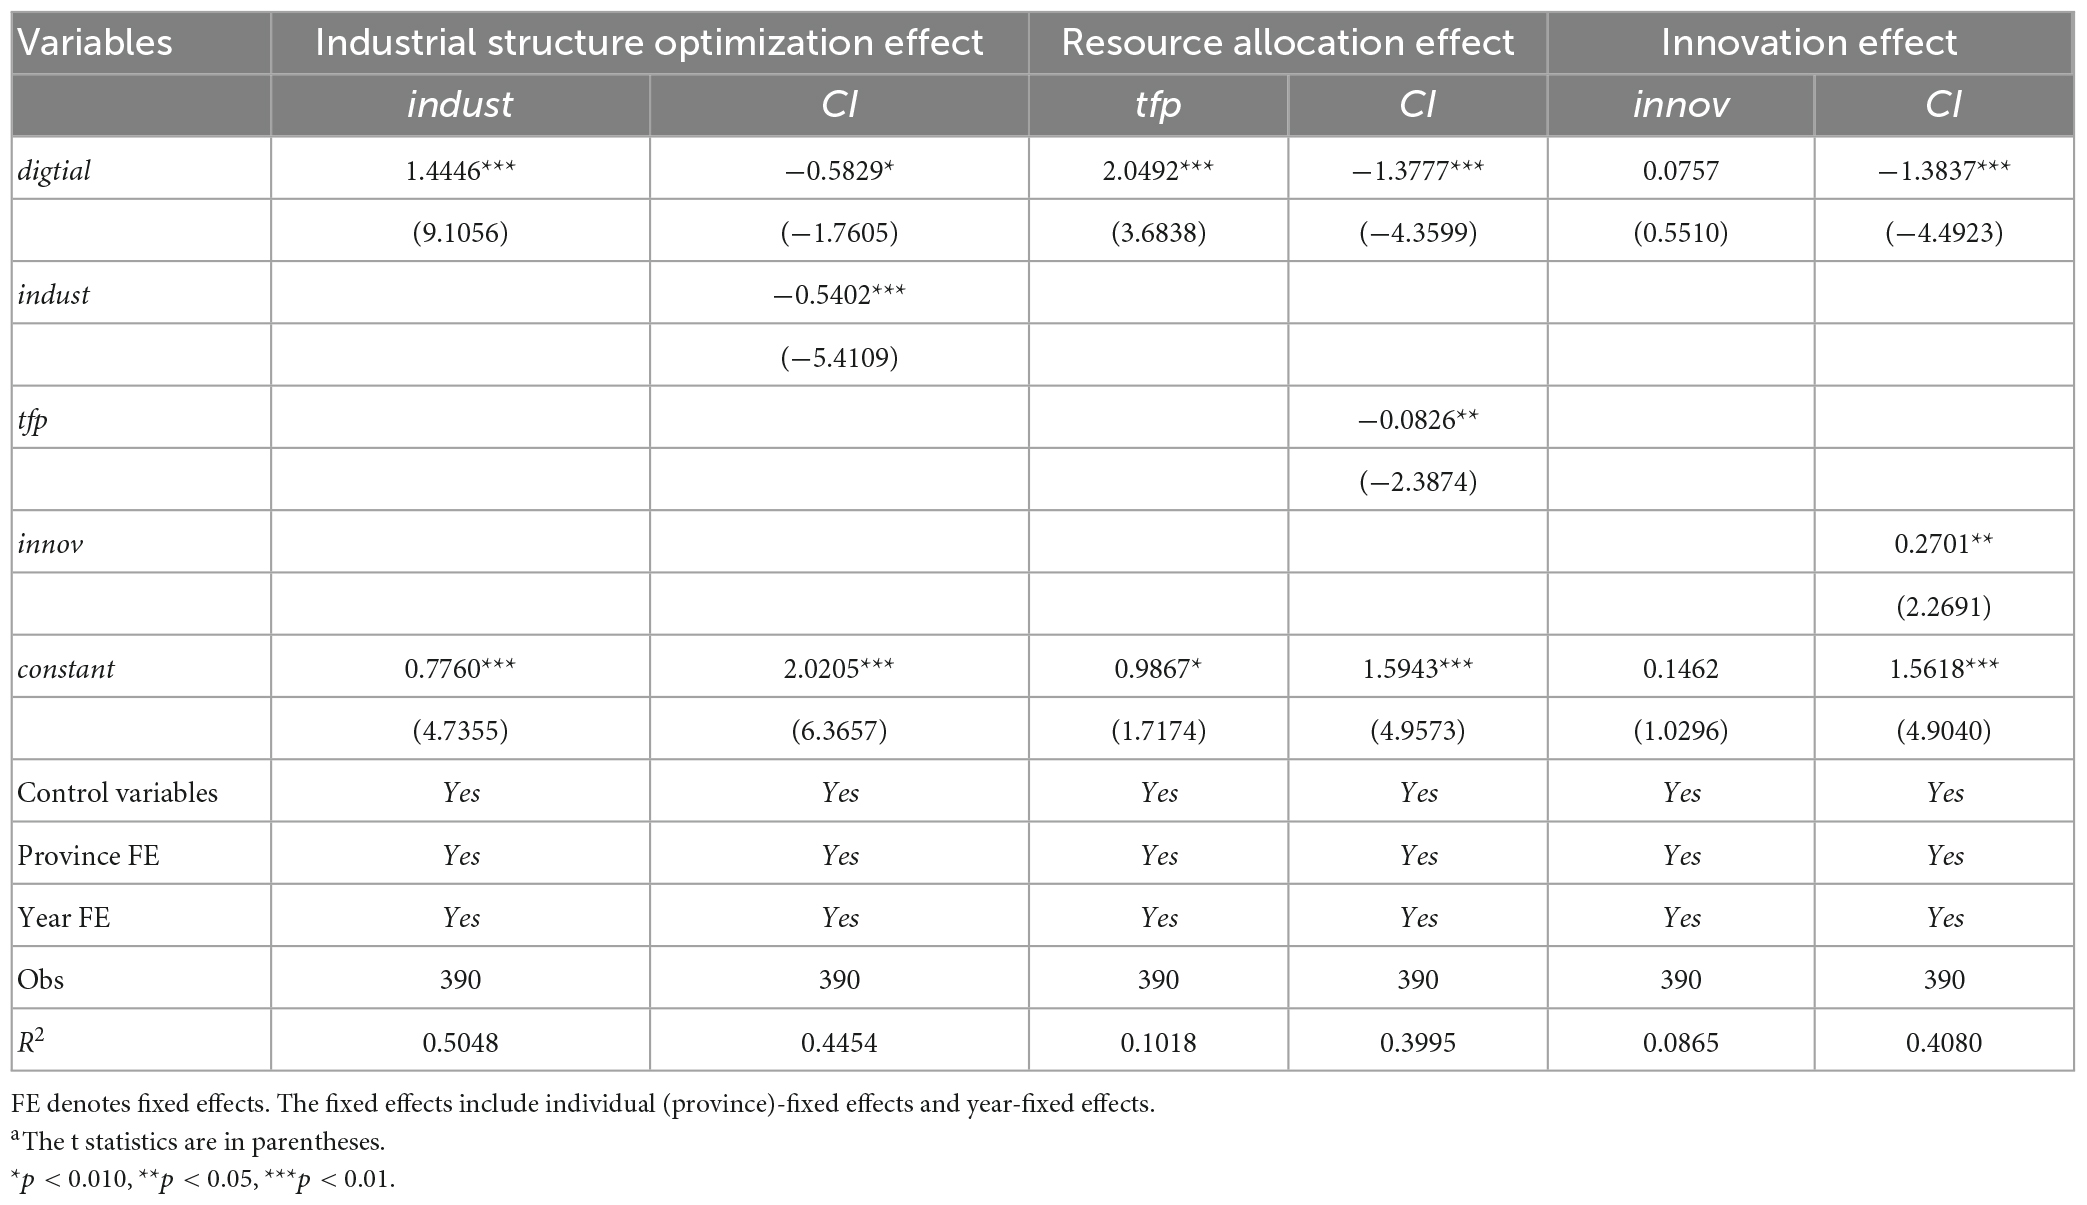
Table 9. Mechanism test results.
5. Conclusion
Under the background of global climate change and digital transformation, it is of great practical significance to study the impact of digital economy development on carbon emission intensity. This paper constructs a measurement model of digital economy development level and carbon emission intensity at the provincial level in China, and on this basis, examines the impact and mechanism of digital economy development on carbon emission intensity. The results show that: (1) The development of China’s digital economy is unbalanced among regions, showing a geographical spatial pattern of decreasing from east to west. (2) China’s carbon emission intensity has a decreasing trend year by year, but there is a spatial difference of “high in the west and low in the east.” (3) The development of digital economy can effectively reduce regional carbon emission intensity, but the impact of digital industrialization and industrial digitalization on regional carbon emission intensity is different, and digital industrialization has a more significant effect on reducing regional carbon emission intensity. (4) The digital economy has different effects on reducing carbon emission intensity in different regions. The inhibitory effect of developing digital economy on carbon emission intensity in the middle and western regions is stronger than in the eastern region. Compared with developed regions, the development of digital economy in underdeveloped regions has a greater inhibitory effect on carbon emission intensity. (5) The development of digital economy reduces carbon emission intensity through industrial structure optimization effect and resource allocation effect, and the industrial structure optimization effect suppresses regional carbon emission intensity more obviously, and carbon emission intensity is not reduced through innovation effect at this stage.
Clarifying the relationship between the development of digital economy and carbon emission intensity has important policy implications for the global response to climate change and China’s realization of the “dual carbon goal.” The development of digital economy is based on digital technology. Promoting digital technology innovation is to lay a solid foundation for the development of digital economy from the “root,” and is a long-term and effective strategic measure to promote the role of digital economy in reducing carbon emissions. First, implement relevant policies to support the development of the digital economy, provide differentiated financial and tax support for the development of digital technology innovation enterprises, and focus on supporting the growth of “specialized and new” digital enterprises. Second, promote digital industrialization and industrial digitization, relying on the existing information and communication infrastructure, focusing on the construction of AI industry center, big data center, 5G base station service, industrial Internet service and other digital industry projects to meet the needs of the digital transformation of the real economy. Third, narrow the differences in the development of regional digital economy, formulate digital economy development strategies in accordance with local conditions, and give full play to their own resource advantages, increase the introduction of technology and talents, and create regional characteristic digital economy industries.
Data availability statement
The original contributions presented in this study are included in the article/supplementary material, further inquiries can be directed to the corresponding authors.
Author contributions
YL: conceptualization, methodology, resources, and validation. LZ: data curation, software, writing—original draft preparation, and visualization. DW: writing—reviewing and editing and supervision. All authors contributed to the article and approved the submitted version.
Funding
This work was supported by Fujian Social Science Foundation Project (grant no. FJ2022B081).
Conflict of interest
The authors declare that the research was conducted in the absence of any commercial or financial relationships that could be construed as a potential conflict of interest.
Publisher’s note
All claims expressed in this article are solely those of the authors and do not necessarily represent those of their affiliated organizations, or those of the publisher, the editors and the reviewers. Any product that may be evaluated in this article, or claim that may be made by its manufacturer, is not guaranteed or endorsed by the publisher.
References
An, Y., Zhou, D., Yu, J., Shi, X., and Wang, Q. (2021). Carbon emission reduction characteristics for China’s manufacturing firms: Implications for formulating carbon policies. J. Environ. Manage. 284:112055. doi: 10.1016/j.jenvman.2021.112055
Andrae, A. S. G., and Edler, T. (2015). On global electricity usage of communication technology: Trends to 2030. Challenges 6, 117–157. doi: 10.3390/challe6010117
Bartik, T. J. (2006). “How do the effects of local growth on employment rates vary with initial labor market conditions?” in Upjohn institute working paper, (Kalamazoo, MI: W.E. Upjohn Institute for Employment Research), doi: 10.2139/ssrn.1372814
Cai, A., Zheng, S., Cai, L., Yang, H., and Comite, U. (2021). How does green technology innovation affect carbon emissions? A spatial econometric analysis of China’s provincial panel data. Front. Environ. Sci. 9:813811. doi: 10.3389/fenvs.2021.813811
Chen, J., Gao, M., Li, D., Li, L., Song, M., and Xie, Q. (2021). Changes in PM2.5 emissions in China: An extended chain and nested refined laspeyres index decomposition analysis. J. Clean. Prod. 294:126248. doi: 10.1016/j.jclepro.2021.126248
Chen, P. (2022). Relationship between the digital economy, resource allocation and corporate carbon emission intensity: New evidence from listed Chinese companies. Environ. Res. Commun. 4:75005. doi: 10.1088/2515-7620/ac7ea3
Chen, S., Ding, D., Shi, G., and Chen, G. (2022). Digital economy, industrial structure, and carbon emissions: An empirical study based on a provincial panel data set from China. Chin. J. Popul. Resour. Environ. 20, 316–323. doi: 10.1016/j.cjpre.2022.11.002
Dong, F., Hu, M., Gao, Y., Liu, Y., Zhu, J., and Pan, Y. (2022). How does digital economy affect carbon emissions? Evidence from global 60 countries. Sci. Total Environ. 852:158401. doi: 10.1016/j.scitotenv.2022.158401
Eskander, S. M. S. U., and Nitschke, J. (2021). Energy use and CO2 emissions in the UK universities: An extended Kaya identity analysis. J. Clean. Prod. 309:127199. doi: 10.1016/j.jclepro.2021.127199
Gao, P., Wang, Y., Zou, Y., Su, X., Che, X., and Yang, X. (2022). Green technology innovation and carbon emissions nexus in China: Does industrial structure upgrading matter? Front. Psychol. 13:951172. doi: 10.3389/fpsyg.2022.951172
González, D., and Martínez, M. (2012). Decomposition analysis of CO2 emissions in the Mexican industrial sector. Energy Sustain. Dev. 16, 204–215. doi: 10.1016/j.esd.2012.01.005
Guan, H., Dong, L., and Aiwu, Z. (2023). Energy structure dividend, factor allocation efficiency and regional productivity growth– An empirical examination of energy restructuring in China. Energy Policy 172:113307. doi: 10.1016/j.enpol.2022.113307
Guo, D., Li, Q., Liu, P., Shi, X., and Yu, J. (2023). Power shortage and firm performance: Evidence from a Chinese city power shortage index. Energy Econ. 119:106593. doi: 10.1016/j.eneco.2023.106593
Han, J., and Jiang, T. (2022). Does the development of the digital economy improve carbon emission efficiency? Front. Ecol. Evol. 10:1031722. doi: 10.3389/fevo.2022.1031722
Hao, X., Li, Y., Ren, S., Wu, H., and Hao, Y. (2023). The role of digitalization on green economic growth: Does industrial structure optimization and green innovation matter? J. Environ. Manage. 325:116504. doi: 10.1016/j.jenvman.2022.116504
He, X., Yu, Y., and Jiang, S. (2023). City centrality, population density and energy efficiency. Energy Econ. 117:106436. doi: 10.1016/j.eneco.2022.106436
He, Y., Xing, Y., Zeng, X., Ji, Y., Hou, H., Zhang, Y., et al. (2022). Factors influencing carbon emissions from China’s electricity industry: Analysis using the combination of LMDI and K-means clustering. Environ. Impact Assess. Rev. 93:106724. doi: 10.1016/j.eiar.2021.106724
Kohli, R., and Melville, N. P. (2019). Digital innovation: A review and synthesis. Inf. Syst. J. 29, 200–223. doi: 10.1111/isj.12193
Koomey, J. G., Matthews, H. S., and Williams, E. (2013). Smart everything: Will intelligent systems reduce resource use? Annu. Rev. Environ. Resour. 38, 311–343. doi: 10.1146/annurev-environ-021512-110549
Li, H., Zhang, J., Wang, C., Wang, Y., and Coffey, V. (2018). An evaluation of the impact of environmental regulation on the efficiency of technology innovation using the combined DEA model: A case study of Xi’an, China. Sust. Cities Soc. 42, 355–369. doi: 10.1016/j.scs.2018.07.001
Li, S., Gao, L., Han, C., Gupta, B., Alhalabi, W., and Almakdi, S. (2023). Exploring the effect of digital transformation on firms’ innovation performance. J. Innov. Knowl. 8:100317. doi: 10.1016/j.jik.2023.100317
Lin, B., and Huang, C. (2023). How will promoting the digital economy affect electricity intensity? Energy Policy 173:113341. doi: 10.1016/j.enpol.2022.113341
Liu, X., Ji, Q., and Yu, J. (2021). Sustainable development goals and firm carbon emissions: Evidence from a quasi-natural experiment in China. Energy Econ. 103:105627. doi: 10.1016/j.eneco.2021.105627
Liu, Y., Yang, M., Cheng, F., Tian, J., Du, Z., and Song, P. (2022). Analysis of regional differences and decomposition of carbon emissions in China based on generalized divisia index method. Energy 256:124666. doi: 10.1016/j.energy.2022.124666
Lyu, Y., Zhang, L., and Wang, D. (2023). The impact of digital transformation on low-carbon development of manufacturing. Front. Environ. Sci. 11:1134882. doi: 10.3389/fenvs.2023.1134882
Ma, M., and Cai, W. (2018). What drives the carbon mitigation in Chinese commercial building sector? Evidence from decomposing an extended Kaya identity. Sci. Total Environ. 634, 884–899. doi: 10.1016/j.scitotenv.2018.04.043
Moyer, J. D., and Hughes, B. B. (2012). ICTs: Do they contribute to increased carbon emissions? Technol. Forecast. Soc. Chang. 79, 919–931. doi: 10.1016/j.techfore.2011.12.005
Niu, Y., Lin, X., Luo, H., Zhang, J., and Lian, Y. (2022). Effects of digitalization on energy efficiency: Evidence from Zhejiang Province in China. Front. Energy Res. 10:847339. doi: 10.3389/fenrg.2022.847339
Niu, Y., Wen, W., Wang, S., and Li, S. (2023). Breaking barriers to innovation: The power of digital transformation. Financ. Res. Lett. 51:103457. doi: 10.1016/j.frl.2022.103457
Pui, K. L., and Othman, J. (2019). The influence of economic, technical, and social aspects on energy-associated CO2 emissions in Malaysia: An extended Kaya identity approach. Energy 181, 468–493. doi: 10.1016/j.energy.2019.05.168
Salahuddin, M., and Alam, K. (2015). Internet usage, electricity consumption and economic growth in Australia: A time series evidence. Telemat. Inform. 32, 862–878. doi: 10.1016/j.tele.2015.04.011
Shi, X., Cheong, T. S., Yu, J., and Liu, X. (2021). Quality of life and relative household energy consumption in China. China World Econ. 29, 127–147. doi: 10.1111/cwe.12390
Tang, X., and Li, J. (2022). Study of the mechanism of digitalization boosting urban low-carbon transformation. Front. Environ. Sci. 10:982864. doi: 10.3389/fenvs.2022.982864
Tiba, S., and Belaid, F. (2020). The pollution concern in the era of globalization: Do the contribution of foreign direct investment and trade openness matter? Energy Econ. 92:104966. doi: 10.1016/j.eneco.2020.104966
Wang, B., Yu, M., Zhu, Y., and Bao, P. (2021). Unveiling the driving factors of carbon emissions from industrial resource allocation in China: A spatial econometric perspective. Energy Policy 158:112557. doi: 10.1016/j.enpol.2021.112557
Wang, J., Dong, X., and Dong, K. (2022b). How does ICT agglomeration affect carbon emissions? The case of Yangtze River Delta urban agglomeration in China. Energy Econ. 111:106107. doi: 10.1016/j.eneco.2022.106107
Wang, J., Dong, K., Dong, X., and Taghizadeh-Hesary, F. (2022a). Assessing the digital economy and its carbon-mitigation effects: The case of China. Energy Econ. 113:106198. doi: 10.1016/j.eneco.2022.106198
Wang, K., Wang, Z., Xian, Y., Shi, X., Yu, J., Feng, K., et al. (2023). Optimizing the rolling out plan of China’s carbon market. iScience 26:105823. doi: 10.1016/j.isci.2022.105823
Wu, L., Sun, L., Chang, Q., Zhang, D., and Qi, P. (2022). How do digitalization capabilities enable open innovation in manufacturing enterprises? A multiple case study based on resource integration perspective. Technol. Forecast. Soc. Chang. 184:122019. doi: 10.1016/j.techfore.2022.122019
Xi, Q., and Mei, L. (2022). How did development zones affect China’s land transfers? The scale, marketization, and resource allocation effect. Land Use Pol. 119:106181. doi: 10.1016/j.landusepol.2022.106181
Xiao, M., and Peng, X. (2023). Decomposition of carbon emission influencing factors and research on emission reduction performance of energy consumption in China. Front. Environ. Sci. 10:1096650. doi: 10.3389/fenvs.2022.1096650
Yang, Z., Gao, W., Han, Q., Qi, L., Cui, Y., and Chen, Y. (2022). Digitalization and carbon emissions: How does digital city construction affect china’s carbon emission reduction? Sust. Cities Soc. 87:104201. doi: 10.1016/j.scs.2022.104201
Yi, M., Liu, Y., Sheng, M. S., and Wen, L. (2022). Effects of digital economy on carbon emission reduction: New evidence from China. Energy Policy 171:113271. doi: 10.1016/j.enpol.2022.113271
Yin, S., and Yu, Y. (2022). An adoption-implementation framework of digital green knowledge to improve the performance of digital green innovation practices for industry 5.0. J. Clean. Prod. 363:132608. doi: 10.1016/j.jclepro.2022.132608
Yu, J., Shi, X., Guo, D., and Yang, L. (2021). Economic policy uncertainty (EPU) and firm carbon emissions: Evidence using a China provincial EPU index. Energy Econ. 94:105071. doi: 10.1016/j.eneco.2020.105071
Zhang, G., Wang, H., Hua, X., Liao, Y., and Peng, L. (2022). Study on the synergistic effect of foreign trade, technological progress, and carbon emissions. Front. Ecol. Evol. 10:971534. doi: 10.3389/fevo.2022.971534
Zhang, L., Mu, R., Zhan, Y., Yu, J., Liu, L., Yu, Y., et al. (2022). Digital economy, energy efficiency, and carbon emissions: Evidence from provincial panel data in China. Sci. Total Environ. 852:158403. doi: 10.1016/j.scitotenv.2022.158403
Zhang, W., Liu, X., Wang, D., and Zhou, J. (2022). Digital economy and carbon emission performance: Evidence at China’s city level. Energy Policy 165:112927. doi: 10.1016/j.enpol.2022.112927
Zhang, Z., Fu, W. K., and Ma, L. (2022). The impact of digital economy on green development in China. Front. Environ. Sci. 10:991278. doi: 10.3389/fenvs.2022.991278
Zhao, X., and Xi, Y. (2022). Threshold effects of urban population size and industrial structure on CO2 emissions in China. Front. Environ. Sci. 10:894442. doi: 10.3389/fenvs.2022.894442
Zhou, X., Zhou, D., Wang, Q., and Su, B. (2019). How information and communication technology drives carbon emissions: A sector-level analysis for China. Energy Econ. 81, 380–392. doi: 10.1016/j.eneco.2019.04.014
Zhu, Y., and Lei, H. (2012). Fuzzy AHP analysis on enterprises’ independent innovation capability evaluation. Phys. Proc. 24, 1285–1291. doi: 10.1016/j.phpro.2012.02.192
Keywords: carbon emission intensity, digital economy, dynamic orthogonal projection, geospatial differences, mediation model
Citation: Lyu Y, Zhang L and Wang D (2023) Does digital economy development reduce carbon emission intensity? Front. Ecol. Evol. 11:1176388. doi: 10.3389/fevo.2023.1176388
Received: 28 February 2023; Accepted: 21 March 2023;
Published: 04 April 2023.
Edited by:
Jian Yu, Central University of Finance and Economics, ChinaReviewed by:
Guangqin Li, Anhui University of Finance and Economics, ChinaPeng Liu, Central University of Finance and Economics, China
Copyright © 2023 Lyu, Zhang and Wang. This is an open-access article distributed under the terms of the Creative Commons Attribution License (CC BY). The use, distribution or reproduction in other forums is permitted, provided the original author(s) and the copyright owner(s) are credited and that the original publication in this journal is cited, in accordance with accepted academic practice. No use, distribution or reproduction is permitted which does not comply with these terms.
*Correspondence: Yanfang Lyu, eWFuZmFuZzkwMkBzaW5hLmNvbQ==; Dong Wang, d2FuZ3JpY2hhcmQ3MkBzaW5hLmNvbQ==