
94% of researchers rate our articles as excellent or good
Learn more about the work of our research integrity team to safeguard the quality of each article we publish.
Find out more
ORIGINAL RESEARCH article
Front. Ecol. Evol. , 01 September 2023
Sec. Conservation and Restoration Ecology
Volume 11 - 2023 | https://doi.org/10.3389/fevo.2023.1174708
This article is part of the Research Topic Science-Based Conservation of Tigers: Assessing the Past to Prepare for the Future View all 6 articles
 Muhammad I. Lubis1,2*
 Janice S. H. Lee1U. M. Rahmat3Tarmizi2Eka Ramadiyanta2Dewi Melvern2Sasha Suryometaram2Ahtu Trihangga3Muhammad Isa4Dedy Yansyah4Ridha Abdullah4Ardiantiono5William Marthy2
 Kendall R. Jones6Noviar Andayani2
 Matthew Linkie2
Human-induced forest loss has had devastating impacts on biodiversity. Mammal populations in the tropics have been hit particularly hard by the resulting habitat loss, fragmentation and degradation, as well as by overhunting which often goes hand-in-hand. While declines in these populations are generally well documented, few studies offer a pathway for their recovery. Here, we test the association between changes in forest habitat and occupancy trends of Sumatran megafauna (elephant and tiger) and key tiger prey species (wild boar and sambar) in the Leuser Ecosystem: a large forest landscape on the Indonesian island of Sumatra. For elephant and tiger, we develop additional occupancy models to predict their respective spatial distribution under different scenarios of forest loss and gain (through restoration and increased connectivity) to provide a blueprint for avoiding future species loss and assisting with their population recovery. From 2000 to 2019, 254,722 ha (6.7%) of natural forest was converted, primarily to plantations and shrubs. The species-specific responses over the study period revealed that the occurrence of elephant declined along the west, with a range shift to the northeast of Leuser, whereas wild boar underwent a dramatic widespread decline and although sambar experienced losses around the forest edge, it remained widespread in the interior forest, while tiger occupancy remained stable. Modelling habitat loss and fragmentation led to an unsurprising demise of Sumatran megafauna, whereas strategic investments that reconnected several forest patches provided disproportionately large benefits for their recovery through the recolonization of former parts of their range. Indonesia has achieved six consecutive years of declining forest loss rates, and our study’s findings can build off this conservation success by supporting improved provincial spatial planning and field-based restoration efforts that avoid declines of threatened megafauna species and act as a catalyst for rewilding a landscape of global importance.
Tropical forest loss along with the overexploitation of species, invasive alien species, and climate change, are driving down levels of global biodiversity at an alarming rate (Morris, 2010; IPBES, 2018; Harvey et al., 2022). As tropical forest landscapes are degraded, in particular by expanding settlements, farmlands and plantations, they lose their size, intactness, and biodiversity, which makes them less resilient to edge effects, climate change, and other pressures (Kinnaird et al., 2003; Senior et al., 2019). Forest habitat fragmentation can be especially harmful to wide-ranging species because it potentially limits their ability to migrate, disperse, find mates, feed, and therefore complete their life cycle (Tucker et al., 2018). Furthermore, the expansion of human activities into previously inaccessible forest areas has led to greater human presence, and increases the risk of human–wildlife conflicts and diseases spillover (Corlett, 2007; Inskip & Zimmermann, 2009; Symes et al., 2018; Vora et al., 2022).
Forest conversion has had an acute impact on mammalian assemblage, functional diversity, and the structure and composition of natural habitats (Ahumada et al., 2011; Vynne et al., 2022). It has led to a general decline in mammal populations that has raised concerns over the loss of key roles that certain mammals play in maintaining healthy ecosystems, such as through seed dispersal for forest regeneration, and mesopredator and ungulate control (Seidensticker, 1986; Kinnaird et al., 2003; Linkie et al., 2006; Gaveau et al., 2009; Luskin et al., 2017). The recent calls for rewilding (Fernández et al., 2017; Perino et al., 2019), especially of large-bodied mammals, is therefore seen as one way to restore ecological integrity and ecosystem health (Vynne et al., 2022).
Rewilding can be achieved through the reintroduction of individuals from extirpated populations to well-managed areas, such as the bison (Bison bison) in North America, or through reconnecting patches of natural habitats to facilitate recolonization by extant populations, such as the grey wolf (Canis lupis) across continental Europe (Sanderson et al., 2008; Szewczyk et al., 2019). Numerous studies have shown the positive impacts of rewilding and its positive feedback on forest regeneration and ecosystem health, more generally (Corlett, 2007; Budiharta et al., 2014; Crouzeilles et al., 2016; Omeja et al., 2016; Derhé et al., 2018; Acevedo-Charry & Aide, 2019).
A rewilding approach holds great potential for a country like Indonesia. It hosts globally important populations of threatened large mammal species and, despite having had high rates of forest change, it has maintained a trend of decreasing forest loss rates for six consecutive years (MoEF, 2022). While safeguarding the area and integrity of the remaining forest remains a priority, along with protecting its resident wildlife from poaching, these recent forest trends allow for greater consideration to be given to mapping out a pathway for species recovery, particularly in landscapes surrounding the better protected national parks (Luskin et al., 2017).
In this study, we investigate the association between forest change patterns and the population status of several threatened mammal species in the Leuser Ecosystem. We map and quantify temporal trends in forest cover change from 2000 to 2019 and use these data to assess the spatial drivers of forest loss. From this, we estimate the change in species occupancy for two of the national government’s priority species — Sumatran elephant (Elephas maximus ssp. sumatranus) and Sumatran tiger (Panthera tigris sumatrae) — and the principal prey of tiger — wild boar (Sus scrofa) and sambar (Rusa unicolor) — using field survey data collected in 2009 and 2019. We develop a spatially-explicit predictive model to explore how future patterns of forest loss and gain would influence the occurrence of elephant and tiger in the wider landscape.
The 2.6 Mha Leuser Ecosystem is one of the most important intact rainforests in Southeast Asia. Located at the northern end of the Indonesian island of Sumatra, the ecosystem straddles the provinces of Aceh and North Sumatra. The forest of the Leuser Ecosystem has a unique biodiversity richness due to its geological divisions that consist of: lowland forest, montane forest, freshwater swamp forest, mangrove forest, and peat swamp forest (Baukering et al., 2009). The Leuser Ecosystem is the only place on Earth where the Sumatran tiger, Sumatran rhino (Dicerorhinus sumatrensis), Sumatran orangutan (Pongo abelii), and Sumatran elephant, all critically endangered, coexist (IUCN, 2023). Due to its outstanding biodiversity and cultural values as well as the essential ecosystem services it provides, the Leuser Ecosystem has been globally recognized as a top priority tiger conservation landscape (Dinerstein et al., 2006), a UNESCO Tropical Rainforest Heritage Site (UNESCO, 2004), and currently on the “in danger” list (Setyawati et al., 2021). In Indonesia, it is considered a National Strategic Area for its Environmental Protection Function under Indonesian law (Government regulation No. 26/2008). Most (80%) of the Leuser Ecosystem is protected through its designation under Gunung Leuser National Park (GLNP, 31%), Forest Management Units (FMUs, 46%), and Singkil Wildlife Reserve (SWR, 3%).
The integrity of the Leuser Ecosystem is threatened by habitat conversion, primarily to smallholder farmland, and wildlife poaching. A network of 10,415 km of official and unofficial roads encircles the Leuser Ecosystem and, in key places, cuts into it, thereby providing direct access to the forest edge and sections of its interior (Sloan et al., 2018). These roads increase the likelihood of poaching for high-value wildlife species, such as tiger and elephant, or for subsistence hunting by local people (Figel et al., 2021). As consequences, dramatic declines of tiger prey, such as wild boar and sambar have been observed, while wild boar populations have been heavily impacted by the spread of African swine fever (ASF; Luskin et al., 2021). This prey base reduction provides one explanation for a recent increase in the frequency of human–tiger conflict incidents (Lubis et al., 2020).
Sumatran elephants and tigers require good quality forest habitats to thrive (Gopala et al., 2011; Goodrich et al., 2022), so we mapped forest cover change from land use and land cover (LULC) data published by the Indonesian Ministry of Environment and Forestry (MoEF) from 2000 to 2019 (Figure 1). The LULC dataset consists of 23 land cover classes that were generated by MoEF using visual interpretation of Landsat satellite imagery, with a mapping unit of 6.25 ha (MoEF, 2018a). For our analysis, we grouped the LULC data into five broader land cover classes: forest (FOR); plantation (PLT); cropland (CRP); shrubland (SHB); and non-vegetation areas (NON; Table S1). The forest class included six MoEF-defined forest types (primary dryland forest, secondary dryland forest, primary mangrove forest, secondary mangrove forest, primary swamp forest, and secondary swamp forest). We define habitat loss as when forest is converted to plantation (industrial plantation forest or plantation under MoEF’s LULC definition), cropland (dryland agriculture, mixed dryland agriculture, paddy field), shrubland (savanna, shrub, shrub swamp, and swamp), or non-vegetation area (settlement, cloud, bare land, water, fishpond, airport, transmigration, and mining). Habitat gain occurs when non-forest habitat (PLT, CRP, SHB, NON) returns to forest (FOR). The land cover change analysis was conducted using ArcMap 10.4.1 and R 4.2.1 (R Core Team, 2017).
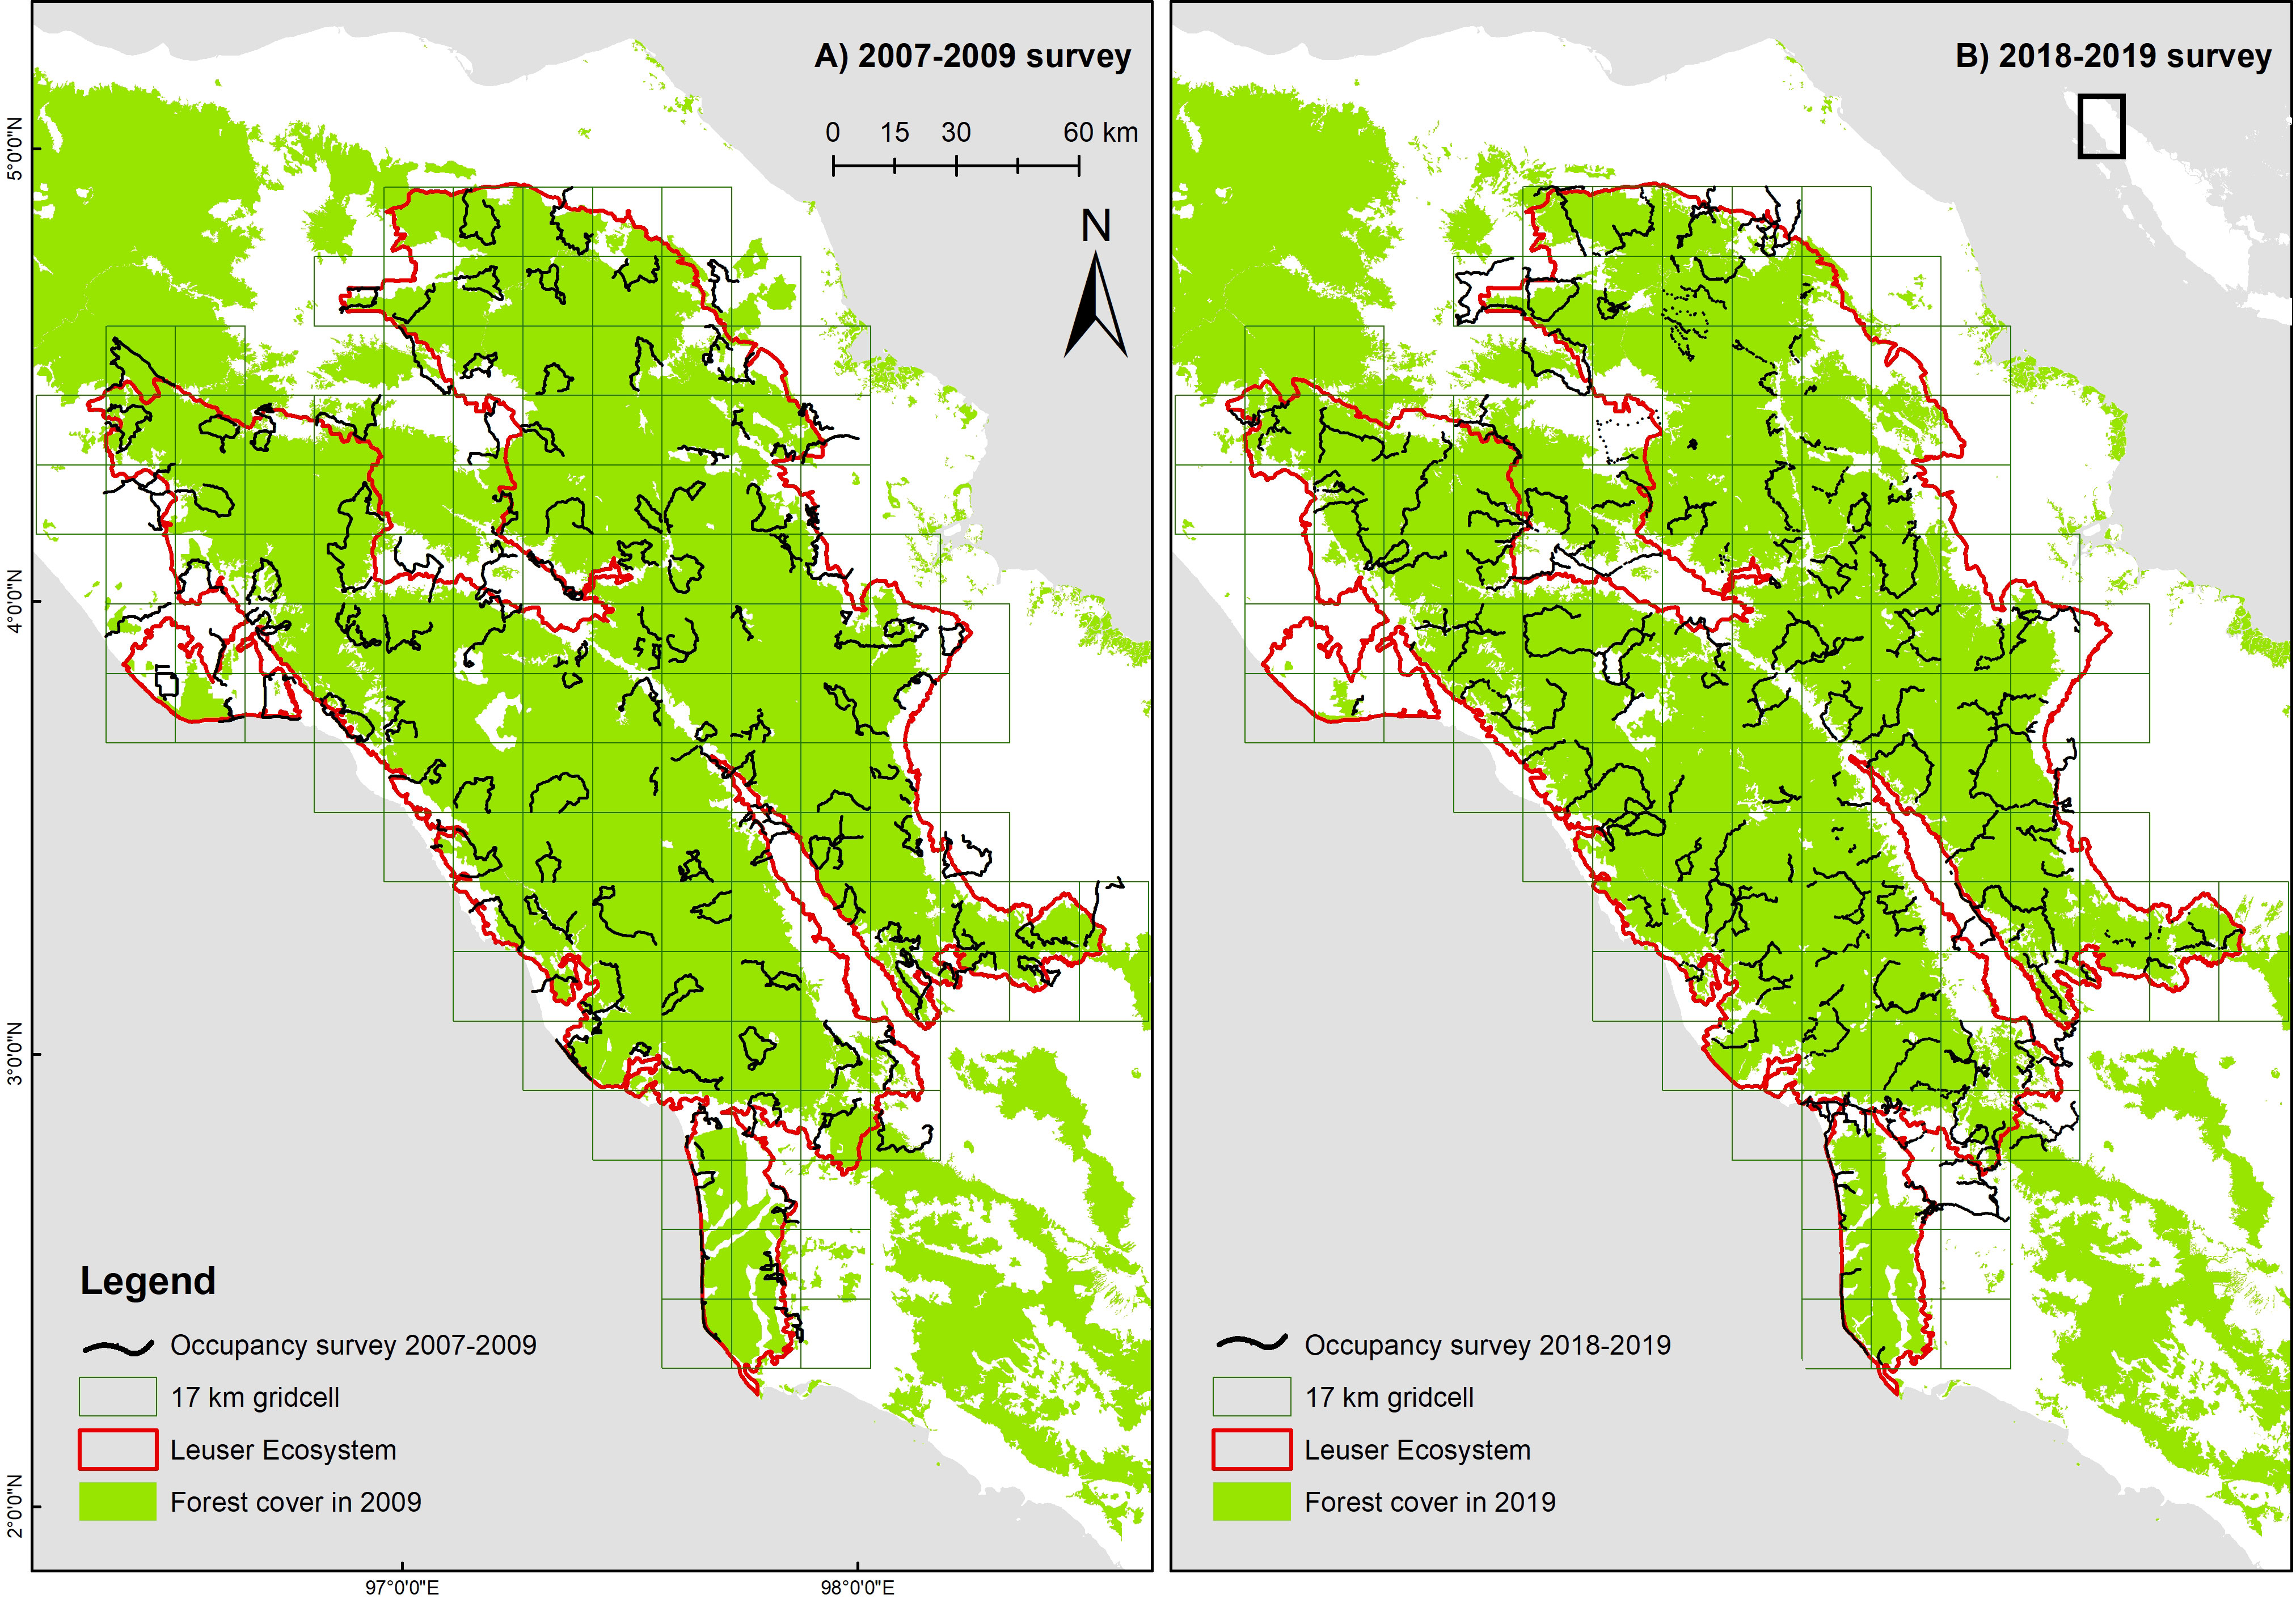
Figure 1 Occupancy survey design for the Leuser Ecosystem and transects surveyed in (A) 2007–2009 and (B) 2018–2019.
The Sumatra-wide Tiger Survey (SWTS), led by MoEF in partnership with several NGOs, was conducted in two time periods (2007–09 and 2018–19) in 21 landscapes encompassing 12.9 Mha, including the Leuser Ecosystem. The survey was designed to primarily collect data on Sumatran tiger, but also collected data on other mammalian species, namely Sumatran elephant, sambar, and wild boar. The survey’s aim was to determine species occupancy in the two time periods, population trends, and the environmental and anthropogenic factors that influence species occurrence (Chandradewi et al., 2019). In Leuser Ecosystem, the first survey was conducted between May 2007 and February 2009, whilst the second survey was conducted from October 2018 to December 2019. For each survey, species detection and non-detection data were collected along transects in a network of 17 × 17 km grid cells (Figure 1), an area based on the putative home range size of an adult male Sumatran tiger (Wibisono et al., 2011).
To address logistical and cost challenges, whilst incorporating a random sampling element, we conducted detection/non-detection surveys along continuous transects, following the methods outlined in Hines et al. (2010), Karanth and Nichols (2010), and Wibisono et al. (2011). This was done by creating random smaller quadrants (2.12 × 2.12 km) within each of the larger grid cells. Each field team had to create routes, which were mainly along the ridges that pass through these smaller random quadrants. The number of random quadrants varied from one to four depending on the percentage of forest cover. So, for example, a grid cell with 10%–35% of forest cover would be allocated one random cell, 36%–65% and 66%–85% of forest cover for two and three random cells, whereas a grid cell with > 85% forest cover would receive four random cells to be surveyed. The transect length (survey effort) was proportionate to the extent of forest habitat in a grid cell, and ranged from a minimum of 4 km for 10% forest coverage in a cell and up to 40 km for 100% forest coverage (Pinondang et al., 2018).
Transects were walked by 4–5 trained field staff searching for any sign of the target species such as pugmarks, footprints, and feces. Covariates such as habitat types were also measured along the transects. Similarly, the presence of poaching activity, such as snares, or signs of illegal logging (tree stumps, logged over trees, logged over spots, and processed woods) were collected during the surveys. Field teams were trained and equipped with a standardized field survey manual that was developed solely for this survey to minimize observation errors (Royle & Link, 2006). Survey effort, as measured in distance travelled, was calculated three dimensions by incorporating topography variability (z values) in the transect length walked in each 17 × 17 km grid cell using track2dm package in R (Lubis, 2021).
We calculated habitat loss and gain in four periods (2000–2006, 2006–2009, 2009–2014, and 2014–2019) and presented the trends of habitat conversion as a Sankey diagram (Figure 2; Schmidt, 2008). To understand the drivers of forest change in our study area, we used a logistic regression analysis to investigate which combination of environmental predictors explained the presence or absence of forest loss (Table S2). First, we created geospatial information systems (GIS) layer over our study site depicting forest change between 2000 and 2014 with four classes (forest loss, forest gain, and remaining forest habitat and non-forest habitat). We randomly assigned 10,000 points over our study area and only selected 398 points that fell on forest cover class (N = 345) and forest loss class (N = 50) with minimum distance of 5 km between points. We then combined points from forest loss and forest cover habitat to be used as presence and absence of habitat loss for the habitat loss modelling. We used the same number of points for forest loss and forest cover. For example, we used 50 points of forest loss and randomly select 50 points over forest cover classes from 2000 and 2014 GIS map for model calibration/training. Similarly, we used 35 forest points and 35 forest loss points from 2014 and 2019 GIS map for model validation.
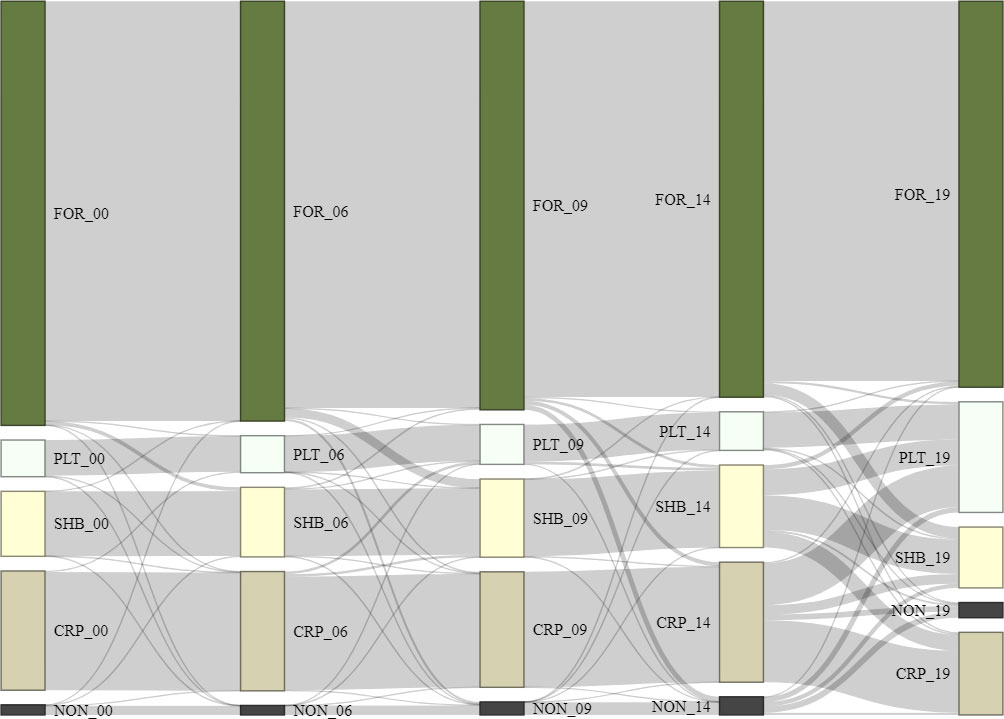
Figure 2 Land use changes in the Leuser Ecosystem between 2000 and 2019, where forest (FOR_00), plantation (PLT_00), shrub (SHB_00), croplands (CRP_00), and non-forest (NON_00) were generated using MoEF land use land cover data for the year 2000, and then the years 2006, 2009, 2014 and 2019.
We used six environmental predictors based on our prior assumptions of drivers of tropical forest loss (Table S2). These included a terrain ruggedness index (tri), distance to village (dist. to village), distance to roads (dist. to road), distance to river (dist. to river), distance to forest edge in 2000 (dist. to forest edge), and distance to large oil palm plantation (dist. to oilpalm). The tri was generated based on an algorithm developed by Riley et al. (1999) that express the difference in elevation between adjacent cells using digital elevation data (Jarvis et al., 2008). The dist. to village, dist. to road and dist. to river layers were generated using village points, road networks, and river networks, respectively, from the Indonesian Geospatial Agency (BIG). Dist. to forest edge was calculated from 2000 forest cover data (MoEF, 2018b). We used the extent of oil palm plantation published by Danylo et al. (2021) to generate the dist. to oilpalm predictor variable. We only used large plantation (>100 ha) established between 1985 and 2014 across the study area to create the GIS layer. All GIS variables were standardized using z-scores transformation ((y-)/SDy). All raster calculation were performed using ArcMap 10.4.1 and R 4.2.1 (R Core Team, 2017).
We fitted the model using a logistic regression, using 50 present and 50 absent forest loss points for 2000 and 2014 as our response variable. This model explains the likelihood of forest loss based on the above predictor variables. We measured the presence of multicollinearity among the variables and avoided using variables that have high correlation coefficient (Pearson’s r > |0.6|; Figure S1) in the same model. The top ranked model was chosen based on the lowest small sample size corrected Akaike’s Information Criterion value (AICc; Akaike, 1998). In addition, we assessed model accuracy by comparing the spatial prediction of habitat loss from each candidate model with 70 independent points generated from 2014 and 2019 GIS map and calculated the receiver operating characteristic (ROC) curve (Hanley and McNeil, 1982). The logistic regression analysis was performed using R software and the AUC values were calculated using pROC package (Turck et al., 2011) in R.
We applied a single species hierarchical occupancy model (MacKenzie et al., 2002) to estimate the detection probability and occupancy value for each of the study species (elephant, tiger, wild boar, and sambar), and extended this model to incorporate the correlated detection model (Hines et al., 2010) for each SWTS survey period (2007–2009 and 2018–2019). In our modelling framework, we applied different grid cell sizes for different species based on their different home range size. We used 17 × 17 km grid cell to estimate the occupancy of tiger and elephant that have a large home range (Linkie et al., 2008; Wibisono et al., 2011). We used 8.5 × 8.5 km grid cell (subdividing 17 km grid cell by four) for smaller species such as wild boar and sambar (Gopalaswamy et al., 2012). For each grid cell size (17 × 17 km and 8.5 × 8.5 km), we extracted spatial replicates at three lengths; 1 km, 3 km, and 5 km. Detection and non-detection data from the four study species were extracted from each spatial replicate. To avoid misidentification of these species, we only used specific signs of the species such as pugmarks and direct observations for tigers, and used footprint, feces, and direct observations for elephants and sambar, and including nest for wild boar. We only used signs with high certainty noted by the field observers. We used track2dm package (Lubis, 2021) in R software to extract detection and non-detection data for each species including survey covariates (e.g., habitat type) in various replicate lengths and grid sizes for both SWTS survey periods (2007–2009 and 2018–2019).
The detection and non-detection data for each species were fitted using a single species, single season occupancy framework that accounted for spatial correlation of detections (Hines et al., 2010). For each species and each survey period, four key parameters were estimated: probability of species presence (ψ), probability of detecting a species (p) in a spatial replicate conditional on presence, probability of species presence in a segment if the site is occupied and the species was absent in the previous segment (θ0), and probability of species presence in a segment if the site is occupied and the species was present in the previous segment (θ1). The latter two parameters were developed to account for a Markov process that assumes a strong correlation exists between successive spatial replicates (Hines et al., 2010).
Based on priori information (Table S2), we hypothesized that species occupancy (ψ) was associated with environmental covariates, such as elevation, slope, total area of forest cover (fcover_area), number of forest cover patches (fcover_patches), human disturbance (disturbance) and, for tiger only, prey occurrence (prey). The detection of a species (p) was hypothesized to be influenced by proportion of forest habitat (forest_hab) collected directly during the surveys. Elevation and slope were generated using elevation data (Jarvis et al., 2008), which were used to estimate species occupancy in both survey periods, whilst fcover_area, fcover_patches, prey, disturbance, and forest_hab layers were specifically created for each survey period. For example, to estimate species occupancy in 2009, we used MoEF’s forest cover map in 2009 (MoEF, 2018b) to create fcover_area and fcover_patches layers. Whilst prey, disturbance, and forest_hab layers which were the proportion of prey species (including wild boar and sambar) and human disturbance (including the signs of illegal poaching, illegal logging, encroachment, and non-timber forest product extraction), and forest habitat respectively, detected along the transect lines during 2007–2009 occupancy survey. A similar approach was used to create fcover_area, fcover_patches, prey, and disturbance to estimate species occupancy and forest_hab to account for detectability using 2018–2019 data. All predictor variables were extracted for each grid cell for each species using ArcMap 10.4.1 and R software.
We assessed the robustness of each replicate length (1 km, 3 km, and 5 km) by creating a null model (without covariates) and a global model (with all non-correlated covariates) for each species in each survey period and compared their AICc values. From all species and in both survey periods, our preliminary analysis revealed that 5 km replicates had the lowest AICc values and were therefore used in the subsequent analyses.
In the second step, we developed ~10 models for each of the four species with different combination of elevation, slope, fcover_area, fcover_patches, prey, and disturbance covariates to the occupancy component, and only used forest_hab for the detection component (Tables S3, S4). The candidate models were built with a maximum of two covariates for and one covariate for p, while keeping θ0 and θ1 with no covariates. We avoided using models with covariates that had a correlation coefficient of more than 0.6 (Figure S2) to avoid overfitting. We dropped any model that failed to converge and selected the top-ranked model based on lowest AICc values to generate point estimates of probability of species occurrence (ψ) and its corresponding detectability (p) from the two survey periods. We note that the RPresence package we used in this analysis does not facilitate any goodness of fit test for the correlated detection model (Hines et al., 2010). So, in order to measure the uncertainty for ψ and p, we used a non-parametric bootstrap technique by randomly selecting the detection and non-detection data with replacement, re-fitting the model (using the top-ranked model), extracting mean ψ and mean p, and repeating this 1,000 times to produce 1,000 mean ψ and 1,000 mean p as bootstrap distributions (MacKenzie et al., 2006; Kéry and Royle, 2015). We then generated 95% confidence intervals for ψ and p by selecting the 2.5% and 97.5% percentile from the bootstrap’s distribution.
We developed spatial predictions of species occupancy in each survey period using the top-ranked model’s regression coefficients with a “predict” function from the raster package in R (Hijmans et al., 2017). We used a threshold of 0.5 to convert the probability map into a binary map that consists of unoccupied (< 0.5) and occupied (≥ 0.5) cells. We then compared the species occupancy change between seasons using spatial matching, where for each grid cell, we evaluated whether the occupancy status for each species had changed between the two survey periods. For this, we created a new raster layer based on these two spatial predictions of species occupancy. This new raster layer had four categories; 0 if a cell remained unoccupied in both periods, 1 if the occupied cell became unoccupied (locally extinct), 2 if an unoccupied cell became occupied (recolonized), and 3 if the cell remained occupied in both periods. We created a single raster layer for each species and calculated the areas (in hectares) for each category.
We developed scenarios for forest gain and loss and modelled the effects of this habitat change for Sumatran elephant and Sumatran tiger, since these two subspecies are critically endangered and require large forest areas for their survival. We used the occupancy estimates of elephants and tigers from 2018–2019 data (Table S5) with the forest habitat variable to extrapolate species occurrence to forest connected to the Leuser Ecosystem in the provinces of Aceh to North Sumatra. We developed 10 scenarios for future forest habitat ranging from worst to best scenarios. We used the predicted model of habitat loss generated from the top-ranked model’s regression coefficients (Table 1) where the forest near the forest edge in 2000, particularly in areas with less rugged terrain, were more prone to undergoing changes.
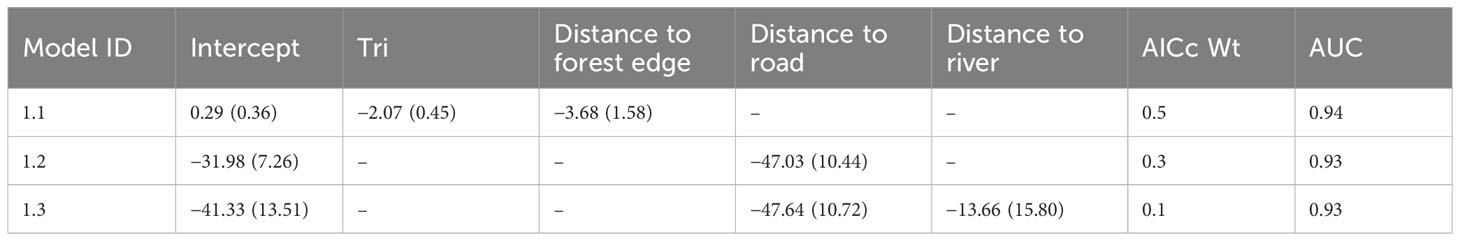
Table 1 Regression coefficients ( ± SE) for models within four delta AICc units (supported models), model weight (AICc Wt) and area under the curve (AUC) of the operating plot, depicting the association between forest loss and environmental predictors in the Leuser Ecosystem.
For the forest loss scenarios (#1–5), we disaggregated predicted habitat loss into five classes based on the interquartile range of the predicted probability of forest loss: 20%, 40%, 60%, 80%, and 100% (Figure S3). For the forest gain scenarios (#6–10), we predicted that varying amounts of degraded forest would be recovered, and reforestation strategies would be implemented to reconnect forest patches. We used a global study on mapping reforestation potential to prioritize areas for forest restoration and reforestation to mitigate climate change impacts and improve ecosystem functioning (Rayden et al., 2023). Using the reforestation potential map, we developed five habitat gains scenarios by splitting the raster data into five equal areas ranging from low to high values of potential areas. This allowed us to predict what would happen to elephant and tiger occupancy if 20%, 40%, 60%, 80%, and 100% of this potential habitat was restored (Figure S3).
Predicted areas (as a percentage) from the forest loss and forest gain scenarios were calculated by multiplying the probability of occupancy generated from top-ranked model for both elephant and tiger with the total area for each grid cell. For instance, if a cell had ψ = 0.7, the occupied area for that cell would be 0.7 × 28,900 ha, which is 20,230 ha, i.e., equal to 70%.
We recognize several limitations in our study that warrant consideration. Firstly, each survey period extended between 14 to 22 months, potentially violating the closed population assumption, particularly for highly mobile animals like tigers, which have large home ranges and may exhibit movements during the survey period (Tilson and Nyhus, 2010; Priatna et al., 2012; Simcharoen et al., 2014). Although dynamic occupancy models, accounting for changes in occupancy over time with colonization and extinction probabilities, were considered to address this issue (MacKenzie et al., 2003), their application was constrained due to the low density of tigers and limited species detections. Moreover, the positive correlation between local occupancy of successive segments, which should be considered in dynamic models (Hines et al., 2014), may inflate occupancy probability estimates (Emmet et al., 2021).
Secondly, the future predictions of our forest habitat models were based solely on regression estimates from the top-ranked occupancy model, using data taken only from 2018 and 2019. As a result, these predictions lack empirical validation using data from other periods, potentially affecting the reliability and generalizability of our findings. Additionally, while the importance of forest habitat to the survival of both megafauna species was found to be similar in 2009 and 2019 (Table S5), the study lacks a dynamic model approach, which might provide a more nuanced understanding of the relationships between forest cover loss and megafauna occurrence, by explicitly identifying parameters associated with the extinction process. Thus, future research should endeavor to incorporate data from multiple time periods and employ dynamic modeling techniques, effectively addressing the challenges posed by species mobility and utilizing more comprehensive datasets for validation purposes.
From 2000–2019, forest cover in the Leuser Ecosystem remained largely intact. The 2.4 Mha of forest in 2000 underwent an average annual loss of 0.3% (or 13,406 ha). Forests were mainly converted to shrubland (2.9%), followed by plantation (2.4%), and cropland (1.1%). Plantation expansion (11.5%) was most substantial during 2014 and 2019 where 6.4% of croplands, 3.9% of shrubland, 0.8% of non-forest, and 0.4 of forest were converted to plantation (Figure 2). The conversion of forests around Leuser Ecosystem mainly occurred at the habitat edges especially along roads or at lowland areas.
Based on our top-ranked model (Tables 1; Table S6), forest loss was more likely to occur in areas that were less rugged and closer to the forest edge (Figure S4). This model had a high predictive accuracy (AUC = 0.94) as compared to an independent land use type dataset for the years 2014–2019. The residual of the selected model was not affected by spatial autocorrelation (Moran’s I = −0.03, P > 0.1). Sub-setting the predicted habitat loss model with 2019 forest edge data revealed patches of lowland forest that were both important for biodiversity and at a high risk of clearance (Figure 3). This highlighted the two largest intact peatlands of Singkil WR and Kluet (inside GLNP) as being particularly susceptible to future conversion.
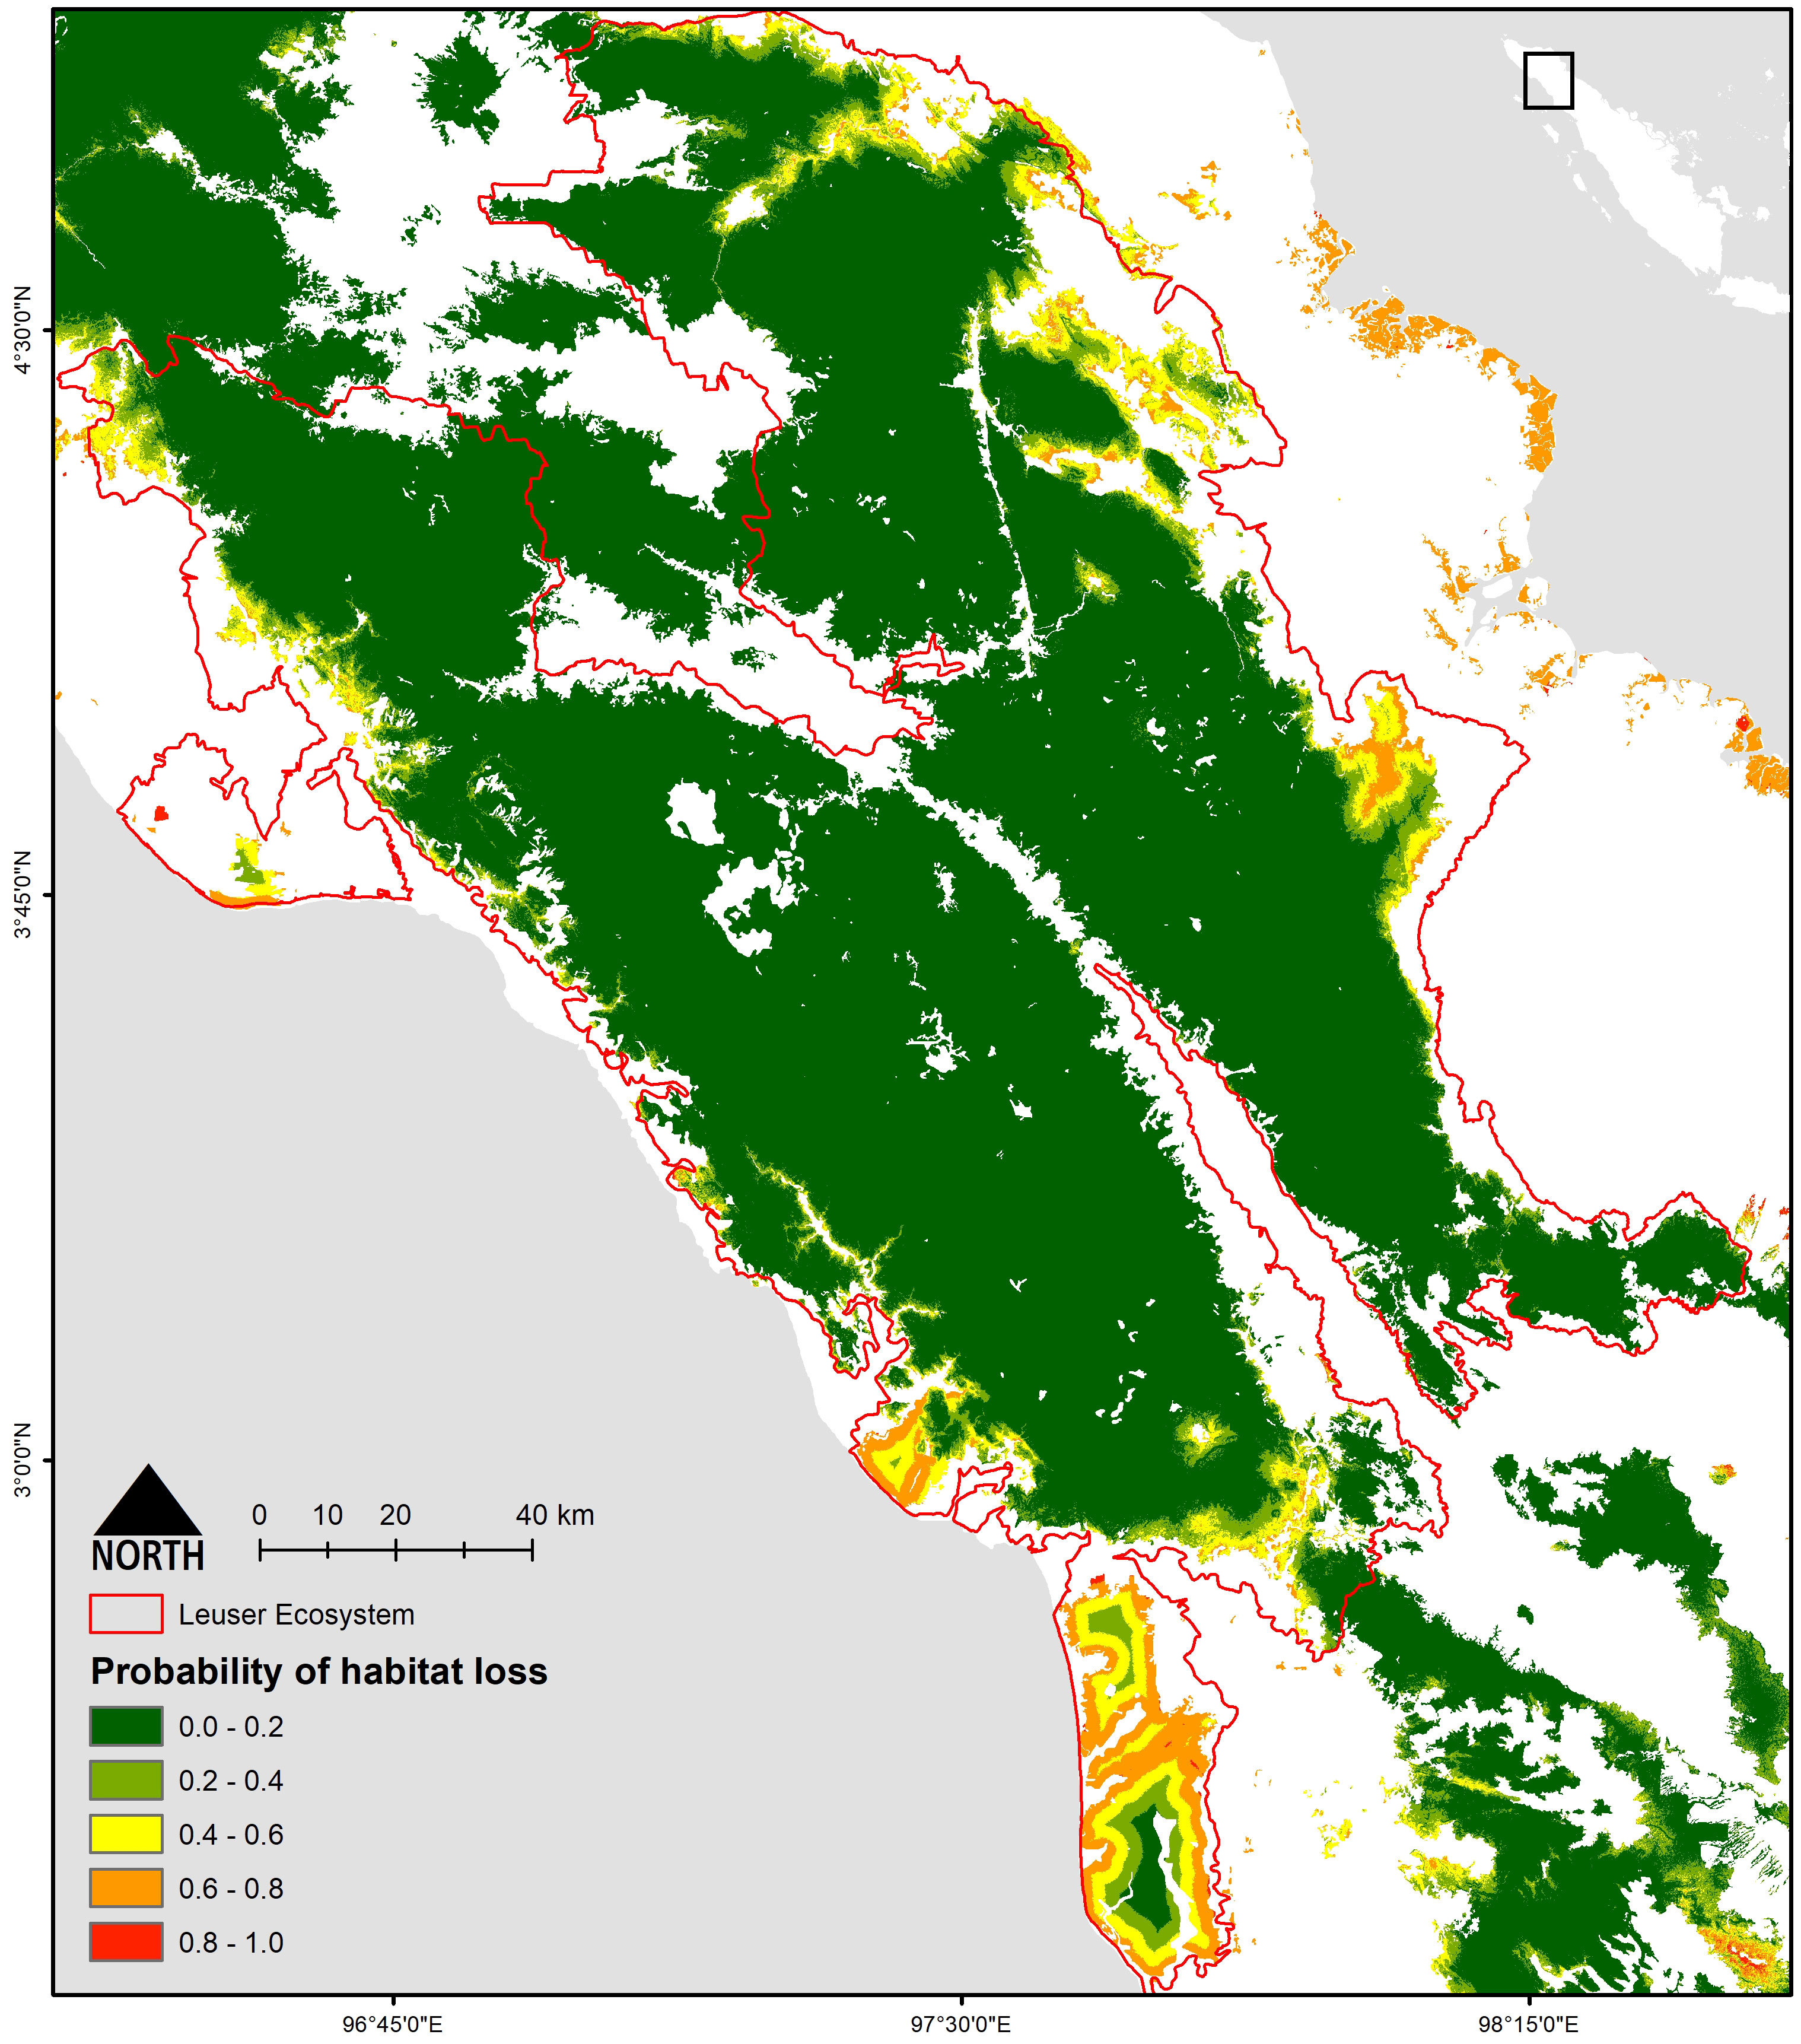
Figure 3 Probability of habitat loss in Leuser Ecosystem.
The occupancy survey conducted in the first period (2007–2009) had a sampling effort of 4,483 km in 119 17 × 17 km grid cells (average of 37 ± 15 km per cell). In the second period (2018–2019), the total survey effort increased by 25% to 5,639 km in 109 grid cells (average of 51 ± 28 km per cell; Figure 1). Comparing across the two sampling periods, signs of elephant occurrence were found in 34 grid cells (naïve occupancy = 0.29) in the first period and then 19 grid cells (0.17) in the second period. Signs of tiger occurrence were found in 50 grid cells (0.42) in the first period and then 37 grid cells (0.34) in the second period. For tiger prey, using smaller grid cells (8.5 × 8.5 km), naïve occupancy decreased for each species: wild boar (193 to 50 cells, or 0.57 to 0.15); and sambar (188 to 91, 0.55 to 0.28; Table 2).
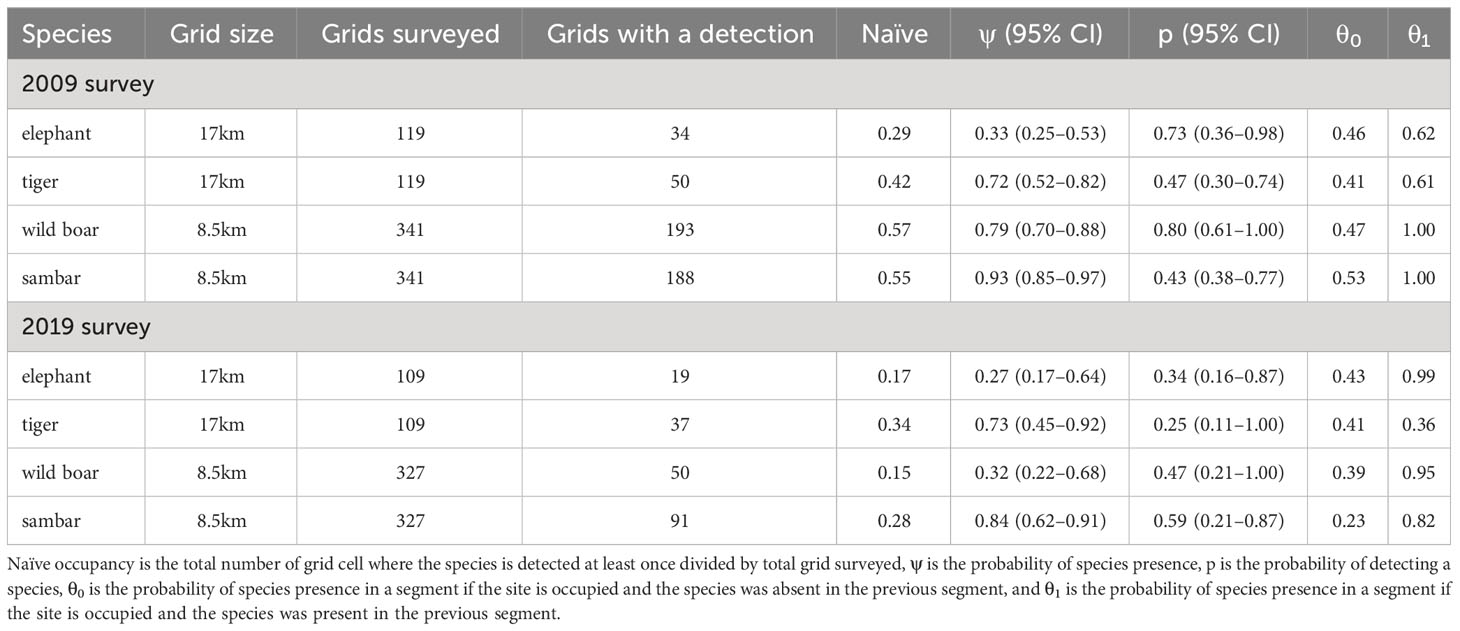
Table 2 Survey effort and parameter estimates of single season occupancy from 2009 and 2019 surveys with correlated detection from the top-ranked model for each species.
The mean occupancy estimate for each species, except tiger (1.4% increase), declined over the two time periods. This reduction in mean occupancy was most pronounced for wild boar (−59.5%), elephant (−18.2%), and sambar (−9.7%), although sambar still maintained a high level of occurrence in the study area (ψ = 0.84; Figure 4). Changes in detection probability were observed for each species and the differences were statistically significant (Table 2). We found for all species in both periods that even using 5 km transect lengths as replicates, the probabilities of a species being present in a 5 km transect was higher when that species was also detected in the previous 5 km transect (θ1; Table 2).
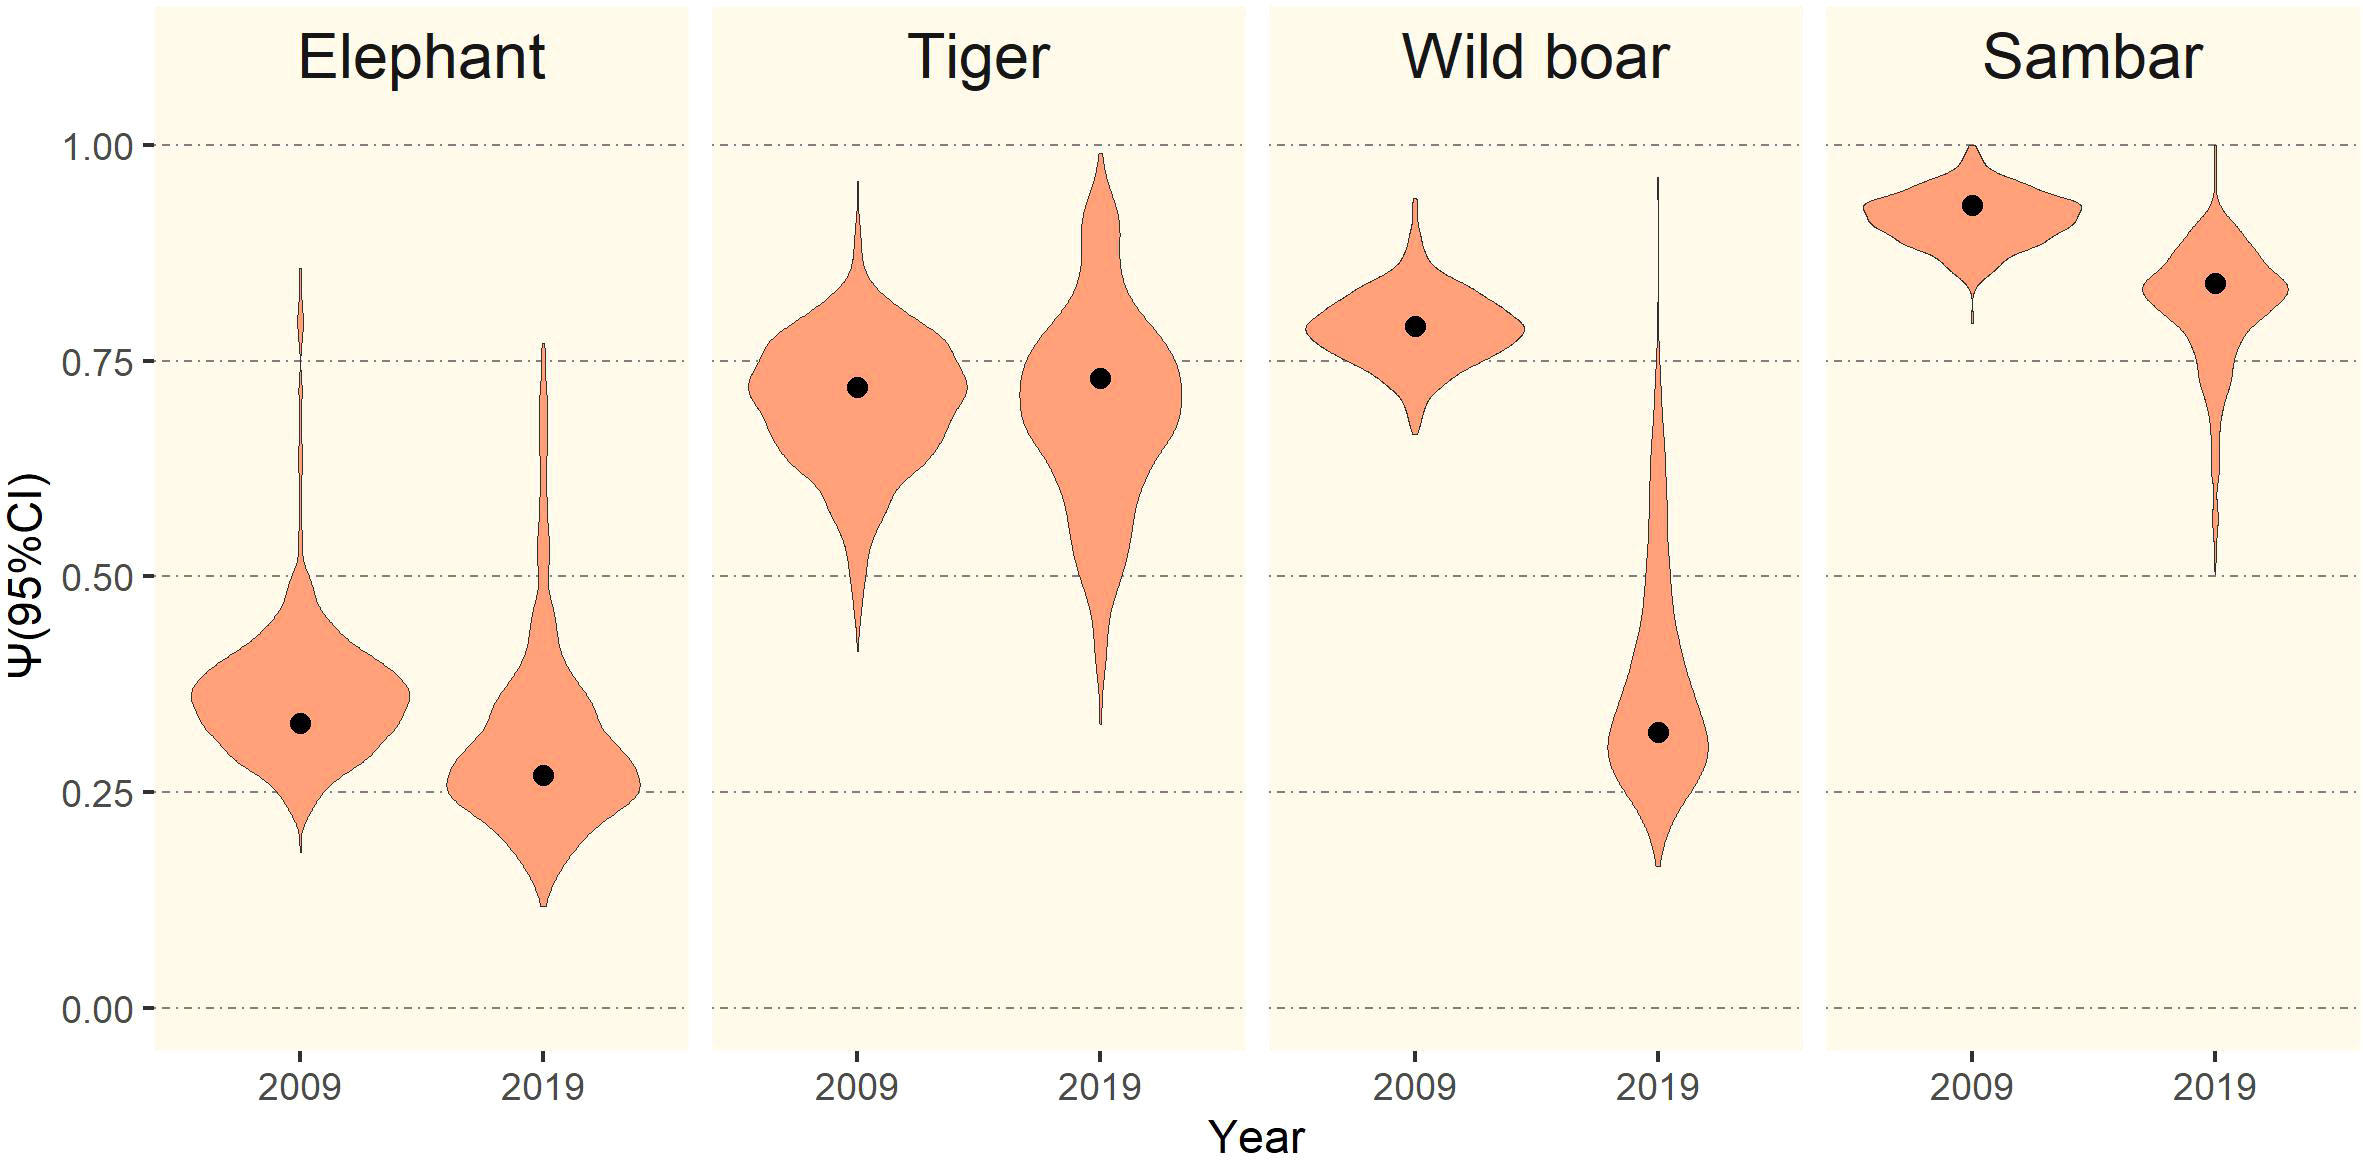
Figure 4 Mean occupancy estimates (black dots) with 95% CI (violin plots) of elephant, tiger, wild boar, and sambar in Leuser Ecosystem in survey periods 2009 and 2019.
In the 2008–2009 survey, forest cover area and disturbance were positively correlated with the occurrence of elephants and tigers. Disturbance was positively associated with wild boar especially at lower elevation. Sambar occupancy was associated with areas of flatter slope and in a more fragmented forest (higher number of forest patches). In the 2018–2019 survey, elephant occupancy was higher in areas with more intact forest and higher disturbance. For tigers, in addition to higher forest cover area, this species was found in areas with a higher proportion of wild prey species. Wild boar preferred less rugged areas and more fragmented forests. Sambar showed a positive association with forest cover (Figure 5; Table S5).
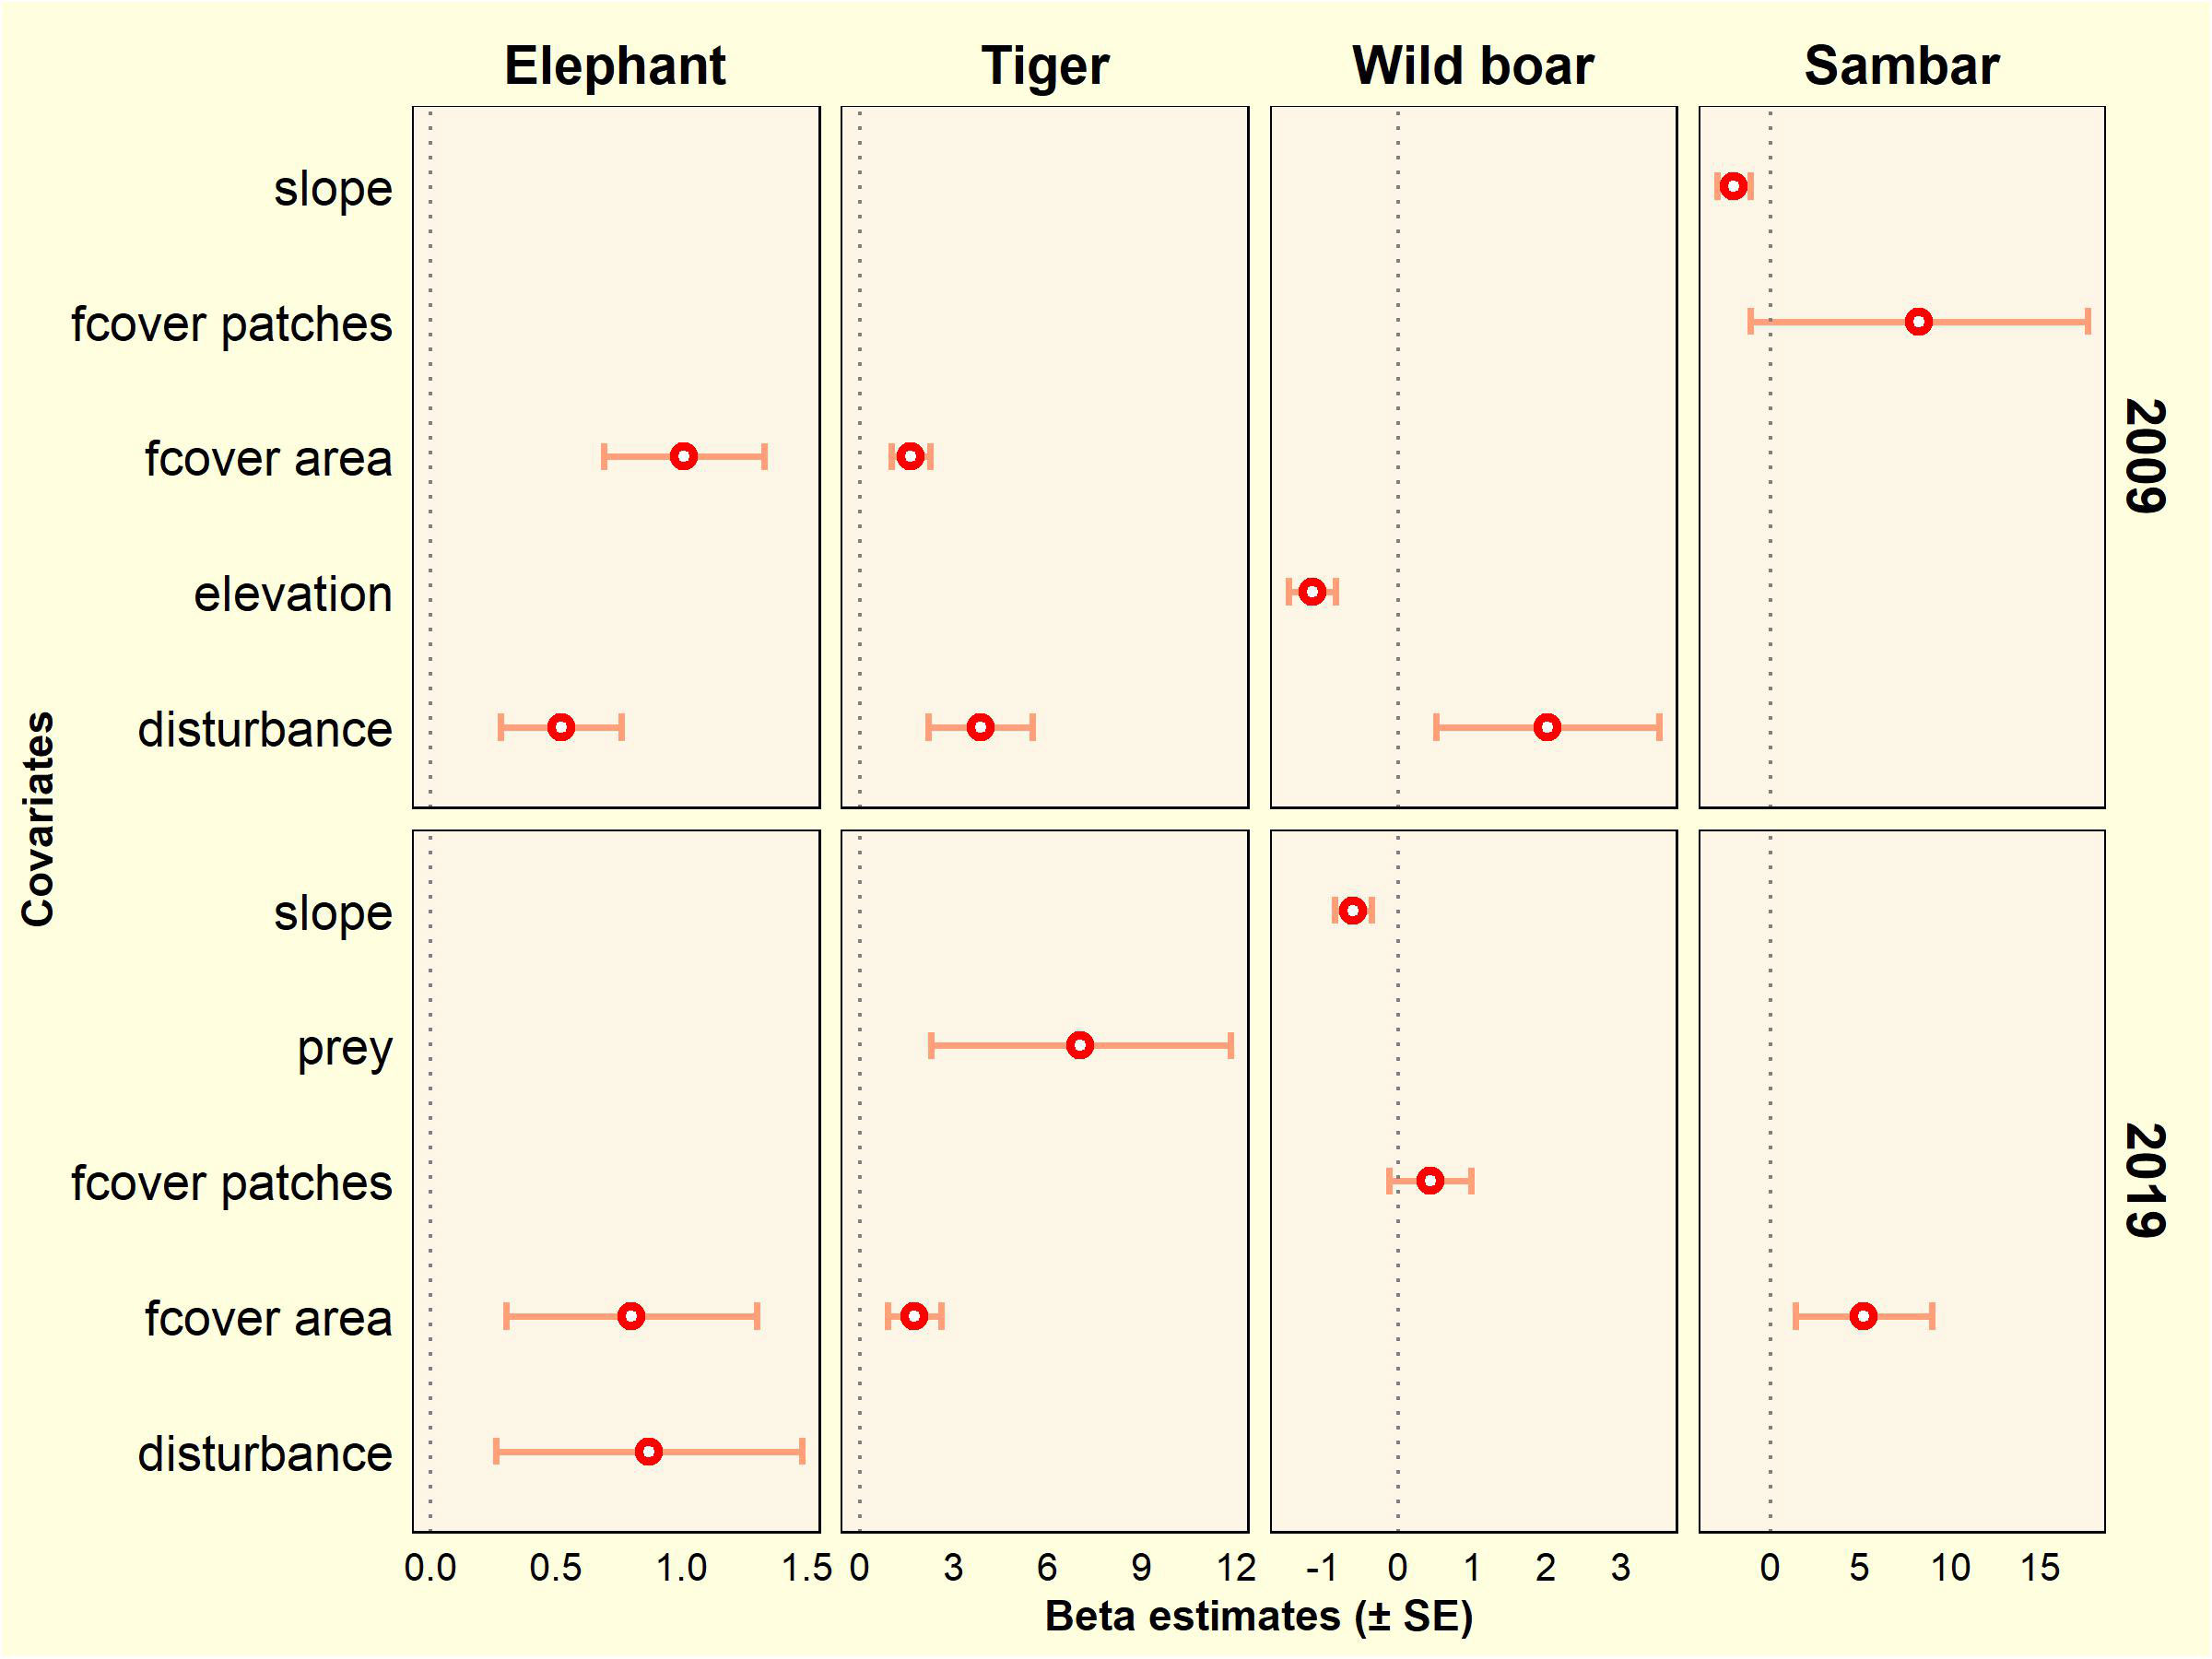
Figure 5 Covariate effects on occupancy estimates based on the top-ranked model for tiger, elephant, wild boar, and sambar in the Leuser Ecosystem from two survey periods (2009 and 2019).
Tiger and sambar had high levels of occupancy (78.4% and 72.3%) in both survey periods but had strong predicted patterns of local extinction along the forest edge, with 21.6% and 27.7% of grid cells that were occupied by tiger and sambar in 2009 being no longer occupied in 2019 (Figure 6). Elephants had limited distribution in the study area, due to the unsuitable rugged terrain located in the interior areas, as reflected by their absence in most (73.4%) grid cells in both survey periods. The local extinction and colonization patterns were mixed, with elephant decline along the west side of the Leuser Ecosystem and shifting their range in the northeast forest patch. Wild boar experienced dramatic occupancy changes, where occupied areas in 2009 (72.3%) were extinct in 2019. Only a small percentage (25.9%) of areas were occupied by wild boar in 2019 and these were mostly (21.2%) in lowland forest located near the forest edge (Figure 6).
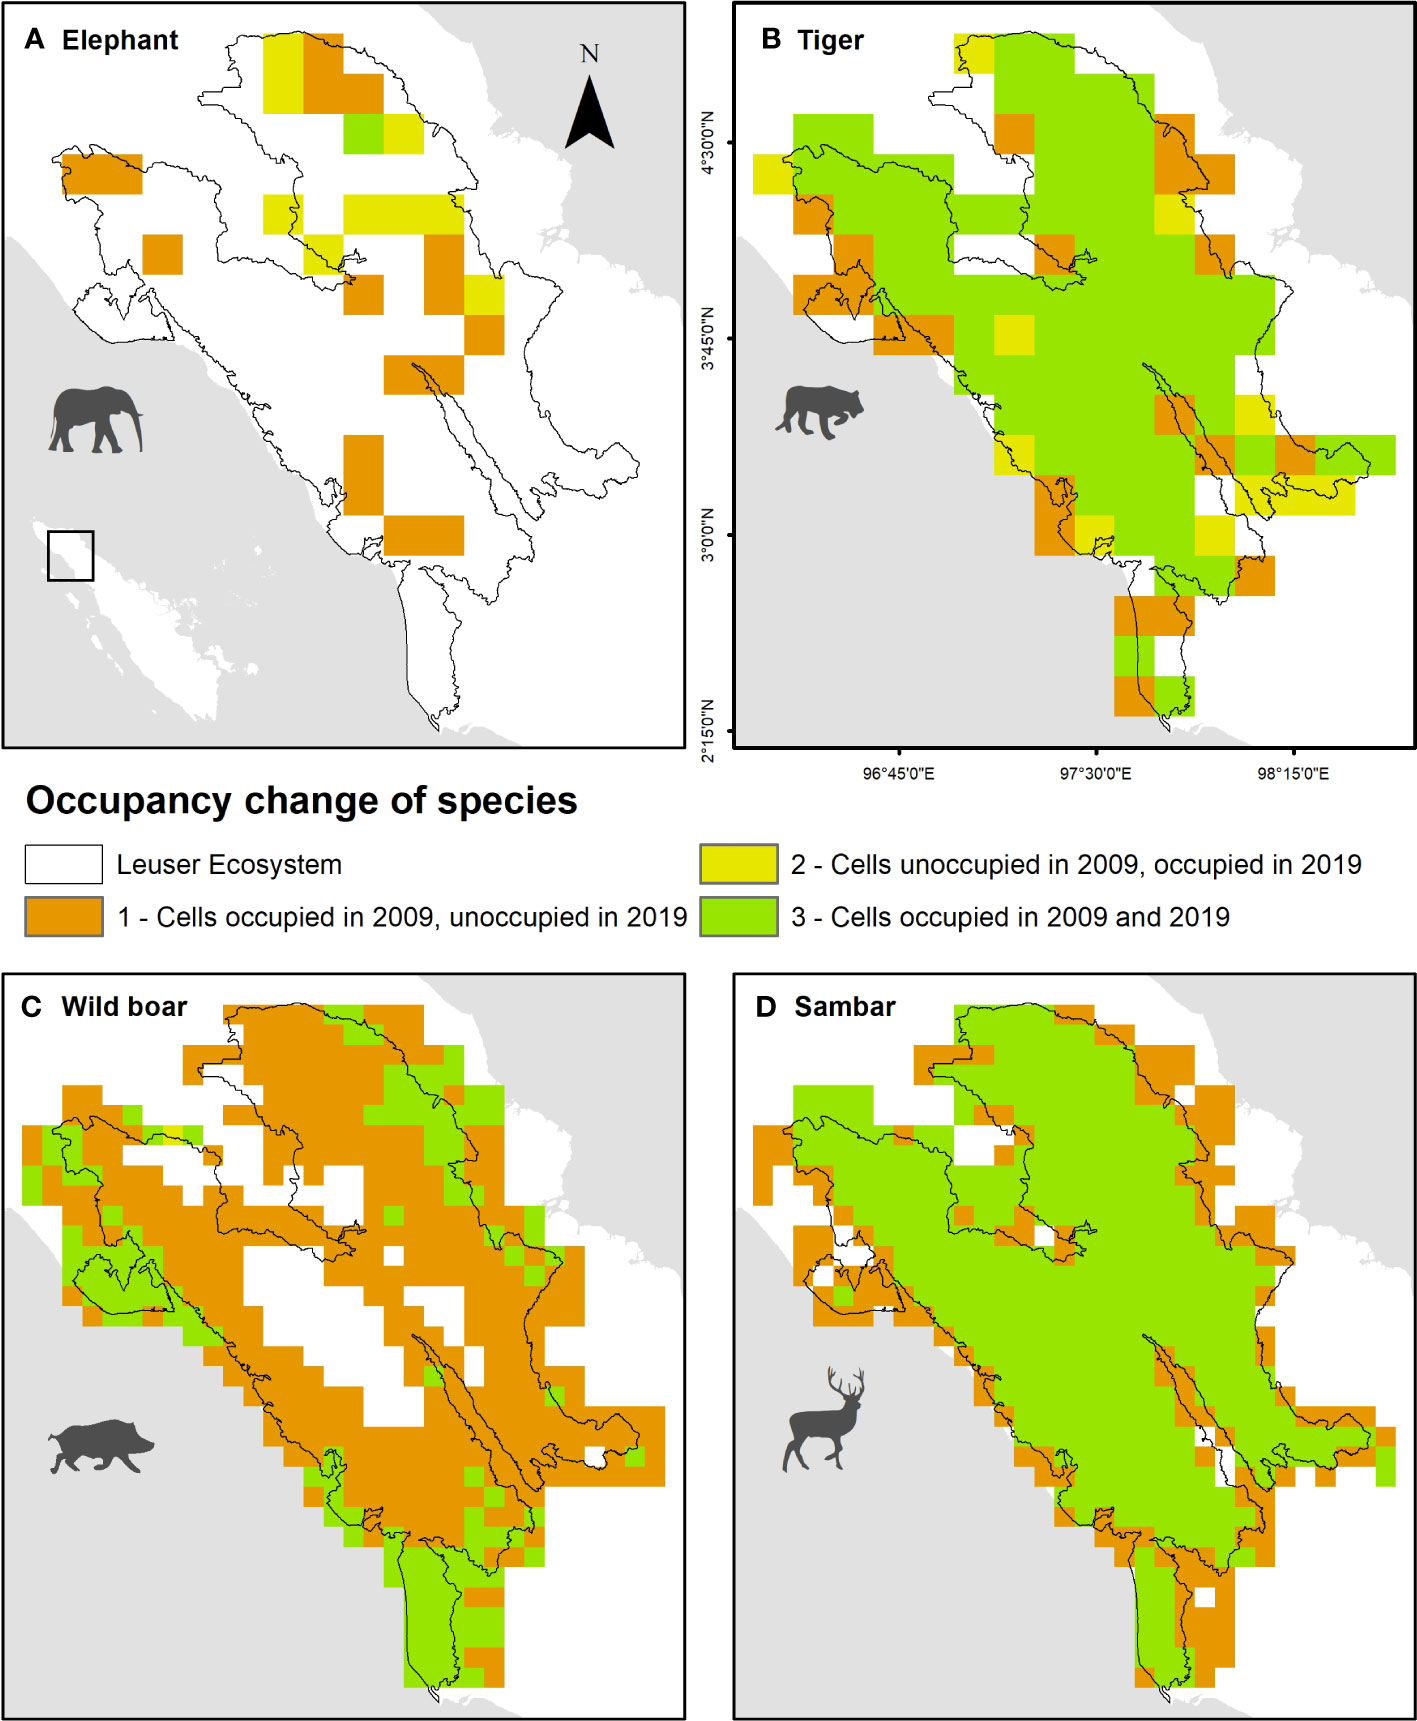
Figure 6 Spatial occupancy change of (A) elephant, (B) tiger, (C) wild boar, and (D) sambar in Leuser Ecosystem between 2009 and 2019.
Forest cover was found to be the single most important predictor of elephant and tiger occupancy in 2019, followed by human disturbance and, additionally for tiger, wild prey. Based on this result, we were able to explore how future forest cover change could impact elephant and tiger populations. A 20% decline in forest habitat, for example, was predicted to result in an occupancy decrease by 2–3% for elephant and 10–12% for tiger, whilst a 20% increase in habitat led to an occupancy increase of 2–4% for elephant and 5–10% for tiger (Figure 7). Under the most progressive habitat gain scenario (#1), connecting the western and eastern forest patches in Leuser Ecosystem (Figure 7) resulted in an occupancy increase of 67% for tiger and 23% for elephant. In this scenario, elephants mainly benefitted from increased lowland habitat, while tiger benefitted from increased interior forest habitat that was more rugged (Figure 7).
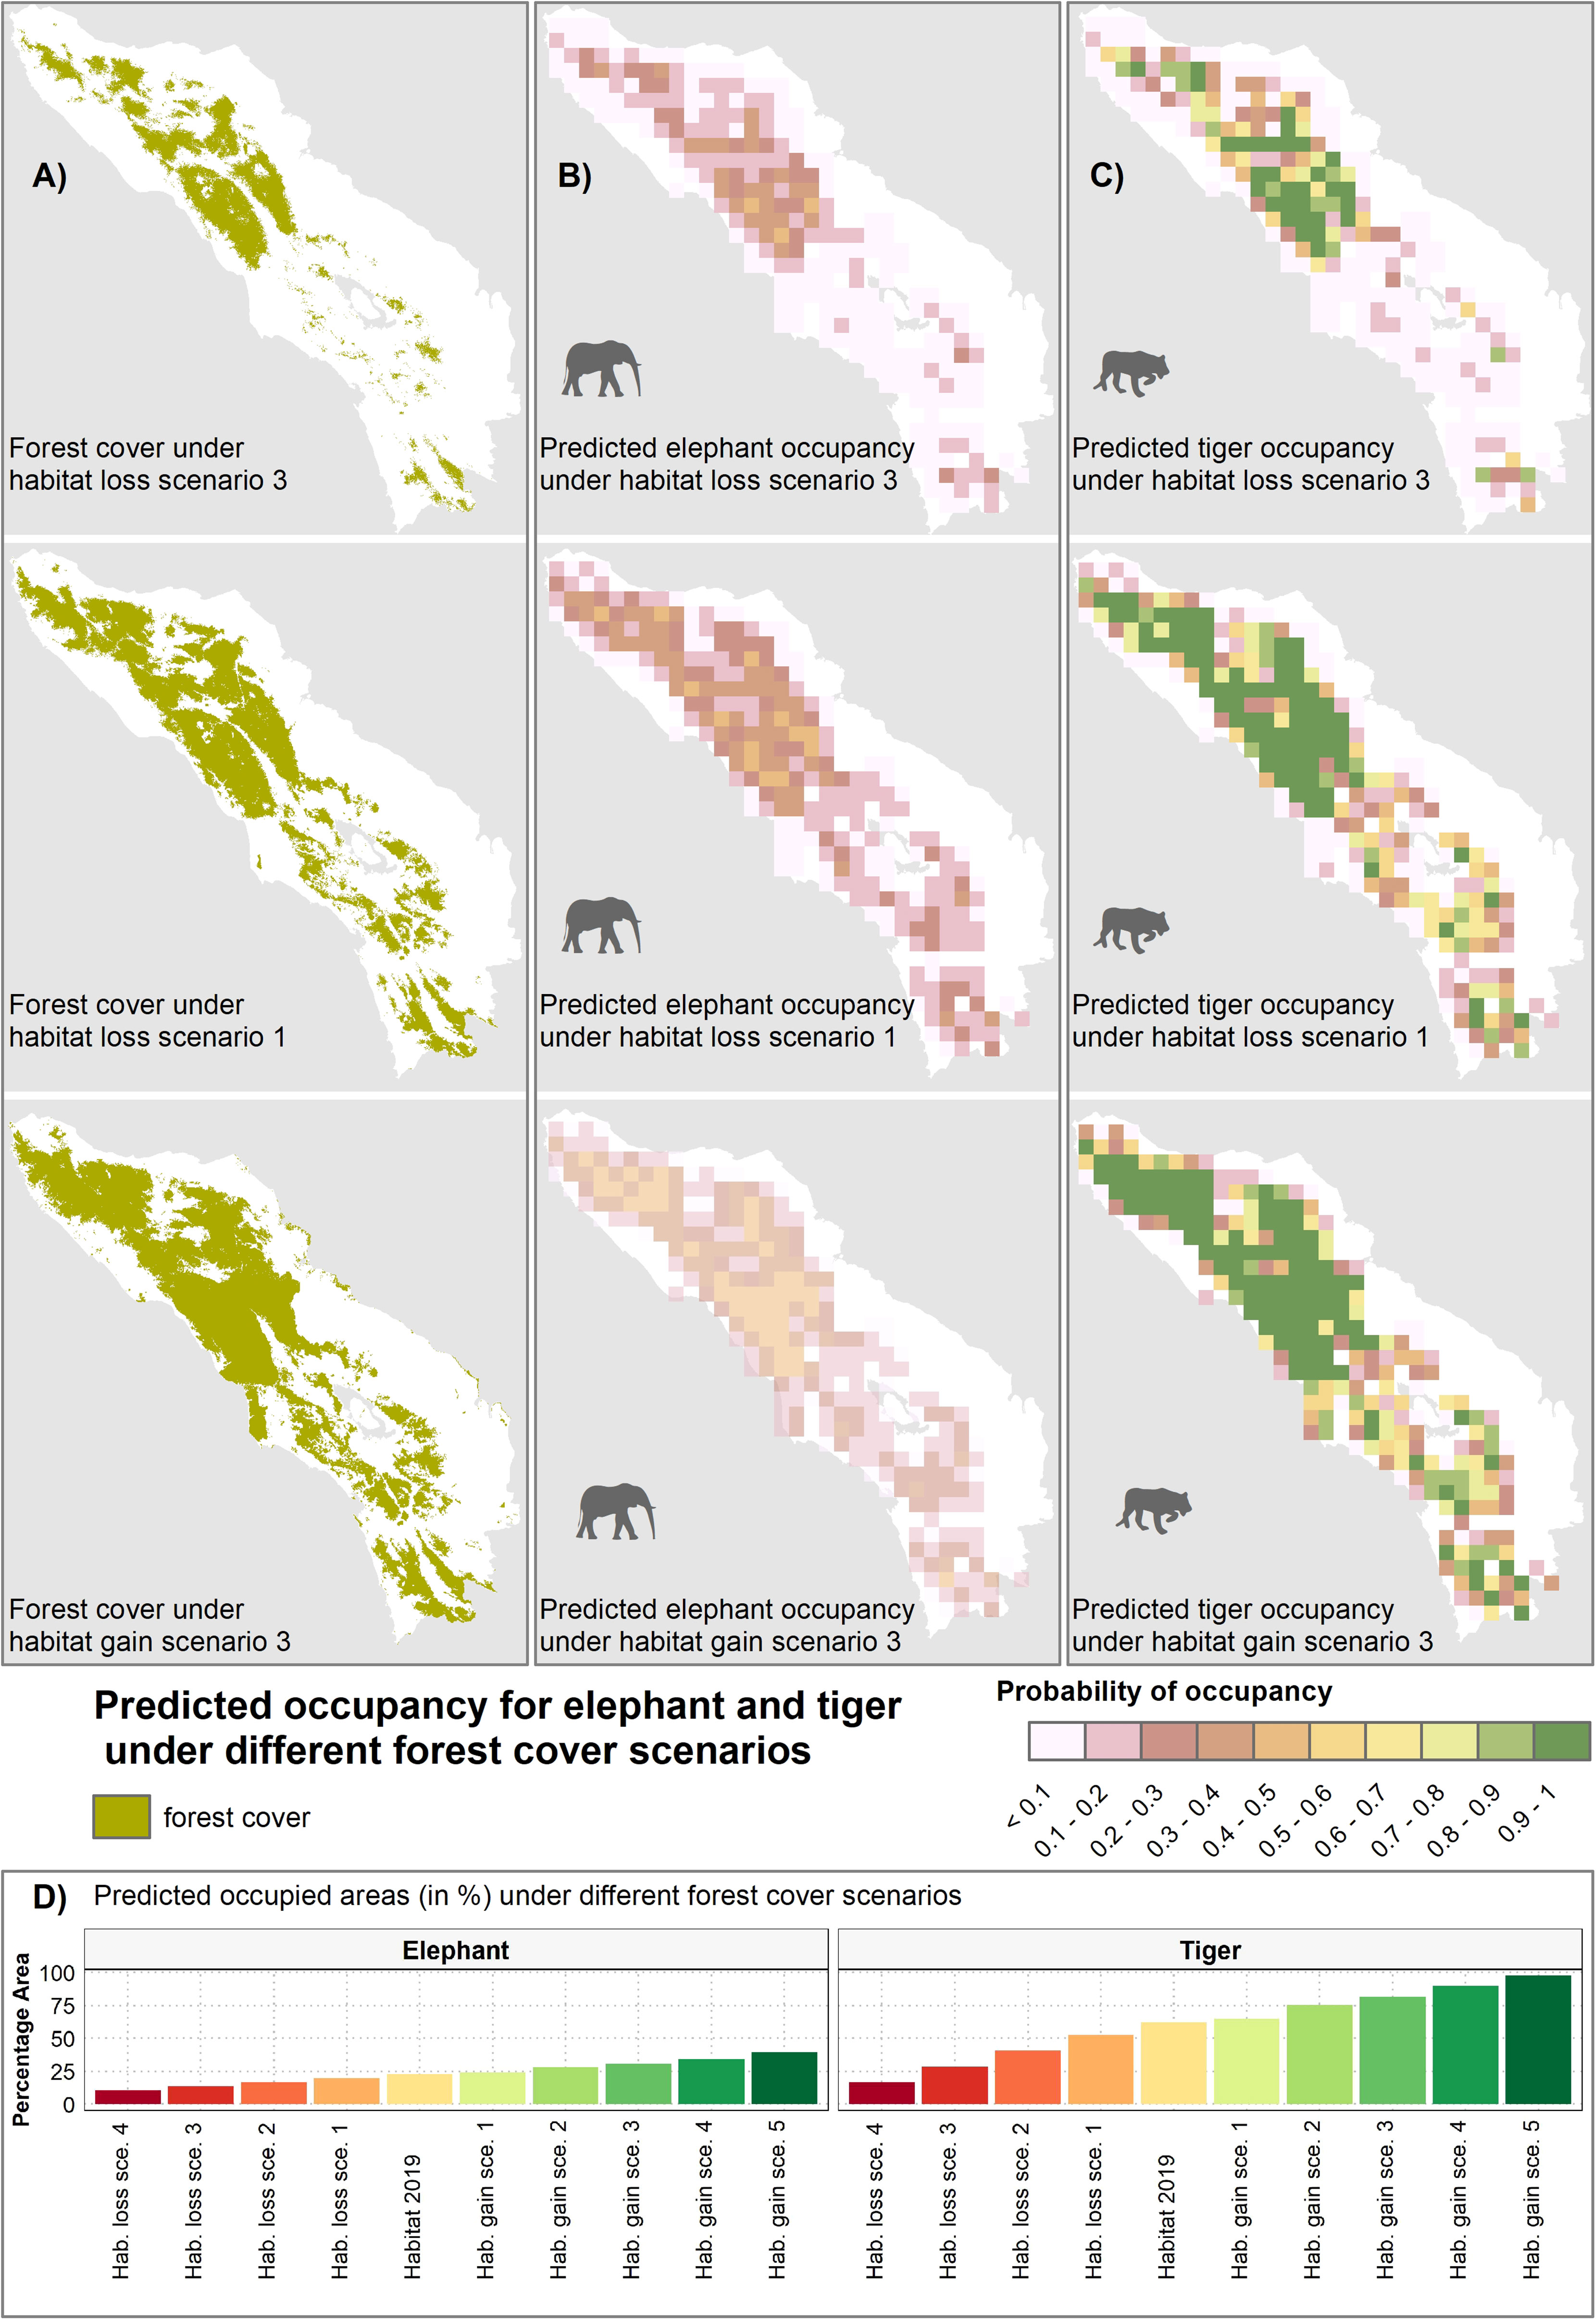
Figure 7 Predicted occupancy for elephant (B) and tiger (C) under various forest habitat loss and gain scenarios (A), with illustrations included for three habitat changes scenario including habitat loss scenario 1 & 3, and habitat gain scenario 3. Bar plot (D) shows predicted occupied areas (in %) under different forest cover scenarios.
Our study provides the first assessment of occupancy trends for Sumatran elephant and Sumatran tiger, as well as scenarios for population recovery under different landscape management plans. Our findings suggest a stable population trend for tigers with a declining population trend for elephants and the wild prey of tigers, especially wild boar. Our hypothesis on the positive correlation between forest cover and species occupancy especially for tiger and elephant was confirmed, although the effect of forest cover loss on elephant occupancy in the interior of the Leuser Ecosystem was lower as this large mammal prefers lowland habitats, which are primarily located at its periphery (Rood et al., 2010; Gopala et al., 2011).
We found that signs of human activities (disturbance) were positively associated with elephant and tiger occupancy. This may be an artefact of both people and large-bodied animals using similar trails to traverse the rugged interior of the Leuser Ecosystem, which would be very difficult otherwise. A study from the north of Leuser, in the Ulu Masen forest area, also found elephants to occupy habitat patches close to human-dominated landscapes (Rood et al., 2010), and several studies have shown the high overlap between people and tigers in the Leuser Ecosystem (Lubis et al., 2020) and Bukit Barisan Selatan NP in southern Sumatra (Pusparini et al., 2017). While tigers may be able to survive in human-modified landscapes, it is a precarious existence that relies on a having sufficient wild prey base and not relying on livestock, and avoiding the perils of poaching and retaliatory killings due to conflict with people that are often heightened in these edge environments (Karanth et al., 2011; Amir et al., 2022).
Our study revealed a declining trend in the size of the forest areas occupied by tiger prey, especially wild boar. This lower occurrence of prey, along with habitat loss, are predicted to have a detrimental impact on Sumatran tiger population viability (Karanth et al., 2004) and might have caused an increase in human–tiger conflicts in the Leuser Ecosystem (Lubis et al., 2020). Another study, which used camera trap data from GLNP in 2010, 2013, and 2017, found a stable tiger density but a substantial decline in wild boar occupancy (WCS unpublished data), which is of great concern because this species alone provides the highest prey biomass for tigers in Sumatra (Hayward et al., 2012; Allen et al., 2021). The presence of African swine fever (ASF) in the Leuser Ecosystem offers one possible explanation for the alarming decline of wild boar in this landscape (WCS unpublished data). The ASF virus has rapidly spread across Asia, including Indonesia, having a devastating impact, with 100% fatality to infected domestic pigs and wild boar (Luskin et al., 2021). As a pertinent example near to our study area, from 2019 to 2020, around 1,007 ASF cases were reported by the Department of Food Security and Animal Husbandry of North Sumatra Province and Medan Veterinary Centre in 17 districts, including Langkat and Deli Serdang, which form part of the Leuser Ecosystem (Primatika et al., 2022). A recent mass death of pigs occurred in November 2022, where approximately 2,000 domestic pigs were found dead, with symptoms suggesting ASF (Karouw, 2022). A large, but unquantified, number of these pig carcasses were disposed of in nearby rivers and may have ended up in close contact with people and/or wildlife, leading to further ASF transmission and infection (Tambunan, 2022). While it remains unknown how a presumed loss of wild boar has impacted tiger population density or changed prey selection, particularly towards livestock, the outlook is certainly dim (Hayward et al., 2012; Miquelle et al., 2018).
Assessing the spatial occurrence of species over time is important for formulating appropriate conservation management actions. In our study, areas where species were predicted to have gone locally extinct (occupancy change category 1; Figure 6), we would recommend, as an initial step, allocating increase ranger patrol effort to secure this forest patch from poaching and habitat loss (Linkie et al., 2015; Dancer et al., 2022; Adhiasto et al., 2023). Our newly developed tools (e.g. track2dm R package; Lubis (2021)) used data from regular patrols to enable near real-time monitoring of species and poaching threats. Additionally, within the Leuser Ecosystem, our spatial model identifies where habitat restoration, such as reforestation, should be prioritized to improve habitat quality and allow species to naturally recolonize former parts of their range. Improving the quality and quantity of habitat in these areas should also provide more suitable candidate sites for releasing suitable conflict tigers back into the wild (Goodrich and Miquelle, 2005). Where one of our target species could naturally recolonize (occupancy change category 2; Figure 6), securing these areas through threat removal remains key, and anticipating the effects of increased tiger occurrence near the forest edge would require conflict mitigation measures that reduce the opportunities for encounters between tigers and people, such as improved livestock husbandry involving keeping goats penned in at night (Goodrich et al., 2011). These efforts require active collaboration between stakeholders (e.g., GLNP, FMUs, SWR, and local governments) from planning to field implementation activities.
We were able to extend our predictive model beyond the Leuser Ecosystem to include connected forests spanning the provinces of Aceh and North Sumatra. However, our extrapolation could only be based on the predictive model using forest cover because the other important predictor variables of human disturbance and wild prey were not available for areas outside of the Leuser Ecosystem. Still, forest cover was the single most important variable, and we assume that the levels of human disturbance and wild prey available would not markedly vary based on our knowledge of the other areas, so the final results should be reasonably accurate and provide important insights. Our spatial predictions should help conservation managers prioritize areas for habitat recovery and directly estimate the associated consequences on species’ occupancy. Habitat enrichment or restoration should be conducted to connect fragmented and distant habitat patches. This is feasible because, for example, habitat restoration has become a government of Aceh priority approach, as stipulated under local law (Qanun) Aceh No.11/2019 (DLHK Aceh, 2019), and our spatially-explicit map could be used as a science-based way to guide efforts towards more strategically achieving this conservation goal.
Monitoring programs that assess wildlife populations and their distributions, along with associated habitats, are crucial for adaptive wildlife conservation management. With effective forest habitat management, through forest restoration and reforestation, issues related to decreasing wildlife populations can be addressed in the following ways: 1) reducing the risk of further isolating highly threatened species that are already low in numbers and isolated in distinct habitat patches (Smith et al., 2018); 2) re-populating areas by connecting source sites with a larger forest habitat (Linkie et al., 2006; Walston et al., 2010); and, 3) reducing the accessibility of the forest for perpetrators and thus reducing the poaching risk.
The datasets presented in this article are not readily available because the raw dataset is owned by the Indonesian Ministry of Environment and Forestry (MoEF). Requests to access the datasets should be directed to the MoEF.
Ethical review and approval was not required for the study of animals in accordance with the local legislation and institutional requirements.
The authors confirm contribution to the paper as follows: MIL, ML, T, WM, NA, ER, and DY planned and designed the study. UR and AT provided permission letter to conduct the study. MI, T, ER, and RA organized the field works. MIL, A, SS, DM, ER, AT, and RA managed and cleaned the field data. MIL analyzed the data. MIL, ML, JL, and KJ wrote the manuscript. All authors reviewed and approved the manuscript for publication. All authors contributed to the article.
This study was supported by the Earth Observatory of Singapore (EOS) via its funding from the National Research Foundation Singapore and the Singapore Ministry of Education under the Research Centers of Excellence initiative. This work comprises EOS contribution number 515.
We thank the government of Indonesia under the Ministry of Environment and Forestry for granting us permission to use field data collected by GLNP in collaboration with Wildlife Conservation Society (WCS) and Leuser Conservation Forum (FKL). We also thank all the field staff who collected the data, Darryl MacKenzie, Hariyo T. Wibisono, and Wulan Pusparini for their advice on data analysis, Saddam Hussein and Ginny Galih for their help in preparing the data, and Josh Robertson for reviewing the manuscript.
The authors declare that the research was conducted in the absence of any commercial or financial relationships that could be construed as a potential conflict of interest.
The handling editor TG is currently organizing a Research Topic with the author ML.
All claims expressed in this article are solely those of the authors and do not necessarily represent those of their affiliated organizations, or those of the publisher, the editors and the reviewers. Any product that may be evaluated in this article, or claim that may be made by its manufacturer, is not guaranteed or endorsed by the publisher.
The Supplementary Material for this article can be found online at: https://www.frontiersin.org/articles/10.3389/fevo.2023.1174708/full#supplementary-material
Acevedo-Charry O., Aide T. M. (2019). Recovery of amphibian, reptile, bird and mammal diversity during secondary forest succession in the tropics. Oikos 128, 1065–1078. doi: 10.1111/oik.06252
Adhiasto D. N., Exploitasia I., Giyanto -, Fahlapie P., Johnsen P., Andriansyah M. I., et al. (2023). A criminal justice response to address the illegal trade of wildlife in Indonesia. Conserv. Lett. 00, e12937. doi: 10.1111/conl.12937
Ahumada J. A., Silva C. E. F., Gajapersad K., Hallam C., Hurtado J., Martin E., et al. (2011). Community structure and diversity of tropical forest mammals: data from a global camera trap network. Philos. Trans. R. Soc. B: Biol. Sci. 366, 2703–2711. doi: 10.1098/rstb.2011.0115
Akaike H. (1998). “Information theory and an extension of the maximum likelihood principle,” in Selected papers of hirotugu akaike. Eds. Parzen E., Tanabe K., Kitagawa G. (New York, NY: Springer), 199–213.
Allen M. L., Sibarani M. C., Krofel M. (2021). Predicting preferred prey of Sumatran tigers Panthera tigris sumatrae via spatio-temporal overlap. Oryx 55, 197–203. doi: 10.1017/S0030605319000577
Amir Z., Moore J. H., Negret P. J., Luskin M. S. (2022). Megafauna extinctions produce idiosyncratic Anthropocene assemblages 4. Sci. Adv. 2307, 1–11. doi: 10.1126/sciadv.abq2307
Baukering P., Grogan K., Hansforth S. L., Seager D. (2009). “An economic valuation of aceh’s forests,” in The road towards sustainable development (Amsterdam: Institute for Environmental Studies).
Budiharta S., Meijaard E., Erskine P. D., Rondinini C., Pacifici M., Wilson K. A. (2014). Restoring degraded tropical forests for carbon and biodiversity. Environ. Res. Lett. 9, 114020. doi: 10.1088/1748-9326/9/11/114020
Chandradewi A. S., Semiadi G., Pinondang I., Kheng V., Bahaduri L. D. (2019). A decade on: The second collaborative Sumatra-wide Tiger Survey. CAT News 69, 41–42.
Corlett R. T. (2007). The impact of hunting on the mamMalian fauna of tropical asian forests. Biotropica 39, 292–303. doi: 10.1111/j.1744-7429.2007.00271.x
Crouzeilles R., Curran M., Ferreira M. S., Lindenmayer D. B., Grelle C. E. V., Rey Benayas J. M. (2016). A global meta-Analysis on the ecological drivers of forest restoration success. Nat. Commun. 7, 1–8. doi: 10.1038/ncomms11666
Dancer A., Keane A., Beale C. M., Dobson A. D. M., Amin R., Freeman R., et al. (2022). Evidence of deterrence from patrol data: Trialling application of a differenced-CPUE metric. Conserv. Sci. Pract. 4, e12746. doi: 10.1111/csp2.12746
Danylo O., Pirker J., Lemoine G., Ceccherini G., See L., McCallum I., et al. (2021). A map of the extent and year of detection of oil palm plantations in Indonesia, Malaysia and Thailand. Sci. Data 8, 4–11. doi: 10.1038/s41597-021-00867-1
Derhé M. A., Murphy H. T., Preece N. D., Lawes M. J., Menéndez R. (2018). Recovery of mammal diversity in tropical forests: a functional approach to measuring restoration. Restor. Ecol. 26, 778–786. doi: 10.1111/rec.12582
Dinerstein E., Loucks C., Heydlauff A., Wikramanayake E., Bryja G., Forrest J., et al. (2006). “Setting priorities for the conservation and recovery of wild tigers: 2005-2015. A user’s guide,” in WWF, WCS, smithsonian, and NFWF-STF(Washington, D.C. – New York: WWF, WCS, smithsonian, and NFWF-STF).
DLHK Aceh (2019). “QANUN ACEH NOMOR 11 TAHUN 2019 TENTANG PENGELOLAAN SATWA LIAR,” in Government of aceh. (Banda Aceh: DLHK Aceh). Available at: http://www.scopus.com/inward/record.url?eid=2-s2.0-84865607390&partnerID=tZOtx3y1%0Ahttp://books.google.com/books?hl=en&lr=&id=2LIMMD9FVXkC&oi=fnd&pg=PR5&dq=Principles+of+Digital+Image+Processing+fundamental+techniques&ots=HjrHeuS_.
Emmet R. L., Long R. A., Gardner B. (2021). Modeling multi-scale occupancy for monitoring rare and highly mobile species. Ecosphere 12, e03637. doi: 10.1002/ecs2.3637
Fernández N., Navarro L. M., Pereira H. M. (2017). Rewilding: A call for boosting ecological complexity in conservation. Conserv. Lett. 10, 276–278. doi: 10.1111/conl.12374
Figel J. J., Hambal M., Krisna I., Putra R., Yansyah D. (2021). Malignant snare traps threaten an irreplaceable megafauna community. Trop. Conserv. Sci. 0, 1–14. doi: 10.1177/1940082921989187
Gaveau D. L. A., Wich S., Epting J., Juhn D., Kanninen M., Leader-Williams N. (2009). The future of forests and orangutans (Pongo abelii) in Sumatra: Predicting impacts of oil palm plantations, road construction, and mechanisms for reducing carbon emissions from deforestation. Environ. Res. Lett. 4, 034013. doi: 10.1088/1748-9326/4/3/034013
Goodrich J. M., Miquelle D. G. (2005). Translocation of problem Amur tigers Panthera tigris altaica to alleviate tiger-human conflicts. Oryx 39, 454–457. doi: 10.1017/S0030605305001146
Goodrich J. M., Seryodkin I., Miquelle D. G., Bereznuk S. L. (2011). Conflicts between Amur (Siberian) tigers and humans in the Russian Far East. Biol. Conserv. 144, 584–592. doi: 10.1016/j.biocon.2010.10.016
Goodrich J., Wibisono H. T., Miquelle D., Lynam A. J., Sanderson A. J., Chapman E., et al. (2022) Panthera tigris: The IUCN Red List of Threatened Species 2022. Available at: https://www.iucnredlist.org/species/15955/214862019.
Gopala A., Hadian O., Sunarto, Sitompul A., Williams A., Leimgruber P., et al. (2011). Elephas maximus ssp sumatranus. IUCN Red List Threatened Species 2011 8235 4–29
Gopalaswamy A. M., Karanth K. U., Kumar N. S., Macdonald D. W. (2012). Estimating tropical forest ungulate densities from sign surveys using abundance models of occupancy. Anim. Conserv. 15, 669–679. doi: 10.1111/j.1469-1795.2012.00565.x
Hanley J. A., McNeil B. J. (1982). The meaning and use of the area under a receiver operating characteristic (ROC) curve. Radiology 143, 29–36. doi: 10.1148/radiology.143.1.7063747
Harvey J. A., Tougeron K., Gols R., Heinen R., Abarca M., Abram P. K., et al. (2022). Scientists’ warning on climate change and insects. Ecol. Monogr. 93 (1), 1–37. doi: 10.1002/ecm.1553
Hayward M. W., Jędrzejewski W., Jêdrzejewska B. (2012). Prey preferences of the tiger Panthera tigris. J. Zoology 286, 221–231. doi: 10.1111/j.1469-7998.2011.00871.x
Hijmans R. J., van Etter J., Cheng J., Mattiuzzi M., Summer M., Greenberg J. A., et al. (2017). “Package ‘raster’ November,” in R CRAN project.
Hines J. E., Nichols J. D., Collazo J. A. (2014). Multiseason occupancy models for correlated replicate surveys. Methods Ecol. Evol. 5, 583–591. doi: 10.1111/2041-210X.12186
Hines J. E., Nichols J. D., Royle J. A., MacKenzie D. I., Gopalaswamy A. M., Kumar N. S., et al. (2010). Tigers on trails: occupancy modeling for cluster sampling. Ecol. Appl. 20, 1456–1466. doi: 10.1890/09-0321.1
Inskip C., Zimmermann A. (2009). Human-felid conflict: A review of patterns and priorities worldwide. Oryx 43, 18–34. doi: 10.1017/S003060530899030X
IPBES (2018). “The regional assessment report on Biodiversity and Ecosystem Services for Asia and the Pacific,” in Intergovernmental science-policy platform on biodiversity and ecosystem services (IPBES). (Bonn Germany: IPBES Secretariat).
IUCN (2023) The IUCN Red List of Threatened Species v.2022-2. Available at: https://www.iucnredlist.org/ (Accessed 11 July 2023).
Jarvis A., Reuter H. I., Nelson A., Guevara E. (2008) Hole-filled seamless SRTM data Version 4, available from the CGIAR-CSI SRTM 90m Database. Available at: http://srtm.csi.cgiar.org.
Karanth K. U., Gopalaswamy A. M., Kumar N. S., Vaidyanathan S., Nichols J. D., MacKenzie D. I. (2011). Monitoring carnivore populations at the landscape scale: occupancy modelling of tigers from sign surveys. J. Appl. Ecol. 48, 1048–1056. doi: 10.1111/j.1365-2664.2011.02002.x
Karanth K. U., Nichols J. D. (2010). Non-invasive survey methods for assessing tiger populations. In. Tigers World (2nd Edition): Science Politics Conserv. Panthera tigris, 241–261. doi: 10.1016/B978-0-8155-1570-8.00018-9
Karanth K. U., Nichols J. D., Kumar N. S., Link W. A., Hines J. E. (2004). Tigers and their prey: Predicting carnivore densities from prey abundance. PNAS 101, 4854–4858. doi: 10.1073/pnas.0306210101
Karouw D. (2022) 2.000 Ekor Babi di Medan dan Deliserdang Mati Mendadak, Peternak Merugi (Medan - Indonesia). Available at: https://sumut.inews.id/berita/2000-ekor-babi-di-medan-dan-deliserdang-mati-mendadak-peternak-merugi (Accessed 22 December 2022).
Kéry M., Royle J. A. (2015). Applied Hierarchical Modeling in Ecology: Analysis of distribution, abundance and species richness in R and BUGS. In. Appl. Hierarchical Modeling Ecology: Anal. distribution abundance species richness R BUGS. 1, 810.
Kinnaird M. F., Sanderson E. W., O’Brien T. G., ibisono H. T., Woolmer G. (2003). Deforestation trends in a tropical landscape and implications for endangered large mammals. Conserv. Biol. 17, 245–257. doi: 10.1046/j.1523-1739.2003.02040.x
Linkie M., Chapron G., Martyr D. J., Holden J., Leader-Williams N. (2006). Assessing the viability of tiger subpopulations in a fragmented landscape. J. Appl. Ecol. 43, 576–586. doi: 10.1111/j.1365-2664.2006.01153.x
Linkie M., Haidir I. A., Nugroho A., Dinata Y. (2008). Conserving tigers Panthera tigris in selectively logged Sumatran forests. Biol. Conserv. 141, 2410–2415. doi: 10.1016/j.biocon.2008.07.002
Linkie M., Martyr D. J., Harihar A., Risdianto D., Nugraha R. T., Maryati, et al. (2015). EDITOR’S CHOICE: Safeguarding Sumatran tigers: evaluating effectiveness of law enforcement patrols and local informant networks. J. Appl. Ecol. 52, 851–860. doi: 10.1111/1365-2664.12461
Lubis M. I. (2021) track2dm: Create detection and non-detection matrix from track surveys. Available at: https://github.com/ilubis85/track2dm.
Lubis M. I., Pusparini W., Prabowo S. A., Marthy W., Tarmizi, Andayani N., et al. (2020). Unraveling the complexity of human – tiger conflicts in the Leuser Ecosystem, Sumatra. Anim. Conserv. 23, 741–749. doi: 10.1111/acv.12591
Luskin M. S., Albert W. R., Tobler M. W. (2017). Sumatran tiger survival threatened by deforestation despite increasing densities in parks. Nat. Commun. 8, 1783. doi: 10.1038/s41467-017-01656-4
Luskin M. S., Meijaard E., Surya S., Walzer C., Linkie M. (2021). African Swine Fever threatens Southeast Asia’s 11 endemic wild pig species. Conserv. Lett. 14, 1–11. doi: 10.1111/conl.12784
MacKenzie D. I., Nichols J. D., Hines J. E., Knutson M. G., Franklin A. B. (2003). Estimating site occupancy, colonization, and local extinction when a species is detected imperfectly. Ecology 84, 2200–2207. doi: 10.1890/02-3090
MacKenzie D. I., Nichols J. D., Lachman G. B., Droege S., Royle J. A., Langtimm C. A. (2002). Estimating site occupancy rates when detection probabilities are less than one. Ecology 83, 2248–2255. doi: 10.1890/0012-9658(2002)083[2248:ESORWD]2.0.CO;2
MacKenzie D. I., Nichols J. D., Royle J. A., Pollock K. H., Bailey L. A., Hines J. E. (2006). Occupancy modeling and estimation. Academic Vol. 324 (San Diego, CA: Academic Press).
Miquelle D. G., Poole C. M., Mahood S. P., Travers H., Linkie M., Goodrich J., et al. (2018). Comments on “a framework for assessing readiness for tiger reintroductions”. Biodiversity Conserv. 27, 3287–3293. doi: 10.1007/s10531-018-1591-1
MoEF (2018a). Land cover recalculation of Indonesia for year 2017 (Jakarta: Indonesian Ministry of Environment and Forestry).
MoEF (2018b). “The state of the Indonesia’s forests 2018,” in MoEF (Republic of Indonesia: Ministry of Environtment and Forestry).
MoEF (2022). The state of Indonesia’s forest 2022 towards FOLU net sink 2030 (Jakarta-Indonesia: MoEF). Available at: https://www.menlhk.go.id/uploads/site/post/1664894502.pdf.
Morris R. J. (2010). Anthropogenic impacts on tropical forest biodiversity: A network structure and ecosystem functioning perspective. Philos. Trans. R. Soc. B: Biol. Sci. 365, 3709–3718. doi: 10.1098/rstb.2010.0273
Omeja P. A., Lawes M. J., Corriveau A., Valenta K., Sarkar D., Paim F. P., et al. (2016). Recovery of tree and mammal communities during large-scale forest regeneration in Kibale National Park, Uganda. Biotropica 48, 770–779. doi: 10.1111/btp.12360
Perino A., Pereira H. M., Navarro L. M., Fernández N., Bullock J. M., Ceauu S., et al. (2019). Rewilding complex ecosystems. Science 364, eaav5570. doi: 10.1126/science.aav5570
Pinondang I. M. R., Ariyanto T., Lubis M. I., Kheng V., Surahmat F., Widodo F. A., et al. (2018). “Protokol survei okupansi harimau sumatera,” in Direktorat konservasi keanekaragaman hayati (Jakarta-Indonesia: DITJEN KSDAE-KLHK).
Priatna D., Santosa Y., Prasetyo L. B., Kartono A. P. (2012). Home range and movements of male translocated problem tigers in sumatra. Asian J. Conserv. Biol. 1, 20–30.
Primatika R. A., Sudarnika E. (2022). Bambang sumiarto & Chaerul basr) analisis sebaran kasus african swine fever pada babi di provinsi sumatera utara tahun 2019–2020. Acta VETERINARIA Indonesiana 10, 164–171.
Pusparini W., Batubara T., Surahmat F., Ardiantiono, Sugiharti T., Muslich M., et al. (2017). A pathway to recovery: the Critically Endangered Sumatran tiger Panthera tigris sumatrae in an “in danger” UNESCO World Heritage Site. Oryx 52 (1), 1–10. doi: 10.1017/S0030605317001144
Rayden T., Jones K. R., Austin K., Radachowsky J. (2023). Improving climate and biodiversity outcomes through restoration of forest integrity. Conserv. Biol., 1–11. doi: 10.1111/cobi.14163
R Core Team (2017). A language and environment for statistical computing (Vienna, Austria: R Foundation for Statistical Computing). Available at: https://www.r-project.org/.
Riley S., DEGloria S. D., Elliot R. (1999). Index that quantifies topographic heterogeneity. Intermountain J. Sci. 5, 23–27.
Rood E., Ganie A. A., Nijman V. (2010). Using presence-only modelling to predict Asian elephant habitat use in a tropical forest landscape: implications for conservation. Diversity Distributions 16, 975–984. doi: 10.1111/j.1472-4642.2010.00704.x
Royle J. A., Link W. A. (2006). Generalized site occupancy models allowing for false positive and false negative errors. Ecology 87, 835–841. doi: 10.1890/0012-9658(2006)87[835:GSOMAF]2.0.CO;2
Sanderson E., Redford K. H., Weber B., Aune K., Baldes D., Berger J., et al. (2008). The ecological future of the north american bison: conceiving long-term, large-scale conservation of wildlife. Conserv. Biol. 22, 252–266. doi: 10.1111/j.1523-1739.2008.00899.x
Schmidt M. (2008). The sankey diagram in energy and material flow management. J. Ind. Ecol. 12, 82–94. doi: 10.1111/j.1530-9290.2008.00004.x
Seidensticker J. (1986). “Large carnivores and the consequences of habitat insularization: ecology and conservation of tigers in Indonesia and Bangladesh,” in In cats of the world: biology, conservation, and management. National wildlife federation. Eds. Miller S. D., Everett D. D.(Washington, D.C: National Wildlife Federation), 1–41.
Senior R. A., Hill J. K., Edwards D. P. (2019). Global loss of climate connectivity in tropical forests. Nat. Climate Change 9, 623–626. doi: 10.1038/s41558-019-0529-2
Setyawati T., Nando S., Marthy W., Andayani N., Linkie M. (2021). Planning to remove UNESCO World Heritage Sites in Sumatra from being “In Danger”. Anim. Conserv. 24, 149–152. doi: 10.1111/acv.12626
Simcharoen A., Savini T., Gale G. A., Simcharoen S., Duangchantrasiri S., Pakpien S., et al. (2014). Female tiger Panthera tigris home range size and prey abundance: Important metrics for management. ORYX 48, 370–377. doi: 10.1017/S0030605312001408
Sloan S., Campbell M. J., Alamgir M., Collier-baker E., Nowak M. G., Usher G., et al. (2018). Infrastructure development and contested forest governance threaten the Leuser Ecosystem , Indonesia. Land Use Policy 77, 298–309. doi: 10.1016/j.landusepol.2018.05.043
Smith O., Wang J., Carbone C. (2018). Evaluating the effect of forest loss and agricultural expansion on Sumatran tigers from scat surveys. Biol. Conserv. 221, 270–278. doi: 10.1016/j.biocon.2018.03.014
Symes W. S., Edwards D. P., Miettinen J., Rheindt F. E., Carrasco L. R. (2018). Combined impacts of deforestation and wildlife trade on tropical biodiversity are severely underestimated. Nat. Commun. 9, 4052. doi: 10.1038/s41467-018-06579-2
Szewczyk M., Nowak S., Niedźwiecka N., Hulva P., Špinkytė-Bačkaitienė R., Demjanovičová K., et al. (2019). Dynamic range expansion leads to establishment of a new, genetically distinct wolf population in Central Europe. Sci. Rep. 9, 19003. doi: 10.1038/s41598-019-55273-w
Tambunan A. (2022). Lagi, Bangkai Babi Dibuang ke Sungai, Warga Resah Karena Aroma tak Sedap. In: Tribunnews. Available at: https://medan.tribunnews.com/2022/12/02/lagi-bangkai-babi-dibuang-ke-sungai-warga-resah-karena-aroma-tak-sedap (Accessed 4 January 2023).
Tilson R. L., Nyhus P. J. (2010). “The biology and politics of sumatran tigers: crash of the conservation garuda,” in Tigers of the world: the biology, politics, and conservation of panthera tigris, 2nd. Eds. Nyhus P. J., Tilson &R. L.(New York: Academic Press), 377–394.
Tucker M. A., Böhning-Gaese K., Fagan W. F., Fryxell J. M., Van Moorter B., Alberts S. C., et al. (2018). Moving in the Anthropocene: Global reductions in terrestrial mamMalian movements. Science 359, 466–469. doi: 10.1126/science.aam9712
Turck N., Vutskits L., Sanchez-Pena P., Robin X., Hainard A., Gex-Fabry M., et al. (2011). pROC: an open-source package for R and S+ to analyze and compare ROC curves. BMC Bioinf. 8, 12–77. doi: 10.1186/1471-2105-12-77
UNESCO (2004) Tropical rainforest heritage of sumatra. Available at: http://whc.unesco.org/en/list/1167.
Vora N. M., Lee H., Lieberman S., Vale M. M., Plowright R. K., Bernstein A. S. (2022). Want to prevent pandemics? Stop spillovers. Nature 605, 419–422. doi: 10.1038/d41586-022-01312-y
Vynne C., Gosling J., Maney C., Dinerstein E., Lee A. T. L., Burgess N. D., et al. (2022). An ecoregion-based approach to restoring the world’s intact large mammal assemblages. Ecography 2022, 1–12. doi: 10.1111/ecog.06098
Walston J., Robinson J. G., Bennett E. L., Breitenmoser U., Fonseca G. A. B., Goodrich J., et al. (2010). Bringing the tiger back from the brink—The six percent solution. PloS Biol. 8, e1000485. doi: 10.1371/journal.pbio.1000485
Keywords: large mammal conservation, occupancy, tiger, tropical forest loss, landscape connectivity, extinction risk, rewilding
Citation: Lubis MI, Lee JSH, Rahmat UM, Tarmizi, Ramadiyanta E, Melvern D, Suryometaram S, Trihangga A, Isa M, Yansyah D, Abdullah R, Ardiantiono, Marthy W, Jones KR, Andayani N and Linkie M (2023) Planning for megafauna recovery in the tropical rainforests of Sumatra. Front. Ecol. Evol. 11:1174708. doi: 10.3389/fevo.2023.1174708
Received: 27 February 2023; Accepted: 15 August 2023;
Published: 01 September 2023.
Edited by:
Miha Krofel, University of Ljubljana, SloveniaReviewed by:
Roberta Montanheiro Paolino, University of São Paulo, BrazilCopyright © 2023 Lubis, Lee, Rahmat, Tarmizi, Ramadiyanta, Melvern, Suryometaram, Trihangga, Isa, Yansyah, Abdullah, Ardiantiono, Marthy, Jones, Andayani and Linkie. This is an open-access article distributed under the terms of the Creative Commons Attribution License (CC BY). The use, distribution or reproduction in other forums is permitted, provided the original author(s) and the copyright owner(s) are credited and that the original publication in this journal is cited, in accordance with accepted academic practice. No use, distribution or reproduction is permitted which does not comply with these terms.
*Correspondence: Muhammad I. Lubis, bXVoYW1tYWQ0MzlAZS5udHUuZWR1LnNn
Disclaimer: All claims expressed in this article are solely those of the authors and do not necessarily represent those of their affiliated organizations, or those of the publisher, the editors and the reviewers. Any product that may be evaluated in this article or claim that may be made by its manufacturer is not guaranteed or endorsed by the publisher.
Research integrity at Frontiers
Learn more about the work of our research integrity team to safeguard the quality of each article we publish.