 Shujing Li
 Yukun Wei
- School of Sociology and Population Studies, Renmin University of China, Beijing, China
Measuring the degree of regional coordinated development and analyzing the factors affecting regional coordinated development are of great significance for assessing the status of regional coordinated development and formulating regional coordinated development strategies. The advancement of remote sensing data and big data provide the possibility to measure the degree of regional coordinated development on a more precise scale. The aim of this study is to use multiple sources of data to construct the evaluation indicator system of coordinated development level and to analyze the mechanism of regional development. All the 200 counties (districts) in Beijing-Tianjin-Hebei Region are selected as the study area. By measuring the level of coordinated development of 200 county units in Beijing-Tianjin-Hebei region from 2012 to 2017, it is found that although the synergy degree at the county level of Beijing, Tianjin and Hebei is increased, the overall regional synergy degree is still at a low level. The spatial panel model is further used to analyze the factors that influence the coordinated development of all counties. The conclusion is that with the promotion of the Beijing-Tianjin-Hebei coordinated development policy, the excessive government intervention, and the imbalance of market allocation in the past in Beijing-Tianjin-Hebei region have been alleviated. However, the weaknesses in the process of the Beijing-Tianjin-Hebei coordinated development are still obvious. The population density and urban size have become the constraints in the process of coordinated development. The degree of opening to the outside world and the investment in the ecological environment construction is still far from enough. These findings enable us to have a clearer assessment of the level of coordinated development and a deeper understanding of the influence mechanism of the regional development in Beijing-Tianjin-Hebei region. Furthermore, this study might benefit regional development strategy research.
1 Introduction
Since the United Nations Commission on Environment and Development proposed a strategy for sustainable development in 1987 (WCED, 1987), coordinated development has become an important topic for sustainable development (Jegatheesan et al., 2009), and the degree of coordinated development is used to evaluate the sustainable development status of cities or regions (Bolcárová and Kološta, 2015). The United Nations proposed The Sustainable Development Goals in 2015, which includes sustainable cities and communities, further demonstrating the importance of coordinated urban and regional development for sustainable development.
The Chinese government also recognizes the importance of coordinated development and has identified the promotion of coordinated regional development as an important development goal in the 13th Five-Year Plan. To achieve this goal, it is necessary to evaluate the current level of regional coordinated development. However, in the current regional coordinated development measurement systems, a unified standard has yet to be established. The focus of attention varies across different research fields, resulting in significant differences in the selection of measurement indicators. Many scholars constructed three subsystems as indicators in their research (Miao and Chen, 2016; Lai et al., 2020; Zhao and Li, 2022), and some scholars extended the subsystem to four or five (Weng et al., 2020; Wu and Cao, 2021). In addition, most researchers have focused their studies on large spatial scales, and most data sources are provincial or municipal data, rarely using county-level data (Deng et al., 2022). As the basic unit of Chinese administration and the basic level of regional economy, the role of the "county" is becoming more and more prominent for regional economic development. From the perspective of China's current development status, it is evident that there exists a significant imbalance at the county level (Zheng and Lu, 2004; Zhou et al., 2014; Yao and Shao, 2020). Therefore, when discussing the coordinated development in China, the county level should be given attention.
The Beijing-Tianjin-Hebei region of China can be seen as a typical region where the county development is extremely imbalanced (Liu et al., 2018; Zhao and Zhang, 2021). The differences between the three regions at the county level play an important role in the lags of BTH region behind Yangtze River Delta and the Pearl River Delta (Wang and He, 2018). Many studies have been performed on the BTH coordinated development over the years, they basically measure the level of the coordinated development of BTH from the provincial level (Zhu and He, 2016; Research Group of Beijing-Tianjin-Hebei Collaborative Development Index of the Beijing-Tianjin-Hebei Coordinated Development Think Tank of the Chinese Academy of Social Sciences, 2017) or municipal level (Zhang and Wang, 2017; Fang et al., 2018; Chen et al., 2021). However, several key gaps should be addressed. First, very limited research have been conducted in BTH regions by using the data with multi-sources at county level and there are few literatures on the quantitative measurement of the county level of development (Wang and He, 2018) . In the process of measuring the level of county development, we often face problems such as data loss and the lack of available statistical data. Because the indicators in the statistical data published by local statistical offices are different and the statistical calibers are also different, many indicators lack consistency and comparability when conducting cross provincial and municipal research. Second, in the existing literatures on the BTH coordinated development, some of them focus on the single system or element. However, the BTH coordinated development is a result of an interactive coupling of regional development elements and the interaction between systems (Zhao and Zhang, 2020). Only studying a certain system or element will ignore the interaction between various systems and elements and make a one-sided judgment on the regional coordinated development. On the other hand, studies that take multiple factors and systems into consideration tend to focus on the coordinated development of various elements in the region, ignore the coordinated development of the whole region, and fall into the mistake that “element coordination” will replace “regional coordination” (Zhang and Zhong, 2020).
Accordingly, this paper aims to introduce a variety of data sources to study the development of counties in BTH region, including the application of remote sensing data and big data. The use of data with multi-sources makes it feasible to measure the county development, especially the comprehensive development, not only the economic and social development. The remote sensing data can be used to monitor environmental and ecological conditions, analyze land use, and so on. This is exactly the most lacking part of county-level statistical data. The use of the big data such as POI can also supplement the lack of description of economic and social development in the existing statistical data (Li and Fang, 2014; Pokhriyal and Jacques, 2017; Watmough et al., 2019). To achieve these aims, this paper uses the data with various sources from 2012 to 2017 to construct an evaluation indicator system of the coordinated development at the county level in BTH, measure the coordinated development level of the composite system of 200 county units and the overall coordinated development level. Furthermore, we aim to categorize the influencing factors of coordinated development into a more systematic research framework and take into account spatial autocorrelation in our empirical analysis so that the analytical paradigm can be applied to other regions as well. Thus, spatial panel models will be used to analyze the factors affecting the coordinated development of counties to explore the development mechanism. This paper also provides suggestions for the future construction and development direction of county areas in the Beijing-Tianjin –Hebei region. In this paper, it is the combination of traditional data and remote sensing data that can make up for the deficiency.
Compared to traditional data from statistical censuses and surveys, big data contain large sample sizes and are highly penetrating and time-sensitive (Li et al., 2020). Remote sensing data has the quantitative advantage of being accurate and objective, and night-light data has been used to measure urbanization levels in empirical studies (Xu et al., 2014). Therefore, big data and remote sensing data can better reflect the regional development status, make real-time assessment and prediction of regional development. However, there are certainly some shortcomings in the use of both types of data. On the one hand, the big data in the earlier years is difficult to obtain, and the accuracy is not particularly high. On the other hand, high-precision remote sensing images are difficult to obtain. And like other studies, the interpretation and processing of remote sensing data will also have some errors (Ariken et al., 2020). Thus, to achieve more accurate results, it is still necessary to add some statistical data, jointly with remote sensing data and big data to evaluate the comprehensive development level of the counties.
This article is organized as follows. The second section provides a detailed description of the study area. The third section presents the data sources, indicator measures, and methods of this study. The fourth section presents the study results and analyzes them in detail. The fifth section discusses the breakthroughs and shortcomings of the study and makes corresponding recommendations. The final section concludes this study.
2 Study area
The Beijing-Tianjin-Hebei region, along with the Yangtze River Delta region and the Pearl River Delta region, is referred to as China's three major metropolitan areas and serves as the primary engine of the country's economic growth. Among them, the Beijing-Tianjin-Hebei region, as the capital's economic circle, is also the largest economic center in northern China. In 2014, the BTH region coordinated development became a national strategy. The proposal and implementation of this strategy have far-reaching significance for the coordinated development of regions and even China’s economic transformation. However, the Beijing-Tianjin-Hebei coordinated development strategy is still facing severe challenges in the process of implementation. According to the data released by the National Bureau of Statistics from 2018 to 2020, the total GDP of the Yangtze River Delta region is almost three times that of the Beijing-Tianjin-Hebei region. Although the total GDP of the Pearl River Delta region is equivalent to that of the Beijing-Tianjin-Hebei region, its area is only one fourth of that of the Beijing-Tianjin-Hebei region, and the GDP growth of the Yangtze River Delta region and the Pearl River Delta region is significantly faster than that of the Beijing-Tianjin-Hebei region. However, compared with the central cities in the three regions, Beijing and Tianjin, the central cities of the “Beijing-Tianjin-Hebei” region, had a GDP of 3.6 trillion yuan and 1.4 trillion yuan respectively in 2020, while Shanghai, the central city in the “Yangtze River Delta” region, had a GDP of 3.9 trillion yuan, and Guangzhou and Shenzhen, the central cities in the “Pearl River Delta” region, had a GDP of 2.5 trillion yuan and 2.8 trillion yuan respectively. From this perspective, the economic gap between Beijing-Tianjin-Hebei region and the central cities in the “Yangtze River Delta” region and the “Pearl River Delta” region is not obvious, and the unbalanced regional development is the main reason for the overall development of the "Beijing-Tianjin-Hebei" region. Therefore, this paper measures the coordinated development of Beijing-Tianjin-Hebei at the county level.
3 Data and methods
3.1 Indicators
3.1.1 Evaluation indicator system
The existing indicator system of the Beijing-Tianjin-Hebei coordinated development is mostly applicable to the research at the provincial level, and some are also applicable to the research at the municipal level. Among them, the most representative is the Beijing-Tianjin-Hebei Blue Book: Beijing-Tianjin-Hebei Development Report (Zhu et al., 2017; Zhu et al., 2018) published by the research team of the Capital University of Economics and Business for many consecutive years, and the indicator system used in the Beijing-Tianjin-Hebei coordinated development index (Liu et al., 2020) released by the Beijing-Tianjin-Hebei Coordinated Development Indicator Research Group (Research Group of Beijing-Tianjin-Hebei Collaborative Development Index of the Beijing-Tianjin-Hebei Coordinated Development Think Tank of the Chinese Academy of Social Sciences, 2017), the Beijing-Tianjin-Hebei Coordinated Development Think Tank of the Chinese Academy of Social Sciences. However, due to the lack of a large number of indicator data, both are difficult to apply at the county level. However, as the basic unit of China’s administrative system, the county area is an important part of the national economy and the overall urban and rural development, as well as an important foundation for the development of small and medium-sized cities and towns (Suo and Hou, 2020). The sustainable and coordinated development of counties are of great significance.
Therefore, based on the basic content of sustainable development, following the principles of systematicness, objectivity, goal-orientedness, scientificity, and accessibility, and referring to the above two representative indicators of Beijing-Tianjin-Hebei coordinated development, this paper constructs the coordinated development evaluation indicator system at the county level of Beijing- Tianjin-Hebei. The composite system is divided into three core subsystems: economic growth, social development and ecological harmony. Each subsystem will interact and evolve dynamically. According to synergetics theory, the influence of various parameters and factors inside the system on the system is different and unbalanced (Niu and Sun, 2007). The parameters that make the system change from chaos to order are called order parameters (Wang, 2016), which will eventually promote the orderly evolution of the whole system. Each order parameter in the coordinated development system at the county level in Beijing, Tianjin and Hebei is represented by the indicator, as shown in Table 1. The data of this indicator system is highly available and can be measured at the county level.
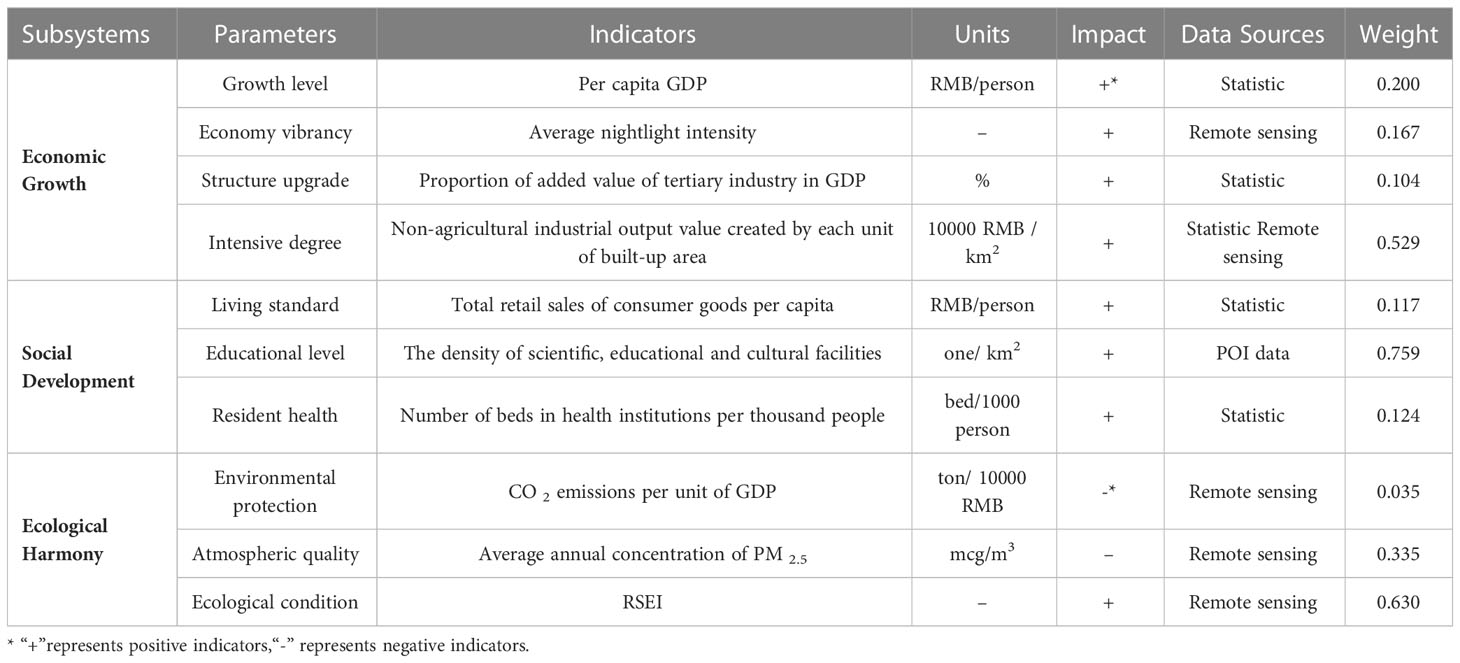
Table 1 Evaluation Indicator System for the Beijing-Tianjin-Hebei County-level Coordinated Development.
3.1.2 Variables in mechanism analysis
Through literature review, it is found that different scholars have studied China’s regional development mechanism from different perspectives. Some scholars believe that China’s regional development mechanism can be explained by the triple transformation of decentralization, marketization and globalization (Wei and Fan, 2000) ; some scholars believe that institutional factors, globalization and urbanization are important factors for China’s regional development (Yu, 2014); among them, Li and Fang (2014) constructed a more comprehensive multi-mechanism framework on the basis of summarizing and expanding previous researches, and believed that socio-economic factors, environmental factors, location factors and policy factors are the determinants of China’s regional development imbalance. Considering that the most important links in the organization and coordination mechanism of regional coordinated development are government intervention and market allocation (Ye et al., 2021), and the Beijing-Tianjin-Hebei region has always been considered to have excessive government intervention and unbalanced market allocation, the paper focuses on these two factors in the process of constructing the model, and selects indicators with reference to the previous literature (Li and Fang, 2014; Yu, 2014; Wang and He, 2018; Liu and Lin, 2020).
The government factors mainly include fiscal decentralization (Yu, 2010) and road network construction (Xu et al., 2016; Yu et al., 2020). The fiscal decentralization provides local governments with financial power and resources to promote regional coordinated development. Measured by public financial expenditure per capita, it is expected that this indicator will have a positive impact on the regional coordinated development. The road network density reflects the development of infrastructure construction in various regions, especially the development of transportation. In China, most of the road network construction is completed by the government. Therefore, the road network density in various counties can be used as another indicator of government input. It is expected that this indicator will also have a positive impact on the regional coordinated development.
The market factors mainly include capital opening, trade opening and financial market (Chinn and Ito, 2006). The capital opening is measured by the ratio of foreign direct investment to the investment in the fixed assets of the whole society. The increase of this indicator reflects a more open market environment, which to some extent indicates that the factor market is highly developed. It is expected that this indicator is positively related to the coordinated development of regions. As another indicator reflecting the degree of marketization, the ratio of total exports to GDP reflects the dependence on foreign trade of various regions. Generally speaking, regions with a high degree of trade opening have a relatively high degree of marketization. It is expected that there is a positive relationship between this indicator and regional coordinated development. The development level of China’s financial market is not high enough, the overall market competition of the financial industry has not yet formed, and the statistical data of relevant indicators at the county level are difficult to obtain. Therefore, the POI data - financial insurance facility density is used to characterize the marketization level of the financial industry in each county. It is expected that this indicator also has a positive relationship with the regional coordinated development.
In addition, two control variables, namely population density and urbanization rate, are added to the model. The population density indicators are used to reflect the population distribution of each county, and the ratio of built-up area to regional area is used to characterize the urbanization level of each county. These two indicators will have a certain impact on the regional development, but the direction of impact is still uncertain.
3.2 Data sources and processing
The nightlight data in Table 1 are sourced from the official website of National Oceanic and Atmospheric Administration (NOAA), the corrected NPP/VIIRS nightlight data are used and the resolution is 500 meters; the Point of interest (POI) data come from Baidu POI data; the original images of Remote Sensing Based Ecological Index (RSEI) and land use data are both from the official website of United States Geological Survey (USGS). The specific indicator values are calculated through the interpretation of landsat 5 and landsat 8 remote sensing images with a resolution of 30 meters. Among them, RSEI is derived from the ecological evaluation indicator constructed by Xu (2013) based on the four important indicators of the natural ecological environment, including humidity, dryness, heat, and greenness. It is often used for the objective evaluation of regional ecological quality. The built-up area in the land use data is used to calculate relevant indicators of output intensity; PM2.5 data are sourced by the Atmospheric Composition Analysis Group of Dalhousie University, Canada; carbon emission data are from Chen et al. (2020). The statistical data are mainly from Hebei Economic Yearbook, Beijing Regional Statistical Yearbook, Tianjin Statistical Yearbook, yearbooks of all districts and counties and statistical bulletins. And some data are from Hebei Rural Statistical Yearbook. Considering the implementation time of the Beijing-Tianjin-Hebei coordinated development strategy and the principle of data availability, the time span of the study is finally selected from 2012 to 2017. Based on the administrative divisions in 2017, relevant data are split or merged to obtain 200 county units in Beijing, Tianjin and Hebei. A small number of missing data are filled by using interpolation method and needed data such as per capita GDP and per capita total retail sales of social consumer goods are deflated.
3.3 Methods
3.3.1 Information entropy method
If subsystems of the complex system can interact orderly and cooperate with each other to produce coordinated effects, the efficiency of regional development will be improved, and the complex system will be transformed from an unordered non-equilibrium state to a dynamic equilibrium state with a certain function and self-organizing structure (Zhao and Zhang, 2020). Based on this, the paper constructs a coordinated development system S={S1, S2, S3} formed by the interaction of multiple subsystems, where S1 is the economic growth subsystem, S2 is the social development subsystem, and S3 is the ecological harmony subsystem. The indicators of related order parameters are used to measure the coordinated development of the system. The order parameters include positive order parameters and negative order parameters. The larger the value of positive order parameter is, the higher the degree of system development is, and the greater the contribution to the orderly evolution of the system is. The negative order parameter is opposite to it (Zhao and Zhang, 2020) .
Eliminate the influence of positive and negative indicators by using the following formula:
In formula (1), xmax and xmin are the upper and lower limits of the order parameter component xαij respectively. Zαij∈[0,1], the larger the value is, the greater the contribution of the order parameter component to the order degree of the subsystem is, and vice versa.
The information entropy can be used to measure the degree of disorder of the system. For an indicator, the smaller the entropy value is, the more orderly the sample data of the indicator is, and the greater the dispersion of the indicator is, the greater the impact on the comprehensive evaluation is. Therefore, the information entropy can be used to calculate the weight of each indicator, which provides a basis for the comprehensive evaluation of multiple indicators. At present, many measures of the Beijing-Tianjin-Hebei coordinated development level are weighted by the entropy weight method. In this paper, the entropy weight method suitable for the panel data is used to calculate the entropy value Ej and weight wj of index j successively, and then the effectiveness value Sαiof each subsystem is calculated by the linear weighting method.
The specific formulas are as follows:
where:
The larger the calculated Sαiof the subsystem effectiveness value is, the higher the development degree of the subsystem is, and the higher the contribution to the orderly evolution of the complex system is.
3.3.2 Measurement of coupling coordination degree
According to the effectiveness value of each subsystem, the synergy degree of complex system can be further calculated. Here, the meaning of synergy degree includes both the degree of interaction between subsystems and the degree of development of each subsystem. The measurement of the coupling coordination degree can be applied to this. The calculation formula of coupling coordination degree of the complex system is as follows:
where:
In this formula, D is the coupling coordination degree, C is the coupling degree, T is the comprehensive evaluation index of the coupling and coordinated development level, are the efficiency values of S1, S2, and S3, that is, the comprehensive benefits, and a, b, and c are the weights of each subsystem.
The D calculated according to the above method is the synergy degree of the complex system of Beijing-Tianjin-Hebei counties, and its value is between (0,1). The closer the D value is to 1, the better the coupling and coordination between the subsystems is, the more orderly the development is, and the higher the degree of the coordinated development is; the closer the D value is to 0, the lower the degree of coupling and coordination between its subsystems is, and the development of various elements is unbalanced, and the coordinated effect is low.
In order to have a more intuitive understanding of the overall coordinated development level of the Beijing-Tianjin-Hebei region from 2012 to 2017, the overall synergy degree of the Beijing-Tianjin-Hebei region is calculated year by year with reference to the methods of Zhao and Zhang (2020).
The specific formulas are as follows:
SY is the overall synergy degree of the Beijing-Tianjin-Hebei region, and CI represents the consistency degree of the coordinated development of all counties, μ is the mathematical expectation of the synergy degree Di of the composite system of each county with σ as its standard deviation. When the calculation result of CI is less than 0, the degree of dispersion of the synergy degree of each county is large, and the value of SY is also less than 0. At this time, the units within the region are developed in disorder, the competition is fierce, and there is a serious imbalance of regional development, and the degree of regional coordination is low; when the calculation result of CI is greater than 0, the degree of dispersion of the synergy degree of each county is small, and the value of SY is between 0 and 1. The greater the value of SY is, the more orderly the internal development of the region is, the closer the connection between units is, and the higher the overall level of regional coordinated development is (Zhao and Zhang, 2020).
3.3.3 Spatial autocorrelation analysis
The spatial autocorrelation analysis can be used to measure the interdependence of variables in the spatial units, including global measure and local measure. The global spatial autocorrelation describes the overall spatial relationship of all cells in the study area, but it cannot describe the spatial variation of spatial autocorrelation. Therefore, local spatial autocorrelation index should be used to better describe the distribution and change of spatial relationship in the space. In this paper, the Global Moran’s I and the Local Moran’s I will be used to measure the spatial relationship of the synergy degree of the Beijing-Tianjin-Hebei region in 2012-2017.
In the process of index calculation, the “sphere of influence approach” (SOI) by Yu et al. (2020) is adopted to construct the spatial weight matrix. The calculation of the index is realized by the spdep package of the R software.
3.3.4 Spatial lag model
A regional coordinated development mechanism model similar to the production function is constructed:
D is the synergy degree of counties, PFpc is the public financial expenditure per capita, RoadDen is the density of the road network, rEX is the ratio of total exports to GDP, rFIfa is the ratio of foreign direct investment to the whole society’s fixed asset investment, FinDen is the density of financial and insurance facilities, PopDen is the density of population, and rUrb is the proportion of the built-up area.
The linear model can be obtained by the logarithmic conversion on both sides of formula (8):
where y is the vector of counties synergy degree after logarithmic transformation; X is a matrix containing the logarithmic transformation form of the above seven independent variables and a constant term; β is the vector of model coefficients; is the error term vector.
Based on this, two commonly used spatial econometric models are constructed (Yu and Wei, 2008).
The formula of spatial lag model (SLM) is:
where W represents the spatial weight matrix, and its construction method is consistent with that used in the calculation of Moran’s I; Wy is the spatial lag vector of the dependent variable; is the coefficient of Wy.
The formula of spatial error model (SEM) is:
where ε is the spatial autoregressive coefficient of the error term, is the spatial lag vector of the spatial error term, and is the uncorrelated error term with the mean value of zero and the same variance.
4 Results
4.1 Synergy degree of the composite system
The synergy degree of the composite system of Beijing-Tianjin-Hebei counties from 2012 to 2017 was measured, and the weights of the indicators are shown in Table 1. Considering that the economic, social and ecological subsystems are equally important to the Beijing-Tianjin-Hebei coordinated development, the weight of each subsystem is set as 0.33. The Arcgis software is used to visualize the results obtained from the measurement of the synergy degree of the composite system. The results of 2012 to 2017 are shown in Figure 1.
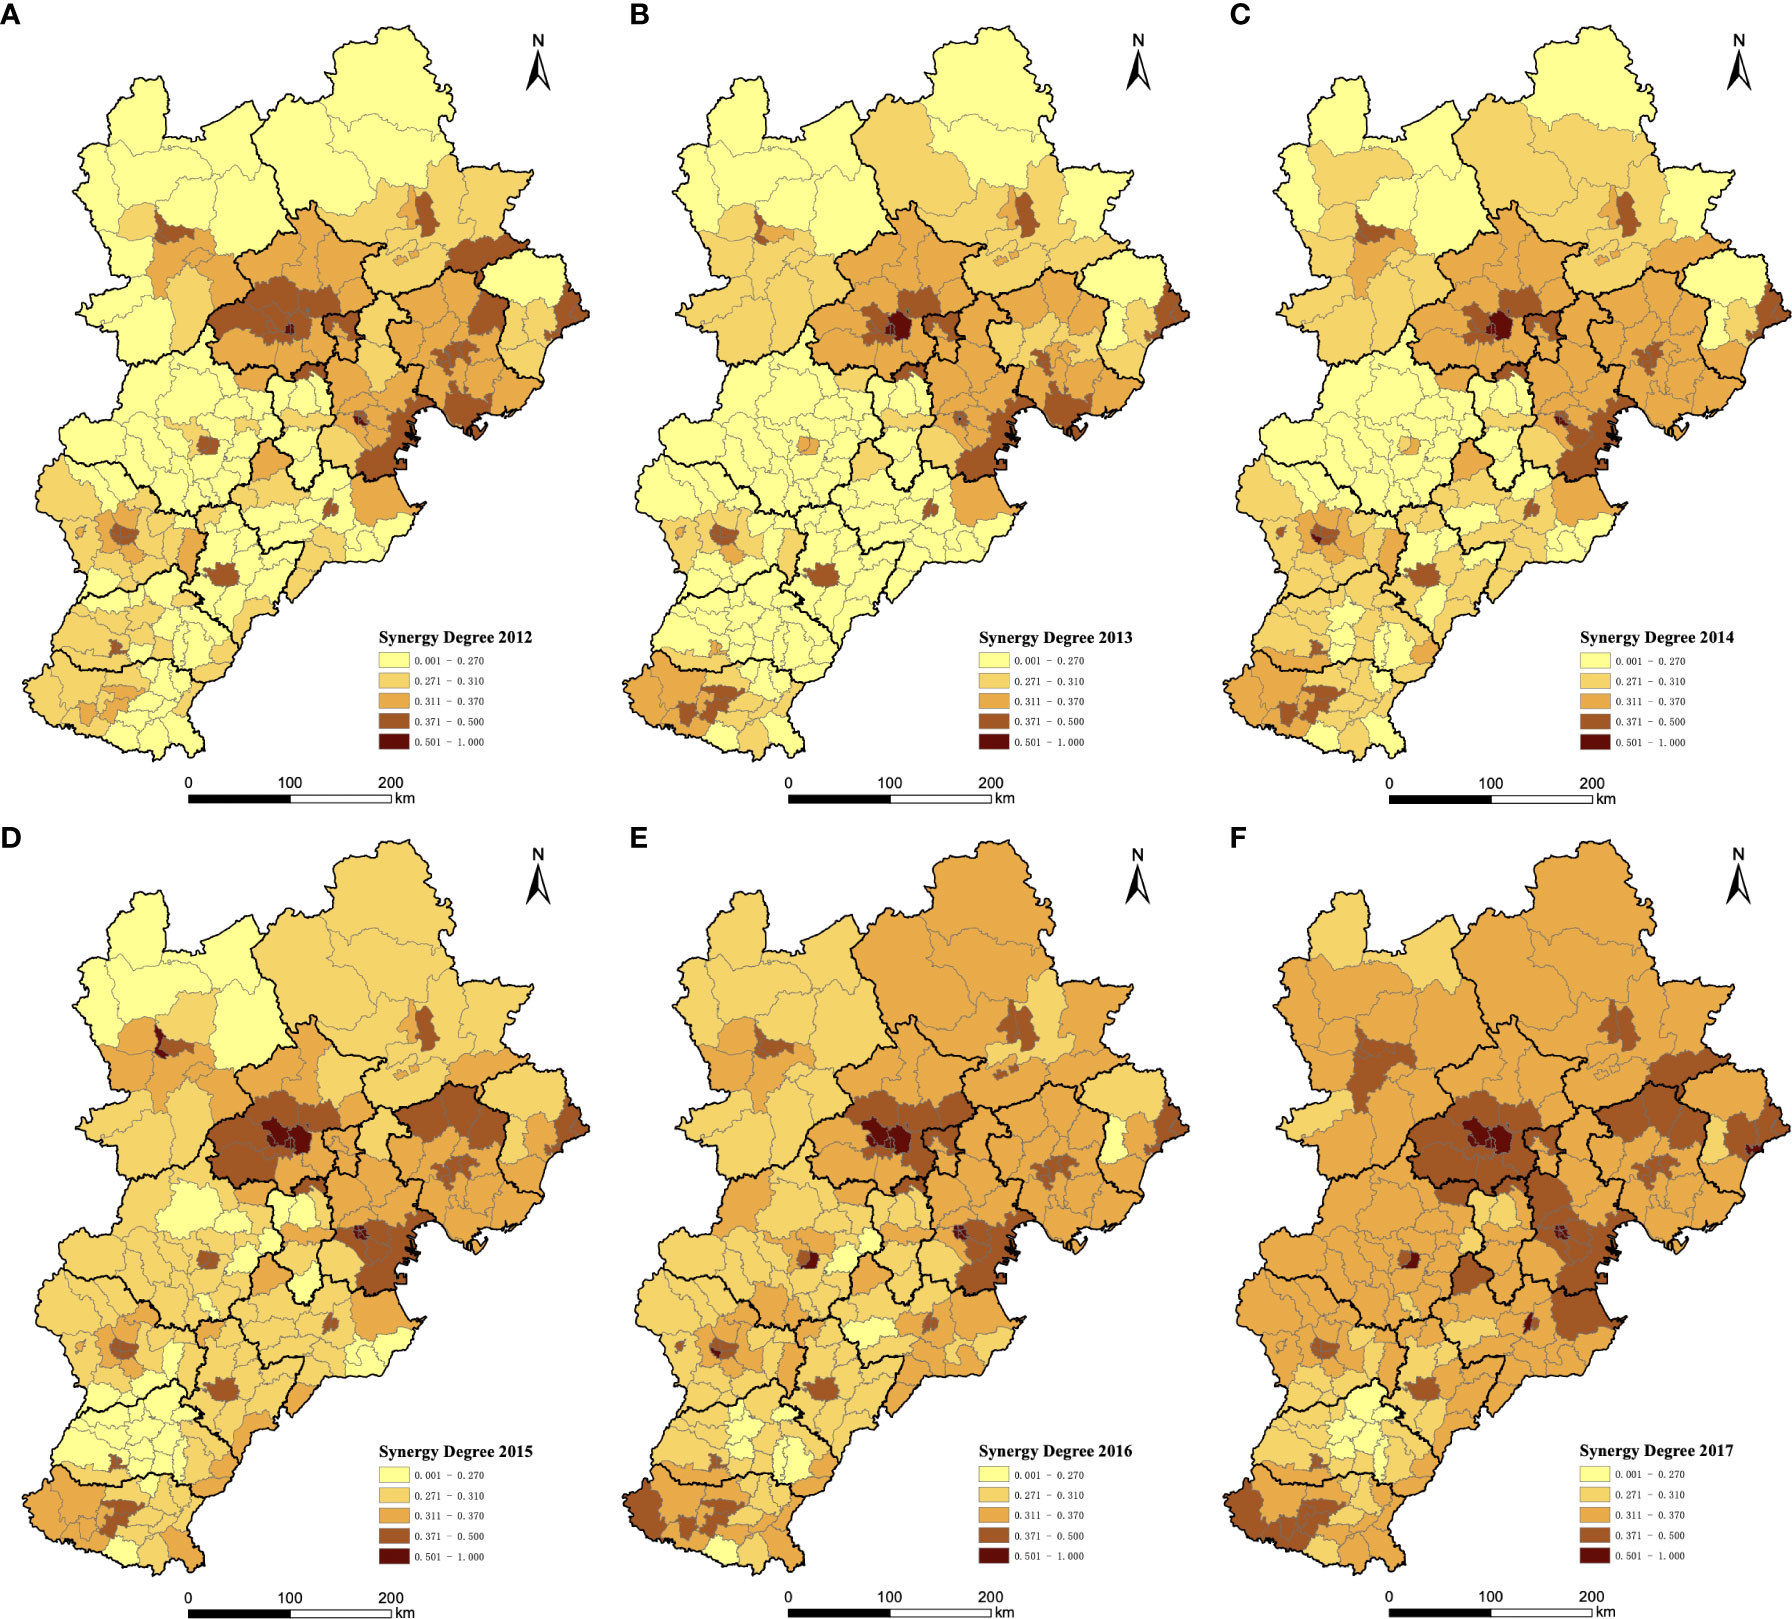
Figure 1 Synergy Degree of the Composite System of Beijing-Tianjin-Hebei Counties in 2012 (A), 2013 (B), 2014 (C), 2015 (D), 2016 (E), and 2017 (F).
It can be seen from Figure 1 that from 2012 to 2017, the synergy degree of the composite system of all counties in Beijing-Tianjin-Hebei was increased, the number of areas with low synergy degree was decreased, the overall synergy degree was improved, and the trend of regional coordinated development was more obvious, but the high-value areas were still concentrated in the core urban areas of Beijing and Tianjin and the urban areas of some cities in Hebei Province. It can also be seen from the figure that the synergy degree of the known “Cyclic Beijing-Tianjin Poverty Belt” was low in 2012 and improved in 2017, but most of the region still lagged behind the core areas of Beijing and Tianjin. The overall unbalanced development of the Beijing-Tianjin-Hebei region is still evident.
4.2 Overall coordinated development level
The calculated overall synergy degree of the Beijing-Tianjin-Hebei region from 2012 to 2017 is shown in Figure 2. It can be seen from the above figure that from 2012 to 2017, the overall coordinated development level of the Beijing-Tianjin-Hebei region presented a trend of steady improvement, especially after the Beijing-Tianjin-Hebei coordinated development strategy rose to a national strategy in 2014, the regional coordinated development level has significantly been improved. Nevertheless, the coordinated development at the county level in the Beijing-Tianjin-Hebei region is still at a low level, and the high-level coordinated development of the region has a long way to go.
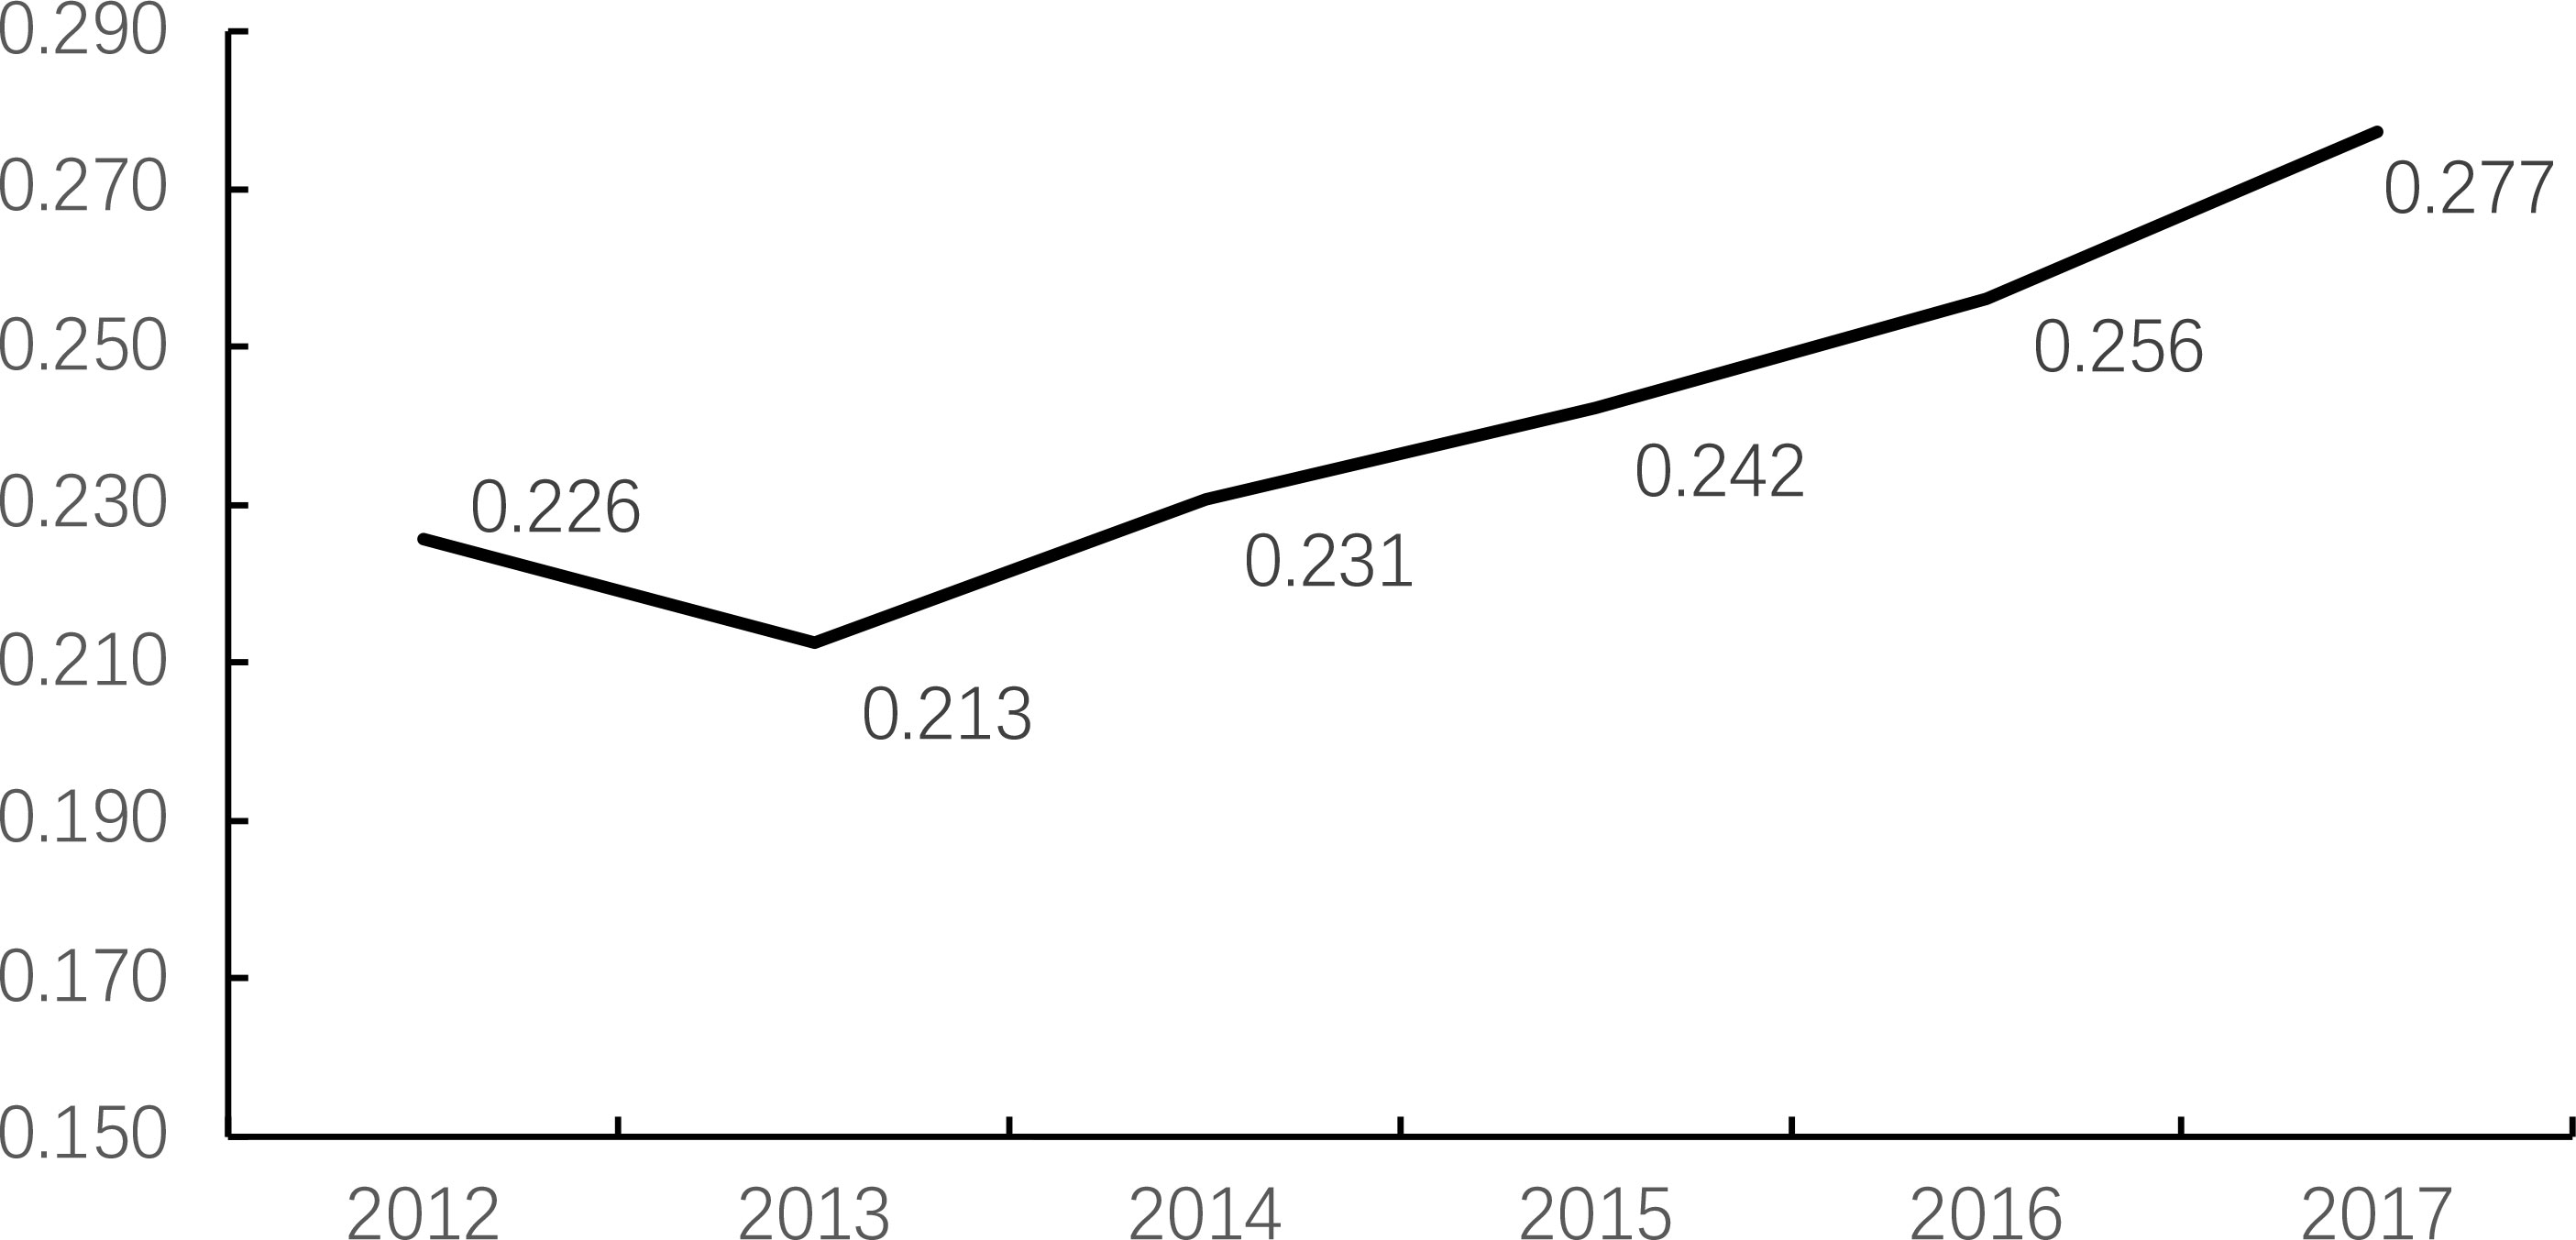
Figure 2 Overall Synergy Degree of the Composite System of the Beijing-Tianjin-Hebei Region from 2012 to 2017.
4.3 Spatial autocorrelation analysis
The calculation results of Global Moran’s I are summarized in Figure 3. The value range of Global Moran’s I is [- 1,1]. The closer the value is to 1, the more similar the level of coordinated development of neighboring counties is, and the stronger the positive spatial connection is; the closer the value is to -1, the greater the difference in the level of coordinated development between adjacent counties is, and the stronger the negative spatial connection is; when the value is close to 0, it means that the synergy degree is randomly distributed, and there is no spatial correlation between regions. The results in Figure 3 show that the Global Moran’s I over the years are significantly greater than 0, indicating that the synergy degree in the Beijing-Tianjin-Hebei region has a significant positive spatial dependence. However, due to the short time span of this study, the index changes little and is in a fluctuating state as a whole.

Figure 3 Global Moran’s I for Synergy Degree of Beijing-Tianjin-Hebei Counties from 2012 to 2017.
Next, the changes of Local Moran’s I will be observed by drawing the Moran Scatterplot in 2012 and 2017. It can be seen from Figure 4 that from 2012 to 2017, the synergy degree of Beijing-Tianjin-Hebei counties shows obvious “high-high” (“HH” area in the figure) and “low-low (LL)” clusters. About 80% of the counties belongs to these two types, that is, the spatial agglomeration of counties with high-level or low-level synergy is relatively common. The “low-low” agglomeration is dominant which means that the synergy degree of these counties and their surrounding counties is significantly lower than the overall level of the Beijing-Tianjin-Hebei region. The distribution of “high-low (HL)” and “low-high (LH)” is rare, that is, the counties with high (low) synergy degree are rarely surrounded by the counties with low (high) synergy degree. This distribution pattern does not change much during the whole study period. Observing the spatial units marked as diamond in the figure, that is, the spatial units that have a greater impact on the overall spatial distribution pattern, it is found that the counties with “high-high” concentration are basically the core urban areas of Beijing and Tianjin, others are the urban areas of some cities in Hebei, which further verifies the obvious “center-periphery” phenomenon in Beijing and Tianjin.

Figure 4 Moran Scatterplot in 2012 (A) and 2017 (B).
4.4 The spatial panel model
Through the analysis of spatial autocorrelation, it can be seen that the synergy degree of Beijing- Tianjin-Hebei counties has significant spatial connection. Therefore, the paper will judge whether to use spatial econometric models by robust Lagrange multiplier test (RLM), and choose between two basic spatial econometric models - spatial error model and spatial lag model according to the significance of RLM statistics.
First, the six consecutive years of balanced panel data from 2012 to 2017 are constructed with the synergy degree of each county as the dependent variable. Then the ordinary panel model regression and Hausman test are carried out. The results show that the fixed effect model was more appropriate than the random effect model.
Subsequently, robust Lagrange multiplier test is carried out. The results are shown in Table 2. The statistics of RLM (lag) are greater than those of RLM (error), which is more significant. Therefore, the spatial lag model is used for subsequent analysis. Since the data used in this paper are panel data, the corresponding spatial panel lag model (SPLM) will be constructed.
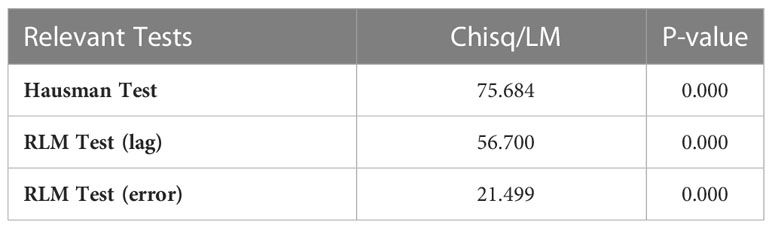
Table 2 Relevant Tests - Composite System.
Table 3 shows the regression results of the spatial panel model. For the convenience of comparison, the regression results of the ordinary panel model are also included in the Table.
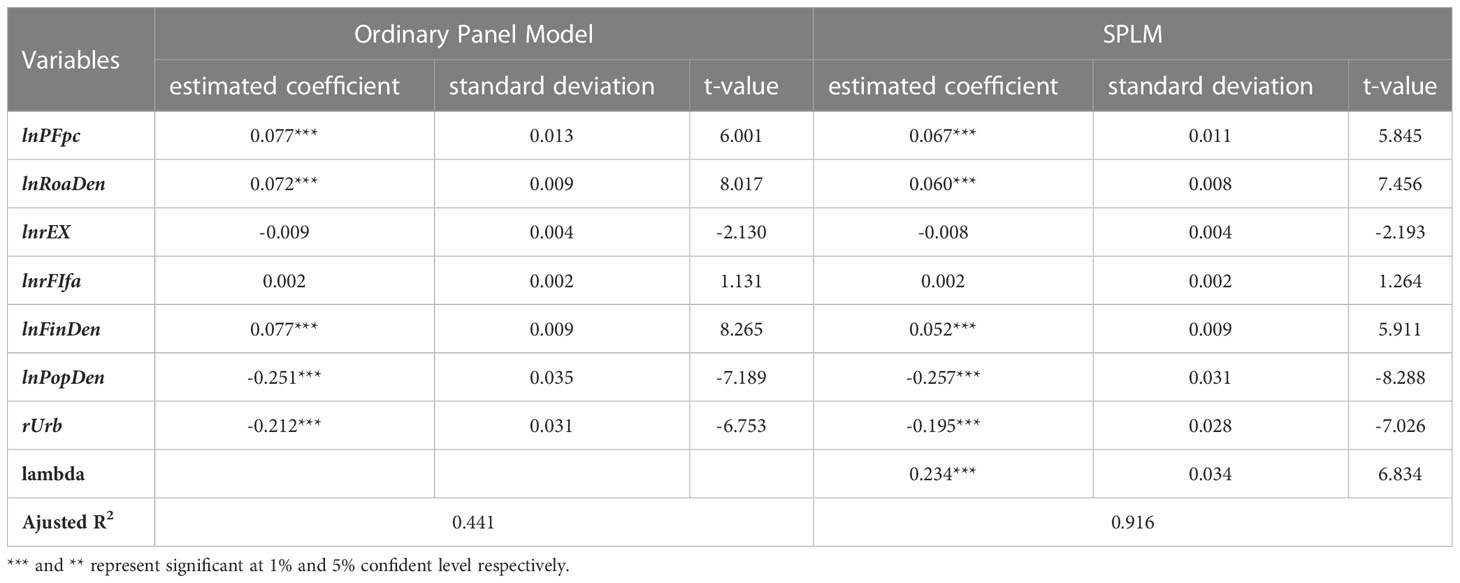
Table 3 Regression Results - Composite System.
It can be seen from Table 3 that no matter whether it is a fixed effect model or a spatial lag model, public financial expenditure per capita, road network density, as well as financial and insurance facility density have a significant positive impact on the synergy degree of Beijing-Tianjin-Hebei counties, while population density and urban size have a significant negative impact, and the impact of foreign trade dependence and capital opening is not significant. This is basically consistent with the above expectations, that is, increasing public financial expenditure and road construction, enhancing regional marketization will promote regional development. However, the degree of opening up in the counties are seriously polarized. Except for the core areas of Beijing, Tianjin and some urban areas in Hebei Province, most counties are not open to capital or trade, and have not yet played a significant role in promoting regional development. In addition, the increase of population density and the expansion of urban scale will reduce the degree of regional coordinated development. Therefore, special attention should be paid to curb the blind expansion of the county. It is worth noting that after the use of the spatial panel model, the fitting degree of the model has been significantly improved and has a stronger explanatory power. The lambda value of the estimated coefficient of the spatial lag term is significantly greater than 0, which again shows that there is a significant spatial autocorrelation among the synergy degree of the counties. The development of one region is affected by the surrounding areas. Attentions should be paid to the radiation and driving effect of the development of Beijing and Tianjin on surrounding counties.
In order to deeply analyze the important influencing factors in each subsystem, next, the effectiveness value of each subsystem is taken as the dependent variable, a model relationship similar to Formula (8) is established, and the corresponding logarithmic conversion is conducted.
The Hausman test and robust Lagrange multiplier test are also conducted for each subsystem model, and the results (see Table 4) also shows that the fixed effect model and the spatial lag model are more suitable.

Table 4 Relevant Tests – Subsystems.
Table 5 shows the respective regression results of the ordinary panel model and the spatial panel model of the three subsystems.
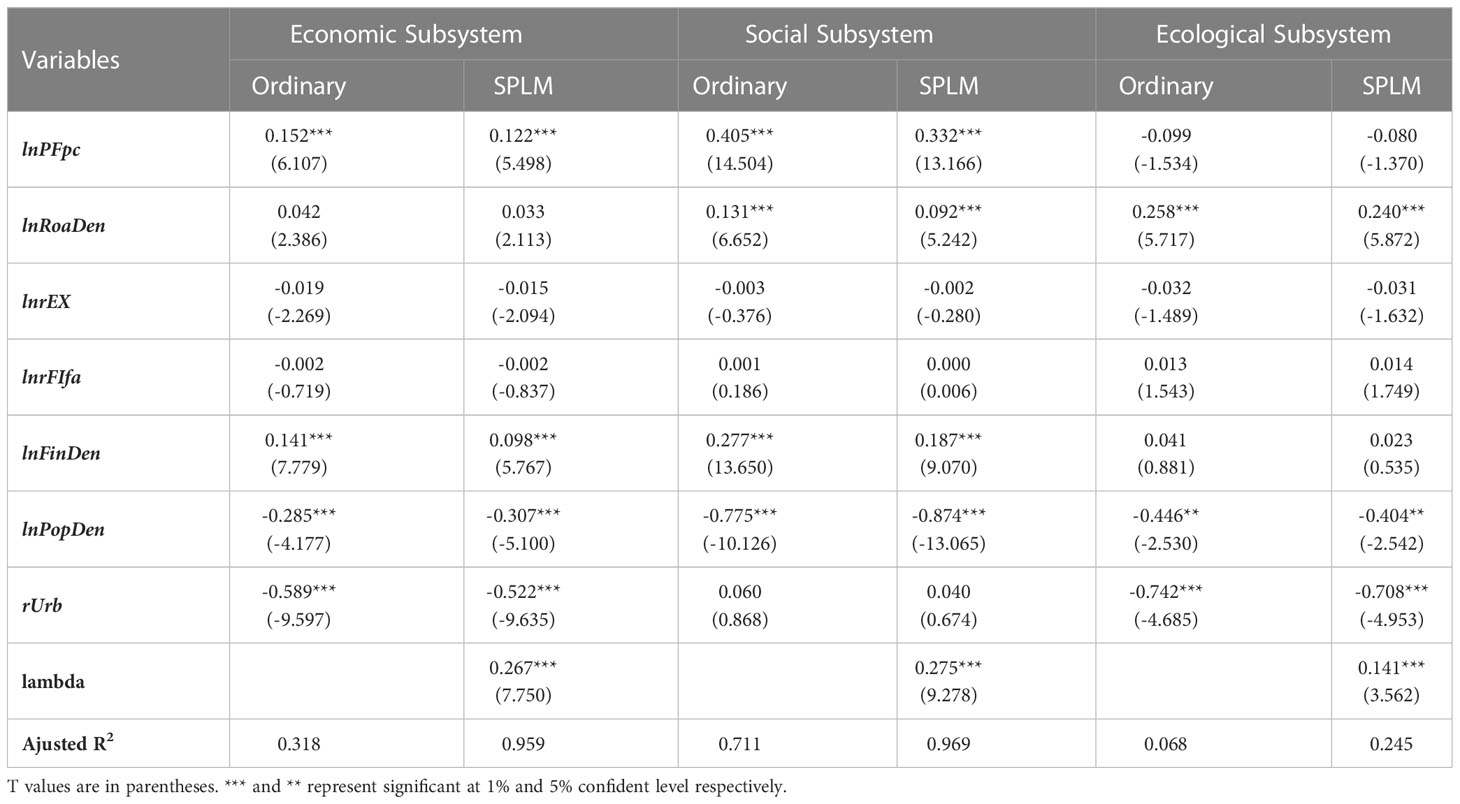
Table 5 Regression Results – Subsystems.
It can be seen from Table 5 that for the three subsystems, after using the spatial panel model, the goodness of fit of the model has been significantly improved with stronger explanatory power. Moreover, the estimated lambda values of the coefficients of the spatial lag term are significantly greater than 0, and the development level of each subsystem also has significant spatial autocorrelation. Therefore, related analysis of these three subsystems are carried out based on the regression results of the spatial panel model.
For the economic subsystem, the public financial expenditure per capita and the density of financial and insurance facilities have a significant positive impact on the synergy degree of counties, while the population density and urban size have a significant negative impact. The impact of road network density, foreign trade dependence and capital opening is not significant. It can be seen that the development of local government expenditure and financial market plays an important role in promoting the economic growth of the Beijing-Tianjin-Hebei region. It can also be seen from the t-value that the government and market forces are relatively balanced, but overpopulation and excessive expansion of urban area have hindered the healthy development of regional economy. Observing the indicator composition of the economic subsystem, it is not difficult to find that the industrial structure and output intensity, which account for a relatively heavy proportion, will be affected by the population density and urban size. If the local population density and industrial structure cannot be adapted, then a large number of people will stay in the primary industry, which is difficult to transfer to the secondary and tertiary industries, while the blind expansion of urban built-up areas cannot create more non-agricultural output. All these have adverse effects on the development of regional industries, thereby hindering the economic growth.
For the social subsystem, public financial expenditure per capita, road network density, and financial and insurance facility density have significant positive effects on the synergy degree of counties, while population density has significant negative effects. The dependence on foreign trade, capital openness, and urban size have no significant effects. It can be seen that the power of the government and the market is jointly invested in the social development of Beijing-Tianjin-Hebei region, and the power of the government investment exceeds that of the market. The role of fiscal expenditure and road construction is obvious. However, population density still restricts social development. The over-dense population will squeeze local science, education, culture and health resources, exerting certain pressure on the existing social security system.
For the ecological subsystem, the road network density has a significant positive impact on the synergy degree of counties, while the population density and urban size have a significant negative impact. The impact of public financial expenditure per capita, foreign trade dependence, capital openness and financial and insurance facility density is not significant. It can be inferred that vigorously developing transportation has a positive effect on the ecological environment protection in the Beijing-Tianjin-Hebei region. However, both the government and the market have obviously insufficient investment in the ecological construction, which has not yet had a significant impact on the harmonious development of regional ecology. The increase in population density has caused significant damage to the ecological environment, and the harm of urban expansion is particularly obvious.
5 Discussion
The Beijing-Tianjin-Hebei coordinated development strategy is of great significance and plays a pivotal role in promoting China’s sustainable development. To solve the problem of unbalanced regional development, it is inseparable from the coordinated development of counties in the Beijing-Tianjin-Hebei region. The current research is limited by the scarcity of data, and the understanding of county development is limited. This study uses diversified data sources, supplements the existing statistical data, integrates many social and ecological development indicators into an index system to measure the coordinated development of the Beijing-Tianjin-Hebei region, and conducts a comprehensive and in-depth investigation of the coordinated development of counties in the Beijing-Tianjin-Hebei region. The results of this study are consistent with the conclusions of previous studies, indicating that the overall level of the coordinated development of the Beijing-Tianjin-Hebei region has been continuously improved, and the level of coordinated development at the county level has been significantly improved. These results confirm the validity of the methodology employed in this study. In future research work, innovative data sources such as remote sensing data and big data can be used to assess regional development levels. Nevertheless, compared with other studies, we find that the level of coordination at the county level is still much lower than that at the city or provincial level. This observation further confirms the view that the coordinated development of the Beijing-Tianjin-Hebei region depends fundamentally on the county level.
Spatial analysis reveals that the coordination degree among counties in the Beijing-Tianjin-Hebei region exhibits a pronounced spatial positive correlation. Consequently, this study employs a spatial panel model to explore the underlying mechanisms, yielding several novel conclusions that have received rare attention in previous research. It has been discerned that coordinated development in the Beijing-Tianjin-Hebei region is impeded by factors such as population density and urban scale. Different subsystems are influenced by diverse primary factors that either promote or hinder their development. Local government expenditure and financial market development serve as significant drivers for the economic growth of the Beijing-Tianjin-Hebei region. The government has substantially invested in the social development of the region, and the force of market also plays an important role. The enhancement of transportation infrastructure exerts a positive impact on the region’s ecological environment protection. However, excessive population density and urban expansion have encumbered regional economic development and damaged the local ecological environment. Elevated population density also imposes an increased burden on the social system. Both the government and the market fall short in their investment in ecological development.
According to these problems, the following suggestions are put forward. At first, in the process of implementing the policy of coordinated development in the Beijing-Tianjin-Hebei region, we should not only emphasize the coordinated development of provinces and cities, but also pay attention to the coordination and overall planning of county-level units, rationally allocate funds and resources in the region, promote the flow of regional factors, optimize the layout of population, towns and industries, increase investment in infrastructure, public services and ecological construction, to truly achieve regional coordinated development. Moreover, we should give full play to the spatial spillover effect of the core areas in Beijing and Tianjin and the central urban areas of Hebei to the surrounding counties, radiate and drive the development of the surrounding counties, break the “center-periphery” phenomenon, and construct a “multi-center and networked” urban spatial pattern (Ye et al., 2020). In addition, we should strengthen the leading role of the market in the regional development. The government’s responsibility should focus more on guiding the orderly operation of the market, rather than relying solely on the government investment to carry out regional construction. Regional financial market system with complete types and functions should be cultivated to meet various financial needs in this region. We should continue to deepen reform, open wider to the outside world, increase the opening of capital markets and commodity markets, make rational use of foreign capital, expand export channels, to increase vitality for county construction. The role of the market in the field of public services has gradually become prominent. Through the market-oriented reform, we should expand the supply of public goods, especially the supporting services closely related to people’s livelihood such as science, education, culture and health, guide private enterprises and social organizations to participate, and encourage the establishment of a shared mechanism between counties. Lastly, the weak points in regional development should be strengthened. (1) There is no doubt about the importance of ecological environment protection, but both the local government and the market have obviously insufficient investment in the ecological construction. While continuing to play a positive role in the construction of the transportation network, we should improve the multi-subject participation mechanism of ecological environment construction, establish a diversified ecological compensation system, and not only rely on the policies and input of the central government, but also the local governments, private enterprises, non-governmental organizations and the public. (2) The population distribution should adapt to the industrial distribution. The existing industrial structure does not match the population distribution, resulting in a negative correlation between the population density and the coordinated development level of the counties. The Beijing-Tianjin-Hebei region should continue to take the rationalization and upgrading of the industrial structure as the fundamental task of industrial transformation and upgrading, promote the development of modern manufacturing and service industries, and guide the rational concentration of population and industries. (3) The positive effect of urbanization on the regional development is not the same as the blind expansion of urban areas. The excessive expansion will hinder regional development. The construction of counties should adopt the small and refined development model of small towns. By promoting the integration of industries and cities, improving public service supporting facilities as well as optimizing the ecological environment, the attractiveness and cohesion of small and medium-sized towns will be enhanced and the coordinated development of the whole region will be promoted.
6 Conclusions
The following conclusions can be drawn from this research. Firstly, although the coordinated development level of counties in Beijing-Tianjin-Hebei has been increasing, the overall regional development is still imbalanced and at a low level of synergy. Secondly, the synergy degree of counties has a significant positive spatial correlation. The development of each county is affected by the surrounding areas, but for the core areas of Beijing and Tianjin, the “center-periphery” phenomenon is more prominent. Thirdly, with the promotion of the coordinated development policy of Beijing- Tianjin-Hebei, the excessive government intervention and the imbalance in market allocation in this region has alleviated. The government and market have played a role in the coordinated development of Beijing-Tianjin-Hebei. Finally, the weaknesses in the process of coordinated development in this region are still obvious, especially the insufficient investment in ecological environment construction.
Data availability statement
The original contributions presented in the study are included in the article/supplementary material. Further inquiries can be directed to the corresponding author.
Author contributions
SL: conceptualization, data analysis, methodology, and writing the manuscript. YW: literature collection, data collection, and polishing the manuscript. Both authors contributed to the article and approved the submitted version.
Conflict of interest
The authors declare that the research was conducted in the absence of any commercial or financial relationships that could be construed as a potential conflict of interest.
Publisher’s note
All claims expressed in this article are solely those of the authors and do not necessarily represent those of their affiliated organizations, or those of the publisher, the editors and the reviewers. Any product that may be evaluated in this article, or claim that may be made by its manufacturer, is not guaranteed or endorsed by the publisher.
References
Ariken M., Zhang F., Liu K., Fang C., Kung H. T. (2020). Coupling coordination analysis of urbanization and eco-environment in yanqi basin based on multi-source remote sensing data. Ecol. Indic. 114, 106331. doi: 10.1016/j.ecolind.2020.106331
Bolcárová P., Kološta S. (2015). Assessment of sustainable development in the EU 27 using aggregated SD index. Ecol. Indic. 48, 699–705. doi: 10.1016/j.ecolind.2014.09.001
Chen H., Feng W., Jiao X. (2021). The space-time evolution of the coordinated development state and efficiency of the “Five modernizations” in Beijing, tianjin and hebei. Business Econom. Res. 814 (03), 159–163.
Chen J., Gao M., Cheng S., Hou W., Song M., Liu X., et al. (2020). County-level CO2 emissions and sequestration in China during 1997–2017. Sci. Data 7 (1), 391. doi: 10.1038/s41597-020-00736-3
Chinn M. D., Ito H. (2006). What matters for financial development? capital controls, institutions, and interactions. J. Dev. Econom. 81 (1), 163–192. doi: 10.1016/j.jdeveco.2005.05.010
Deng M., Chen J., Tao F., Zhu J., Wang M. (2022). On the coupling and coordination development between environment and economy: a case study in the Yangtze river delta of China. Int. J. Environ. Res. Public Health 19 (1), 586. doi: 10.3390/ijerph19010586
Fang C., Luo K., Kong Y., Lin H., Ren Y. (2018). Evaluating performance and elucidating the mechanisms of collaborative development within the Beijing–Tianjin–Hebei region, China. Sustainability 10 (2), 471. doi: 10.3390/su10020471
Jegatheesan V., Liow J. L., Shu L., Kim S. H., Visvanathan C. (2009). The need for global coordination in sustainable development. J. Cleaner Product 17 (7), 637–643. doi: 10.1016/j.jclepro.2008.11.016
Lai Z., Ge D., Xia H., Yue Y., Wang Z. (2020). Coupling coordination between environment, economy and tourism: a case study of China. PloS One 15 (2), e0228426. doi: 10.1371/journal.pone.0228426
Li G., Fang C. (2014). Analyzing the multi-mechanism of regional inequality in China. Ann. Regional Sci. 52, 155–182. doi: 10.1007/s00168-013-0580-2
Li S., Wu C., Lin Y., Li Z., Du Q. (2020). Urban morphology promotes urban vibrancy from the spatiotemporal and synergetic perspectives: a case study using multisource data in shenzhen, China. Sustainability 12 (12), 4829. doi: 10.3390/su12124829
Liu J., Jiang F., Qian C. (2020). A systematic study on the coordinated development of Beijing, tianjin and hebei. China Soft Sci. 352 (04), 142–153.
Liu D., Lin X. (2020). Spatial and temporal evolution characteristics and influencing factors of coordinated economic development in the Beijing-Tianjin-Hebei region. Urban Issues 296 (03), 28–37. doi: 10.13239/j.bjsshkxy.cswt.200304
Liu Y. C., Yang L. X., Wan X. (2018). Economic effect of coordinated development of Beijing-Tianjin-Hebei: based on perspective of 'counter-factual' thinking. J. J. Technol. Econom. 37, 100–108.
Miao Z. H., Chen Y. H. (2016). The symbiosis mechanism of regional ecosystem of Beijing-Tianjin-Hebei areas. J. J. Hebei Univ. (Philosophy Soc. Science) 41, 79–84. doi: 10.3969/j.issn.1005-6378.2016.05.012
Niu Z., Sun G. (2007). Research progress and analysis of china's sustainable development in the last 10 years. China's Population Resour. Environ. 97 (03), 122–128.
Pokhriyal N., Jacques D. C. (2017). Combining disparate data sources for improved poverty prediction and mapping. Proc. Natl. Acad. Sci. 114 (46), E9783–E9792. doi: 10.1073/pnas.1700319114
Research Group of Beijing-Tianjin-Hebei Collaborative Development Index of the Beijing-Tianjin-Hebei Coordinated Development Think Tank of the Chinese Academy of Social Sciences (2017). Research on Beijing-Tianjin-Hebei coordinated development index based on the new development ideas. Regional Economic Rev. 27 (03), 44–50. doi: 10.14017/j.cnki.2095-5766.2017.0098
Suo G., Hou M. (2020). Temporal and spatial characteristics and evolution trend of economic growth in Beijing-Tianjin-Hebei counties. Stat Dec. Making 36 (02), 110–113. doi: 10.13546/j.cnki.tjyjc.2020.02.024
Wang D. (2016). Coordinated analysis of regional coordinated development in China – and on the coordinated development of Beijing, tianjin and hebei. J. Hebei Univ. Econom. Trade 37 (03), 96–101. doi: 10.14178/j.cnki.issn1007-2101.2016.03.014
Wang J., He Y. (2018). Economic development in the counties of Beijing, tianjin and hebei: factor effect and urban radiation. Hebei Acad. J. 38 (01), 139–144.
Watmough G. R., Marcinko C. L., Sullivan C., Tschirhart K., Mutuo P. K., Palm C. A., et al. (2019). Socioecologically informed use of remote sensing data to predict rural household poverty. Proc. Natl. Acad. Sci. 116 (4), 1213–1218. doi: 10.1073/pnas.1812969116
WCED. (1987). World commission on environment and development. Our common Future 17 (1), 1–91. Available at: https://idl-bnc-idrc.dspacedirect.org/bitstream/handle/10625/152/WCED_v17_doc149.pdf.
Wei Y. D., Fan C. C. (2000). Regional inequality in China: a case study of jiangsu province. Prof. Geograph. 52 (3), 455–469. doi: 10.1111/0033-0124.00238
Weng Q., Qin Q., Li L. (2020). A comprehensive evaluation paradigm for regional green development based on “Five-circle model”: a case study from Beijing-Tianjin-Hebei. J. Cleaner Product 277, 124076. doi: 10.1016/j.jclepro.2020.124076
Wu D., Cao S. (2021). “Research on the design of evaluation system for coordinated development of Beijing-Tianjin-Hebei region,” in 6th International Conference on Economics, Management, Law and Education (EMLE 2020). 412–424 (Atlantis Press).
Xu H. (2013). Remote sensing evaluation index of regional ecological environment change. China Environ. Sci. 33 (05), 889–897.
Xu T., Ma T., Zhou C., Zhou Y. (2014). Characterizing spatio-temporal dynamics of urbanization in China using time series of DMSP/OLS night light data. Remote Sens. 6 (8), 7708–7731. doi: 10.3390/rs6087708
Xu H., Zhou H., Liang L. (2016). The locational dynamics of manufacturing in china's counties: influence of expressway investment. J. Regional Sci. 56 (3), 522–543. doi: 10.1111/jors.12252
Yao Y., Shao X. (2020). The multi-core bilateral border effects in the integration of Beijing-Tianjin-Hebei area. J. Capital Univ. Econom. Business 22 (05), 46–55. doi: 10.13504/j.cnki.issn1008-2700.2020.05.005
Ye T., Zhu E., Zhang G., Wu D., Zhang Y., Wu X., et al. (2021). Research on strategic priorities of the coordinated development of Beijing, tianjin and hebei (Beijing: Social Science Literature Press).
Ye T., Zhu E., Wang X., He X., Zhang Y., Li G., et al. (2020). The history, status quo and trend of the research on the coordinated development of Beijing, tianjin and hebei (Beijing: Social Science Literature Press).
Yu D. (2010). “Exploring spatiotemporally varying regressed relationships: the geographically weighted panel regression analysis,” in The international archives of the photogrammetry, remote sensing and spatial information sciences, Vol. 38. 134–139.
Yu D. (2014). Understanding regional development mechanisms in greater Beijing area, china 1995–2001, from a spatial–temporal perspective. GeoJournal 79, 195–207. doi: 10.1007/s10708-013-9500-3
Yu D., Murakami D., Zhang Y., Wu X., Li D., Wang X., et al. (2020). Investigating high-speed rail construction's support to county level regional development in China: an eigenvector based spatial filtering panel data analysis. Transport. Res. Part B: Methodol. 133, 21–37. doi: 10.1016/j.trb.2019.12.006
Yu D., Wei Y. D. (2008). Spatial data analysis of regional development in greater Beijing, China, in a GIS environment. Pap. Regional Sci. 87 (1), 97–117. doi: 10.1111/j.1435-5957.2007.00148.x
Zhang Y., Wang D. (2017). Quantitative measurement of Beijing-Tianjin-Hebei coordinated development based on the coordination degree of composite systems. Economy Manage. Res. 38 (12), 33–39. doi: 10.13502/j.cnki.issn1000-7636.2017.12.004
Zhang C., Zhong C. (2020). Measurement of china’s regional coordinated development and analysis of influencing factors – based on the perspective of eight comprehensive economic zones. East China Economic Manage. 34 (06), 64–72. doi: 10.19629/j.cnki.34-1014/f.191214001
Zhao J., Li C. (2022). Investigating ecosystem service trade-offs/synergies and their influencing factors in the Yangtze river delta region, China. Land 11 (1), 106. doi: 10.3390/land11010106
Zhao L., Zhang G. (2020). Evaluation of Beijing-Tianjin-Hebei ecological coordinated development and welfare effect. China’s Population Resour. Environ. 30 (10), 36–44. doi: 10.12062/cpre.20200426
Zhao L., Zhang G. (2021). Evaluation and welfare effect of coordinated ecological development of the Beijing–Tianjin–Hebei region. Chinese journal of population. Resour. Environ. 19 (3), 283–290. doi: 10.1016/j.cjpre.2021.12.031
Zheng Y., Lu D. (2004). Explanation of unbalanced economic development among counties to regional gap and policy implication. J. Finance Econom. 2004 (07), 121–129. doi: 10.16538/j.cnki.jfe.2004.07.013
Zhou Y., Li N., Wu W., Wu J. (2014). Evolution of spatial-temporal pattern of county economic development in China during 1982-2010. Prog. Geogr. 33 (01), 102–113. doi: 10.11820/dlkxjz.2014.01.012
Zhu E., He X. (2016). Research on the coordinated development index of Beijing, tianjin and hebei. J. Hebei Univ. (Philosophy Soc. Sci. Edition) 41 (03), 49–59. doi: 10.3969/j.isn.1005-6378.2016.03.008
Zhu H., Ye T., Zhang G.. (2017). Beijing Tianjin hebei blue book: Beijing tianjin hebei development report, (2017): new situation and new progress of collaborative development (Beijing: Social Science Literature Press).
Keywords: Beijing-Tianjin-Hebei region, coordinated development, spatial panel model, remote sensing data, big data
Citation: Li S and Wei Y (2023) Exploring the mechanism of coordinated development with multi-source data fusion: a case study in Beijing-Tianjin-Hebei Region, China. Front. Ecol. Evol. 11:1173867. doi: 10.3389/fevo.2023.1173867
Received: 25 February 2023; Accepted: 02 June 2023;
Published: 09 August 2023.
Edited by:
Amir Molajou, Iran University of Science and Technology, IranReviewed by:
Bolin Fu, Guilin University of Technology, ChinaYunjun Zhan, Wuhan University of Technology, China
Copyright © 2023 Li and Wei. This is an open-access article distributed under the terms of the Creative Commons Attribution License (CC BY). The use, distribution or reproduction in other forums is permitted, provided the original author(s) and the copyright owner(s) are credited and that the original publication in this journal is cited, in accordance with accepted academic practice. No use, distribution or reproduction is permitted which does not comply with these terms.
*Correspondence: Yukun Wei, d2VpeXVrdW5AcnVjLmVkdS5jbg==