
95% of researchers rate our articles as excellent or good
Learn more about the work of our research integrity team to safeguard the quality of each article we publish.
Find out more
ORIGINAL RESEARCH article
Front. Ecol. Evol. , 11 April 2023
Sec. Conservation and Restoration Ecology
Volume 11 - 2023 | https://doi.org/10.3389/fevo.2023.1170197
This article is part of the Research Topic Key Determinants of Biodiversity, Ecosystem Functioning and Restoration in Climate Change Sensitive Ecosystems View all 24 articles
 Pengtao Chai1Jiajie Xie1Lisheng Yang2Rong Zheng1Yuxuan Bian1Jiaqin Fu1
 Yunquan Wang1,3*
 Jianhua Chen1*
Temporal change of beta diversity provides a better understanding of the extent and consequences of species composition in forest communities with the ongoing global climate change. However, relatively little is known about temporal beta diversity changes across vertical stratification in the forest. In this study, we divided more than 5,000 tree individuals from a mixed broadleaf-conifer forest into four vertical strata (i.e., shrub, subcanopy, lower canopy, and upper canopy) to quantify how vertical stratification drives the temporal change of taxonomic and phylogenetic beta diversity. We found that taxonomic beta diversity significantly decreased while phylogenetic beta diversity showed an insignificant increase after 5 years. When considering vertical stratification, taxonomic beta diversity in the subcanopy, lower canopy, and upper canopy significantly changed with inconsistent directions, but phylogenetic beta diversity in the shrub significantly increased. Moreover, the significant decrease in taxonomic beta diversity is mainly driven by changes in species composition in shrub and subcanopy stratification (with 85.89% contributions). The changes in phylogenetic beta diversity are driven by shifts in the shrub and upper canopy (with 96.02% contributions). Our study suggests that taking community vertical stratification into consideration contributes to a better understanding of temporal beta diversity in forest communities.
Beta diversity is defined as the spatial variation in species composition among sites, providing insights into the ecological processes and driving patterns of biodiversity in the context of the ongoing global climate change (Whittaker, 1960; Anderson et al., 2011; Magurran et al., 2018, 2019; Reu et al., 2022). Growing concerns about the state of biodiversity change with climate change highlight the need for a better understanding of the extent and consequences of species composition in forest communities. Forest communities are dynamic (Hilmers et al., 2018; Legendre, 2019; Wang et al., 2020a), and the shifts within the community may drive temporal patterns of beta diversity (Magurran et al., 2018; Tatsumi et al., 2021). However, relatively little is known about how temporal beta diversity changes across vertical stratification in forest communities. The understanding of temporal beta diversity within forests can help us to understand forest community succession and highlight principal driving factors (Magurran et al., 2019).
In the process of forest community succession, the change in landscape of beta diversity may be affected by multiple factors. A study on the Loess Plateau of China (Chai et al., 2016) showed that taxonomic beta diversity did not change significantly with succession; however, other studies have found that taxonomic beta diversity decreased with succession (Kavgacı et al., 2010; Purschke et al., 2013). This difference may be related to forest age (Dalmaso et al., 2020), local climate (Keil et al., 2012), topography (Ahmad et al., 2020), research scales (Zhang et al., 2015), and other factors. Most studies of phylogenetic beta diversity showed a downward trend with succession (Purschke et al., 2013; Chai et al., 2016), indicating that deterministic processes gradually dominated the shift of phylogenetic structure in the community. The changes in temporal taxonomic and phylogenetic beta diversity can be explained at the species level (Tatsumi et al., 2021), and exploring the variation in diversity of different community structures containing different species composition can help provide greater insight into community successional mechanisms.
The vertical structure is an important structural feature of forests (Hao et al., 2007). Each vertical stratification has different levels of light absorption and transpiration (Tian et al., 2023), resulting in a pattern of vertical stratification of species composition (Onaindia et al., 2004; Wang et al., 2020b). Species occupying different vertical strata may show different responses to disturbance (Peterson and Reich, 2008; Decocq et al., 2014) such as climate change (Nakamura et al., 2017), among others. Therefore, as natural community succession progresses, the biodiversity represented across vertical stratification may also show alternative temporal changes with consequential impacts on the community as a whole. However, the contribution of diversity changes of each vertical stratum to overall diversity shifts during succession is unknown. Exploring this part of the research gap may help us to better understand the different outcomes of temporal beta diversity. In addition, previous studies have adopted a fixed standard method for measuring vertical stratification (Onaindia et al., 2004). However, this method does not account for the difference in local forest structure or the temporal change in structure that may occur during succession (Marziliano et al., 2013). Thus, in this study, we utilize a quantitative stratification method that accounts for the local variation of forest structure (Latham et al., 1998; Maeda et al., 2022). It is practical and meaningful to explore the temporal diversity of vertical stratification based on quantitative methods.
In this study, we explored the changes in taxonomic and phylogenetic beta diversity of vertical forest stratification during succession. We utilized tree census data from the Dongbaishan 1 ha mixed broadleaf-conifer forest in the Zhejiang Province in China (Wang et al., 2015), which was surveyed in 2013 and 2018. Individuals with DBH ≥ 1 cm were divided into different vertical stratification according to their height by using the TSTRAT algorithm and k-means cluster analysis. We focused on the following questions:
(1) How does taxonomic and phylogenetic beta diversity change within vertical stratification in this forest?
(2) How does the beta diversity in different vertical stratification contribute to the total temporal taxonomic and phylogenetic beta diversity?
The study was carried out in the Dongbaishan Provincial Nature Reserve (120°22′45″–120°30′48″E, 290°30′4″–290°30′48″N) in the Zhejiang Province in China with a total area of 5,071.5 ha and the main peak at an altitude of 1,194.6 m. Dongbaishan Nature Reserve has a mid-north subtropical monsoon climate with an average annual temperature of 11.7°C and an average annual precipitation of 1,541.4 mm. The area is rich in species with a total of 179 families, 749 genera, and 1,530 species of vascular plants (Wang et al., 2015).
In 2013, a 1 ha (100 m × 100 m) fixed dynamic monitoring plot (120°23′35.69″–120°23′40.63″ E, 290°23′40.63″–290°23′40.63″ N) was established in the Dongbaishan Nature Reserve following the construction standard of CForBio (Feng et al., 2016). The plot ranges from 135 to 157 m in elevation, ranges from 8° to 62° in slope, and consists of 25 20 m × 20 m quadrats. In 2013, all woody plants with DBH (diameter at breast height) ≥ 1 cm in the plot were investigated; the investigation content includes species name, DBH, height (vertical height from root to crown), crown base height, etc. Since then, the first re-census was conducted in 2018 (Supplementary Table 1).
The heights of all individuals were analyzed by the k-means clustering algorithm (Hartigan and Wong, 1979) to obtain the height of definitive vertical stratification. Before that, the range of optimal clustering number k is determined based on the number of strata under different competition coefficients obtained by the TSTRAT algorithm (Latham et al., 1998). The TSTRAT algorithm defines strata based on competing cut-off points with the tree canopy in a given area:
where CCH is the competition cut-off height, CL is the crown length, HBLC is the height-to-base of the live crown, and a is the competition coefficient. The range of a in this study is 0.3–0.5.
Then, the ideal clustering number k is found when the total sum of squares plateaus and when the gap statistic is at its maximum.
The abundance-based Bray-Curtis index (βbc) (Baselga and Chao, 2016) was chosen to measure the taxonomic beta diversity of the total community and each vertical stratification:
where A is the abundance of individuals of each species that exist in both sites j and k; B and C are the abundances of individuals that are unique to sites j and k, respectively.
The MPD_beta (interassemblage mean pairwise distance) was chosen to measure the phylogenetic beta diversity of the total community and each vertical stratification because MPD_beta was the most robust beta diversity metric to the source of the phylogeny (Li et al., 2019). In order to test whether the phylogenetic structure was different from the random expectation, a further comparison of MPD_beta with the null model was required (Miller et al., 2017). Specifically, the null model was constructed by fixing the species richness and occurrence frequency of each quadrat, and the identities of those species were randomly drawn from the whole species pool (Li et al., 2015). After constructing the null model 9,999 times, the standardized effect sizes of MPD_beta (SES.MPD_beta) were calculated as:
where χobs is the observed value, is the mean of the simulated values, and SDnull is the standard deviation of the simulated values. Positive SES.MPD_beta values indicate phylogenetic overdispersion, whereas negative values indicate clustering. If SES.MPD_beta = 0, it indicates that the species between the quadrats are random in the phylogenetic structure.
To examine the dynamic changes in the beta diversity of vertical stratification from 2013 to 2018, we used mixed effects models to fit βbc and SES.MPD_beta as a function of years. The year was treated as a single continuous fixed factor, and the pairwise groups between the quadrats were considered random effects. In addition, to measure the contribution of different vertical stratification to the beta diversity of the whole community, we used the “lmg” method which is a measure of the relative importance of the independent variables (Grömping, 2009).
All analyses were performed in R (version 4.2.2). The Bray-Curtis index and SES.MPD_beta were calculated using the “betapart” package (Baselga and Orme, 2012) and the “pincate” package (Kembel et al., 2010). Construction of the phylogenetic tree (Supplementary Figure 1) was completed through the “V.PhyloMaker” package (Jin and Qian, 2019, 2022). The mixed effects model was built by “lme4” packages (Bates et al., 2014). The “lmg” method was completed through the “relaimpo” package (Groemping, 2006).
According to the k-means clustering algorithm and TSTRAT algorithm, when the number of classified groups reached four groups, the change of the sum of squares within the group tended to be flat (Figure 1A). The line chart of gap statistics showed that when k was four, it was the optimal number of clusters (Figure 1B). At the same time, the number of classification groups could be divided into four to six strata according to the competition coefficient (Figure 1C). Therefore, the vertical structure of the plot was divided into four strata. Combined with height data of each vertical stratum obtained according to the clustering algorithm, these four strata can be defined as shrub, subcanopy, lower canopy, and upper canopy.

Figure 1. Results of the sum of squares (A), gap statistics (B), and TSTRAT algorithm (C).
Comparing the community characteristics of the four vertical strata in 2013 and 2018 (Table 1), we found that the height of each vertical stratum increased, especially in the lower canopy and upper canopy. Additionally, except for the shrub layer, the average DBH increased for each layer. Lastly, the abundance of the shrub, subcanopy, and lower canopy decreased, and the richness of the shrub and subcanopy decreased.
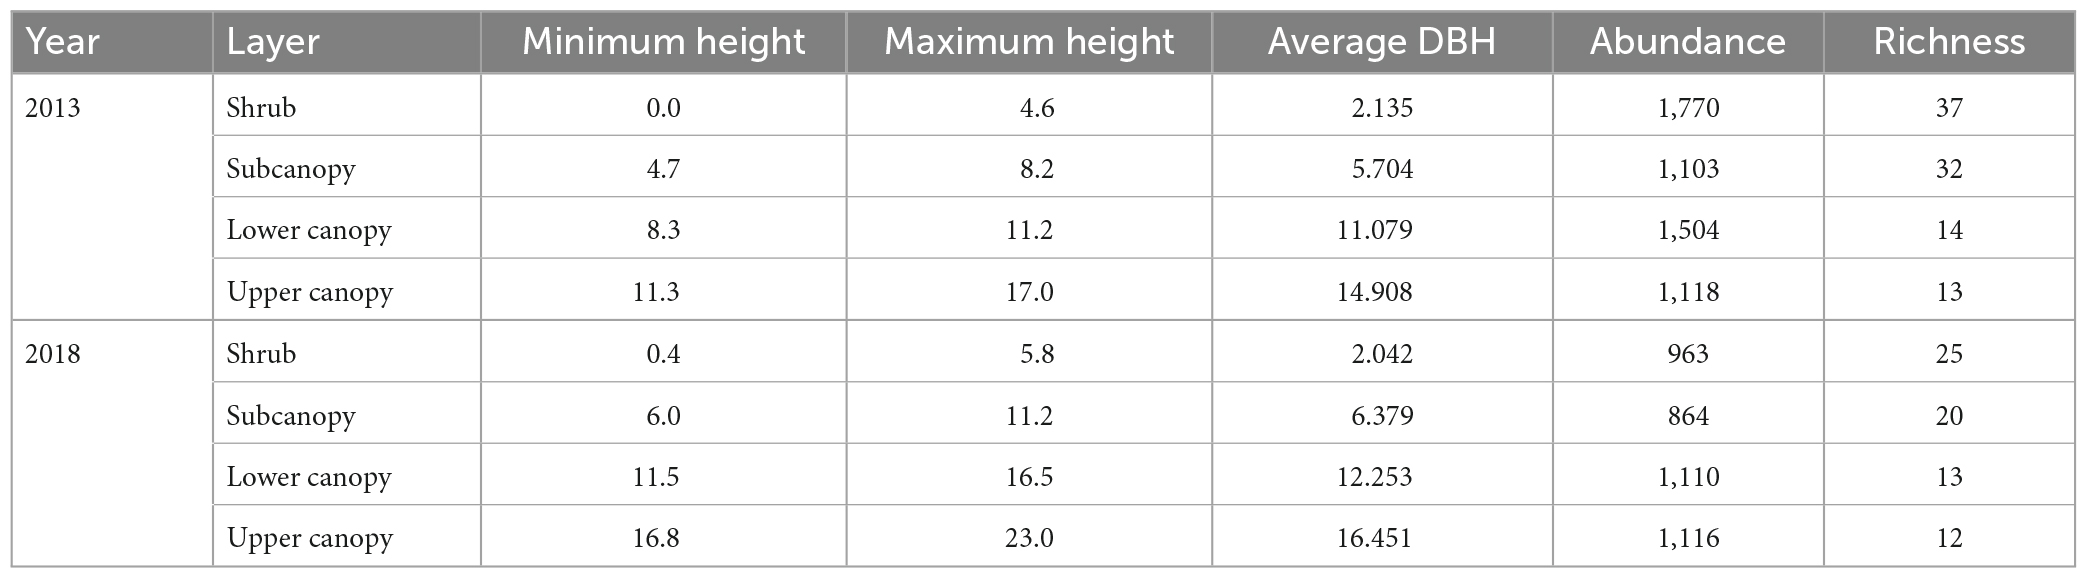
Table 1. Basic information on each vertical stratum in the Dongbaishan forest between 2013 and 2018.
The taxonomic beta diversity of the secondary Dongbaishan mixed broadleaf-conifer forest decreased significantly (p < 0.001) during succession from 2013 to 2018 (Figure 2A and Supplementary Table 2), indicating that the species composition among the quadrats homogenized over time. On the other hand, phylogenetic beta diversity showed no significant trend (Figure 2B and Supplementary Table 2).
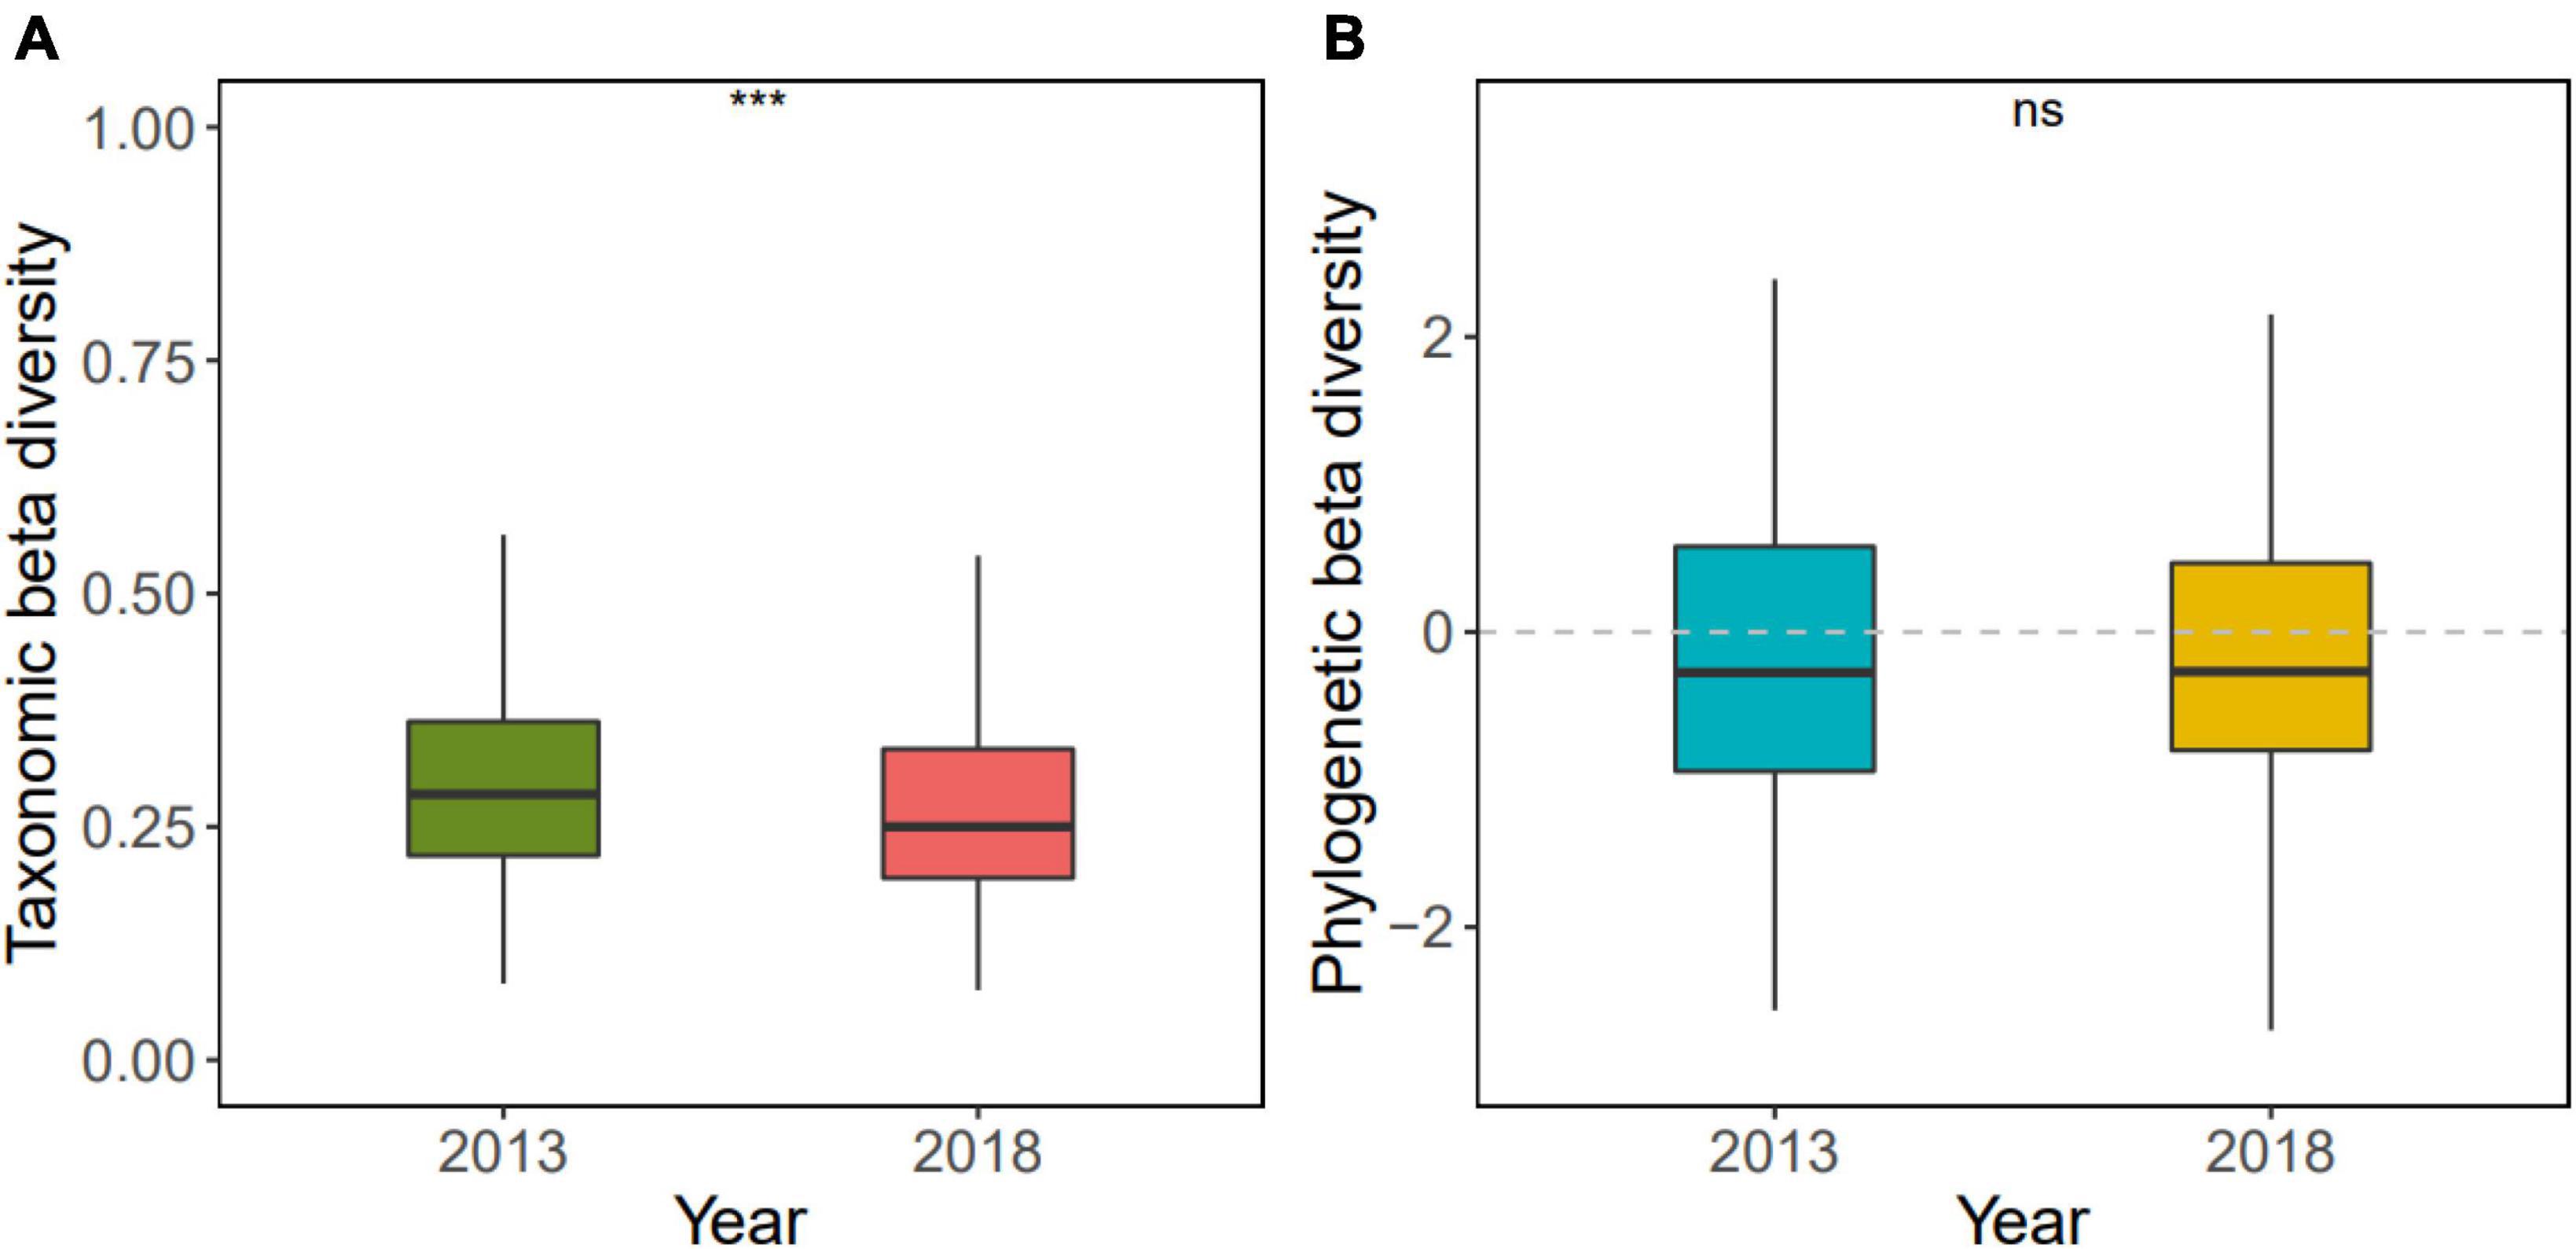
Figure 2. Changes in taxonomic beta diversity (A) and phylogenetic beta diversity (B) in the Dongbaishan forest between 2013 and 2018. nsp > 0.05, *p ≤ 0.05, **p ≤ 0.01, ***p ≤ 0.001, ****p ≤ 0.0001.
The taxonomic beta diversity of each vertical stratum varied from 2013 to 2018 (Figure 3 and Supplementary Table 2). The taxonomic beta diversity of the subcanopy decreased significantly (p < 0.001), which indicates that the species composition among the quadrats homogenized. The taxonomic beta diversity of the upper canopy and lower canopy increased significantly (p < 0.0001), which means that the species composition among the quadrats heterogenized.
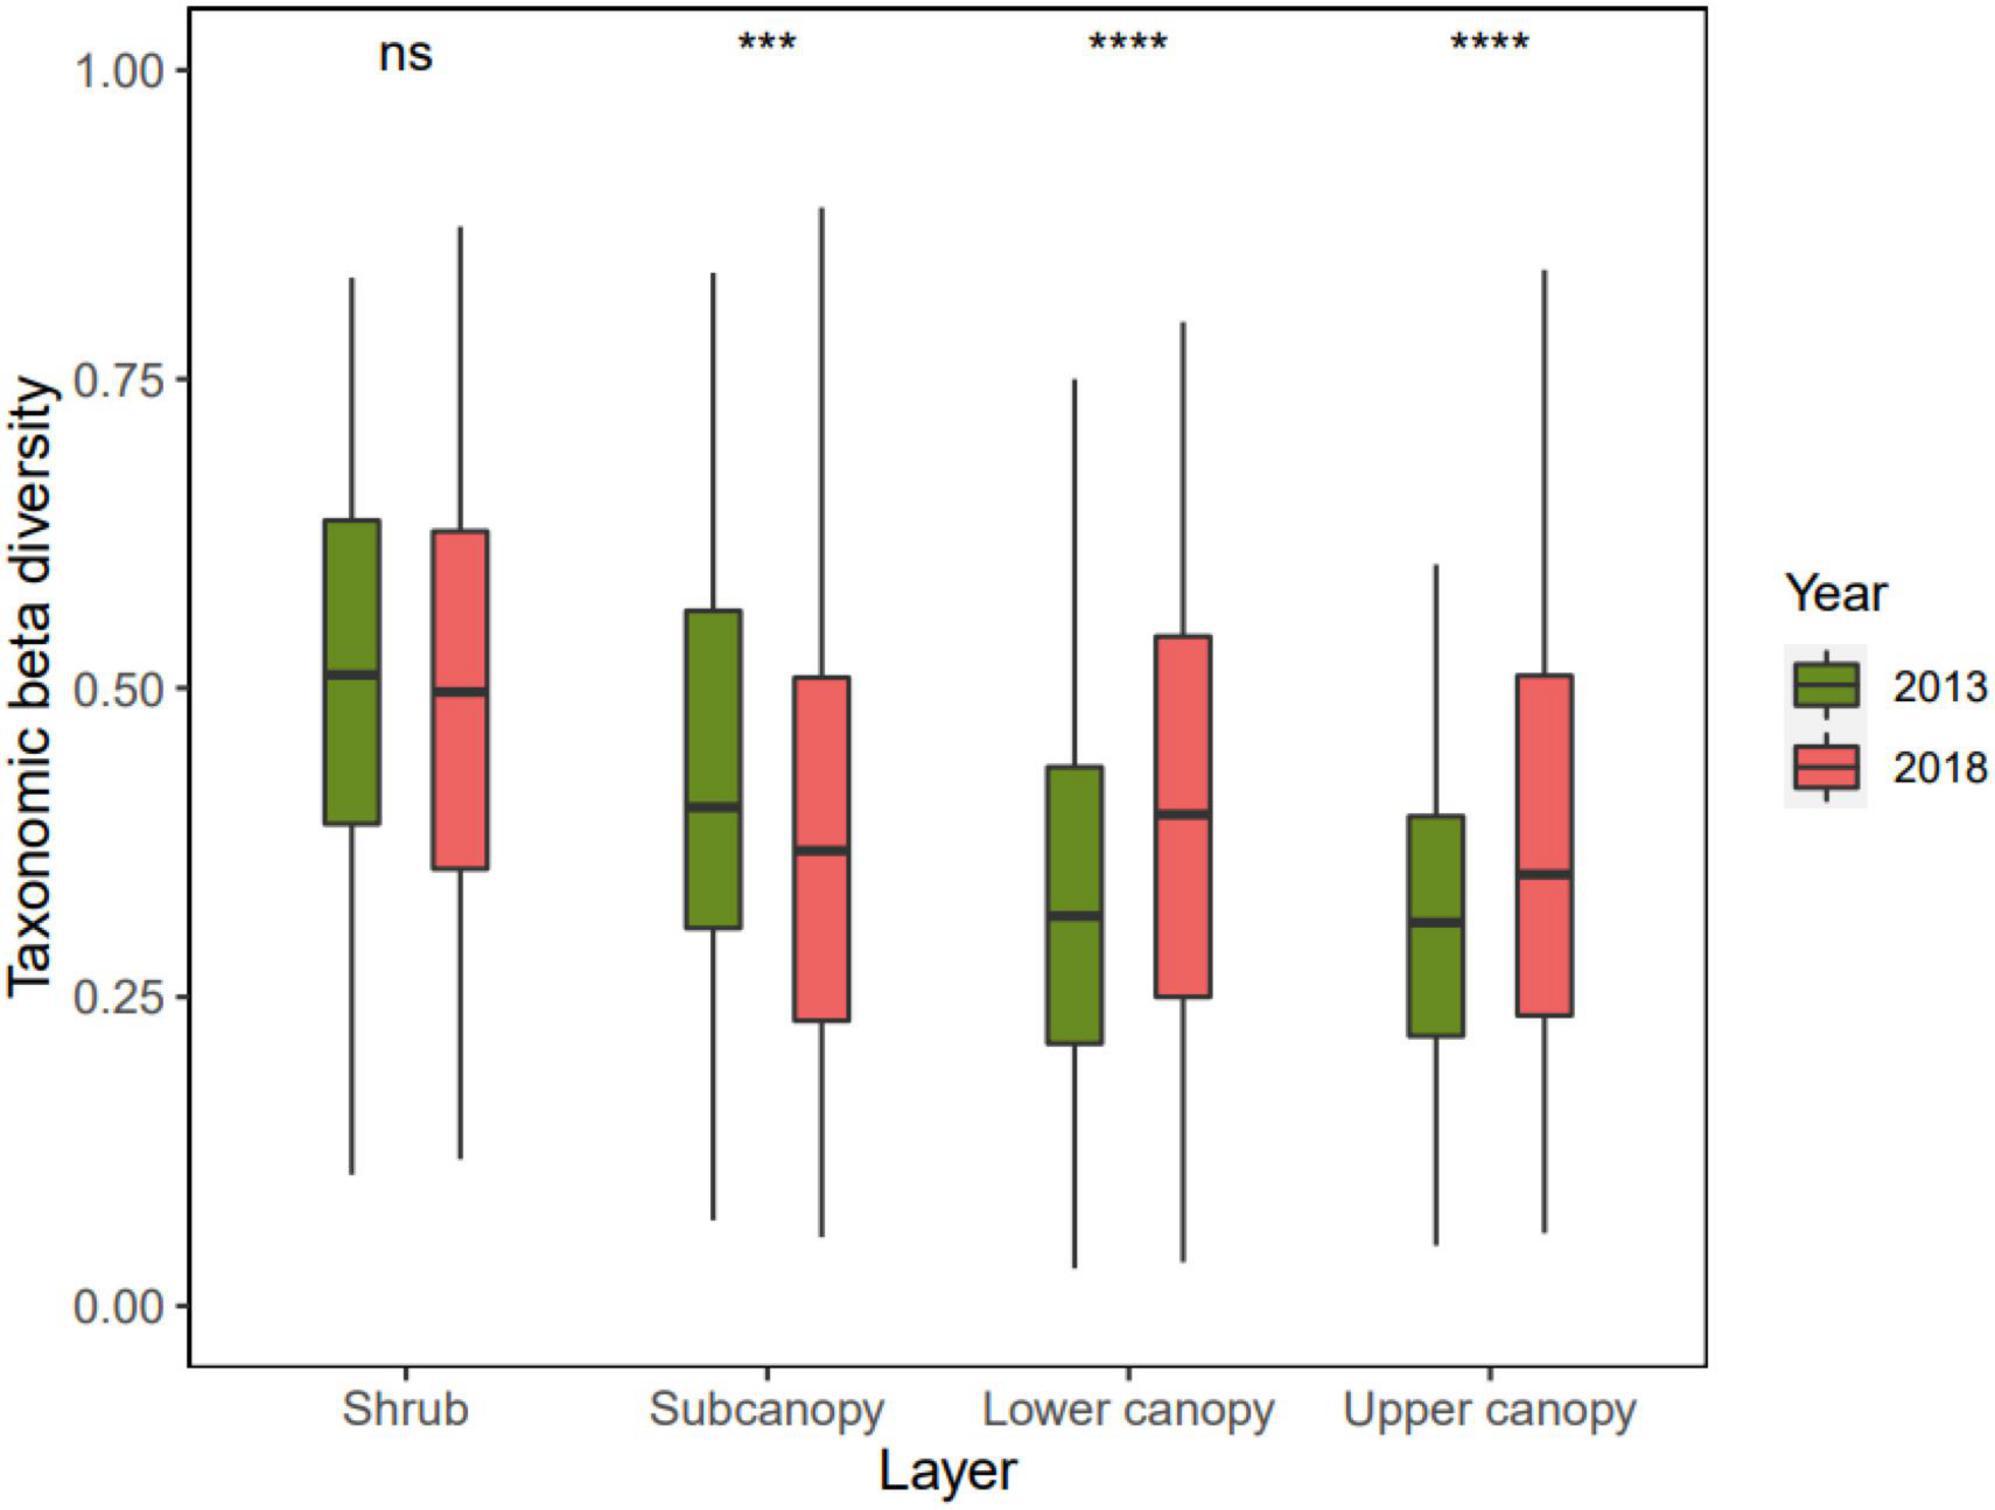
Figure 3. Changes of taxonomic beta diversity in four vertical stratification in the Dongbaishan forest between 2013 and 2018. nsp > 0.05, *p ≤ 0.05, **p ≤ 0.01, ***p ≤ 0.001, ****p ≤ 0.0001.
The phylogenetic beta diversity of each vertical stratum also varied from 2013 to 2018 (Figure 4 and Supplementary Table 2). In 2013, the phylogenetic distance of the lower canopy was more distant than that of other vertical strata, but by 2018, the vertical stratification with the most distant phylogenetic distance between the quadrats were the upper canopy. Across time periods, the phylogenetic distance of the shrub significantly increased (p < 0.0001) and the upper canopy slightly significantly increased (p = 0.0687), whereas the lower canopy decreased.
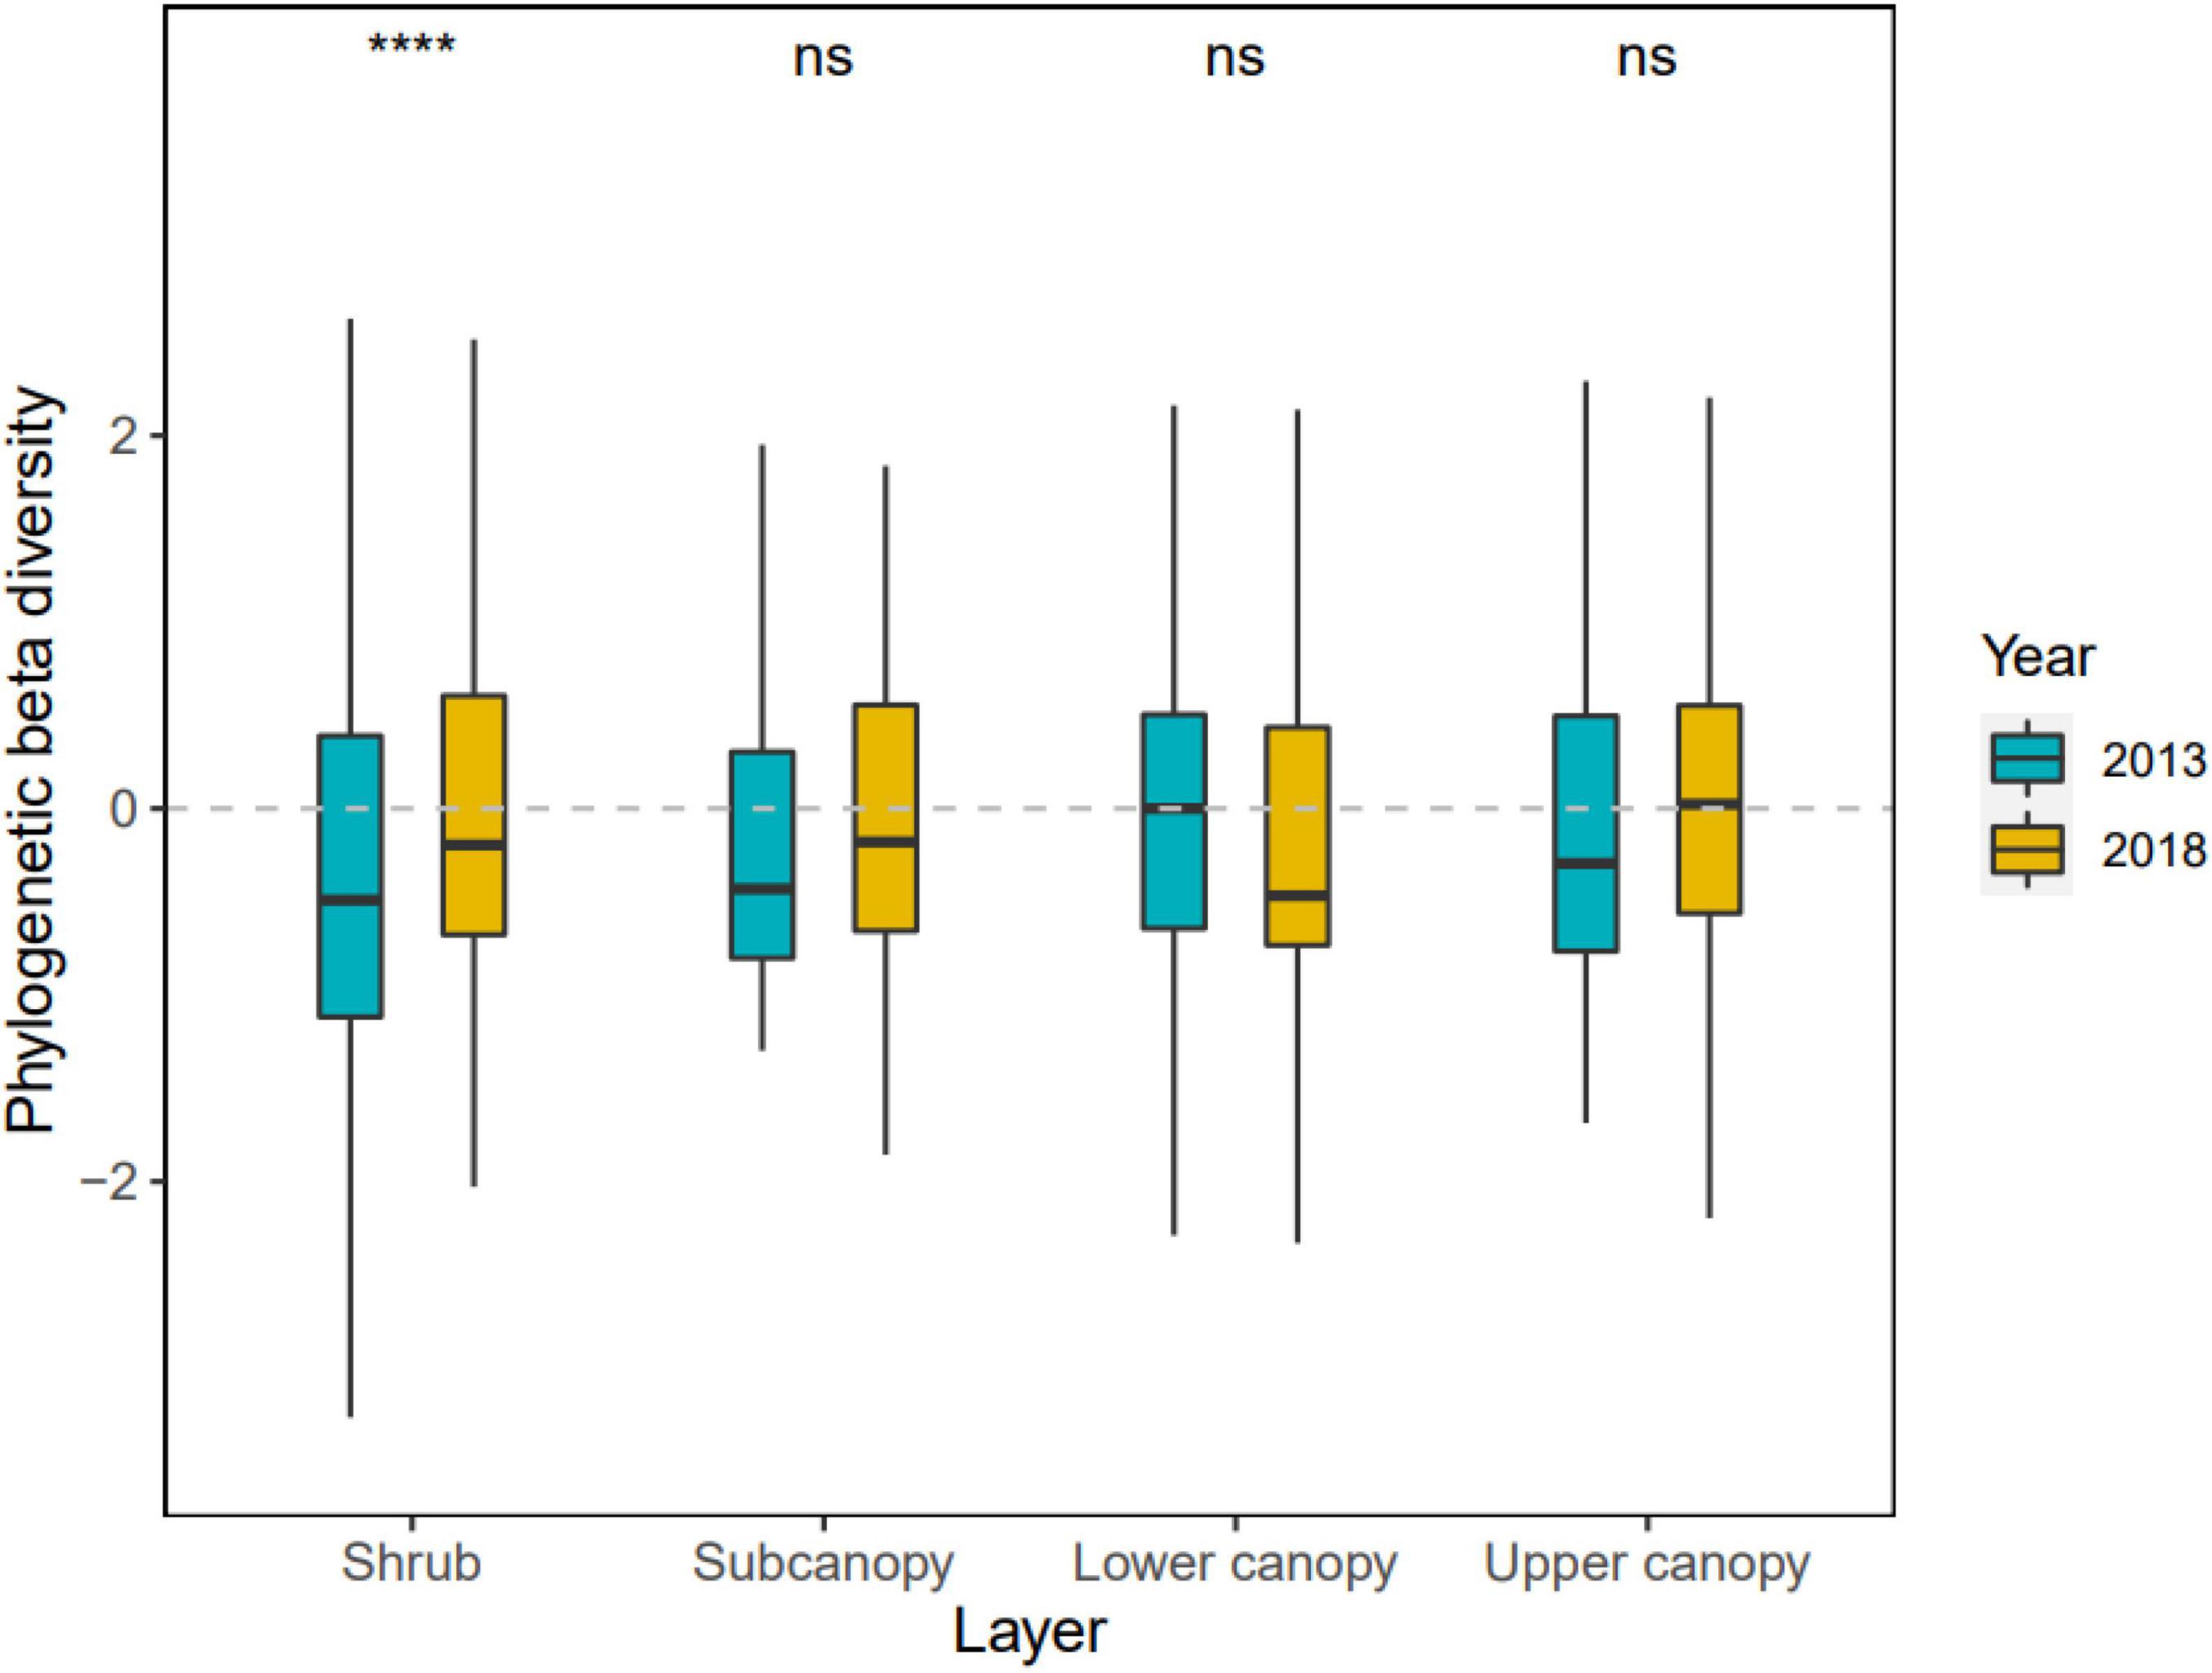
Figure 4. Changes of phylogenetic beta diversity in four vertical stratification in the Dongbaishan forest between 2013 and 2018. nsp > 0.05, *p ≤ 0.05, **p ≤ 0.01, ***p ≤ 0.001, ****p ≤ 0.0001.
The changes in beta diversity of each vertical stratum had different implications for the changes of beta diversity for the whole community (Figure 5). The changes in beta diversity in the shrub and subcanopy were the main explanatory variables of community beta diversity. Shrub and subcanopy together were responsible for 85.89% of the changes in taxonomic beta diversity. Shrub and upper canopy jointly were responsible for 96.02% of the changes in phylogenetic beta diversity, although, overall, there was no significant increase or decrease with succession.
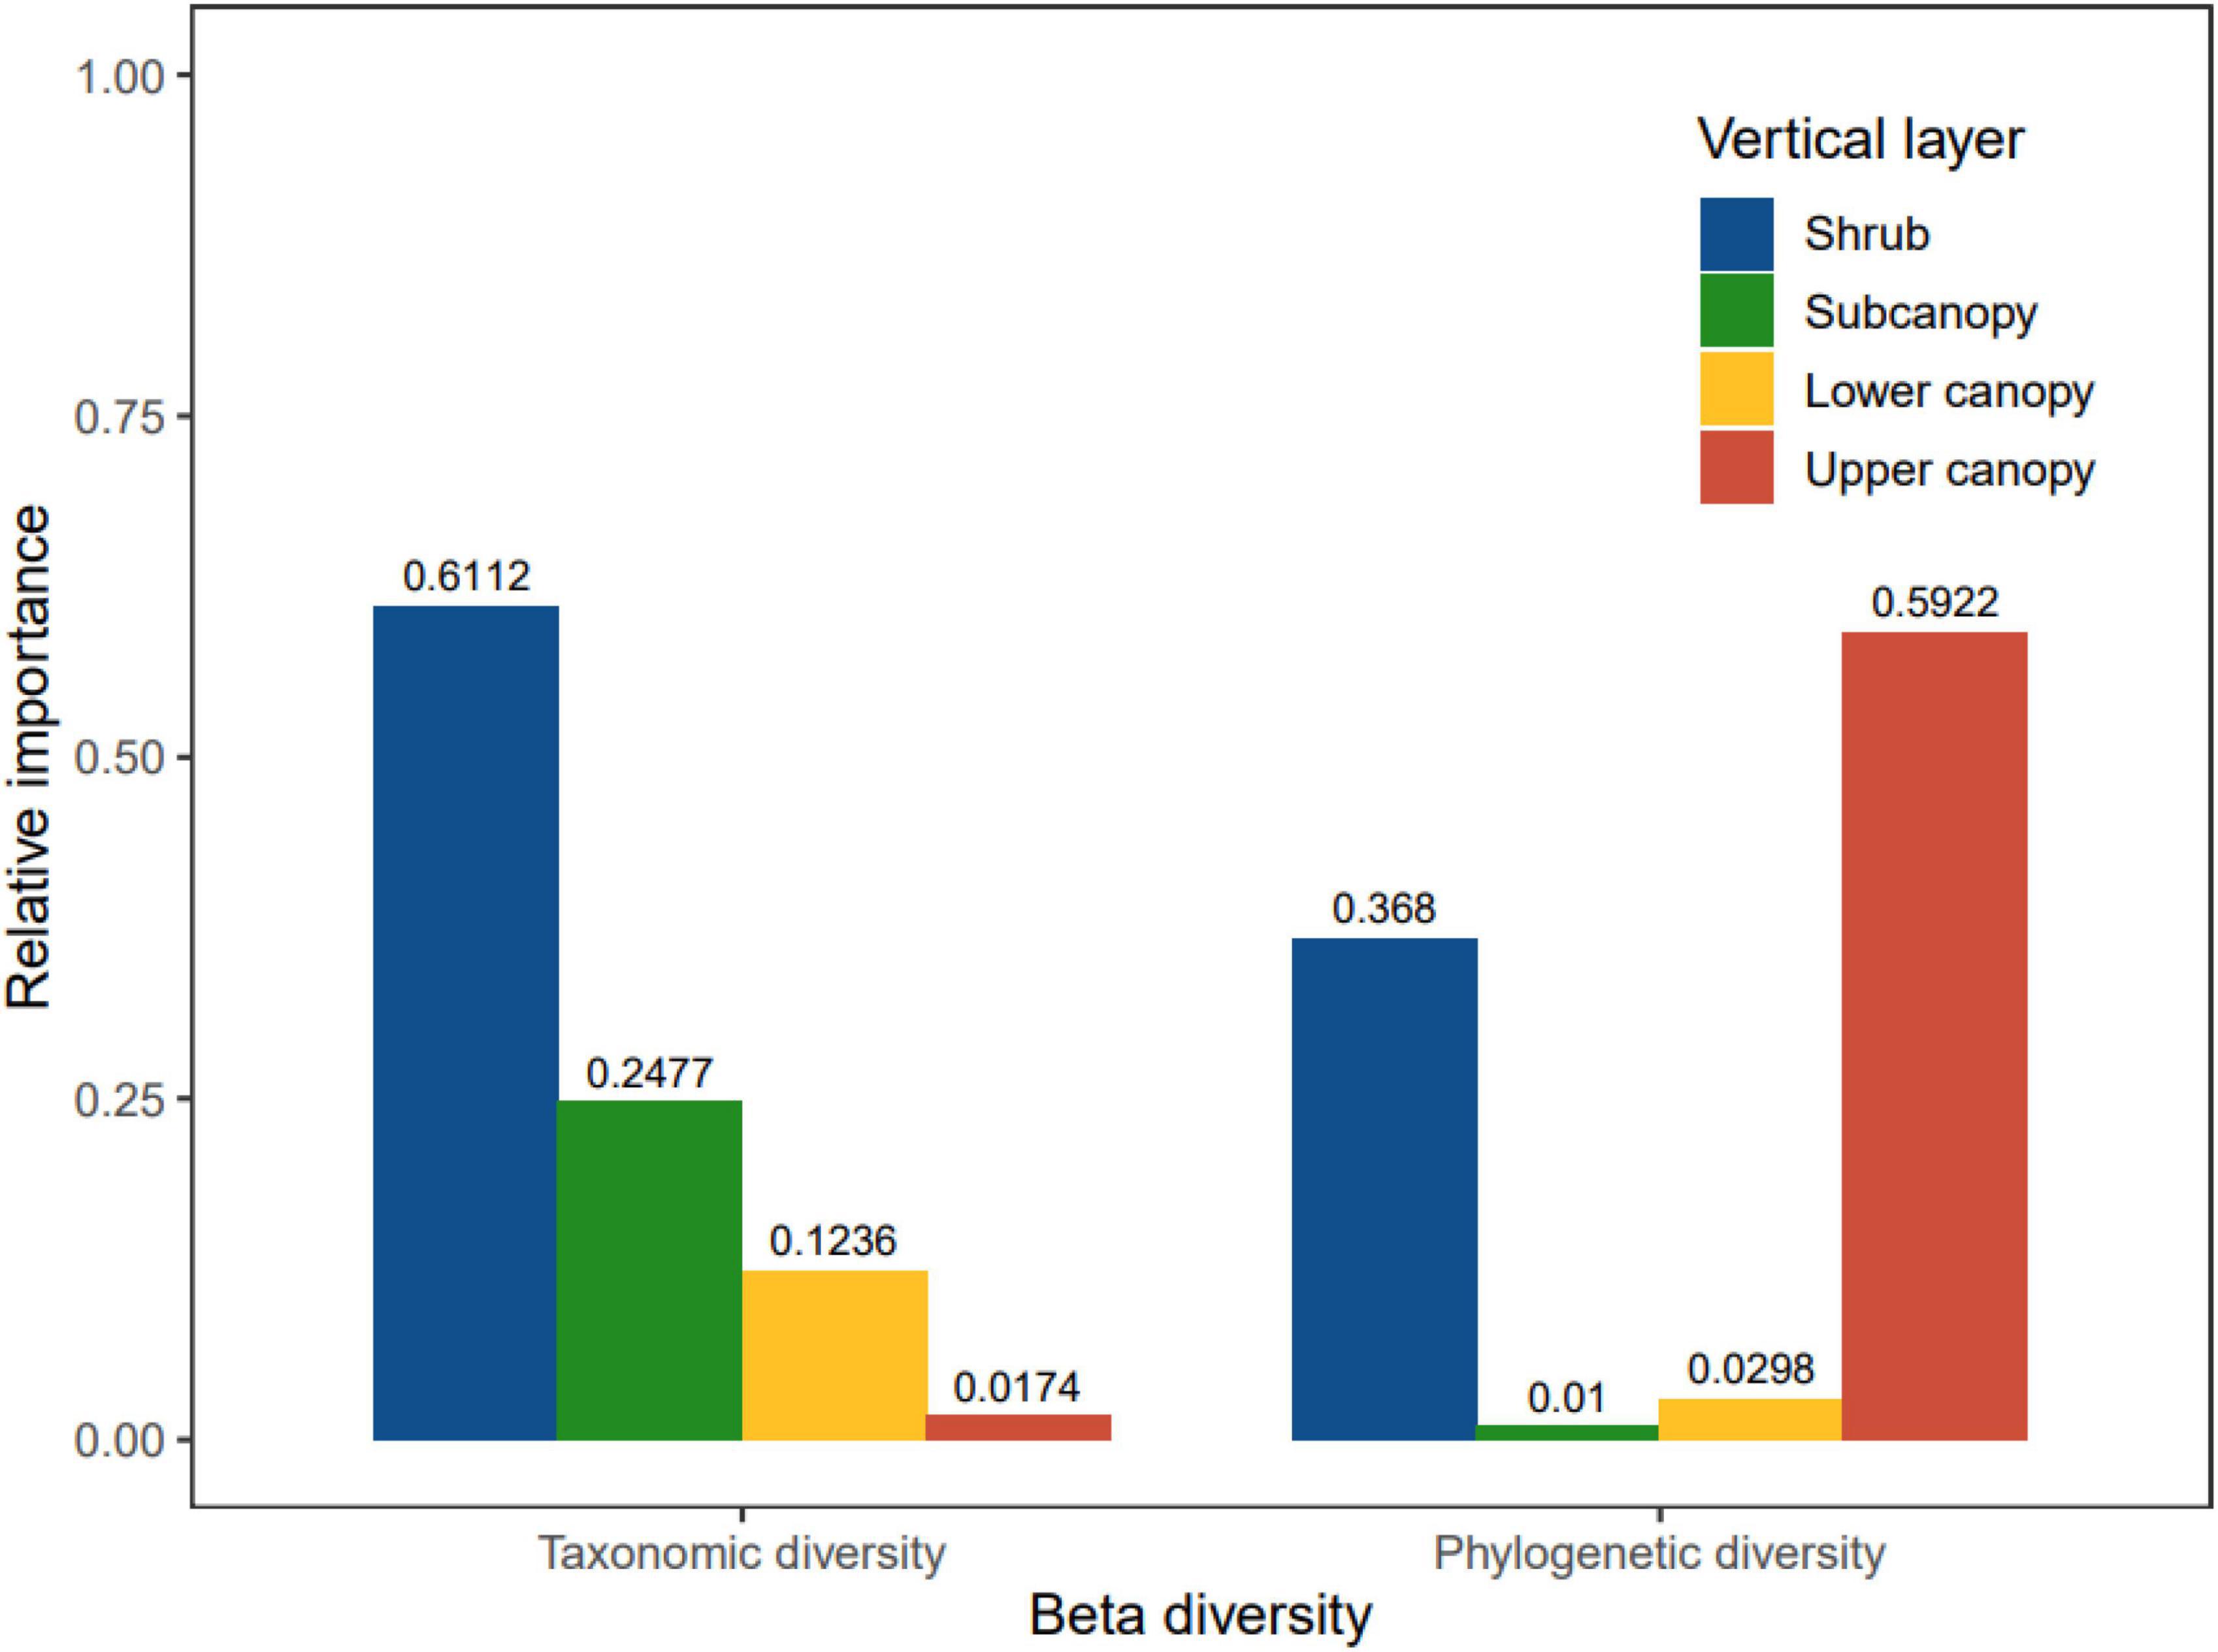
Figure 5. The relative contribution of different vertical stratification to temporal taxonomic and phylogenetic beta diversity in the Dongbaishan forest.
With succession at our site, the height of each vertical stratum gradually increased, highlighting the different growth conditions and environmental adaptability of the species in each stratum. The abundance and frequency of the shrub decreased, especially the dominant species such as Schima superba and other rare species such as Litsea cubeba (Supplementary Tables 3, 4). Nevertheless, the results of partitioning beta diversity showed that there were no significant changes in abundance gradients and abundance balances (Supplementary Figures 2, 3 and Supplementary Table 5) likely because of the decrease of common abundance (concatenation of abundance among quadrats) in dominant species and the decrease of unique abundance (complementary of abundance among quadrats) caused by rare species counteracting each other on the difference of species composition of the whole community. Finally, the results also showed that the taxonomic beta diversity did not change significantly. It is worth noting that the difference in species composition between shrub stratification is determined more by the turnover of species abundance (i.e., the decrease of common abundance), which indicates that shrub species may be more vulnerable to dispersal limitation and environmental filtering (Shi et al., 2021; Hu et al., 2022).
The decrease in abundance of some rare species in the subcanopy and the frequency of some dominant species such as Pinus massoniana and Lithocar pusglaber reduced the change of abundance balances (that is, the turnover of species abundance decreased), which was characterized by a significant decrease in taxonomic beta diversity. The canopy showed an increase in taxonomic beta diversity, indicating that the difference between canopies within the community gradually increased. This result may be related to the increase of the abundance gradients, thereby indicating an influence of selective local extinction/colonization of some species in the canopy (Wang et al., 2010). Unlike the shrub, the difference in species composition among the subcanopy, lower canopy, and upper canopy was determined primarily by abundance gradients, indicating that there may be strong selective local extinction/colonization in these vertical strata. In addition, there were some species in the three higher vertical strata that do not exist in the shrub stratification (Supplementary Table 1), which might inhibit the growth of other species because of the priority effect (Gui et al., 2019; Solarik et al., 2020), thus making the components of the abundance turnover of beta diversity smaller.
Importantly, there were two extreme droughts in Dongbaishan from 2013 to 2018, which significantly inhibited the plant growth of herbs and shrubs (Copeland et al., 2016; Jacobsen and Pratt, 2018). In addition, rare species have rarer numbers of individuals and seed sources, making them more vulnerable to local extinction from strong disturbances such as drought (Tilman and El Haddi, 1992), which may have impacted the shift in community composition in Dongbaishan.
The phylogenetic beta diversity of the shrub and the upper canopy showed a downward trend and were not greater than 0, suggesting that the phylogenetic beta diversity change in the two vertical strata was driven by an increase in relatedness in the community. The phylogenetic beta diversity of the subcanopy did not change significantly, but the values were all less than 0, indicating that the phylogenetic turnover between the subcanopies was also driven by closely related individuals (Chai et al., 2016). On the other hand, the phylogenetic turnover of the lower canopy changed from being driven by randomized individuals to closely related individuals. This may be due to different responses from different vertical stratification to biotic/abiotic factors such as extreme drought and negative density dependence (Fibich et al., 2021; Yan et al., 2022).
In this study, we found that the taxonomic beta diversity of the community decreased with succession, indicating that the species composition among the quadrats is becoming homogenized. This can be seen in the decrease in community abundance balances and the decline of the abundance gradients (Supplementary Table 5). Combined with the changes in abundance and frequency (Supplementary Table 1), the decrease in unique abundance is essential for the changes in the taxonomic beta diversity, especially the unique abundance of rare species. From the perspective of vertical structure, this difference is mainly affected by changes in the shrub and subcanopy stratification (although the interannual taxonomic beta diversity of the shrub is only weakly significant). This may be due to the high richness of the shrub and subcanopy stratification, and there are more rare species in a few quadrats than the canopy, but because the trees are relatively small and weakly resistant to disturbance, they are easily affected by external factors (such as fire, drought, and pests) and local extinction (Lang and Knight, 1983; Klesse et al., 2021; Masaki et al., 2021; Yang et al., 2022). At the same time, the dominant species of these two strata are more likely to be affected by negative density dependence restriction and upper stratification (Sercu et al., 2017).
The phylogenetic beta diversity of the community increased, indicating that the phylogenetic turnover in the community is driven by closely related individuals to randomized individuals. This is different from the result of other studies (Purschke et al., 2013; Chai et al., 2016), possibly because the time span of this study was small and involved extreme weather events. The randomization of community phylogenetic turnover was mainly affected by changes in the shrub and the upper canopy stratification, especially the upper canopy. We found that this is because the dominant species in the upper canopy may have a greater relative influence on the species composition and phylogenetic structure of the vertical stratification below the upper canopy (Yuan et al., 2012; Nakamura et al., 2017). For example, the upper canopy may influence competition in the lower stratification, especially in the shrub (Oberle et al., 2009).
Analysis of taxonomic and phylogenetic beta diversity in each vertical stratification of the community during succession provides insight into the influence of dynamic vertical distribution patterns on the forest plant community as a whole (Chai et al., 2016; Gui et al., 2019; Magurran et al., 2019). During succession, taxonomic and phylogenetic beta diversity varied across vertical stratification, suggesting that the assessment of community diversity requires data collected across the vertical space. In this subtropical secondary mixed coniferous forest, species composition differences across a successional period were mainly influenced by a decrease in unique abundance in the shrub and subcanopy stratification, while the phylogenetic turnover of the community tended to randomize, mainly driven by stochastic processes in the shrub and upper canopy stratification. We found that temporal beta diversity in this community was driven by the uppermost and lowermost stratification of the vertical structure.
The original contributions presented in this study are included in the article/Supplementary material, further inquiries can be directed to the corresponding authors.
PC, YW, and JC conceived and designed the study and collected the data. PC performed the statistical analyses and wrote the first draft with substantial input from YW and JC. JX, LY, RZ, YB, and JF contributed to the development of the final manuscript. All authors read and agreed to the published version of the manuscript.
This study was financially supported by the “Pioneer” and “Leading Goose” R&D Program of Zhejiang (2023C03137) and Zhejiang Provincial Natural Science Foundation of China (LQ22C030001).
We acknowledge the Zhuji Natural Resources and Planning Bureau for the support provided for this study. We are grateful to Yu Mingjian from Zhejiang University for the helpful feedback in improving this manuscript and Joseph Elliot at the University of Kansas for his assistance with the English language and grammatical editing of the manuscript.
The authors declare that the research was conducted in the absence of any commercial or financial relationships that could be construed as a potential conflict of interest.
All claims expressed in this article are solely those of the authors and do not necessarily represent those of their affiliated organizations, or those of the publisher, the editors and the reviewers. Any product that may be evaluated in this article, or claim that may be made by its manufacturer, is not guaranteed or endorsed by the publisher.
The Supplementary Material for this article can be found online at: https://www.frontiersin.org/articles/10.3389/fevo.2023.1170197/full#supplementary-material
Ahmad, M., Uniyal, S. K., Batish, D. R., Singh, H. P., Jaryan, V., Rathee, S., et al. (2020). Patterns of plant communities along vertical gradient in dhauladhar mountains in lesser himalayas in North-Western India. Sci. Total Environ. 716:136919. doi: 10.1016/j.scitotenv.2020.136919
Anderson, M. J., Crist, T. O., Chase, J. M., Vellend, M., Inouye, B. D., Freestone, A. L., et al. (2011). Navigating the multiple meanings of β diversity: a roadmap for the practicing ecologist. Ecol. Lett. 14, 19–28. doi: 10.1111/j.1461-0248.2010.01552.x
Baselga, A., and Chao, A. (2016). Partitioning abundance-based multiple-site dissimilarity into components: balanced variation in abundance and abundance gradients. Methods Ecol. Evol. 8, 799–808. doi: 10.1111/2041-210X.12693
Baselga, A., and Orme, C. D. L. (2012). betapart: an R package for the study of beta diversity. Methods Ecol. Evol. 3, 808–812. doi: 10.1111/j.2041-210X.2012.00224.x
Bates, D. M., Machler, M., Bolker, B. M., and Walker, S. C. (2014). Fitting linear mixed-effects models using lme4. J. Stat. Softw. 67, 1–48. doi: 10.18637/jss.v067.i01
Chai, Y., Yue, M., Liu, X., Guo, Y., Wang, M., Xu, J., et al. (2016). Patterns of taxonomic, phylogenetic diversity during a long-term succession of forest on the Loess Plateau, China: insights into assembly process. Sci. Rep. 6:27087. doi: 10.1038/srep27087
Copeland, S. M., Harrison, S. P., Latimer, A. M., Damschen, E. I., Eskelinen, A. M., Fernandez-Going, B., et al. (2016). Ecological effects of extreme drought on Californian herbaceous plant communities. Ecol. Monogr. 86, 295–311. doi: 10.1002/ecm.1218
Dalmaso, C. A., Marques, M. C. M., Higuchi, P., Zwiener, V. P., and Marques, R. (2020). Spatial and temporal structure of diversity and demographic dynamics along a successional gradient of tropical forests in southern Brazil. Ecol. Evol. 10, 3164–3177. doi: 10.1002/ece3.5816
Decocq, G., Beina, D., Jamoneau, A., Gourlet-Fleury, S., and Closset-Kopp, D. (2014). Don’t miss the forest for the trees! evidence for vertical differences in the response of plant diversity to disturbance in a tropical rain forest. Perspect. Plant Ecol. Evol. Syst. 16, 279–287. doi: 10.1016/j.ppees.2014.09.001
Feng, G., Mi, X., Yan, H., Li, F. Y., Svenning, J.-C., and Ma, K. (2016). CForBio: a network monitoring Chinese forest biodiversity. Sci. Bull. 61, 1163–1170. doi: 10.13287/j.1001-9332.202108.001
Fibich, P., Ishihara, M. I., Suzuki, S. N., Doležal, J., and Altman, J. (2021). Contribution of conspecific negative density dependence to species diversity is increasing towards low environmental limitation in Japanese forests. Sci. Rep. 11:18712. doi: 10.1038/s41598-021-98025-5
Groemping, U. (2006). Relative importance for linear regression in R: the package relaimpo. J. Stat. Softw. 17, 1–27. doi: 10.18637/jss.v017.i01
Grömping, U. (2009). Variable importance assessment in regression: linear regression versus random forest. Am. Statistician 63, 308–319. doi: 10.3389/fpls.2022.722442
Gui, X., Lian, J., Zhang, R., Li, Y., Shen, H., Ni, Y., et al. (2019). Vertical structure and its biodiversity in a subtropical evergreen broad-leaved forest at dinghushan in Guangdong province, China. Biodiversity Sci. 27:619. doi: 10.17520/biods.2019107
Hao, Z., Zhang, J., Song, B., Ye, J., and Li, B. (2007). Vertical structure and spatial associations of dominant tree species in an old-growth temperate forest. For. Ecol. Manag. 252, 1–11. doi: 10.1016/j.foreco.2007.06.026
Hartigan, J. A., and Wong, M. A. (1979). Algorithm as 136: a k-means clustering algorithm. J. R. Stat. Soc. Ser. C 28, 100–108. doi: 10.2307/2346830
Hilmers, T., Friess, N., Bässler, C., Heurich, M., Brandl, R., Pretzsch, H., et al. (2018). Biodiversity along temperate forest succession. J. Appl. Ecol. 55, 2756–2766. doi: 10.1111/1365-2664.13238
Hu, D., Jiang, L., Hou, Z., Zhang, J., Wang, H., and Lv, G. (2022). Environmental filtration and dispersal limitation explain different aspects of beta diversity in desert plant communities. Glob. Ecol. Conserv. 33:e01956. doi: 10.1016/j.gecco.2021.e01956
Jacobsen, A. L., and Pratt, R. B. (2018). Extensive drought-associated plant mortality as an agent of type-conversion in chaparral shrublands. New Phytol. 219, 498–504. doi: 10.1111/nph.15186
Jin, Y., and Qian, H. (2019). V.PhyloMaker: an R package that can generate very large phylogenies for vascular plants. Ecography 42, 1353–1359. doi: 10.1111/ecog.04434
Jin, Y., and Qian, H. (2022). V.PhyloMaker2: an updated and enlarged R package that can generate very large phylogenies for vascular plants. Plant Divers. 44, 335–339. doi: 10.1016/j.pld.2022.05.005
Kavgacı, A., Čarni, A., Başaran, S., Başaran, M. A., Košir, P., Marinšek, A., et al. (2010). Long-term post-fire succession of Pinus brutia forest in the east mediterranean. Int. J. Wildland Fire 19, 599–605. doi: 10.1071/WF08044
Keil, P., Schweiger, O., Kühn, I., Kunin, W. E., Kuussaari, M., Settele, J., et al. (2012). Patterns of beta diversity in Europe: the role of climate, land cover and distance across scales. J. Biogeogr. 39, 1473–1486. doi: 10.1111/j.1365-2699.2012.02701.x
Kembel, S. W., Cowan, P. D., Helmus, M. R., Cornwell, W. K., Morlon, H., Ackerly, D. D., et al. (2010). Picante: R tools for integrating phylogenies and ecology. Bioinformatics 26, 1463–1464. doi: 10.1093/bioinformatics/btq166
Klesse, S., Abegg, M., Hopf, S. E., Gossner, M. M., Rigling, A., and Queloz, V. (2021). Spread and severity of ash dieback in Switzerland - tree characteristics and landscape features explain varying mortality probability. Front. For. Glob. Change 4:645920. doi: 10.3389/ffgc.2021.645920
Lang, G. E., and Knight, D. H. (1983). Tree growth, mortality, recruitment, and canopy gap formation during a 10-year period in a tropical moist forest. Ecology 64, 1075–1080. doi: 10.2307/1937816
Latham, P. A., Zuuring, H. R., and Coble, D. W. (1998). A method for quantifying vertical forest structure. For. Ecol. Manag. 104, 157–170. doi: 10.1016/S0378-1127(97)00254-5
Legendre, P. (2019). A temporal beta-diversity index to identify sites that have changed in exceptional ways in space–time surveys. Ecol. Evol. 9, 3500–3514. doi: 10.1002/ece3.4984
Li, D., Trotta, L., Marx, H. E., Allen, J. M., Sun, M., Soltis, D. E., et al. (2019). For common community phylogenetic analyses, go ahead and use synthesis phylogenies. Ecology 100:e02788. doi: 10.1002/ecy.2788
Li, S. P., Cadotte, M. W., Meiners, S. J., Hua, Z. S., Jiang, L., and Shu, W. S. (2015). Species colonisation, not competitive exclusion, drives community overdispersion over long-term succession. Ecol. Lett. 18, 964–973. doi: 10.1111/ele.12476
Maeda, E. E., Nunes, M. H., Calders, K., Moura, Y. M. D., Raumonen, P., Tuomisto, H., et al. (2022). Shifts in structural diversity of Amazonian forest edges detected using terrestrial laser scanning. Remote Sens. Environ. 271:112895. doi: 10.1016/j.rse.2022.112895
Magurran, A. E., Deacon, A. E., Moyes, F., Shimadzu, H., Dornelas, M., Phillip, D. A. T., et al. (2018). Divergent biodiversity change within ecosystems. Proc. Natl. Acad. Sci. U S A. 115, 1843–1847. doi: 10.1073/pnas.1712594115
Magurran, A. E., Dornelas, M., Moyes, F., and Henderson, P. A. (2019). Temporal β diversity—a macroecological perspective. Glob. Ecol. Biogeogr. 28, 1949–1960. doi: 10.1111/geb.13026
Marziliano, P. A., Lafortezza, R., Colangelo, G., Davies, C., and Sanesi, G. (2013). Structural diversity and height growth models in urban forest plantations: a case-study in northern Italy. Urban For. Urban Greening 12, 246–254. doi: 10.1016/j.ufug.2013.01.006
Masaki, T., Kitagawa, R., Nakashizuka, T., Shibata, M., and Tanaka, H. (2021). Interspecific variation in mortality and growth and changes in their relationship with size class in an old-growth temperate forest. Ecol. Evol. 11, 8869–8881. doi: 10.1002/ece3.7720
Miller, E. T., Farine, D. R., and Trisos, C. H. (2017). Phylogenetic community structure metrics and null models: a review with new methods and software. Ecography 40, 461–477. doi: 10.1111/ecog.02070
Nakamura, A., Kitching, R. L., Cao, M., Creedy, T. J., Fayle, T. M., Freiberg, M., et al. (2017). Forests and their canopies: achievements and horizons in canopy science. Trends Ecol. Evol. 32, 438–451. doi: 10.1016/j.tree.2017.02.020
Oberle, B., Grace, J. B., and Chase, J. M. (2009). Beneath the veil: plant growth form influences the strength of species richness–productivity relationships in forests. Glob. Ecol. Biogeogr. 18, 416–425. doi: 10.1111/j.1466-8238.2009.00457.x
Onaindia, M., Dominguez, I., Albizu, I., Garbisu, C., and Amezaga, I. (2004). Vegetation diversity and vertical structure as indicators of forest disturbance. For. Ecol. Manag. 195, 341–354. doi: 10.1371/journal.pone.0164917
Peterson, D. W., and Reich, P. B. (2008). Fire frequency and tree canopy structure influence plant species diversity in a forest-grassland ecotone. Plant Ecol. 194, 5–16. doi: 10.1007/s11258-007-9270-4
Purschke, O., Schmid, B. C., Sykes, M. T., Poschlod, P., Michalski, S. G., Durka, W., et al. (2013). Contrasting changes in taxonomic, phylogenetic and functional diversity during a long-term succession: insights into assembly processes. J. Ecol. 101, 857–866. doi: 10.1111/1365-2745.12098
Reu, J. C., Catano, C. P., Spasojevic, M. J., and Myers, J. A. (2022). Beta diversity as a driver of forest biomass across spatial scales. Ecology 103:e3774. doi: 10.1002/ecy.3774
Sercu, B. K., Baeten, L., van Coillie, F., Martel, A., Lens, L., Verheyen, K., et al. (2017). How tree species identity and diversity affect light transmittance to the understory in mature temperate forests. Ecol. Evol. 7, 10861–10870. doi: 10.1002/ece3.3528
Shi, W., Wang, Y. Q., Xiang, W. S., Li, X. K., and Cao, K. F. (2021). Environmental filtering and dispersal limitation jointly shaped the taxonomic and phylogenetic beta diversity of natural forests in southern China. Ecol. Evol. 11, 8783–8794. doi: 10.1002/ece3.7711
Solarik, K. A., Cazelles, K., Messier, C., Bergeron, Y., and Gravel, D. (2020). Priority effects will impede range shifts of temperate tree species into the boreal forest. J. Ecol. 108, 1155–1173. doi: 10.1111/1365-2745.13311
Tatsumi, S., Iritani, R., and Cadotte, M. W. (2021). Temporal changes in spatial variation: partitioning the extinction and colonisation components of beta diversity. Ecol. Lett. 24, 1063–1072. doi: 10.1111/ele.13720
Tian, K., Chai, P., Wang, Y., Chen, L., Qian, H., Chen, S., et al. (2023). Species diversity pattern and its drivers of the understory herbaceous plants in a Chinese subtropical forest. Front. Ecol. Evol. 10:1113742. doi: 10.3389/fevo.2022.1113742
Tilman, D., and El Haddi, A. (1992). Drought and biodiversity in grasslands. Oecologia 89, 257–264. doi: 10.1007/BF00317226
Wang, Y., Bao, Y., Yu, M., Xu, G., and Ding, P. (2010). Biodiversity research: Nestedness for different reasons: the distributions of birds, lizards and small mammals on islands of an inundated lake. Divers. Distrib. 16, 862–873. doi: 10.1111/j.1472-4642.2010.00682.x
Wang, Y., Cadotte, M. W., Chen, J., Mi, X., Ren, H., Liu, X., et al. (2020a). Neighborhood interactions on seedling survival were greatly altered following an extreme winter storm. For. Ecol. Manag. 461:117940. doi: 10.1016/j.foreco.2020.117940
Wang, Y., Yu, J., Xiao, L., Zhong, Z., Wang, Q., and Wang, W. (2020b). Dominant species abundance, vertical structure and plant diversity response to nature forest protection in Northeastern China: conservation effects and implications. Forests 11:295. doi: 10.3390/f11030295
Wang, Y., Tian, L., Zhong, L., Yang, H., Jin, H., Liu, C., et al. (2015). Community structure and species diversity of schima superba-Pinus massoniana communities in dongbaishan nature reserve. J. Zhejiang Univer. 42, 38–46.
Whittaker, R. H. (1960). Vegetation of the siskiyou mountains, oregon and California. Ecol. Monogr. 30, 279–338. doi: 10.1002/ecy.3764
Yan, M., Liu, Z., Subei, M., Liang, L., and Xi, W. (2022). The complex impacts of unprecedented drought on forest tree mortality: a case study of dead trees in east Texas, USA. Acta Ecologica Sinica 42, 1034–1046. doi: 10.5846/stxb202101150152
Yang, Y., Ji, Y., Wang, Y., Xie, J., Jin, Y., Mi, X., et al. (2022). Extreme winter storms have variable effects on the population dynamics of canopy dominant species in an old-growth subtropical forest. Forests. 13:1634. doi: 10.3390/f13101634
Yuan, Z., Gazol, A., Wang, X., Xing, D., Lin, F., Bai, X., et al. (2012). What happens below the canopy? direct and indirect influences of the dominant species on forest vertical layers. Oikos 121, 1145–1153. doi: 10.1111/j.1600-0706.2011.19757.x
Keywords: vertical structure, phylogenetic, taxonomic, temporal beta diversity, mixed broadleaf-conifer forest, Dongbaishan forest plot
Citation: Chai P, Xie J, Yang L, Zheng R, Bian Y, Fu J, Wang Y and Chen J (2023) Community vertical stratification drives temporal taxonomic and phylogenetic beta diversity in a mixed broadleaf-conifer forest. Front. Ecol. Evol. 11:1170197. doi: 10.3389/fevo.2023.1170197
Received: 20 February 2023; Accepted: 14 March 2023;
Published: 11 April 2023.
Edited by:
Xiang Liu, Lanzhou University, ChinaCopyright © 2023 Chai, Xie, Yang, Zheng, Bian, Fu, Wang and Chen. This is an open-access article distributed under the terms of the Creative Commons Attribution License (CC BY). The use, distribution or reproduction in other forums is permitted, provided the original author(s) and the copyright owner(s) are credited and that the original publication in this journal is cited, in accordance with accepted academic practice. No use, distribution or reproduction is permitted which does not comply with these terms.
*Correspondence: Yunquan Wang, eXF3YW5nQHZpcC4xMjYuY29t; orcid.org/0000-0001-6022-2340; Jianhua Chen, c2t5NzhAempudS5jbg==
Disclaimer: All claims expressed in this article are solely those of the authors and do not necessarily represent those of their affiliated organizations, or those of the publisher, the editors and the reviewers. Any product that may be evaluated in this article or claim that may be made by its manufacturer is not guaranteed or endorsed by the publisher.
Research integrity at Frontiers
Learn more about the work of our research integrity team to safeguard the quality of each article we publish.