 Zhiru Zhang
 Huawei Wan2*
 Shilei Peng
94% of researchers rate our articles as excellent or good
Learn more about the work of our research integrity team to safeguard the quality of each article we publish.
Find out more
ORIGINAL RESEARCH article
Front. Ecol. Evol. , 28 March 2023
Sec. Environmental Informatics and Remote Sensing
Volume 11 - 2023 | https://doi.org/10.3389/fevo.2023.1168313
This article is part of the Research Topic Remote Sensing Advances in Biodiversity and Ecosystem Functioning Research View all 12 articles
Exploring the driving factors of changing ecosystem services is critical for supply capacity maintaining and ecological management zoning. Xinjiang of Northwest China, is considered one of the most fragile ecological environment areas. However, studies on how ecosystem services’ driving forces respond to the environmental conditions of Xinjiang are still insufficient, especially in sub–regions with considerable spatial heterogeneity. Based on 106 counties across Xinjiang, we employed models of the Integrated Valuation of Ecosystem Services and Tradeoffs (InVEST) and Revised Wind Erosion Equation (RWEQ) to quantify four essential ecosystem services (carbon storage, habitat quality, and sand fixation and water yield). Then, we investigated the spatial distribution of four ecosystem services and drivers at the county scale in 2020 by using multi–scale geographically weighted regression (MGWR). The results showed that the spatial distribution of ecosystem services is higher in the north and lower in the south, and hotspots and high–value ecosystem services areas were consistent. Precipitation, temperature, and fractional vegetation cover were the dominant factors influencing the four ecosystem services. Therefore, regulating climate and increasing vegetation will maximize the improvement of regional ecosystem services in Xinjiang. Significant differences exist in the counties of the type, intensity, and direction of ecosystem services drivers. The correlation between carbon storage, habitat quality and fractional vegetation cover was more robust stronger in the south. Water yield was more closely related to fractional vegetation cover in southern Xinjiang. Under different ecological and social conditions, the impact of driving forces on ecosystem services showed different changing trends. Three suggestions for improving ecosystem services management were proposed based on our results. The comparative analysis of the driving factors of county ecosystem services in this study will help to formulate differentiated ecological protection policies and promote a sustainable supply of ecosystem services in Xinjiang. In the future, it is necessary to strengthen the long-term monitoring and evaluation of ecosystem services and the research on the interaction of multiple drivers.
Ecosystem services are the benefits humans obtain directly or indirectly from an ecosystem. They serve as a link between humans and nature and have been the focus of considerable research (Costanza et al., 1997). However, the over–exploitation of land resources under climate warming and changing precipitation regimes has led to extensive global species extinctions. Ecosystems and sustainable human development are facing severe threats, and the supply capacity of ecosystem services is gradually declining (Jordan et al., 2005; Dobson et al., 2006). Therefore, it is urgent to support the sustainable use of ecological resources and determine how to use natural capital sustainably. The county scale plays a connecting role in China’s ecological protection and restoration. Ecological and socio–economic driving factors affect ecological restoration policies and their implementation (Ding et al., 2022). Therefore, it is essential for guiding ecosystem services management decisions in the spatial distribution, hotspots, and driving factors of ecosystem services that have been examined at the county scale.
Quantifying ecosystem services, identifying ecosystem service hotspots, and investing limited resources in places with the greatest need for protection will help maximize the benefits of these resources. Ecosystem service “hotspots” (“coldspots”) have gradually been more commonly used in works on ecosystem services mapping to determine priorities for regional protection (Zhang L. et al., 2015; Wu et al., 2016; Li et al., 2017; Gao et al., 2022). The Gi * statistical method is the most widely used. It can be used to identify spatial clustering of ecosystem services which show strong spatial correlations. This method identify hotspots of ecosystem services and determine which areas multiple ecosystem services are prioritized (Li and Zhang, 2021). The hotspots and coldspots for soil protection are also determined to support targeted ecosystem policy formulation (Li et al., 2017). Random areas are divided according to coldspots and hotspots of ecosystem services to mitigate the adverse impacts on ecosystem services (Han et al., 2020).
Ecosystem services are comprehensively affected by climatical and social factors. Several studies have explored the relationship between ecosystem services and driving factors at global and regional scales (Su et al., 2012; Yang et al., 2021; Rong et al., 2022). However, due to differences in geographical and socio–ecological factors, the response of ecosystem services to driving factors has spatial heterogeneity in direction and intensity. Therefore, the traditional global analysis (generalized linear model and ordinary least squares) cannot reasonably describe the nonstationary relationship in the ecosystem process. Multi–scale geographically weighted regression (MGWR) not only considers spatial non-stationarity, but also considers the scale differences of different variables (Fotheringham et al., 2019), which offers a new idea for the process analysis. For example, Hu et al. (2021) used the MGWR model to investigate the relationship between ecosystem services and drivers in Shanxi Province, which showed pronounced spatial heterogeneity in the nature and intensity of their correlation. Tang et al. (2016) and Luo et al. (2020) proposed differentiated ecological protection policies through quantitative measurement and comparative analysis of driving factors in different regions to promote the ecosystem service value. Therefore, we implement the MGWR model in this study to explore the spatial heterogeneity of ecosystem service drivers. Expected results could clarify the driving factors and mechanisms of ecosystem services and serve as a benchmark for how ecosystem service protection policies in various regions should be measured. The patterns and processes of ecosystem services show different characteristics at different scales, and the influence of scale is the focus of current research. The drivers of ecosystem services are usually related to specific scales, that is, the drivers of ecosystem services may change at different scales. Multiple driving factors of ecosystem services have been evaluated at different scales in macro–regions such as countries and urban belts, and micro–regions such as provinces and cities (Lyu et al., 2019; Chen et al., 2020; Qiu et al., 2020). The relationship between ecosystem services has also varied at different kilometer scales, and may even be the opposite (Liu et al., 2017; Sun et al., 2022). At the county level, the impact of driving forces on ecosystem services significantly differs in the east and west of Sichuan Province (Huang et al., 2022). Significant spatial heterogeneity affects a range of influencing factors in the Three Gorges Reservoir Area on the degree of coupling of ecosystem services and economic development (Li F. et al., 2022). Grid–scale can describe the spatial distribution of ecosystems in more detail, but the county scale is more conducive to ecological management zoning and regulation (Shen and Li, 2022). Therefore, this study studied the spatial distribution, hotspots and driving factors of ecosystem services at the county level.
Xinjiang Autonomous Region has a variety of ecosystems, which can provide various ecosystem services and species habitats. Xinjiang is also a typical arid and fragile ecosystem region, whereas vulnerable to human activities. It is enormously challenging to recover in a short time once it has been degraded. In recent years, population increase and infrastructure construction have accelerated land transformation and environmental degradation. This has resulted in declining in ecosystem services in the entire Xinjiang region. There has been an increase in soil erosion intensity, and a decline in the amount of sand fixation in the north (Zhang W. et al., 2015; Sun et al., 2021; Niu et al., 2022). Therefore, it is an ideal area to study the heterogeneity of ecosystem services and drivers. For example, research shows that the relationship between net primary productivity, soil and water conservation and water yield services in Xinjiang has changed in time and space on the grid scale, but the driving factors have not been analyzed (Wang et al., 2020). There is an essential interaction between urbanization and the continuous expansion of agricultural activities caused by population growth and ecosystem services (Zhang et al., 2020; Shi et al., 2021). Li et al. (2019) showed that the types and intensity of driving factors of ecosystem services in Xinjiang differed between southern and northern Xinjiang. Most studies on ecosystem services in Xinjiang have been undertaken at the grid scale (Wei et al., 2018; Yushanjiang et al., 2018; Lu et al., 2022). Therefore, given the high heterogeneity of Xinjiang’s ecosystem, it is significant to study the ecosystem, and its driving factors at the county level for zoning management.
This study aimed to analyze the spatial distribution of ecosystem services, and the spatial heterogeneity of ecosystem services drivers at the county level in Xinjiang. Four typical ecosystem services, namely, carbon storage, habitat quality, sand fixation and water yield were quantified using InVEST and RWEQ model. Redundancy analysis (RDA) was then used to explore the relationship between ecosystem services and climate, vegetation, the proportion of urban area, and other multi–factors. A multi–scale geographically weighted regression (MGWR) model was used to express the spatial heterogeneity of driving factors to provide a reference for the sustainable development of ecosystem services and ecosystem management in Xinjiang.
Xinjiang (34° 22′–49° 33′ N, 73° 32′–96° 21′ E) is located in the hinterland of Eurasia near the northwest border of China, with a total area of approximately 166 × 104 km2, including 106 counties (cities and districts). This study’s counties, cities and districts are all represented by counties. The land uses comprise grassland (30%), cultivated land, and the Gobi Desert (Figure 1). The landforms are relatively complex and are characterized by the distribution of “three mountains and two basins.” The specific geographical location and the interaction of various complex geographical environments form various ecosystem types, supporting many rare animal and plant species, such as Populus canescens, Ferula sinkiangensis, and Testudo horsfieldii, etc., (Li et al., 2011). Xinjiang has an arid and semi–arid climate zone, with an annual precipitation of approximately 145 mm. The fractional vegetation cover is generally low, land desertification is severe, and the ecological environment is highly fragile (Liu et al., 2018; Bi et al., 2021).
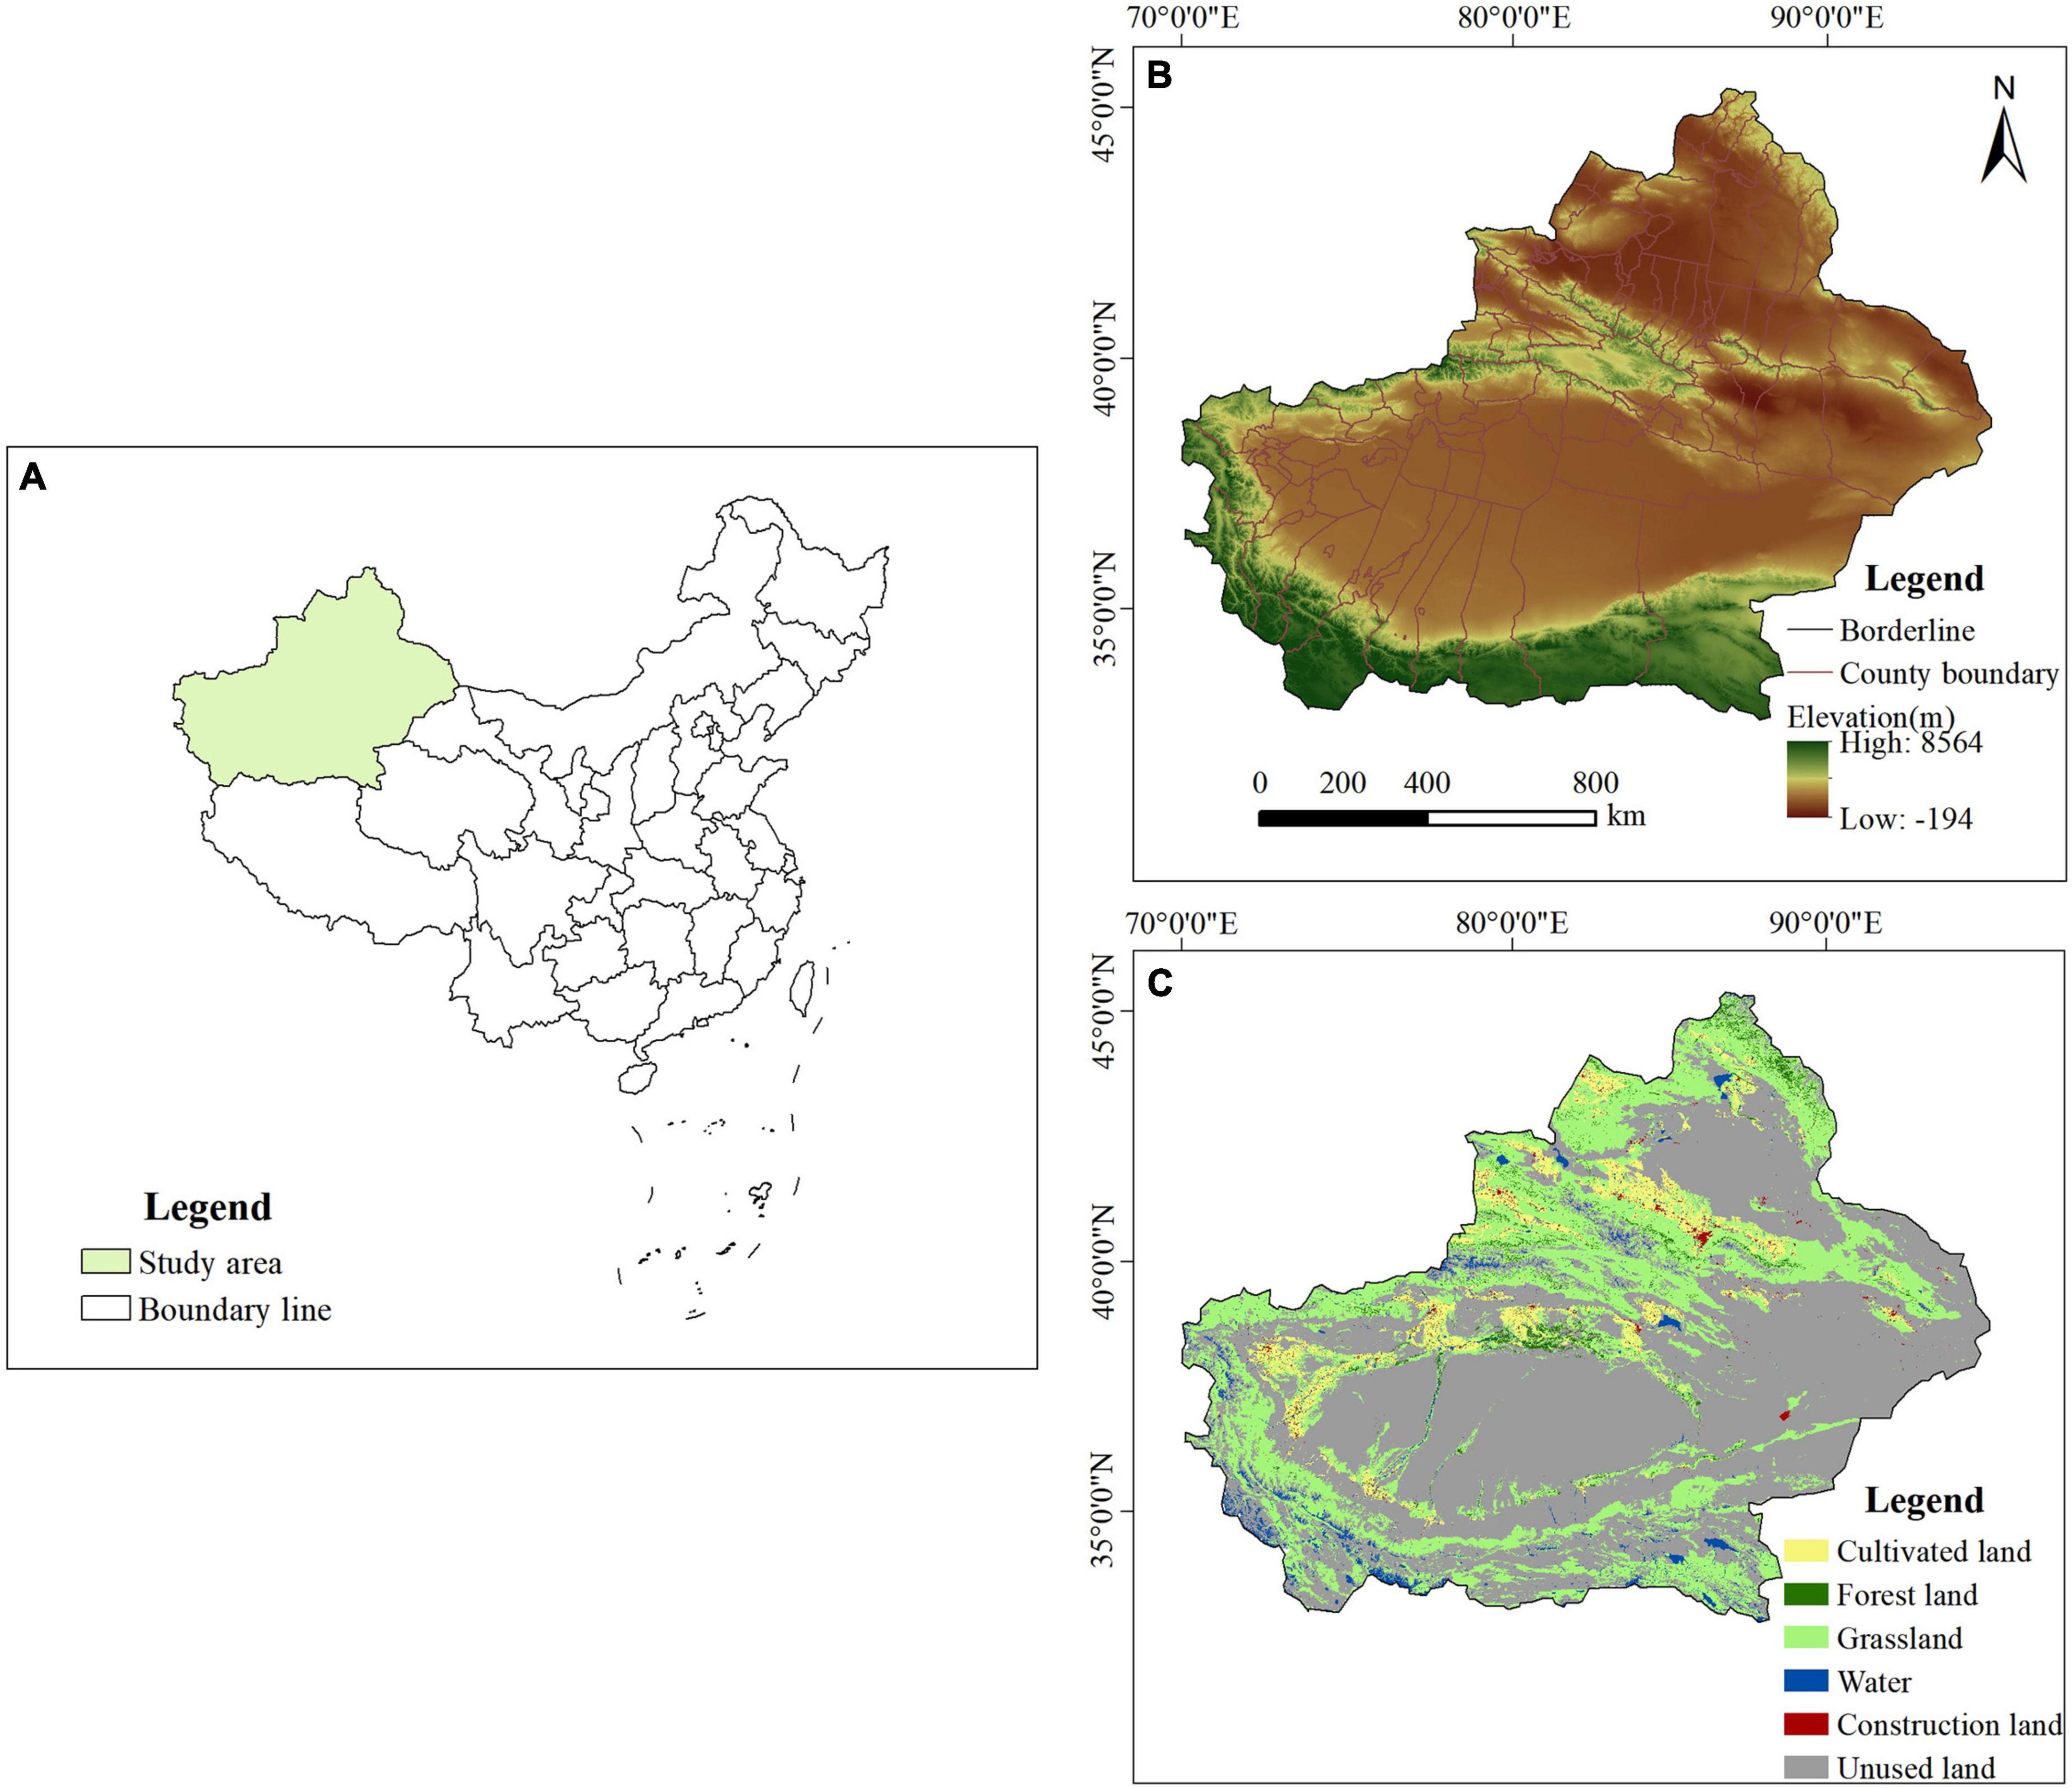
Figure 1. Location, elevation, and land use type of the study area. (A) Xinjiang location. (B) Elevation. (C) Land use type.
The research data included land use type data, meteorological data, landform data, and population spatial distribution network datasets (Table 1).
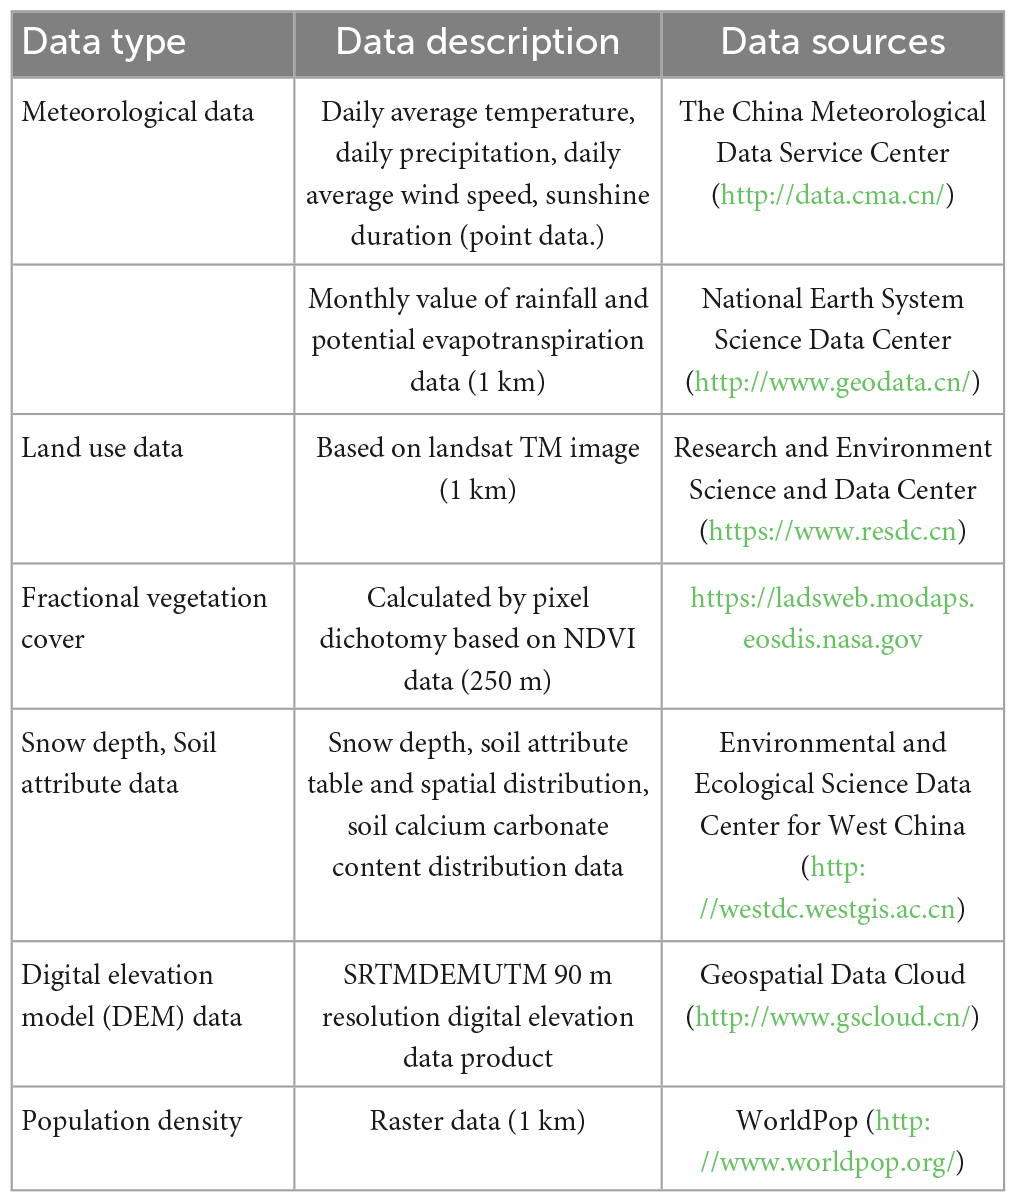
Table 1. Study data sources.
The station data of wind speed, precipitation, temperature and sunshine hours are interpolated by the ANUSPLIN method based on thin slice spline theory, with a spatial resolution of 1 km. The vegetation coverage data is derived from MODIS image data (MOD13Q1). First, the NDVI annual data is calculated by resampling, filtering and maximum synthesis methods, and then the maximum annual vegetation coverage data in Xinjiang is calculated according to the pixel dichotomy model theory, with a spatial resolution of 1 km. The percentage of the urban area is calculated by extracting the construction land in each county’s land use data and then calculating the percentage of construction land in the whole county.
A series of ecological problems have emerged in Xinjiang, including water shortages, soil erosion, and desertification (Zhang W. et al., 2015; Chen et al., 2016). Therefore, according to the classification of ecosystem services proposed by the Millennium Ecosystem Assessment (Reid et al., 2005), four important ecosystem services were selected and combined with the current ecosystem and ecological pressure in the study area. This included carbon storage, habitat quality, sand fixation, and water yield. Carbon storage is vital in climate regulation (Xu et al., 2019). Diversified ecosystems provide habitats for organisms (Liu and Xu, 2020). Xinjiang has a large area of sand and bare land, and sand erosion by wind is severe (Gong et al., 2014). The lack of water resources and the uneven spatial and temporal distributions are the main influencing factors restricting economic development in Xinjiang (Li F. et al., 2022). The ecosystem services was quantified at a 1 km2 scale in 2020, and then the mean values of ecosystem service indicators at the county scales was calculated. The county scale was chosen because it is more conducive to ecological management zoning and regulation.
Carbon storage in ecosystem services plays a vital role in climate regulation and is an essential indicator for measuring the function of regional ecosystems. Strengthening the carbon fixation function of terrestrial ecosystems has become one of the primary needs in mitigating global climate change (Hu et al., 2018). The carbon pool (Ctotal) includes the aboveground biomass (Cabove), underground biomass (Cbelow), dead organic carbon (Cdead), and soil carbon pool (Csoil). The four carbon reserve types were added to the InVEST model to determine the carbon reserves in the area. The calculation formula is as follows:
Habitat quality refers to the ability of ecosystems to provide living conditions suitable for individuals and populations based on the availability of living resources, biological reproduction, and existing quantity. It can reflect regional biodiversity and is closely related to regional land use types (Fellman et al., 2015; Sallustio et al., 2017). The habitat quality module of the InVEST model is based on the relationship between land use and stress factors. It considers the sensitivity of different habitat types to stress factors and the threat intensity from these stress factors. The degree of habitat degradation is calculated and then combined with the habitat adaptability of different land use types to score the habitat quality to generate a habitat quality grade map. The specific calculation process is as follows:
Where Dxj is the habitat degradation level of pixel x in habitat type j; r refers to a single stress factor; y is the pixel of stress factor r; Wr is the stress factor weight; ry is the number of stress factors in each grid of the study area; βx is the threat level of habitat pixel; Sjr is the sensitivity of habitat type j to stress factors and irxy is the threat level of stress factor in pixel y to habitat pixel x.
Where Qxj is the habitat quality level of pixel x in habitat type j; Hj is the habitat adaptability of habitat type j; z is a constant, usually 2.5; k is the semi–saturation constant, and the default value is 0.5.
Sand fixation is an important ecosystem function. Sand fixation can reduce soil erosion caused by wind erosion through its structure and processes. This soil conservation and wind erosion inhibition service is the sand fixation service. This is the most important protective service provided by the ecosystem in arid and semi–arid areas. The revised wind erosion equation (RWEQ) was used to estimate the sand fixation at the plot scale, taking into account the climate conditions, surface soil roughness, vegetation conditions, soil erodibility, and soil crust:
Where SR is the sediment fixation amount (t ⋅ hm–2), SLS is the potential soil wind erosion under the condition of potential bare soil, t ⋅ hm–2; SL is the actual soil wind erosion under fractional vegetation cover, t ⋅ hm–2; Qx is the sand flux at x (kg⋅ m–1); x is the length of the plot; Qmax is the maximum transfer amount, kg/m; s is the length of the key plot (m); WF is the climate factor, which is calculated from wind speed, soil moisture factor and snow cover factor; K′’ is the surface roughness factor; EF is the erodible soil factor, calculated according to Fryrear et al. (2000) equation; SCF is the soil crust factor, and COG is the fractional vegetation cover factor, which is calculated by vegetation coverage.
The water yield service is one of the essential ecosystem services in arid and semi–arid areas. It is crucial to agriculture, industry, hydropower generation, and entertainment activities. It is also an important link in achieving sustainable development of ecosystem services. The water yield service was predominantly based on the water production module in the InVEST model, that is, the water yield per unit area at a specific time. According to the water balance principle, the regional water supply is the precipitation per unit area minus evapotranspiration. The main formula for calculating the water yield under each grid pixel is:
Where Yx,j is the water yield of pixel x of land use type j (mm); Px is the annual precipitation on different pixels x (mm); AETx,j is the annual actual evapotranspiration of pixel x of land cover type j (mm); ωx is the ratio of annual vegetation available water and precipitation; Rxj is the dry coefficient; and AWCx is the effective moisture content of vegetation of pixel x (mm), and Z is Zhang’s coefficient.
Spatial hotspot analysis can identify high–value spatial clusters of specific phenomena, limited direct resources to places with greater need, and achieve more effective and strategic resource allocation. This technique has been widely used in the field of ecological geography. In this study, the county was taken as the smallest unit, using the “Zone Statistics as Table” in ArcGIS 10.8 to calculate the average value of ecosystem services and drivers in each county. The Getis Ord Gi * method in the ArcGIS 10.8 hotspot analysis tool was used to identify the hotspot area with solid spatial correlation and the coldspot area with weak spatial correlation of ecosystem services. The Z score is statistically significant in Getis Ord Gi *. The larger the Z–score, the higher the cluster value (hotspots). The smaller the Z–score, the lower the cluster value (coldspots) (Benjamini and Yekutieli, 2001).
Factors affecting ecosystem services mainly include two types: ecological factors and socio–economic factors (Hu et al., 2022; Huang et al., 2022; Lu et al., 2022; Zhuang et al., 2022). The ecological factors selected in this study include precipitation (PRE), temperature (TEM), fractional vegetation cover (FVC), slope (SL), and digital elevation model (DEM). Social factors include a percentage of urban area (PU) and population density (PD) (Peng et al., 2017). RDA was used to detect the relationship between multiple response variables, such as ecosystem services and several explanatory variables such as drivers. This study used RDA to analyze the multicollinearity relationship between variables and perform a collinearity test in SPSS. When 0 < VIF (Variance inflation factor) < 10, it indicates that there is no collinearity for the driver (Sheng et al., 2017). Canoco software (version 5.0) was used to explore the correlation between ecosystem services and impact factors using RDA.
Geographically weighted regression (GWR) establishes the regression relationship between independent and dependent variables at the local scale, effectively avoiding errors caused by spatial differences of variables. The expression is as follows:
Where y is the dependent variable (including different types of ecosystem services); (ui,vi) is the position of the ith sample; βj(ui,vi) is the intercept; xij is the independent variable, including altitude, precipitation and other factors; βj(ui,vi) represents the regression coefficient of the ith sample for the jth driving factor, and εi is the error term.
Multi–scale geographically weighted regression (Oshan et al., 2019) is an improved version of GWR, which considers spatial multi–scale heterogeneity and reflects these differences in ecosystem services. The MGWR model expression is as follows:
Where βbwj in bwj is the broadband used to calibrate the jth conditional relationship. MGWR allows local regression coefficients of dependent and independent variables to be estimated at different spatial scales.
In this study, the MGWR and GWR models used the Gaussian kernel function and golden section broadband selection routine for calibration. The OLS, GWR, and MGWR parameters were then compared. The higher R2 indicates a better degree of the fitting. All the model calibrations were performed using MGWR2.2 software.
Four ecosystem services, namely, carbon storage, habitat quality, sand fixation and water yield were significantly different across the entire Xinjiang region (Figure 2), and they clustered in space (Moran’s I > 0.43, p < 0.001). Due to Xinjiang’s geographical location, the spatial heterogeneity of water and heat conditions was relatively high. As a result, the spatial distribution of various ecosystem services was quite different. Carbon storage, habitat quality, and water yield presented similar spatial patterns. High–value areas were predominantly distributed in the Tianshan Mountains and the eastern part of the Kunlun Mountains, as well as the Ili Kazakh Autonomous Prefecture, Altay City, Burqin County, and Habahe County near the Altay Mountains. Important areas of forest land and grassland were distributed in these areas. At the county scale, the maximum carbon storage, sand fixation and water yield per unit area are 116.4 t/hm2, 385.2 t/hm2, and 291.17 mm. The highest habitat quality in Xinyuan County of Ili Kazak Autonomous Prefecture is 0.78. Among them, there was a significant difference in water yield between the north and the south. High–value areas were mainly distributed in the north of Xinjiang. High–value water source protection areas were found in Altay and Tacheng. In the south of Xinjiang, the water yield of 30 counties is lower than 0. The high–value areas for sand fixation had a dispersed distribution and were predominantly in the east of the Taklimakan Desert, around the Altun Mountains, and near the Junggar Basin. The altitude was 500–1,000 m, the wind speed was relatively low, and the service level for sand fixation on the construction land was high, possibly due to buildings blocking some of the wind. In general, the spatial distribution of ecosystem services was higher in the north and lower in the south.
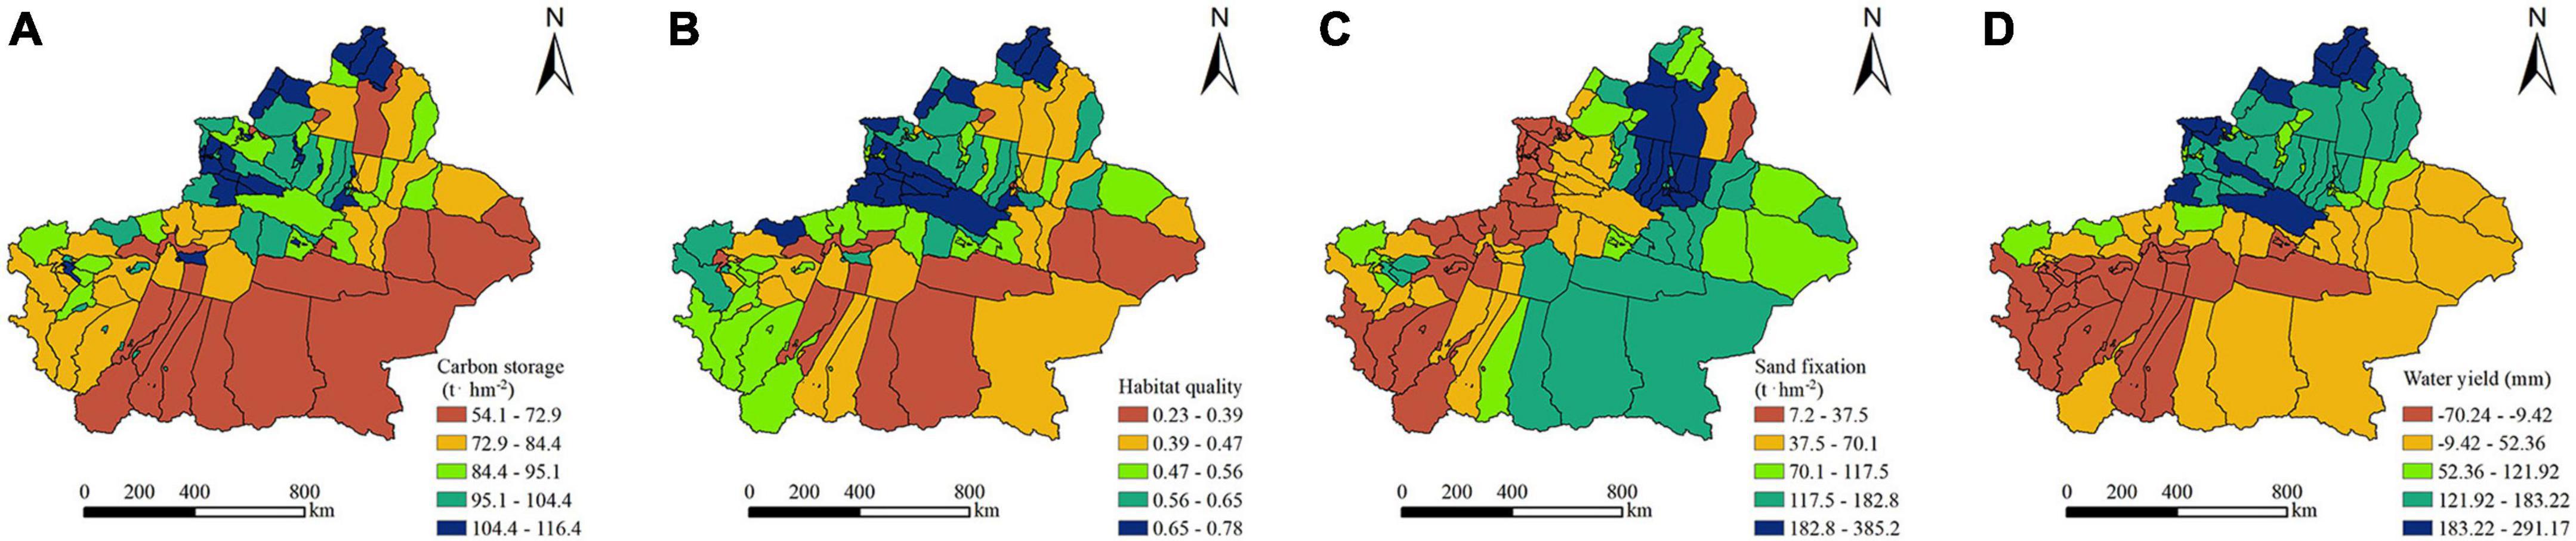
Figure 2. Spatial distribution of ecosystem services. (A–D) Carbon storage, Habitat quality, Sand fixation, and Water yield.
Regarding individual ecosystem services, the spatial pattern of hotspots and coldspots of ecosystem services showed pronounced spatial heterogeneity (Figure 3). The hotspots were predominantly concentrated in northern Xinjiang. Compared with the other three services, hotspots for water yield services were the largest, with 49 counties accounting for 46.23% of the total number in Xinjiang. They were mainly distributed in the Altay region, a national key ecological functional area for water conservation. The hotspots for carbon storage and habitat quality were highly coincident, with 35 and 31 counties, respectively, mainly distributed in Ili Kazakh Autonomous Prefecture, Bortala Mongolian Autonomous Prefecture, and Tacheng region in the west of the Tianshan Mountains. The hotspot area is mainly forest with strong carbon storage capacity, while the coldspot area is mainly unused land, cultivated land and other land use types with weak carbon storage capacity. As a whole, the level of habitat quality in Xinjiang is low. Due to urbanization construction, the surface vegetation is destroyed and the habitat quality is degraded. There are 39 counties serving as hotspots for sand fixation, and 48 counties serving as coldspots. Owing to the vast expanse of desert, sand fixation capacity in Xinjiang is weak, and the number of cold spots is larger than that of hotspots, mainly located in the northern part of Xinjiang.
Figure 3. Spatial distribution of ecosystem service hotspots and coldspots. The statistical significance is shown as follows: (1) *** refers to the 99% confidence level; (2) ** refers to the 95% confidence level, and (3) * represents the 90% confidence level. (A–D) Carbon storage, Habitat quality, Sand fixation, and Water yield. (E) Legend.
Four counties, namely, Kuitun City, Huyanghe City, the Duzi Mountain Area and Karamay City provided four ecosystem service types. At the same time, there are 26 counties with three kinds of ecosystem service hotspots and 21 counties with two kinds of ecosystem service hotspots. These areas can be classified and managed according to the actual situation, prioritizing protecting cold spot services (Figure 4). In general, the supply capacity of ecosystem services in these areas is relatively low due to the ecological degradation in most of northern Xinjiang. In the future, we should not only maintain the ecosystem services of hotspots, but also take measures to improve the ecosystem services of coldspots.
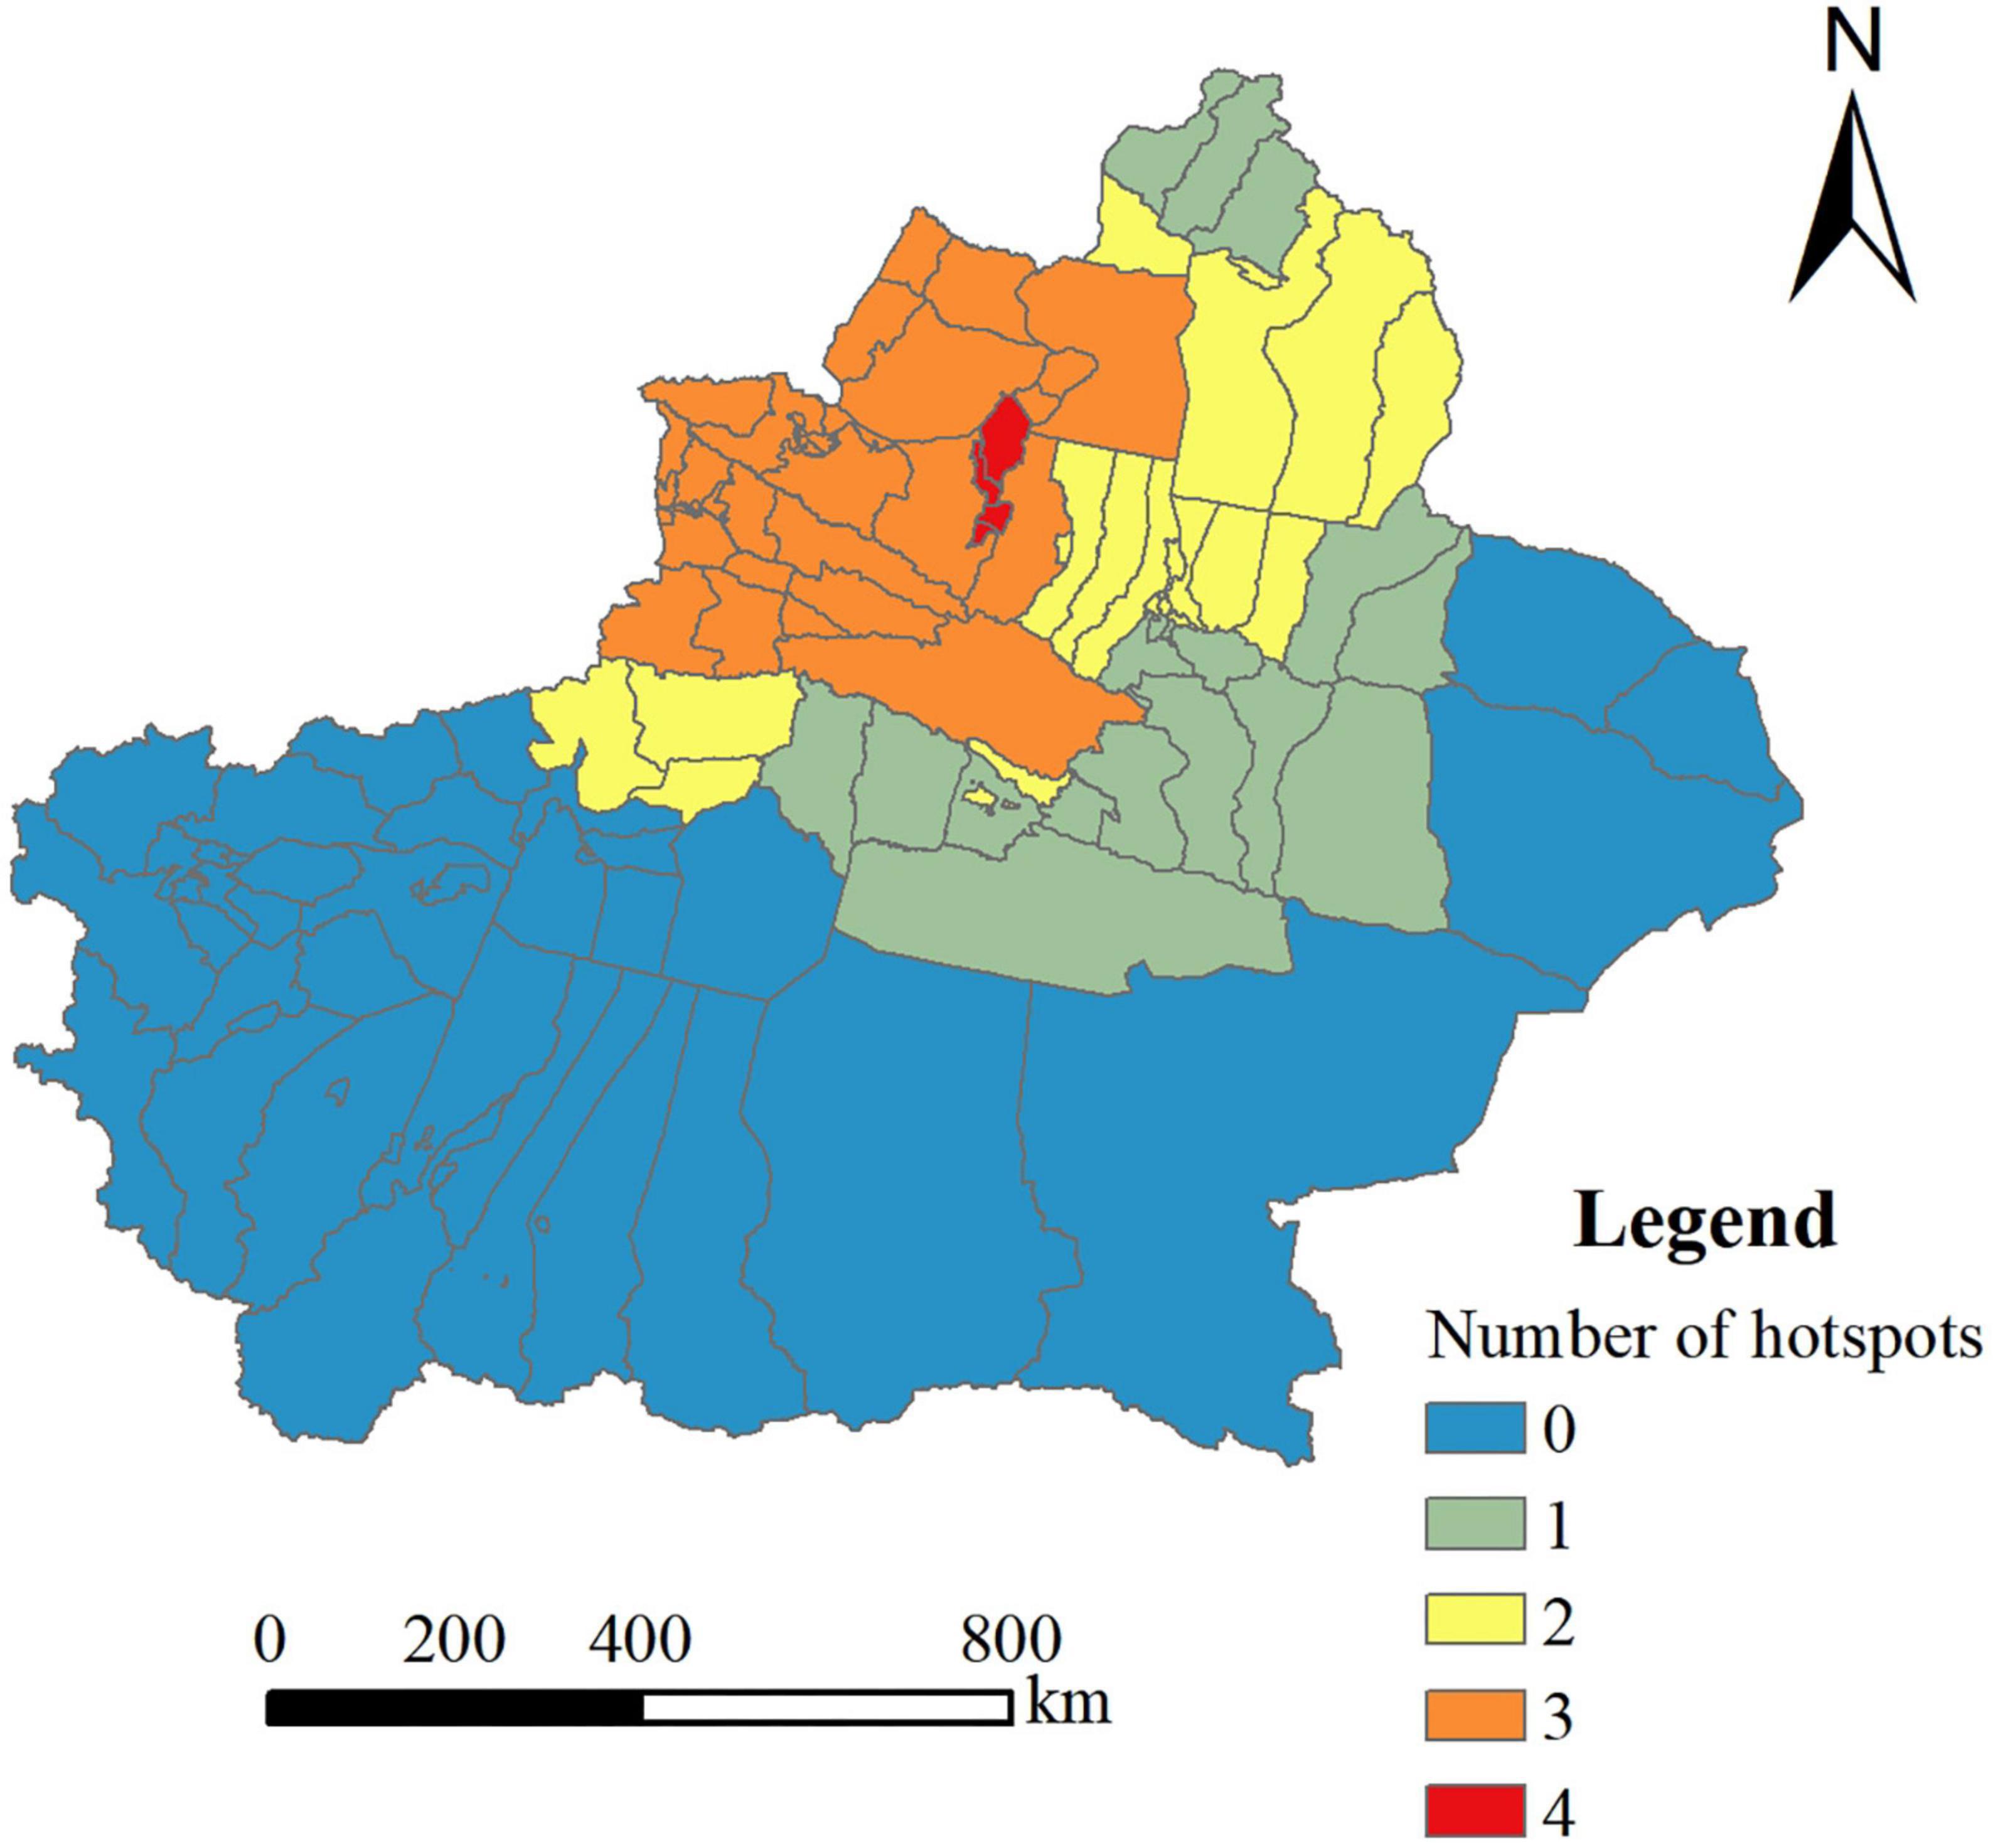
Figure 4. Concurrence of the four ecosystem service hotspots.
We used the variance expansion factor for diagnosis. As shown in Table 2, VIF < 10 indicates no multicollinearity between the seven drives. Figure 5 showed that ecosystem services were significantly correlated with the precipitation, fractional vegetation cover, the percentage of urban area, DEM, temperature (p < 0.01), and population density (p < 0.05). Ecological factors predominantly determined the first RDA axis explaining 49.01% of the variance. Social factors and altitude mainly determined the second axis explaining 14.87% of the variance. Precipitation and fractional vegetation cover contributed 61.7 and 17.0% to ecosystem services, respectively, which was considered decisive. This showed that precipitation and fractional vegetation cover were the main limiting factors for ecosystem services in Xinjiang. The percentage of urban area was also an important factor with an 8.7% contribution, indicating that urbanization considerably affected ecosystem service. Precipitation, fractional vegetation cover, and slope were positively correlated with water yield, carbon storage, and habitat quality, and were negatively correlated with sand fixation. Temperature, population density, and the percentage of urban area were positively correlated with sand fixation. However, these factors had little impact on ecosystem services. In general, the contribution of ecological factors was substantially higher than social factors, which indicated that precipitation, fractional vegetation cover, and terrain played an important role in the spatial distribution of ecosystem services in Xinjiang.

Table 2. Collinearity test.
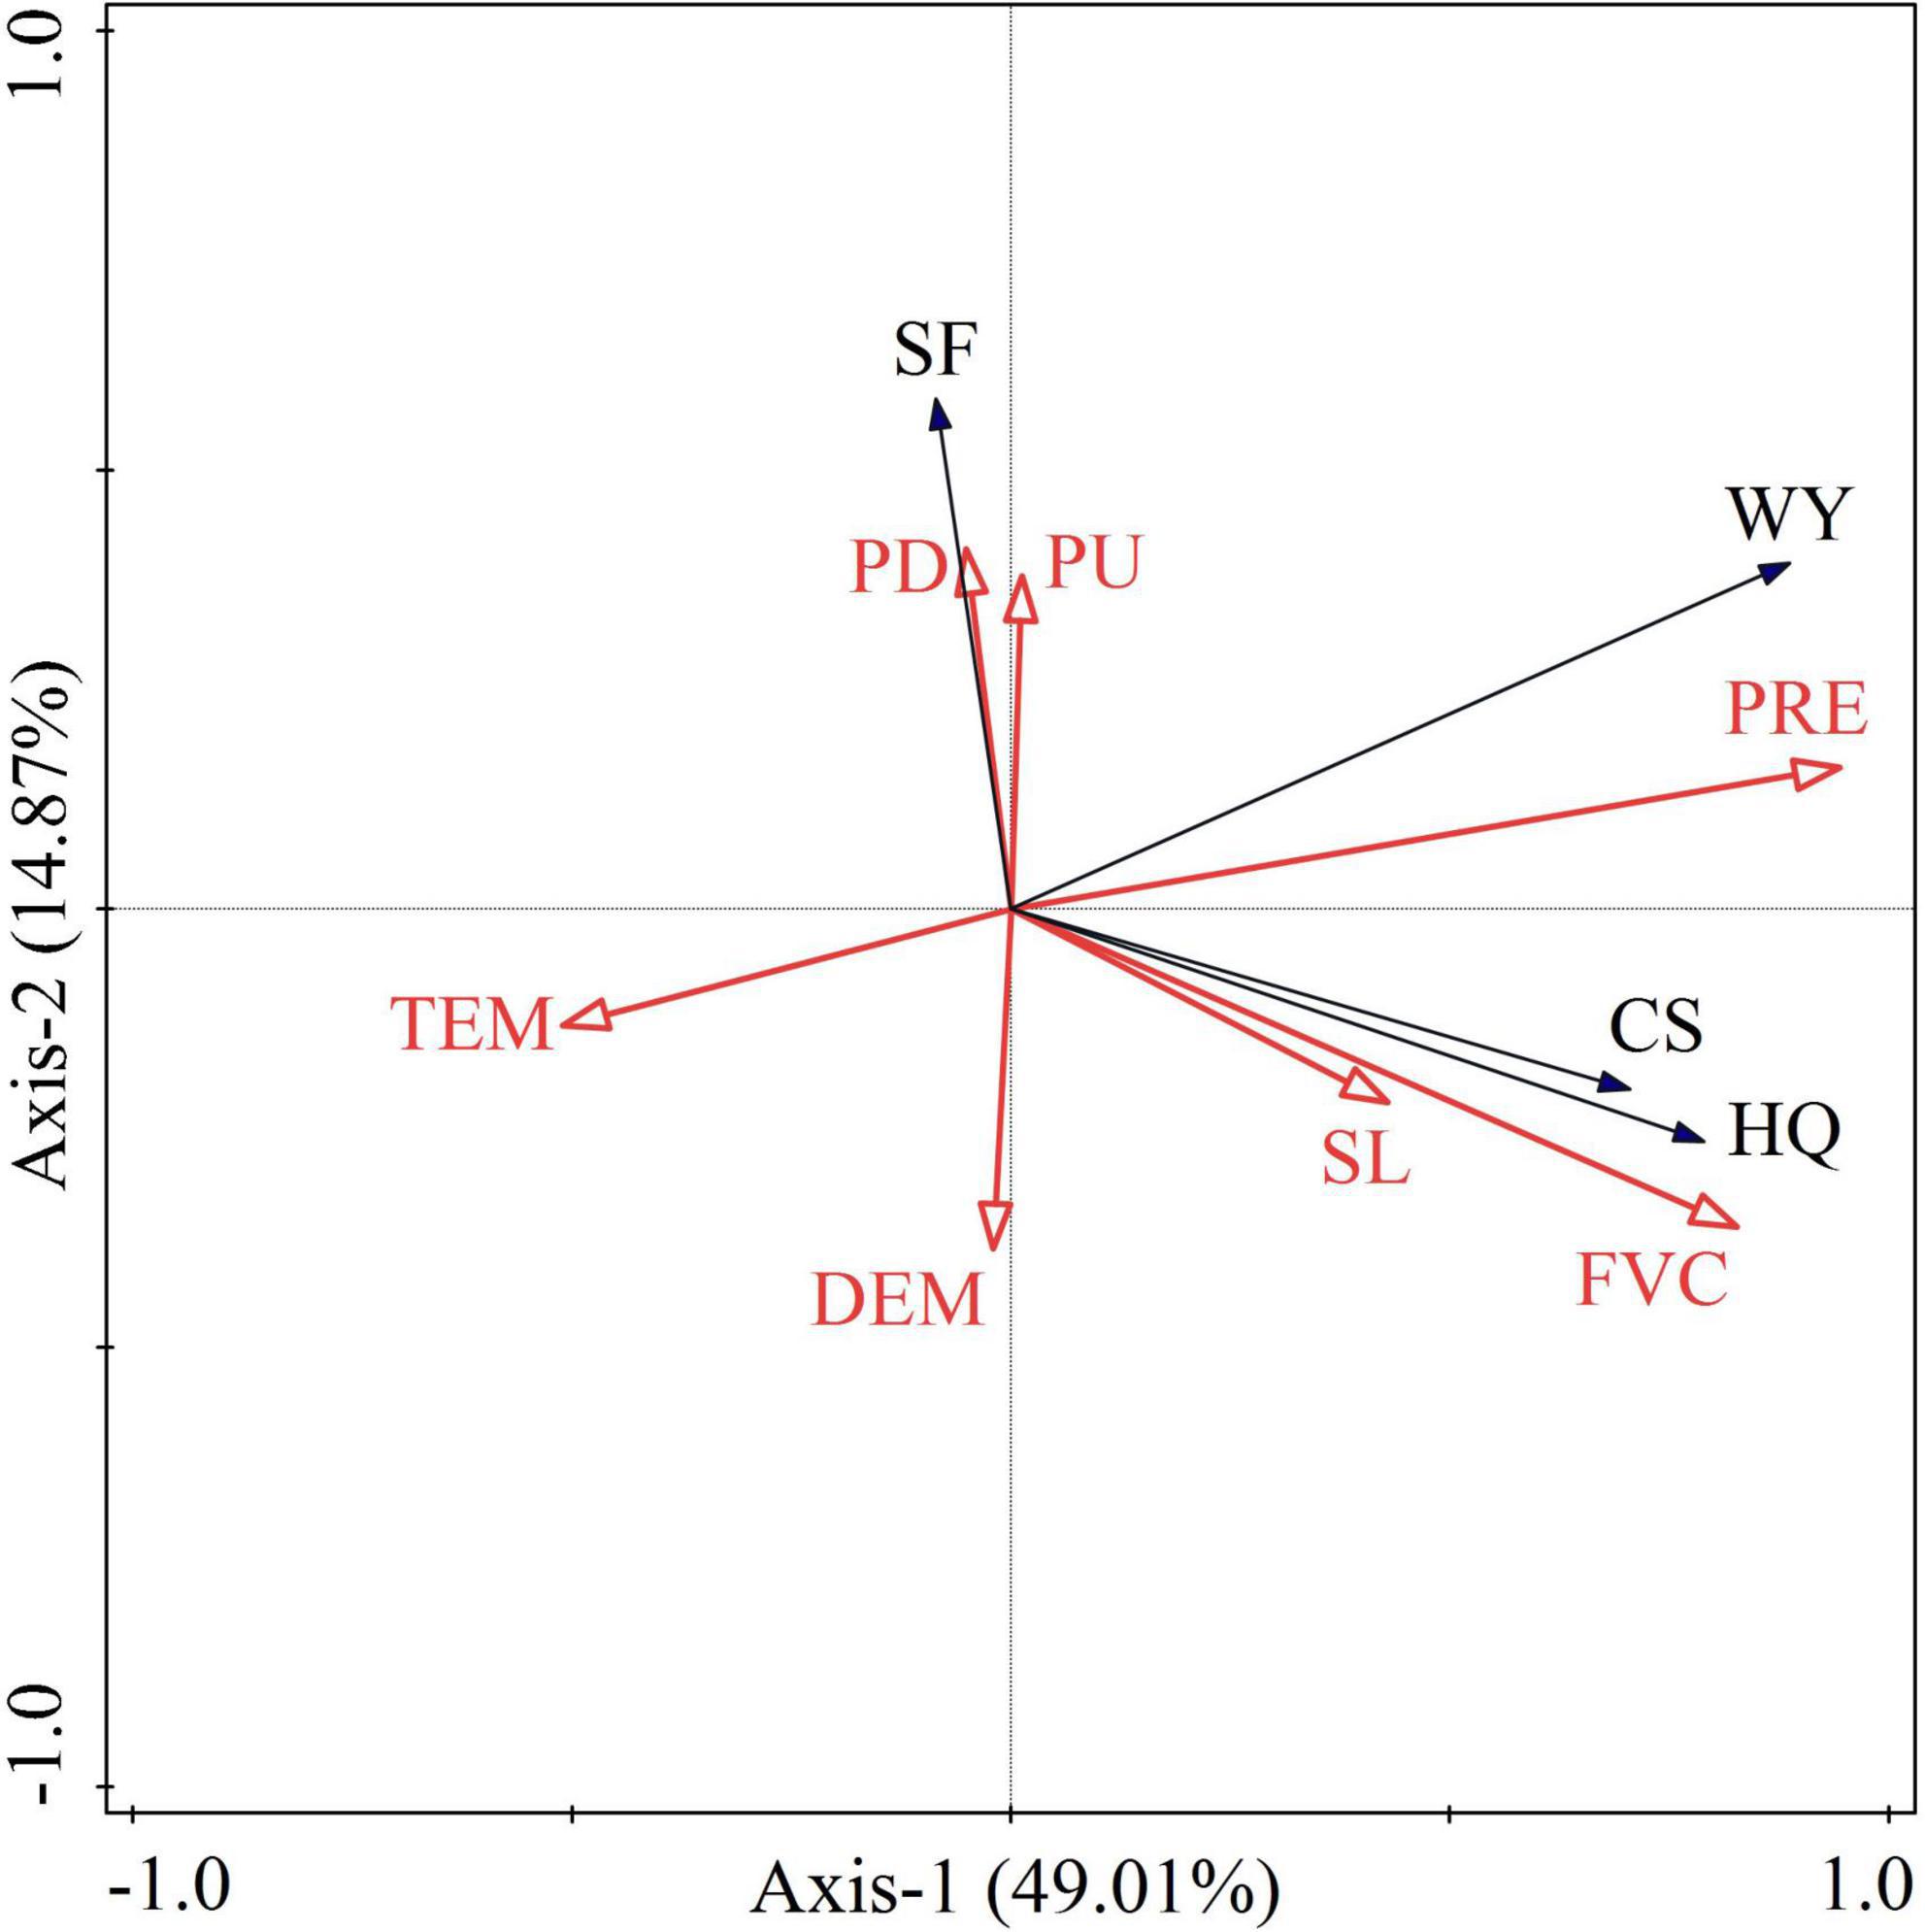
Figure 5. RDA showing the relationship between four ecosystem services and seven ecological, social drivers. The black arrow represents ecosystem services, and the red arrow represents ecological, and social driving factors. CS, carbon storage; HQ, habitat quality; SF, sand fixation; WY, water yield; DEM, digital elevation model; SL, slope; FVC, fractional vegetation cover; PRE, precipitation; TEM, temperature; PU, percentage of urban area; PD, population density.
The MGWR model was used to determine the spatial distribution of the influence of different driving factors on the change in ecosystem services. The Akaike information criterion (AIC) and calibration R2 are widely used to describe the predictive power of models, whereby the lower the AIC, the closer the situation is to reality. The higher the adjusted R2, the better the variance explanation. In general, the MGWR had strong explanatory power (Table 3).
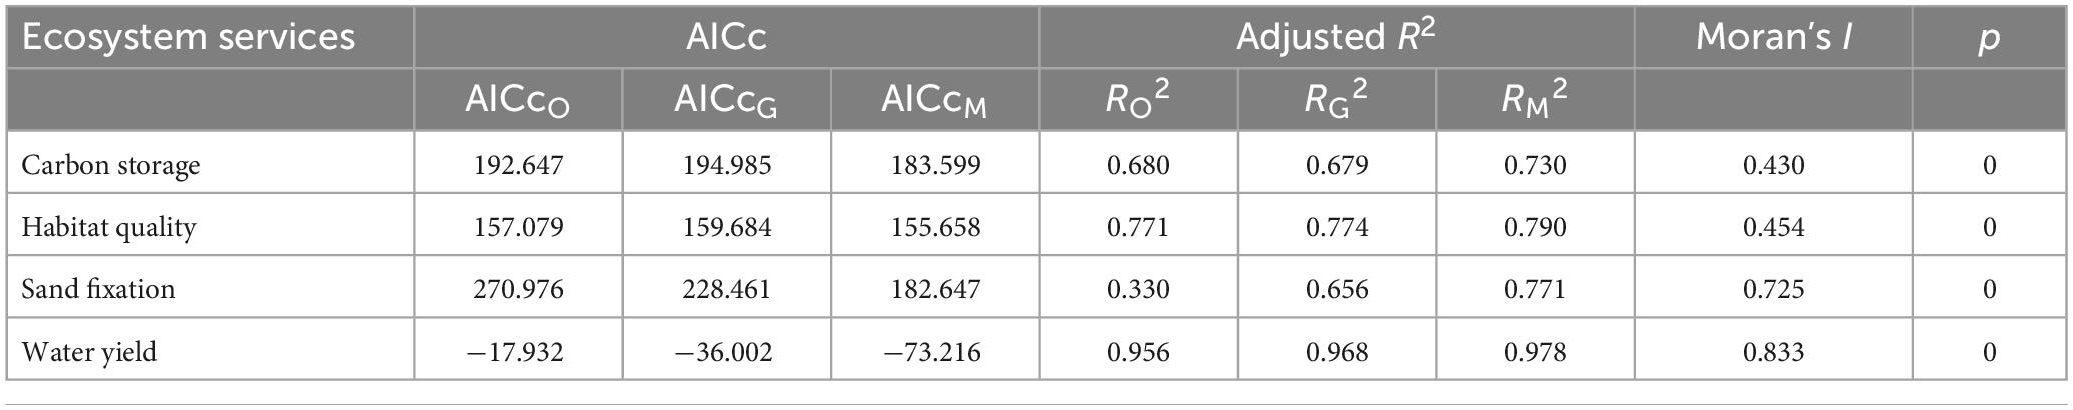
Table 3. Comparison of OLS, GWR, and MGWR model parameters.
The MGWR regression coefficient was positive, indicating that increasing influencing factors will increase the ecosystem service level. Meanwhile, the negative regression coefficient indicated that increased in influencing factors would reduce the ecosystem service level. The results have shown that the regression coefficients in different regions had different values. In Xinjiang, the local coefficients for the seven drivers varied between counties, which reflected the non–stationary spatial response of ecosystem services to the influencing factors in Xinjiang. The seven influencing factors selected in this study could explain 73.0, 79.0, 77.1, and 97.8%, of carbon storage, habitat quality, sand fixation and water yield, respectively (Table 4).
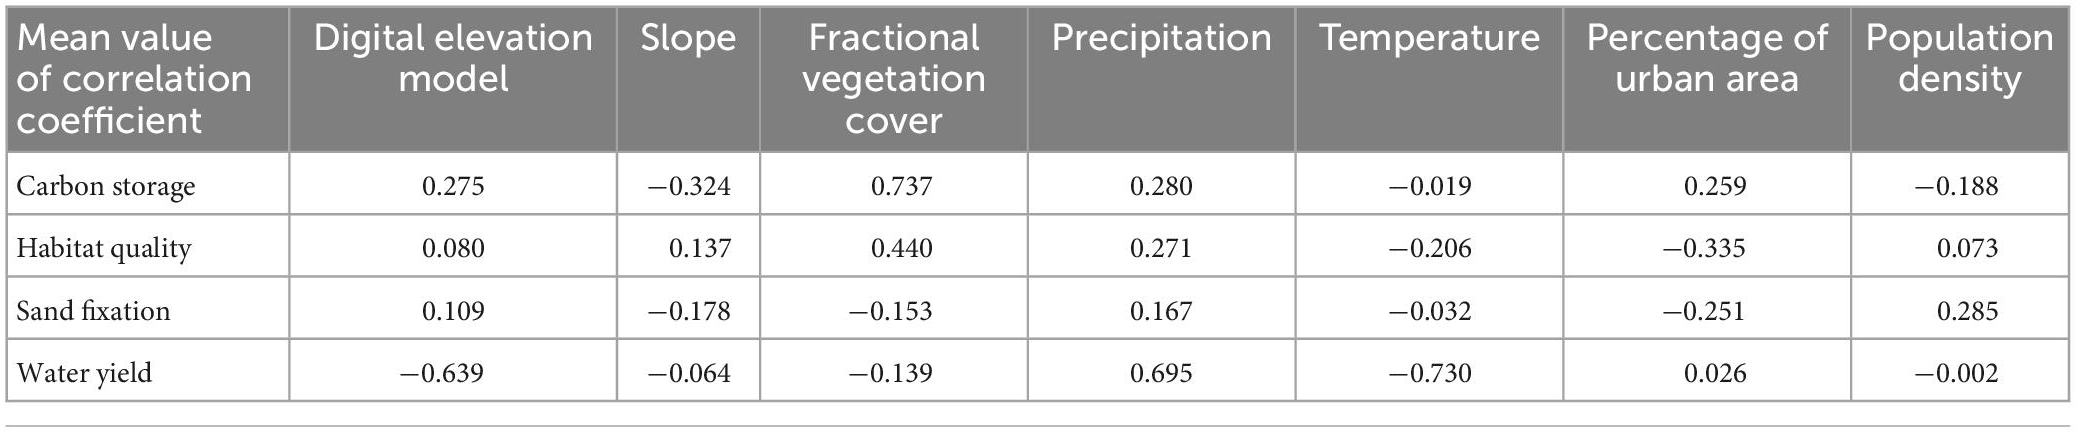
Table 4. Mean of regression coefficient of ecosystem services and drivers in the MGWR model.
Figure 6 and Table 4 show that carbon storage and habitat quality correlate strongly with fractional vegetation cover, with correlation coefficients of 0.737 and 0.440, and higher in the south. The correlation between carbon storage and precipitation, the percentage of urban area gradually increases from north to south (Figures 6C, D). The relationship between habitat quality and precipitation gradually increases from east to west (Figure 6F). The proportion of urban areas will lead to the reduction of habitats suitable for biological survival and the reduction of habitat quality (Figure 6G). There is a negative correlation between sand fixation and the percentage of urban area. The impact direction and intensity of precipitation on sand fixation in different regions of Xinjiang are also very different (Figure 6I). Temperature, DEM, and fractional vegetation cover negatively impacted water yield, with correlation coefficients of −0.730, −0.639 and −0.139, respectively. Precipitation has a direct positive impact on water yield, and the correlation coefficient is 0.693. The relationship between fractional vegetation cover and water yield is closer in the south of Xinjiang. In the north, the relationship between water yield and DEM, temperature and precipitation is closer. With the intensification of human activities and the increase in domestic water consumption, with the increase of cultivated land in the north, the expansion of irrigation area has increased evaporation to a certain extent, negatively impacting water yield (Liang et al., 2021). To sum up, ecological factors were the main driving factors for changes in regional ecosystem services. Therefore, regulating climate and increasing vegetation will maximize the improvement in regional ecosystem services. The spatial correlation and correlation intensity changes between the seven factors selected and the four ecosystem services were significantly different. This indicated that the ecosystem services in different regions were affected by different factors and that zoning management may be crucial to the sustainable supply of ecosystem services.
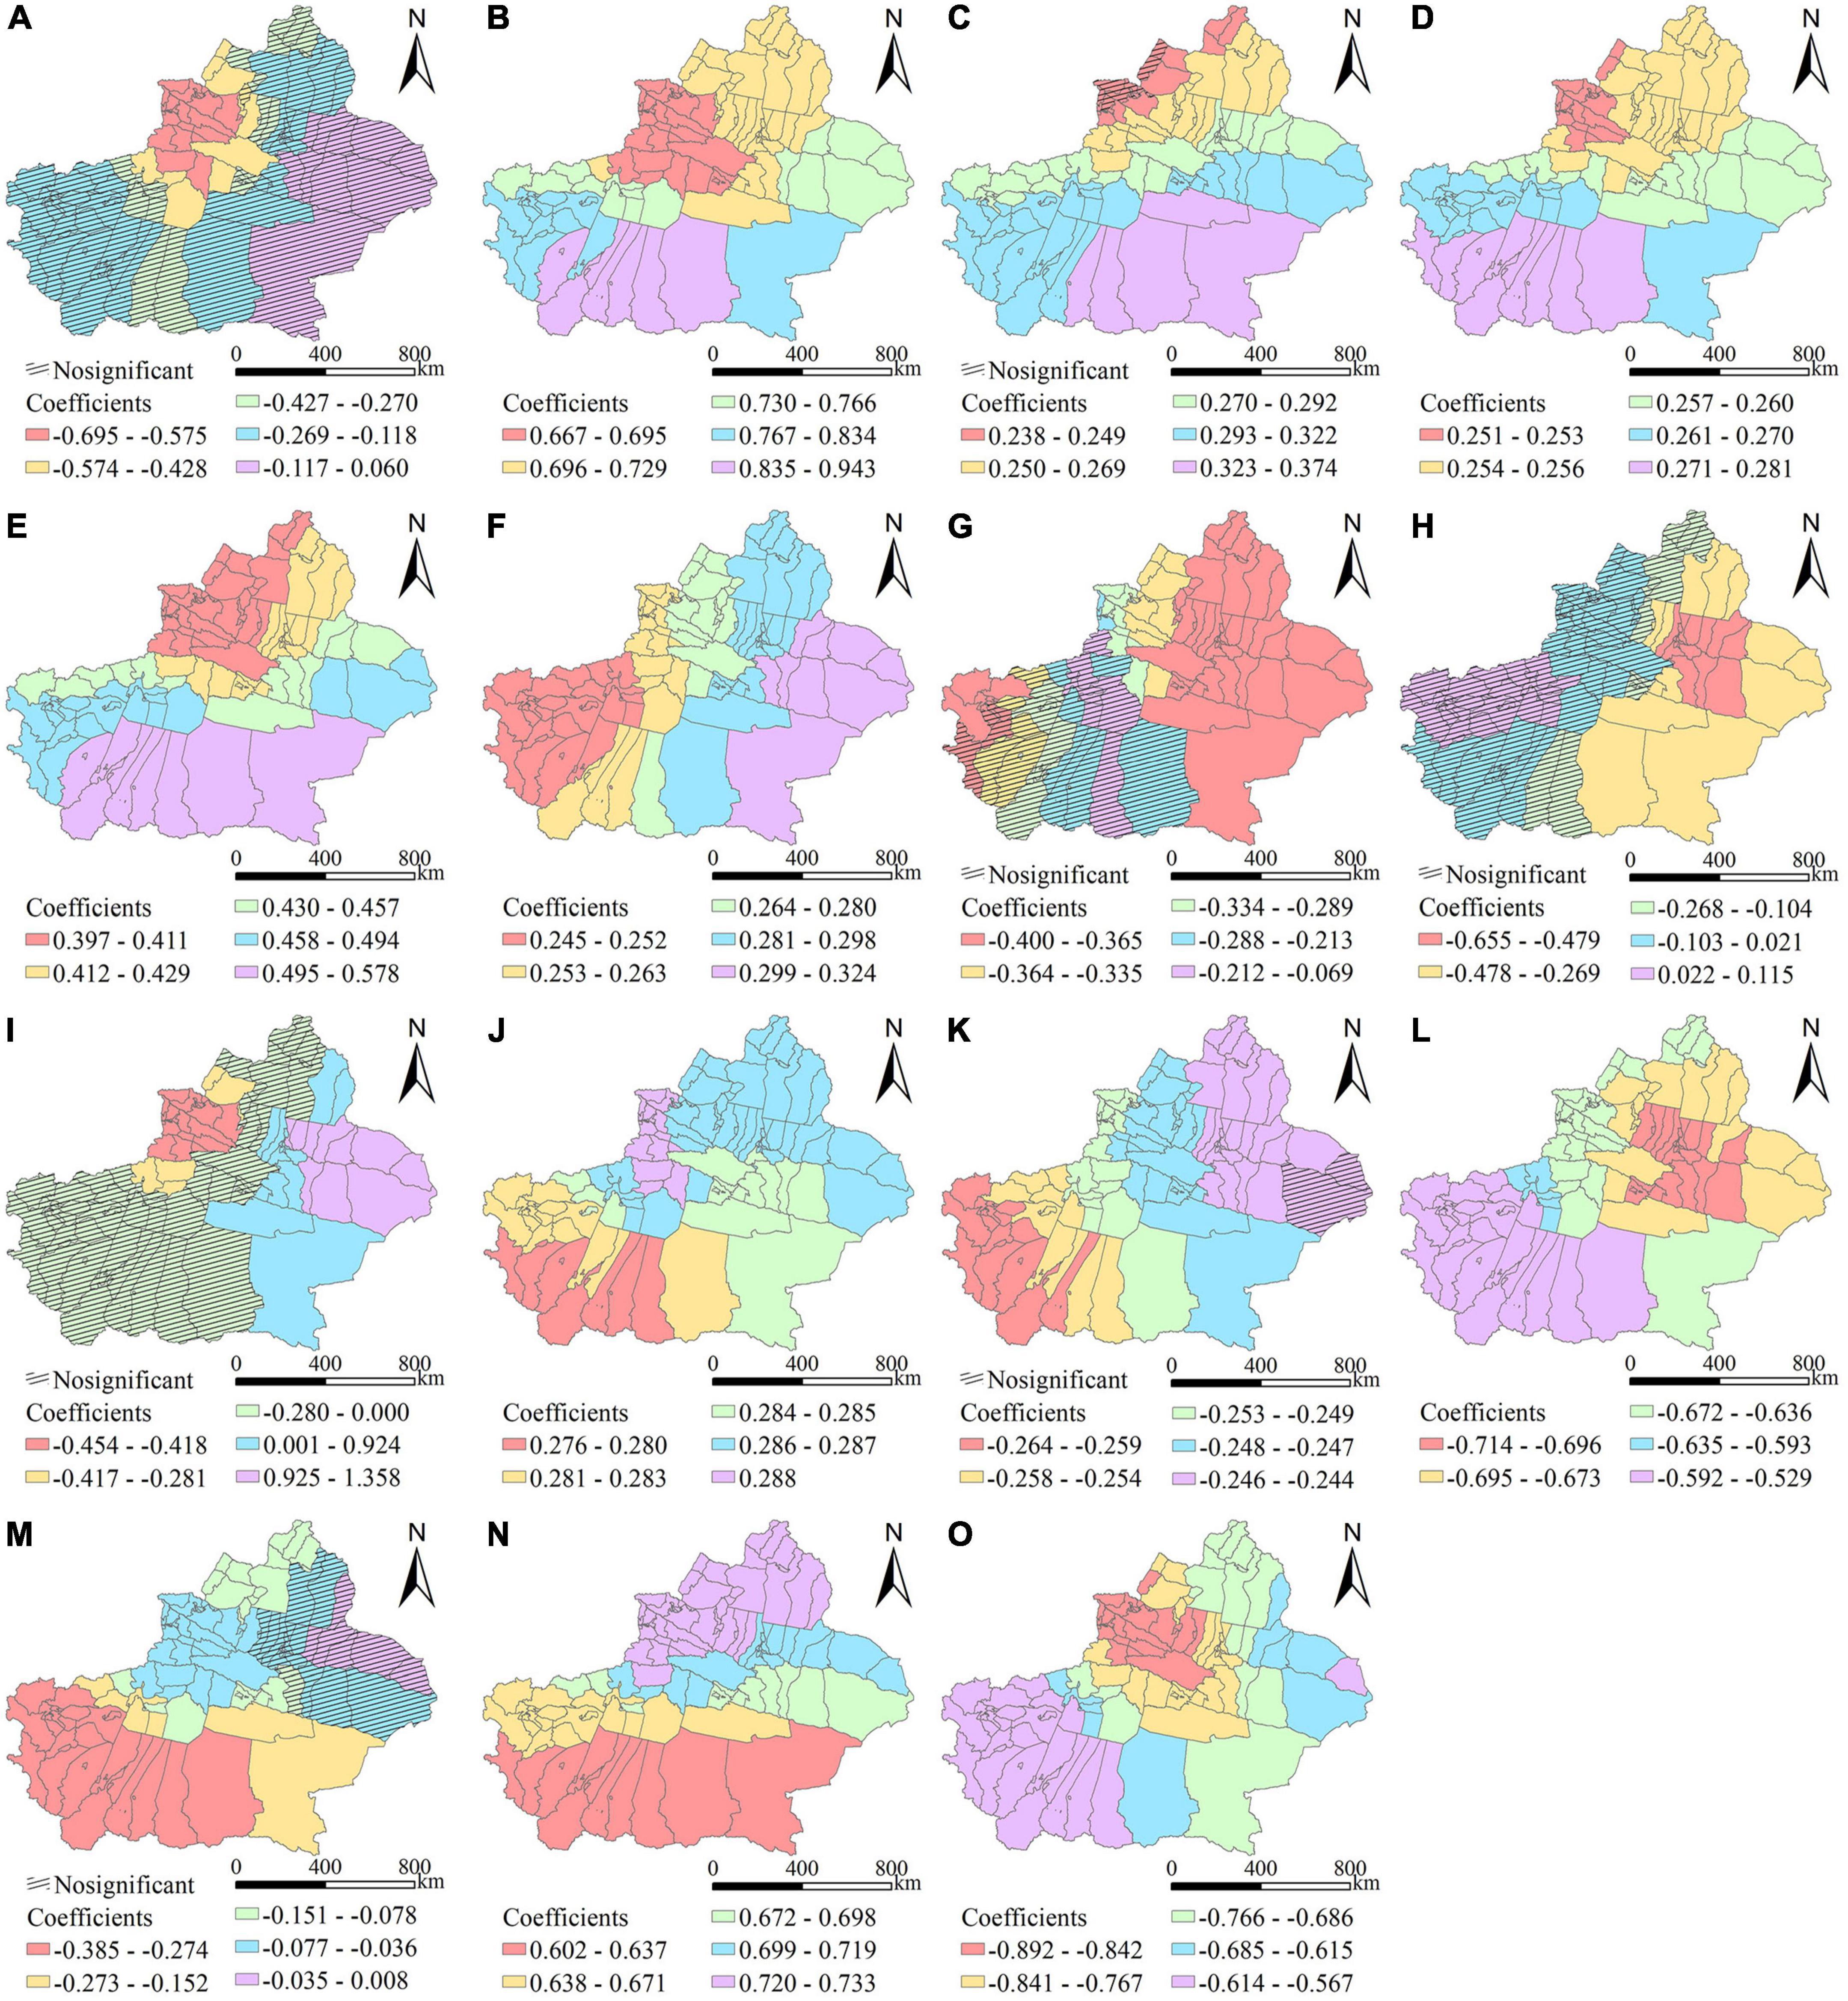
Figure 6. Expression of spatial heterogeneity of drivers. (A–D) CS–SL, CS–FVC, CS–PRE, and CS–PU. (E–G) HQ–FVC, HQ–PRE, and HQ–PU. (H–K) SF–FVC, SF–PRE, SF–PD, and SF–PU. (L–O) WY–DEM, WY–FVC, WY–PRE, and WY–TEM. (CS, carbon storage; HQ, habitat quality; SF, sand fixation; WY, water yield; DEM, digital elevation model; SL, slope; FVC, fractional vegetation cover; PRE, precipitation; TEM, temperature; PU, percentage of urban area; PD, population density).
In this study, our results show that high–value areas for carbon storage, habitat quality, sand fixation, and water yield, were predominantly distributed in the Tianshan Mountains, Altai Mountains, and oases around the southern Tarim Basin across Xinjiang. It is consistent with the finding of Wang et al. (2020). It was mainly attributed to the large area of forest land and grassland in the north, where is abundant rain, provides excellent habitat for species, and has a high capacity for carbon storage and sand fixation (Li et al., 2021). Altay, known as the “water tower” in northern Xinjiang, is a water conservation type mountain grassland ecological functional area that has significantly improved water supply. Therefore, conserving of mountain vegetation and water resources is a top priority for sustainable development in Xinjiang. Identifying the hotspots of ecosystem services helps to set priorities and take measures to maintain the level of ecosystem services. In the coldspots of ecosystem services, we should take targeted measures to improve the level of ecosystem services by analyzing the driving factors of ecosystem services.
According to the results of RDA and the regression coefficient of the MGWR model, we found that ecological and social factors significantly differ in the impact of ecosystem services in different regions. The comprehensive impact of precipitation and fractional vegetation cover on ecosystem services is significantly stronger than other factors (Figure 5). Precipitation is the main factor affecting the water yield in Xinjiang, and its coefficient value increases from south to north in turn (Figure 6N). Previous studies have shown that precipitation increase is the most important factor, because it significantly affects water volume and land hydrological process (Ziadat and Taimeh, 2013; Ma et al., 2021a,b). Temperature reduces water yield by affecting precipitation and evapotranspiration. Climate change can affect the distribution of water production by affecting hydrological processes and energy balance. Therefore, climate change can affect the water yield by changing the precipitation and temperature of Xinjiang. Sand fixation is affected by precipitation, vegetation and human activities, showing spatial heterogeneity, reflecting the comprehensiveness and complexity of the ecological process (Gong et al., 2022; Niu et al., 2022; Cui et al., 2023). From the perspective of the regression coefficient, fractional vegetation cover and precipitation strongly impact windbreak and sand fixation, and are the main driving factors for sand fixation. Higher precipitation can promote the growth of vegetation, which is conducive to soil surface crusting and thus enhance the resistance of the surface to wind erosion (Wu et al., 2021). The spatial distribution of precipitation in Xinjiang is extremely uneven, resulting in strong spatial heterogeneity of the impact of precipitation on sand fixation. Fractional vegetation cover can affect the wind erosion resistance of soil by affecting temperature, humidity and evapotranspiration (Řeháček et al., 2017). Fractional vegetation cover in eastern Xinjiang is low, and evaporation reduces the water content, which may be the reason for the spatial differentiation of the impact of fractional vegetation cover on sand fixation in eastern and western regions.
The carbon storage of terrestrial ecosystems is mainly distributed in vegetation and soil carbon pool, and the correlation between carbon storage and fractional vegetation cover is the strongest. There is a negative correlation between carbon storage and slope. When the slope is gentle, the soil erosion intensity is small, the conversion rate of microorganism to soil organic matter is low, and the soil carbon loss is low, conducive to carbon storage and fixation (Olson et al., 2012). Habitat quality is mainly affected by vegetation coverage, however, He et al. (2017) showed that habitat quality is mainly affected by land use types given that extensive construction land will occupy biological habitat. An important breakthrough required to improve the habitat quality in Xinjiang is to strategically determine the scope of construction land expansion from the perspective of land use, increase development of unused land, and reduce damage to forest land, grassland, and other natural landscapes (Deng et al., 2021). The study shows that the correlation between social factors and ecosystem services is weak, and there is spatial heterogeneity in direction and intensity, consistent with previous research results (Bennett et al., 2009; Guo et al., 2021). However, Zhang et al. (2020) showed a strong interaction between ecosystem services and human activities in Xinjiang, mainly due to differences in calculation methods and human activity indicators. In this study, the MGWR model was used to distinguish the spatial relationship strength between ecosystem services and driving factors, and the key factors affecting ecosystem services were identified from the perspective of spatial non–stationary, but the interaction between several variables could not be investigated.
This study reveals the impact of driving factors on ecosystem services in space, which is crucial to ecosystem service management. On this basis, three suggestions were put forward to improve the management of ecosystem services in Xinjiang. This study has shown that among the ecological factors, temperature had the largest negative correlation with ecosystem services (Figures 5, 6). This indicated that policymakers should attempt to reduce temperature to improve ecosystem services. Crops can reflect sunlight to reduce temperature. According to the differences in climate, landform, and other conditions of counties, selecting suitable crops can effectively reduce the surface temperature (Ridgwell et al., 2009). Second, water is the lifeline of sustainable development in Xinjiang. The main potential of water–saving in Xinjiang lies in agriculture. On the one hand, we should strengthen the construction of farmland and water conservancy infrastructure, and on the other hand, we should implement sustainable farmland to restore rivers and lakes to reduce habitat fragmentation caused by human activities (Wang et al., 2017). Third, ecosystem service hotspots should be reserved to avoid being damaged. In this study, the hotspots of ecosystem services mainly appear in areas with high vegetation coverage, while the coldspots appear in areas with high unused land (Figure 6). Based on this, we suggest that the afforestation plan should be appropriately implemented in the coldspot area in combination with local conditions. However, farmers often destroy forests to increase their income. Appropriate commercial plants can be introduced into mixed agriculture to protect biodiversity and farmers’ livelihoods (Njurumana et al., 2021).
This study focused on the spatial distribution, hotspots, and driving factors of ecosystem services, which can provide a reference for ecosystem management in Xinjiang. However, there were still some limitations in this study. Our method only captured the relationship between ecosystem services and their social drivers in 2020. However, the study lacked provision for long–term monitoring and assessment of changes in ecosystem services. Future research should focus on the “over time” approach. In addition, we only focused on four typical ecosystem services in Xinjiang, excluding other supply services such as food and cultural services such as tourism. There are many scenic spots in Xinjiang. The spatial area of cultivated land and grassland is relatively large, and the self–sufficiency rate for grain, oil, meat, eggs, and milk is relatively high. Therefore, the comprehensive assessment of ecosystem services should be the focus of future research (Castillo-Eguskitza et al., 2018). To date, most studies on the impact of ecosystem services have only focused on a single factor while excluding the impact of the effects on ecosystem services. However, the response of ecosystem services to climate factors is not a simple, isolated, linear response, but rather an in–depth response to multiple climate factors, vegetation conditions, and other conditions (Xue et al., 2023). Therefore, it is necessary to strengthen research on the compounding mechanisms of ecological and social factors on ecosystem services. Regional differences and the main driving factors should be considered when formulating policies.
Based on the InVEST and RWEQ models, this study evaluated ecosystem service hotspots and determined the priority for their protection by exploring the spatial distribution of carbon storage, habitat quality, water yield and sand fixation in Xinjiang. RDA and MGWR models analyzed the driving factors of ecosystem services and their spatial differentiation by integrating climate, vegetation, terrain, and social factors. The results showed that the ecosystem services (carbon storage, habitat quality, sand fixation and water yield) showed spatial heterogeneity at the county level. The high–value areas of ecosystem services were consistent with the hotspots, mainly distributed in the north of Xinjiang, e.g., Ili Kazak Autonomous Prefecture, Bortala Mongolian Autonomous Prefecture, Tacheng Prefecture and Altay Prefecture. The types, intensities, and directions of ecosystem services drivers were significantly different at counties scale. There was a stronger correlation between carbon storage, habitat quality and fractional vegetation cover in the southern regions. Water yield was affected by many drivers, and is more closely related to fractional vegetation cover in southern Xinjiang. This study contributes to determining the local characteristics that affect ecosystem services and formulating effective ecosystem management policies for different regions, intending to provide a reference for sustainable development and ecological security of ecosystems in Xinjiang.
The raw data supporting by the conclusions of this article will be made available by the authors, without undue reservation.
HW and ZZ conceived the study. HW obtained funding for the study. LH and ZZ performed the statistical analysis. ZZ produced the figures and tables and wrote the first draft of the manuscript. SP modified and checked this manuscript. All authors contributed to the article and approved the submitted version.
This work was supported by the National Key R&D Program of China (Grant No. 2021YFB2600101), NSFC–RS exchange project between China and the UK (Grant No. 42011530175), and the National Natural Science Foundation of China (Grant No. 41801366).
We would like to acknowledge Editage (https://editage.com/) for English language editing.
The authors declare that the research was conducted in the absence of any commercial or financial relationships that could be construed as a potential conflict of interest.
All claims expressed in this article are solely those of the authors and do not necessarily represent those of their affiliated organizations, or those of the publisher, the editors and the reviewers. Any product that may be evaluated in this article, or claim that may be made by its manufacturer, is not guaranteed or endorsed by the publisher.
Benjamini, Y., and Yekutieli, D. (2001). The control of the false discovery rate in multiple testing under dependency. Ann. Stat. 29, 1165–1188. doi: 10.1214/aos/1013699998
Bennett, E. M., Peterson, G. D., and Gordon, L. J. (2009). Understanding relationships among multiple ecosystem services. Ecol. Lett. 12, 1394–1404. doi: 10.1111/j.1461-0248.2009.01387.x
Bi, X., Chang, B., Hou, F., Yang, Z., Fu, Q., and Li, B. (2021). Assessment of spatio-temporal variation and driving mechanism of ecological environment quality in the Arid regions of central asia, Xinjiang. Int. J. Environ. Res. Public Health 18:7111. doi: 10.3390/ijerph18137111
Castillo-Eguskitza, N., Martín-López, B., and Onaindia, M. (2018). A comprehensive assessment of ecosystem services: Integrating supply, demand and interest in the Urdaibai Biosphere Reserve. Ecol. Ind. 93, 1176–1189. doi: 10.1016/j.ecolind.2018.06.004
Chen, T., Feng, Z., Zhao, H., and Wu, K. (2020). Identification of ecosystem service bundles and driving factors in Beijing and its surrounding areas. Sci. Total Environ. 711:134687. doi: 10.1016/j.scitotenv.2019.134687
Chen, Y., Li, W., Deng, H., Fang, G., and Li, Z. (2016). Changes in central asia’s water tower: Past, present and future. Sci. Rep. 6:35458. doi: 10.1038/srep35458
Costanza, R., d’Arge, R., de Groot, R., Farber, S., Grasso, M., Hannon, B., et al. (1997). The value of the world’s ecosystem services and natural capital. Nature 387, 253–260. doi: 10.1038/387253a0
Cui, L., Shen, Z., Liu, Y., Yu, C., Lu, Q., Zhang, Z., et al. (2023). Identification of driving forces for windbreak and sand fixation services in semiarid and arid areas: A case of Inner Mongolia, China. Prog. Phys. Geogr. Earth Environ. 47, 32–49. doi: 10.1177/03091333221105403
Deng, C., Guo, F., Huang, D., and Li, Z. (2021). Research on the impact of land use and lansacpe pattern on habitat quality in Dongting Lake area based on INVEST model. Ecol. Sci. 40, 99–109. doi: 10.14108/j.cnki.1008-8873.2021.02.013
Ding, Z., Zheng, H., Wang, J., O’Connor, P., Li, C., Chen, X., et al. (2022). Integrating top-down and bottom-up approaches improves practicality and efficiency of large-scale ecological restoration planning: Insights from a social-ecological system. Engineering. (in press) doi: 10.1016/j.eng.2022.08.008
Dobson, A., Lodge, D., Alder, J., Cumming, G. S., Keymer, J., McGlade, J., et al. (2006). Habitat loss, trophic collapse, and the decline of ecosystem services. Ecology 87, 1915–1924. doi: 10.1890/0012-9658(2006)87[1915:HLTCAT]2.0.CO;2
Fellman, J. B., Hood, E., Dryer, W., and Pyare, S. (2015). Stream physical characteristics impact habitat quality for Pacific salmon in two temperate coastal watersheds. PLoS One 10:e0132652. doi: 10.1371/journal.pone.0132652
Fotheringham, A. S., Yue, H., and Li, Z. (2019). Examining the influences of air quality in China’s cities using multi-scale geographically weighted regression. Transact. GIS 23, 1444–1464.
Fryrear, D. W., Bilbro, J. D., Saleh, A., Schomberg, H., Stout, J. E., and Zobeck, T. M. (2000). RWEQ: Improved wind erosion technology. J. Soil Water Conserv. 55:183.
Gao, H., Fu, T., Liang, H., and Liu, J. (2022). Cold/hot spots identification and tradeodd/synergy analysis of ecosystem services in Taihang Mountain area. Chin. J. Eco-Arric. 30, 1045–1053.
Gong, G., Liu, J., Shao, Q., and Zhai, J. (2014). Sand-fixing function under the change of vegetation coverage in a wind erosion area in Northern China. J. Resour. Ecol. 5, 105–114.
Gong, J., Shi, J., Zhu, C., Li, X., Zhang, Z., Zhang, W., et al. (2022). Accounting for land use in an analysis of the spatial and temporal characteristics of ecosystem services supply and demand in a desert steppe of Inner Mongolia, China. Ecol. Ind. 144:109567. doi: 10.1016/j.ecolind.2022.109567
Guo, C., Gao, J., Zhou, B., and Yang, J. (2021). Factors of the ecosystem service value in water conservation areas considering the natural environment and human activities: A case study of funiu mountain, China. Int. J. Environ. Res. Public Health 18:11074. doi: 10.3390/ijerph182111074
Han, R., Feng, C.-C., Xu, N., and Guo, L. (2020). Spatial heterogeneous relationship between ecosystem services and human disturbances: A case study in Chuandong, China. Sci. Total Environ. 721:137818. doi: 10.1016/j.scitotenv.2020.137818
He, J., Huang, J., and Li, C. (2017). The evaluation for the impact of land use change on habitat quality: A joint contribution of cellular automata scenario simulation and habitat quality assessment model. Ecol. Model. 366, 58–67. doi: 10.1016/j.ecolmodel.2017.10.001
Hu, B., Kang, F., Han, H., Cheng, X., and Li, Z. (2021). Exploring drivers of ecosystem services variation from a geospatial perspective: Insights from China’s Shanxi Province. Ecol. Ind. 131:108188. doi: 10.1016/j.ecolind.2021.108188
Hu, C., Wang, Z., Li, J., Liu, H., and Sun, D. (2022). Quantifying the temporal and spatial patterns of ecosystem services and exploring the spatial differentiation of driving factors: A case study of sichuan basin, China. Front. Environ. Sci. 10:927818. doi: 10.3389/fenvs.2022.927818
Hu, S., Zhang, R. X., and Guan, J. D. (2018). Analysis on carbon storage change of construction land expansion in chongqing based on InVEST Model. Res. Soil Water Conserv. 25, 323–331. doi: 10.13869/j.cnki.rswc.2018.03.046
Huang, Y., Wu, Y., Niu, S., and Gan, X. (2022). Estimating the effects of driving forces on ecosystem services and their responses to environmental conditions. Environ. Sci. Pollut. Res. 29, 71474–71486. doi: 10.1007/s11356-022-20867-x
Jordan, G., Rompaey, A. V., Szilassi, P., Csillag, G., Mannaerts, C., and Woldai, T. (2005). Historical land use changes and their impact on sediment fluxes in the Balaton basin (Hungary). Agric. Ecosyst. Environ. 108, 119–133. doi: 10.1016/j.agee.2005.01.013
Li, F., Li, Y., Zhou, X., Yin, Z., Liu, T., and Xin, Q. (2022). Modeling and analyzing supply-demand relationships of water resources in Xinjiang from a perspective of ecosystem services. J. Arid Land 14, 115–138. doi: 10.1007/s40333-022-0059-z
Li, J., and Zhang, C. (2021). Exploring the relationship between key ecosystem services and socioecological drivers in alpine basins: A case of Issyk-Kul Basin in Central Asia. Glob. Ecol. Conserv. 29:e01729. doi: 10.1016/j.gecco.2021.e01729
Li, J., Xu, E., and Zhang, H. (2019). Spatio-Temporal Pattern and hotspots migration under core driving force of ecosystem services of XinJiang. Chin. J. Agric. Resour. Preg. Plann. 40, 9–20.
Li, L., Yin, L., and Tang, Z. (2011). Distribution patterns of the species richness of plants and animals in Xinjiang, China. Arid Zone Res. 28, 1–9. doi: 10.13866/j.azr.2011.01.001
Li, S., Liu, Y., Yang, H., Yu, X., Zhang, Y., and Wang, C. (2021). Integrating ecosystem services modeling into effectiveness assessment of national protected areas in a typical arid region in China. J. Environ. Manag. 297:113408. doi: 10.1016/j.jenvman.2021.113408
Li, T., Li, D., Liang, D., and Huang, S. (2022). Coupling coordination degree of ecological-economic and its influencing factors in the counties of yangtze river economic belt. Sustainability 14:15467. doi: 10.3390/su142215467
Li, Y., Zhang, L., Yan, J., Wang, P., Hu, N., Cheng, W., et al. (2017). Mapping the hotspots and coldspots of ecosystem services in conservation priority setting. J. Geograph. Sci. 27, 681–696. doi: 10.1007/s11442-017-1400-x
Liang, J., Li, S., Li, X., Li, X., Liu, Q., Meng, Q., et al. (2021). Trade-off analyses and optimization of water-related ecosystem services (WRESs) based on land use change in a typical agricultural watershed, southern China. J. Clean. Prod. 279:123851. doi: 10.1016/j.jclepro.2020.123851
Liu, F., and Xu, E. (2020). Comparsion of spatial-temporal evolution of habitat quality between Xinjiang Corps and Non-corps Region based on land use. Chin. J. Appl. Ecol. 31, 2341–2351. doi: 10.13287/j.1001-9332.202007.014
Liu, Y., Bi, J., Lv, J., Ma, Z., and Wang, C. (2017). Spatial multi-scale relationships of ecosystem services: A case study using a geostatistical methodology. Sci. Rep. 7:9486. doi: 10.1038/s41598-017-09863-1
Liu, Y., Li, L., Chen, X., Zhang, R., and Yang, J. (2018). Temporal-spatial variations and influencing factors of vegetation cover in Xinjiang from 1982 to 2013 based on GIMMS-NDVI3g. Glob. Planet. Chang. 169, 145–155.
Lu, Y., Xu, X., Zhao, J., and Han, F. (2022). Spatiotemporal evolution of mountainous ecosystem services in an arid region and its influencing factors: A case study of the tianshan mountains in Xinjiang. Land 11:2164. doi: 10.3390/land11122164
Luo, Q., Zhou, J., Li, Z., and Yu, B. (2020). Spatial differences of ecosystem services and their driving factors: A comparation analysis among three urban agglomerations in China’s Yangtze River Economic Belt. Sci. Total Environ. 725:138452. doi: 10.1016/j.scitotenv.2020.138452
Lyu, R., Clarke, K. C., Zhang, J., Feng, J., Jia, X., and Li, J. (2019). Spatial correlations among ecosystem services and their socio-ecological driving factors: A case study in the city belt along the Yellow River in Ningxia, China. Appl. Geograph. 108, 64–73. doi: 10.1016/j.apgeog.2019.05.003
Ma, S., Wang, L.-J., Jiang, J., Chu, L., and Zhang, J.-C. (2021a). Threshold effect of ecosystem services in response to climate change and vegetation coverage change in the Qinghai-Tibet Plateau ecological shelter. J. Clean. Prod. 318:128592. doi: 10.1016/j.jclepro.2021.128592
Ma, S., Wang, L.-J., Zhu, D., and Zhang, J. (2021b). Spatiotemporal changes in ecosystem services in the conservation priorities of the southern hill and mountain belt, China. Ecol. Ind. 122:107225. doi: 10.1016/j.ecolind.2020.107225
Niu, L., Shao, Q., Ning, J., and Huang, H. (2022). Ecological changes and the tradeoff and synergy of ecosystem services in western China. J. Geograph. Sci. 32, 1059–1075.
Njurumana, G. N., Sadono, R., Marsono, D., and Irham. (2021). Ecosystem services of indigenous kaliwu agroforestry system in sumba, Indonesia. E3S Web Conf. 305:04002.
Olson, K. R., Gennadiyev, A. N., Zhidkin, A. P., and Markelov, M. V. (2012). Impacts of land-use change, slope, and erosion on soil organic carbon retention and storage. Soil Sci. 177, 269–278. doi: 10.1097/SS.0b013e318244d8d2
Oshan, T. M., Li, Z., Kang, W., Wolf, L. J., and Fotheringham, A. S. (2019). mgwr: A python implementation of multiscale geographically weighted regression for investigating process spatial heterogeneity and scale. ISPRS Int. J. Geo-Inform. 8:269. doi: 10.3390/ijgi8060269
Peng, J., Tian, L., Liu, Y., Zhao, M., Hu, Y. N., and Wu, J. (2017). Ecosystem services response to urbanization in metropolitan areas: Thresholds identification. Sci. Total Environ. 607–608, 706–714. doi: 10.1016/j.scitotenv.2017.06.218
Qiu, S., Peng, J., Dong, J., Wang, X., Ding, Z., Zhang, H., et al. (2020). Understanding the relationships between ecosystem services and associated social-ecological drivers in a karst region: A case study of Guizhou Province, China. Prog. Phys. Geograph. Earth Environ. 45, 98–114. doi: 10.1177/0309133320933525
Řeháček, D., Khel, T., Kučera, J., Vopravil, J., and Petera, M. (2017). Effect of windbreaks on wind speed reduction and soil protection against wind erosion. Soil Water Res. 12, 128–135.
Reid, W. V., Mooney, H. A., Cropper, A., Capistrano, D., Carpenter, S. R., Chopra, K., et al. (2005). Ecosystems and human well-being-synthesis: A report of the millennium ecosystem assessment. Washington, DC: Island Press.
Ridgwell, A., Singarayer, J. S., Hetherington, A. M., and Valdes, P. J. (2009). Tackling regional climate change by leaf albedo bio-geoengineering. Curr. Biol. 19, 146–150. doi: 10.1016/j.cub.2008.12.025
Rong, Y., Li, K., Guo, J., Zheng, L., Luo, Y., Yan, Y., et al. (2022). Multi-scale spatio-temporal analysis of soil conservation service based on MGWR model: A case of Beijing-Tianjin-Hebei, China. Ecol. Ind. 139:108946. doi: 10.1016/j.ecolind.2022.108946
Sallustio, L., De Toni, A., Strollo, A., Di Febbraro, M., Gissi, E., Casella, L., et al. (2017). Assessing habitat quality in relation to the spatial distribution of protected areas in Italy. J. Environ. Manag. 201, 129–137. doi: 10.1016/j.jenvman.2017.06.031
Shen, W., and Li, Y. (2022). Multi-Scale assessment and spatio-temporal interaction characteristics of ecosystem health in the middle reaches of the yellow river of China. Int. J. Environ. Res. Public Health 19:16144. doi: 10.3390/ijerph192316144
Sheng, J., Han, X., and Zhou, H. (2017). Spatially varying patterns of afforestation/reforestation and socio-economic factors in China: A geographically weighted regression approach. J. Clean. Prod. 153, 362–371. doi: 10.1016/j.jclepro.2016.06.055
Shi, L., Halik, Ü, Mamat, Z., Aishan, T., Abliz, A., and Welp, M. (2021). Spatiotemporal investigation of the interactive coercing relationship between urbanization and ecosystem services in arid northwestern China. Land Degrad. Dev. 32, 4105–4120. doi: 10.1002/ldr.3946
Su, S., Xiao, R., Jiang, Z., and Zhang, Y. (2012). Characterizing landscape pattern and ecosystem service value changes for urbanization impacts at an eco-regional scale. Appl. Geograph. 34, 295–305. doi: 10.1016/j.apgeog.2011.12.001
Sun, C., Ma, Y., and Gong, L. (2021). Response of ecosystem service value to land use/cover change in the northern slope economic belt of the Tianshan Mountains, Xinjiang, China. J. Arid Land 13, 1026–1040. doi: 10.1007/s40333-021-0082-5
Sun, X., Wu, J., Tang, H., and Yang, P. (2022). An urban hierarchy-based approach integrating ecosystem services into multiscale sustainable land use planning: The case of China. Resour. Conserv. Recycl. 178:106097. doi: 10.1016/j.resconrec.2021.106097
Tang, X., Hao, X., Liu, Y., Pan, Y., and Li, H. (2016). Driving factors and spational heterogeneity analysis of ecosysten services value. Trans. Chin. Soc. Agric. Mach. 47, 336–342.
Wang, X., Cheng, C., Yin, L., Feng, X., and Wei, X. (2020). Spational-temporal changes and tradeoff/synergy relationship of ecosystem services in Xinjiang. Chin. J. Ecosyst. 39, 990–1000. doi: 10.13292/j.1000-4890.202003.028
Wang, X., Dong, X., Liu, H., Wei, H., Fan, W., Lu, N., et al. (2017). Linking land use change, ecosystem services and human well-being: A case study of the Manas River Basin of Xinjiang, China. Ecosyst. Serv. 27, 113–123. doi: 10.1016/j.ecoser.2017.08.013
Wei, H., Liu, H., Xu, Z., Ren, J., Lu, N., Fan, W., et al. (2018). Linking ecosystem services supply, social demand and human well-being in a typical mountain–oasis–desert area, Xinjiang, China. Ecosyst. Serv. 31, 44–57. doi: 10.1016/j.ecoser.2018.03.012
Wu, J., Xue, D., Wang, A., and Zhao, F. (2016). Case studies on the identification of key biodiversity areas(KBAs) in foreign countries and progress and prospects in China. Acta Ecol. Sin. 36, 3108–3114. doi: 10.5846/stxb201408261695
Wu, X., Fan, J., Sun, L., Zhang, H., Xu, Y., Yao, Y., et al. (2021). Wind erosion and its ecological effects on soil in the northern piedmont of the Yinshan Mountains. Ecol. Ind. 128:107825. doi: 10.1016/j.ecolind.2021.107825
Xu, Z., Fan, W., Wei, H., Zhang, P., Ren, J., Gao, Z., et al. (2019). Evaluation and simulation of the impact of land use change on ecosystem services based on a carbon flow model: A case study of the Manas River Basin of Xinjiang, China. Sci. Total Environ. 652, 117–133. doi: 10.1016/j.scitotenv.2018.10.206
Xue, C., Chen, X., Xue, L., Zhang, H., Chen, J., and Li, D. (2023). Modeling the spatially heterogeneous relationships between tradeoffs and synergies among ecosystem services and potential drivers considering geographic scale in Bairin Left Banner, China. Sci. Total Environ. 855:158834. doi: 10.1016/j.scitotenv.2022.158834
Yang, M., Gao, X., Zhao, X., and Wu, P. (2021). Scale effect and spatially explicit drivers of interactions between ecosystem services—A case study from the Loess Plateau. Sci. Total Environ. 785:147389. doi: 10.1016/j.scitotenv.2021.147389
Yushanjiang, A., Zhang, F., Yu, H., and Kung, H.-T. (2018). Quantifying the spatial correlations between landscape pattern and ecosystem service value: A case study in Ebinur Lake Basin, Xinjiang, China. Ecol. Eng. 113, 94–104. doi: 10.1016/j.ecoleng.2018.02.005
Zhang, L., Fu, B., Lü, Y., and Zeng, Y. (2015). Balancing multiple ecosystem services in conservation priority setting. Landsc. Ecol. 30, 535–546. doi: 10.1007/s10980-014-0106-z
Zhang, W., Zhou, J., Feng, G., Weindorf, D. C., Hu, G., and Sheng, J. (2015). Characteristics of water erosion and conservation practice in arid regions of Central Asia: Xinjiang, China as an example. Int. Soil Water Conserv. Res. 3, 97–111. doi: 10.1016/j.iswcr.2015.06.002
Zhang, Z., Xia, F., Yang, D., Huo, J., Wang, G., and Chen, H. (2020). Spatiotemporal characteristics in ecosystem service value and its interaction with human activities in Xinjiang, China. Ecol. Ind. 110:105826. doi: 10.1016/j.ecolind.2019.105826
Zhuang, Z., Li, C., Hsu, W.-L., Gu, S., Hou, X., and Zhang, C. (2022). Spatiotemporal changes in the supply and demand of ecosystem services in china’s huai river basin and their influencing factors. Water 14:2559. doi: 10.3390/w14162559
Keywords: ecosystem services, spatial pattern, driving factors, remote sensing, InVEST model, multi–scale geographically weighted regression (MGWR), Xinjiang
Citation: Zhang Z, Wan H, Peng S and Huang L (2023) Differentiated factors drive the spatial heterogeneity of ecosystem services in Xinjiang Autonomous Region, China. Front. Ecol. Evol. 11:1168313. doi: 10.3389/fevo.2023.1168313
Received: 17 February 2023; Accepted: 13 March 2023;
Published: 28 March 2023.
Edited by:
Zhouyuan Li, Beijing Forestry University, ChinaReviewed by:
Zhe Feng, China University of Geosciences, ChinaCopyright © 2023 Zhang, Wan, Peng and Huang. This is an open-access article distributed under the terms of the Creative Commons Attribution License (CC BY). The use, distribution or reproduction in other forums is permitted, provided the original author(s) and the copyright owner(s) are credited and that the original publication in this journal is cited, in accordance with accepted academic practice. No use, distribution or reproduction is permitted which does not comply with these terms.
*Correspondence: Huawei Wan, d2FuaHdAc2VjbWVwLmNu
Disclaimer: All claims expressed in this article are solely those of the authors and do not necessarily represent those of their affiliated organizations, or those of the publisher, the editors and the reviewers. Any product that may be evaluated in this article or claim that may be made by its manufacturer is not guaranteed or endorsed by the publisher.
Research integrity at Frontiers
Learn more about the work of our research integrity team to safeguard the quality of each article we publish.