
95% of researchers rate our articles as excellent or good
Learn more about the work of our research integrity team to safeguard the quality of each article we publish.
Find out more
ORIGINAL RESEARCH article
Front. Ecol. Evol. , 28 July 2023
Sec. Interdisciplinary Climate Studies
Volume 11 - 2023 | https://doi.org/10.3389/fevo.2023.1163704
Forest soil CO2 flux measurements are important for studying global climate change. Current monitoring methods are based on closed gas chambers, which block the wind pumping effect of near-surface winds in the measurements, resulting in biased values. Therefore, in this study, the effects of near-surface winds on chamber-monitored fluxes were investigated. The CO2 flux was quantified using a designed flux reference system with different CO2 concentrations, and the monitoring performance of the closed chamber was studied. Wavelet coherence was used to analyze the response relationship between near-surface winds and soil gas, and was combined with a flux calculation model to explore the relevant factors influencing gas chamber measurement-produced bias. The data indicate that at near-surface wind speeds greater than 0.8 m·s−1, gas transport enhancement was significant and further increased the deviation of the gas chamber-monitored CO2 fluxes. The monitoring error of the flow chamber (NSF) increased from 7% to 30% in soils with low carbon content, but did not vary significantly (3–7%) in soils with high CO2 concentrations. The flux measurement bias of the non-flow chamber (NSNF) was positively correlated with the soil carbon content, with the measurement error expanding by 16–24% with increasing soil CO2 concentrations. The measurement errors of the exponential and linear models in a windless environment were 9.8% (Exp) and 18.7% (Lin), respectively. The estimation errors of both models were positively correlated with both the time of a single monitoring event and the wind-induced coefficient Dw. Therefore, flux calculation models should be improved by considering environments with wind disturbances to reduce the effect of wind on measured values, which will help improve the accuracy of ecosystem carbon budgets.
Owing to human activities, forests are gradually shifting from being carbon sinks to carbon sources (Piao et al., 2017; Wang et al., 2017). Because forest soil is a huge carbon pool (Kumar et al., 2013; Hu, 2016; Xu et al., 2019), equivalent to approximately three and two times the total terrestrial biogenic and atmospheric carbon stocks, respectively (Rustad et al., 2000), the measurement of soil carbon emissions (carbon fluxes) is critical for studying global climate change (Sanz-Cobena et al., 2021). Previous studies have reported that the annual global CO2 release from forest soil is 68–92 Pg C (Jenkinson et al., 1991; Raich and Potter, 1995; Subke and Bahn, 2010), accounting for 60–90% of the respiration of the entire terrestrial ecosystem. This is substantially higher than the annual CO2 released into the atmosphere from fuel combustion (5.2 Pg C) (Schlesinger and Andrews, 2000; Denman et al., 2007; Goffin et al., 2015). Thus, a 10% error in the soil CO2 flux monitoring is comparable to the total release from fuel combustion.
Over the last few decades, techniques for monitoring forest soil CO2 fluxes have significantly improved, such as the use of absorption in alkaline solutions, chromatography, chamber methods, and micrometeorological methods. However, the primary monitoring techniques currently in use are based on the gas-chamber method. This approach is widely used in the carbon cycle and other environmentally relevant studies (Norman et al., 1997; Davidson et al., 2002; Xu et al., 2006; Midwood and Millard, 2011; Jacinthe, 2015; Poblador et al., 2017; Buragiene et al., 2019; Rittl et al., 2020; Zhang et al., 2022), and is mainly divided into closed-chamber (also known as transient or non-stationary systems) and open-chamber (also known as steady-state systems) systems (Livingston and Hutchinson, 1995; Davidson et al., 2002; Pumpanen et al., 2004; Xu et al., 2006; Sahoo and Mayya, 2010). The principle of a closed system is to calculate the soil CO2 flux based on the CO2 concentration change rate in the chamber, in conjunction with the appropriate model. This method generally has a short monitoring time and is easy to operate. The principle of an open system is to calculate the CO2 flux based on the gas flow rate, along with the difference in CO2 concentration between the inlet and outlet chambers. This approach generally has a long monitoring time, and there are many variations in chamber design (Fang and Moncrieff, 1998; Edwards and Riggs, 2003; Subke et al., 2003; Xu et al., 2006). Closed chambers are the most commonly used. However, the measurement process is demanding on the surroundings, as the chamber can change the measurement environment. This creates a “chamber effect” under fluctuating air pressure and wind turbulence (WT), which can develop unnatural conditions. Moreover, the measurements in closed chambers under WT can be biased by the “venturi effect” (Conen and Smith, 1998; Bain et al., 2005). Accordingly, Xu et al. (2006) have designed special vents to limit any wind-induced pressure fluctuations. These restrict the measured outflows to those driven by the diffusion mechanism, avoiding outflow overestimation due to pressure drops inside the chamber caused by the “venturi effect” of open vents. However, because WT or atmospheric pressure fluctuations affect soil gas transport mechanisms, changing them from diffusion to a combined diffusion–convection drive, the measurements do not match the actual emissions. The effects of air pressure fluctuations (pressure pumping effect) and wind pumping (WT) on soil gas transport have been previously studied (Maier et al., 2012). Air pressure fluctuations are mainly generated by changes in atmospheric pressure, which cause soil gases to fluctuate, thereby increasing the gas exchange rate. This phenomenon is associated with changes in air pressure (several hundred Pa. over several hours) (Clements and Wilkening, 1974; Massmann and Farrier, 1992; Sánchez-Cañete et al., 2013; Forde et al., 2019; Levintal et al., 2019). WT is generated by surface winds in the boundary layer that induce gas transport and enhance the exchange between soil gases and the atmosphere (Kimball and Lemon, 1971; Takle et al., 2004; Nachshon et al., 2012; Sánchez-Cañete et al., 2016; Pourbakhtiar et al., 2017; Poulsen et al., 2018; Laemmel et al., 2019). However, the effect of atmospheric pressure fluctuations on soil gas transport occurs over large timescales. WT-induced gas transport is often characterised by a high frequency and short duration; therefore, it is the most important factor for closed gas chambers with a short duration of monitoring (Maier et al., 2012; Levintal et al., 2019; Moya et al., 2019). This is because the closed-air chamber blocks the wind pumping effect of the surface WT in the measurement, thus reducing the driving functions of the airflow on soil CO2 and possibly leading to biased soil CO2 flux measurements (Maier et al., 2019). In addition, errors in the flux calculation models may be further amplified in snowy environments; this has not been clarified in previous studies. However, WT perturbations are inevitable during actual field measurements. Therefore, this study investigated the measurement of CO2 flux results in a closed gas chamber in a crowded environment.
In this study, we designed a new flux reference system based on species mass conservation, studied the response relationship between near-surface wind and soil CO2 concentration, quantitatively investigated the monitoring performance of closed gas chambers in field environments, and analyzed their monitoring effectiveness in soil environments with different carbon contents and gas porosities. All experiments were conducted under natural wind conditions. We also explored the factors associated with bias in gas chamber measurements in conjunction with flux calculation models, and provide effective monitoring recommendations for closed gas chamber measurements in the field.
This study was conducted at Zhejiang A&F University, located in Hangzhou, Zhejiang Province (latitude 30°15′N–30°16′N, longitude 119°43′E–119°44′E). The region has a subtropical climate with less than 30 wind-free days (surface wind<0.2 m·s−1) per year. The experimental site was in the school’s maple garden at 60–70 m altitude, and covered an area of 22,000 m² that was planted with a number of different species, including Acer cinnamomifolium, Acer yangjuechi (Fang and Chiu), Acer palmatum Thunb., Koelreuteria paniculata Laxm., and Osmanthus fragrans (Thunb.) Lour. The experimental system comprised a square gas control chamber and a special tent, the orientation of which is shown in Figure 1A. The top of the chamber was filled with a homogeneous soil medium for soil gas emissions, and gas diffusion in the chamber was regulated. CO2 was used as a tracer to quantitatively study the measurement effect of the gas chamber in the field environment. Tents were used to shield near-surface winds and create a wind-free environment. The study was conducted from November 2021 to January 2022 for a three-month trial at an average temperature of 9.5°C.
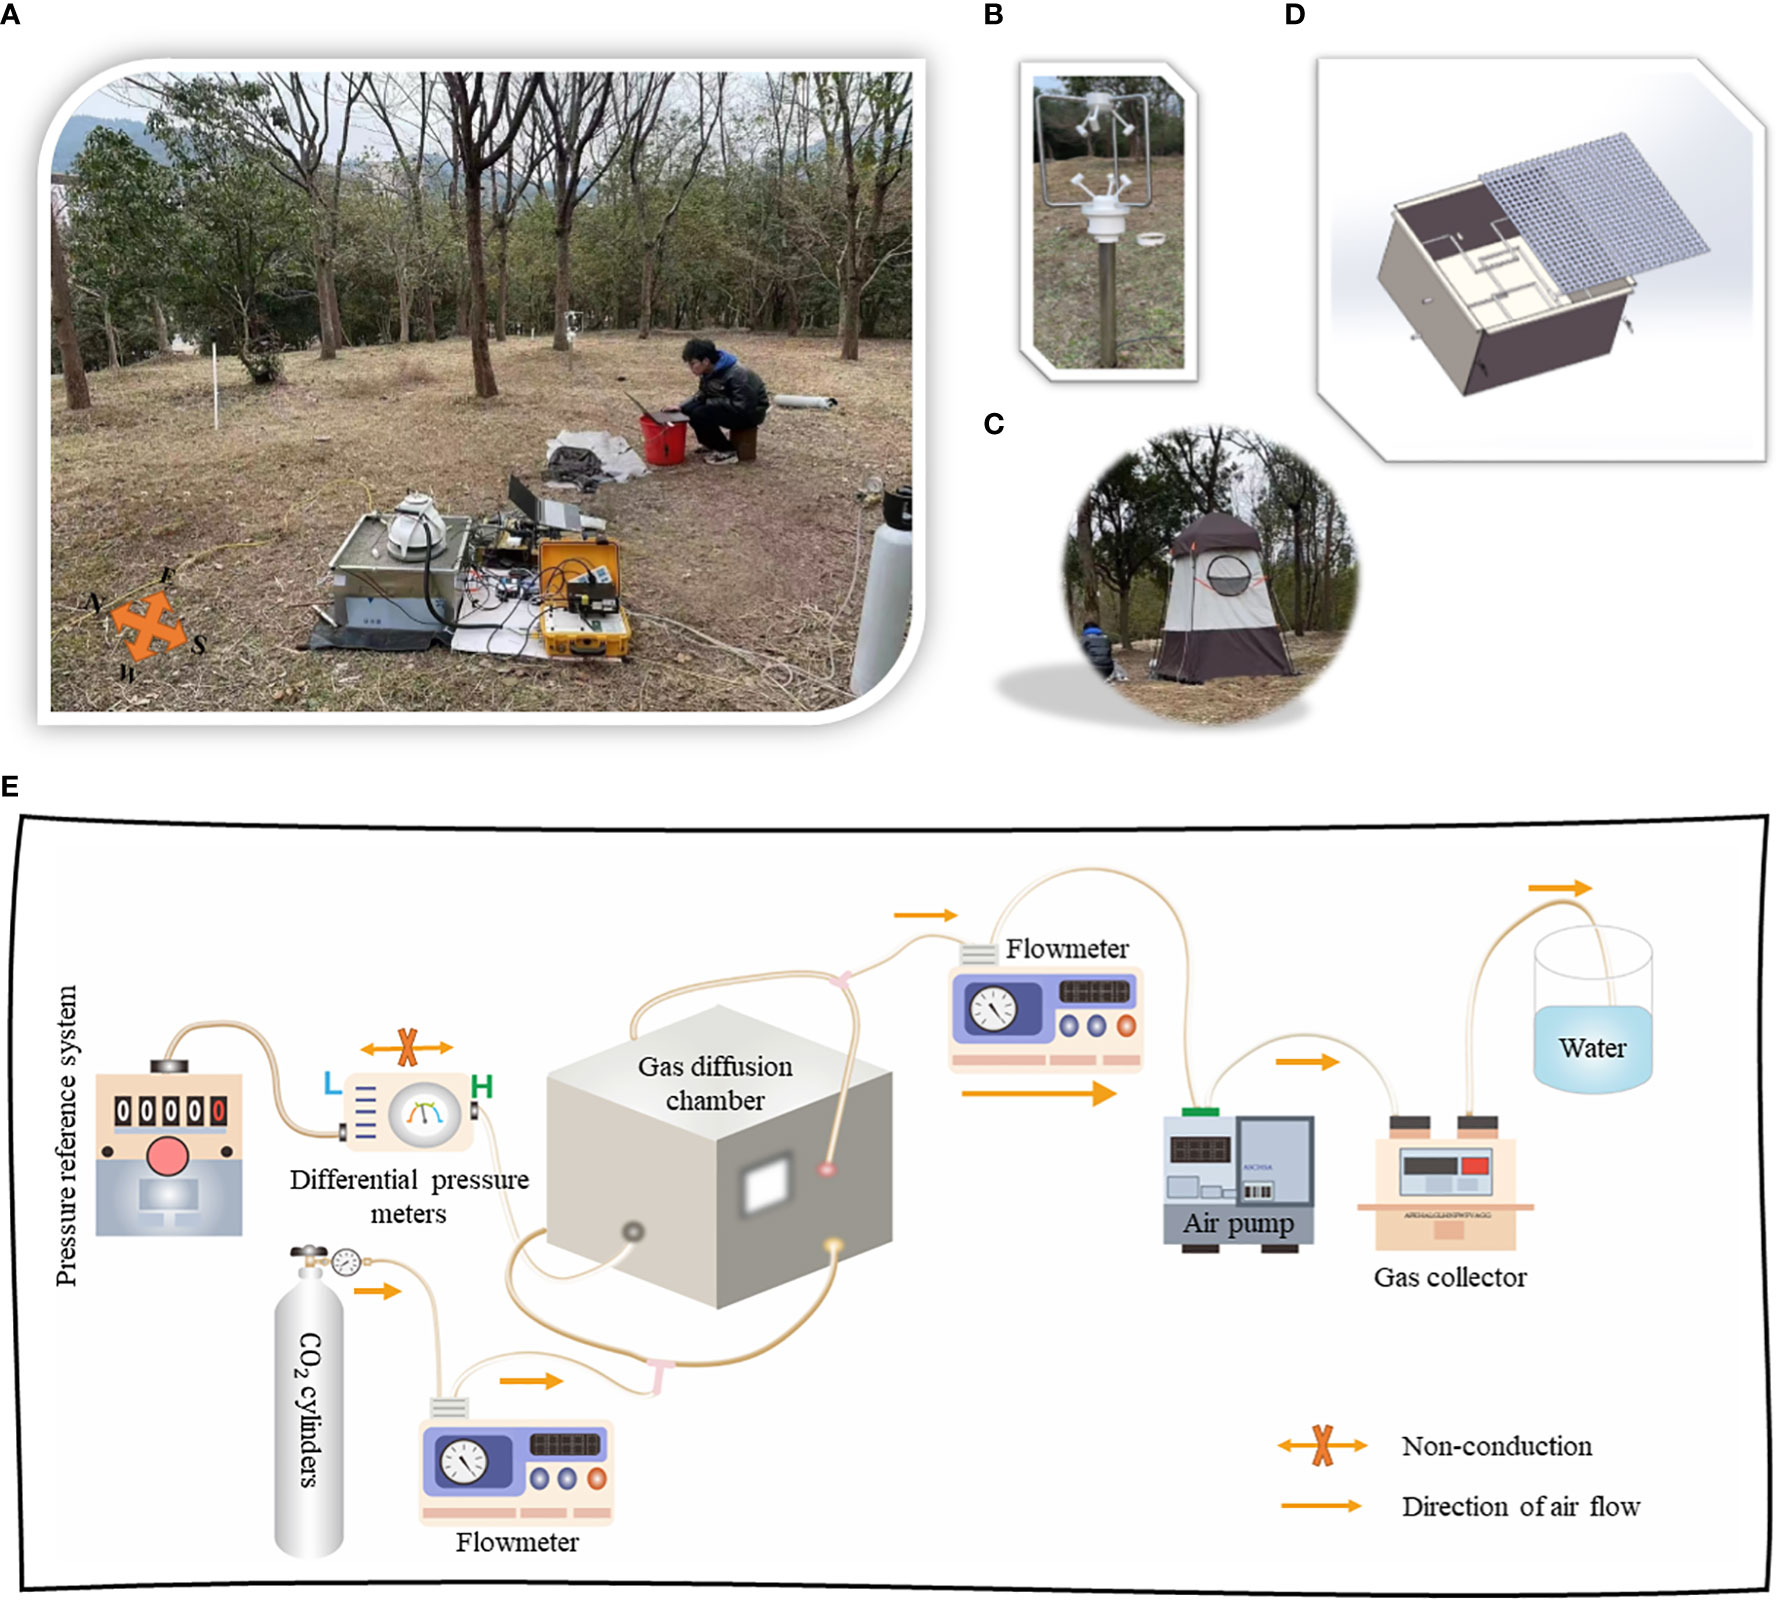
Figure 1 Experimental equipment and scene layout for this study. (A) Site layout plan of the experimental equipment. (B) The location of the anemometer installation. (C) Near-surface wind isolation equipment (tents). (D) Three-dimensional model drawing of the diffusion gas chamber. (E) Schematic diagram of the gas control system.
The soil CO2 flux control system (Figure 1E) primarily comprised a stainless-steel diffusion gas chamber (50 cm long, 50 cm wide, and 27 cm high) divided into upper and lower sections (Figure 1D). At 20 cm from the bottom, a CO2 diffusion chamber with five ventilation tubes (8 mm in diameter and 8 cm in length) was pressed onto the surrounding surface, with one at 10 cm in the diffusion chamber which served as the chamber pressure-monitoring port. The differential pressure was measured by connecting the high-pressure side (H) of the HCS3051 differential pressure sensor (Qingdao Huacheng Measurement and Control Equipment Co., Ltd., China, accuracy:0.15 Pa) to the outer end, and the low-pressure side (L) to a stable barometric reference system (Mohr et al., 2020). Two ventilation tubes at 1 and 17 cm acted as air inlets and outlets, respectively. The two external interfaces of the ventilation tubes at 1 cm were connected to one end of a precision gas flow meter (MF4003-02-O6, Nanjing Shunlaida Measurement and Control Equipment Co., Ltd., China, accuracy: ± 1.5%) using a tee adapter, and the other end of the meter was connected to a mixed CO2 cylinder with a controlled flow rate. The two external interfaces of the ventilation tube at 17 cm were connected to one end of the other precision flowmeter, which was then connected to the pump. The pump outlet was connected to an infrared gas analysis device. Five CO2 concentration sensors (DCO2-TFW1, Beijing Dihui Technology Co., Ltd., China, accuracy: ± 3% reading) were installed in the diffusion chamber at 10 cm to monitor the real-time changes in CO2 concentration in the chamber. The detection component of the soil flux-monitoring chamber was placed above the diffusion-gas chamber. The four corners of the calibration device, at a depth of 20 cm, used small brackets to hold in place a steel yarn plate that was not easily deformed. After laying the plates, sterile, inactive dry soil media were evenly laid on the plates at approximately 5 cm, and the collar of the monitoring gas chamber circle was inserted into the soil. Two CO2 sensors were then placed at the periphery of the collar in a diagonal distribution (Pavelka et al., 2018). After completing the soil arrangement, two CO2 sensors were placed on the soil surface to observe the trends in soil surface concentrations.
CO2 with molar fractions of 2,000, 4,000, and 6,000 μmol·mol−1 was used as the tracer gas in the experiments. These CO2 concentrations were similar to those of the soil surface in the field at the time of the experiments and represented the different carbon contents of the soil environment well. All experiments were performed under dry conditions and were not affected by CO2 solubility in water or the use of sterile soil media; there was no additional CO2 production or consumption. The physical properties of the three-soil media used in the experimental process are given in Table 1, whose main analytical process was still the unfolding of a clay loam with total soil porosity (Ф) 0.48, CO2 gas diffusion coefficient (Ds) 6.16×10⁻⁶ m2·s−1, air permeability (κ) 1.7×10⁻¹¹ m−2, and Hazen effective particle size coefficient (Cu) less than 1.7. Ds in a medium can be estimated from the molecular diffusion coefficient in air (D0). Two well-known models are the Buckingham (1904) and Millington and Quirk (1961) models, with and , where θ is the effective porosity. When the soil is dry, θ = Ф (Pourbakhtiar et al., 2017; Levintal et al., 2019).

Table 1 Physical properties of the soil medium used in this study: d10 and d60 are the particle diameters for which 10 and 60% of the particles (by mass) are smaller, respectively; Ф is total porosity, κ is air permeability, Ds is the diffusion coefficient of the CO2 gas in the medium, and Cu is the Hazen effective particle size coefficient.
The near-surface wind speeds were measured using a three-dimensional anemometer (EC-A3; Jinzhou Sunshine Meteorological Technology Co., Ltd., China) located approximately 5 m east of the gas control room (Figure 1A) in order to account for the prevailing northerly winds during this season and to prevent errors due to human disturbance during the experiment. The instrument was placed 1 m above the ground (Figure 1B) to study the relationship between near-surface wind speed and CO2 flux monitoring room measurements, and to check the in situ velocity profile in conjunction with a ground-based wind calculation model. The effects of wind on air chamber monitoring were controlled in the study by insulating the near-surface wind with a specially designed 1.8 m long, 1.8 m wide, and 2.6 m high tent (Figure 1C) (Pumpanen et al., 2004; Lebel et al., 2020; Fleming et al., 2021) with a breathable screen at the top and perimeter and a breathable bottom.
Based on a study of closed gas chambers, the experiments used the two most frequently used categories at this stage: non-stationary flow chambers (NSF) and non-stationary non-flow chambers (NSNF). Their basic monitoring principle is based on fitting the gas concentration in a closed gas chamber with an increase in monitoring time, and the calculation models are mainly linear and exponential. The difference is that the flow chamber was designed with a gas mixing and circulation system to prevent concentration build-up at the bottom of the chamber; this can further reduce measurement errors. The basic equations for both models are as follows:
where f [μmol·m−2·s−1], V [m3], A [m2], C [μmolCO2·m−3], and t [s] represent the flux, gas chamber volume, gas chamber area, CO2 concentration, and time, respectively. This experiment used a 30 cm diameter and 15 cm high cylindrical monitoring chamber for NSNF measurements (2–3 cm inserted into the soil during measurement). The CO2 sensor parameters in the NSNF were identical to those in the diffusion chamber with a sampling frequency of 1 Hz, and the calculation model used a simpler linear model. Soil CO2 flux data were collected using a flow-through gas chamber (Li-8100 measurement system; Li-Cor Bioscience Company, Lincoln, Nebraska, USA) and were calculated using an exponential model.
In addition, the most common linear and exponential models used for closed gas chambers were analyzed using a non-stationary diffusion model (NDFE) to closely understand the factors associated with errors arising from gas-chamber measurements. The NDFE is a flux calculation method based on a derivation of the diffusion principle, where reasonable assumptions are made about certain conditions, such as that the gases in the chamber are well mixed at any given time (Livingston et al., 2006), as follows:
where,
and where C(0,t) [μmolCO2·m−3], Cs0(0) [μmolCO2·m−3], θ, De [m2·s−1], h = V/A [m], and f0 [μmol·m−2·s−1] represent the CO2 concentration in the monitored chamber after deployment, the initial CO2 concentration in the monitored chamber, the effective porosity of the soil, effective diffusion coefficient of the CO2 (or “apparent diffusion coefficient”), effective height, and initial flux, respectively. Because many environmental factors (near-surface wind and air pressure) drive soil gas diffusion during field measurements, enhanced gas transport and convective gas transport may occur in certain special media (large grain sizes) or soil environments (atmospheric pressure fluctuations). However, in common soil types, wind-induced gas transport occurs predominantly in the form of diffusion (Levintal et al., 2019). The effective diffusion coefficient (De) was used for modeling analysis at this point (Poulsen and Sharma, 2011; Maier et al., 2012; Pourbakhtiar et al., 2017) as follows:
where Dw [m2·s−1] and De represent the wind-induced diffusion coefficient (gas transport enhancement factor) and the sum of Dw and Ds (gas diffusion coefficient), respectively.
According to the advection diffusion equation (ADE), the CO2 gas concentration does not change with time when the gas in space is in a steady state; thus, the amount of CO2 entering the control body is equal to the amount exiting the control body. The equation expression for the CO2 reference flux fr is as follows (Jiang et al., 2022):
where ∂c/∂z, Q [m3·s−1], A [m2], Cin [μmolCO2·m−3], and Cout [μmolCO2·m−3] represent the CO2 concentration gradient, gas flow rate, area, CO2 concentration into the control body (CO2 concentration in the experimental gas bottle), and CO2 concentration out of the control body (CO2 concentration in the gas collection bottle), respectively.
This study aimed to investigate and quantify the effectiveness of monitoring closed-air chambers in a wind environment under natural conditions. Owing to resource constraints, the experiments did not include multiple variables simultaneously; however, each tracer gas and other variables were studied using the same protocol. Various sensors were calibrated before the experiment. The experimental procedure was divided into three stages. 1) Unsteady state of the gas chamber: The flow rate was first controlled with the CO2 cylinder valve. Then, the tracer gas was introduced into the diffusion chamber and the inlet flow meter was observed to fine-tune the airflow precision valve to the required flow rate. At this point, the differential pressure meter readings were positive, and the pump was opened and adjusted to the appropriate gear. By controlling the precision gas valve of the outgoing gas flow meter, the airflow reading was adjusted to the same level as the incoming gas end while observing the differential pressure meter reading; the indication basically recovered. All concentration sensors were turned on to record the CO2 concentration at the corresponding location, and the 3D anemometer was adjusted to record the real-time near-surface wind speed at the site with a sampling frequency of 1 Hz. Finally, the entire gas control unit (including the differential pressure measurement system) was covered with the prepared wind-isolation equipment (tent), and the air permeability of the tent top was checked to prevent excess CO2 accumulation inside the tent, which could affect the results of the experiment. 2) The gas concentration was observed using a computer remote-control program until the CO2 concentration in the diffusion chamber reached a steady state, as indicated by a <1% average change in the diffusion chamber over 20 min. The soil CO2 flux was calculated according to the ADE [flux = flow rate×(inlet CO2 concentration−outlet CO2 concentration)]. To verify the stability of the experiment and test the monitoring of closed air chambers unexposed to wind, two chambers (NSF and NSNF) were placed on the control unit, and multiple values were recorded and compared with the control system fluxes. The NSF system was set to 2 min for continuous monitoring of 3–4 values, and the NSNF system was set to 3–5 min to prevent unnecessary errors arising from long monitoring periods. 3) Exposure to wind after the gas chamber reached steady state: At a suitable time (when near-surface winds were significant), the tent was gently lifted and moved approximately 5 m southwest of the gas control room to prevent blocking near-surface winds. At this point, the soil CO2 flux monitoring gas chamber measurement experiment was initiated, and multiple values were recorded. Data were collected in staggered batches using NSF and NSNF, depending on the wind conditions at the site. The control chamber would be re-covered after 2–3 cycles and, after waiting for 30 min, Step 3 would be repeated.
Near-surface winds, particularly gusts, have high frequency and short-duration characteristics. To capture information about the correlation between near-surface winds and soil gases, and to explore the response of gases in the soil to near-surface winds, data were analyzed using the wavelet coherence method and MATLAB (MathWorks, R2020b, Natick, USA) software. The closed-air chamber monitoring model was solved, and the error was analyzed using Mathematica 12 (Wolfram Research Inc., 2020, Rhode Island, USA).
Figure 2 shows the near-surface wind data from the experimental site in January 2022: Figures 2A–D show the wind speed during the day (9:00–17:00), and Figures 2E, F show the wind speed at night (19:00–23:00). The winds at the site were predominantly northerly, consistent with the expected prevailing winter winds. The wind speed measured near the surface during the day was predominantly 0.5–1.0 m·s−1, which moved the surrounding leaves slightly, whereas the wind-free frequencies were 16.53%, 11.93%, 27.74%, and 19.87%. The wind speed at night was predominantly 0–0.5 m·s−1 (imperceptible to humans), with wind-free frequencies of 32.76% and 50.48%. The near-surface winds were relatively calm at night, with the proportions of both wind speed and wind moments being significantly lower than those during the day. In addition, wind days accounted for the majority of days, in conjunction with the results of relevant meteorological studies (Kong and Zhang, 2021), and windy conditions were the norm in field monitoring. According to the daytime wind speeds, the values were less than 1.0 to 1.5 m·s−1. Combined with the wind speed profile calculation formula (Levintal et al., 2019), the results (2.9–4.3 m·s−1) were less than the wind speed provided by the local weather station (4–6 m·s−1), so there was an underestimation. This may have been related to the scattered surrounding trees, which partially insulated from the wind; therefore, the experiments were conducted using near-surface winds in the field as the subject of study.
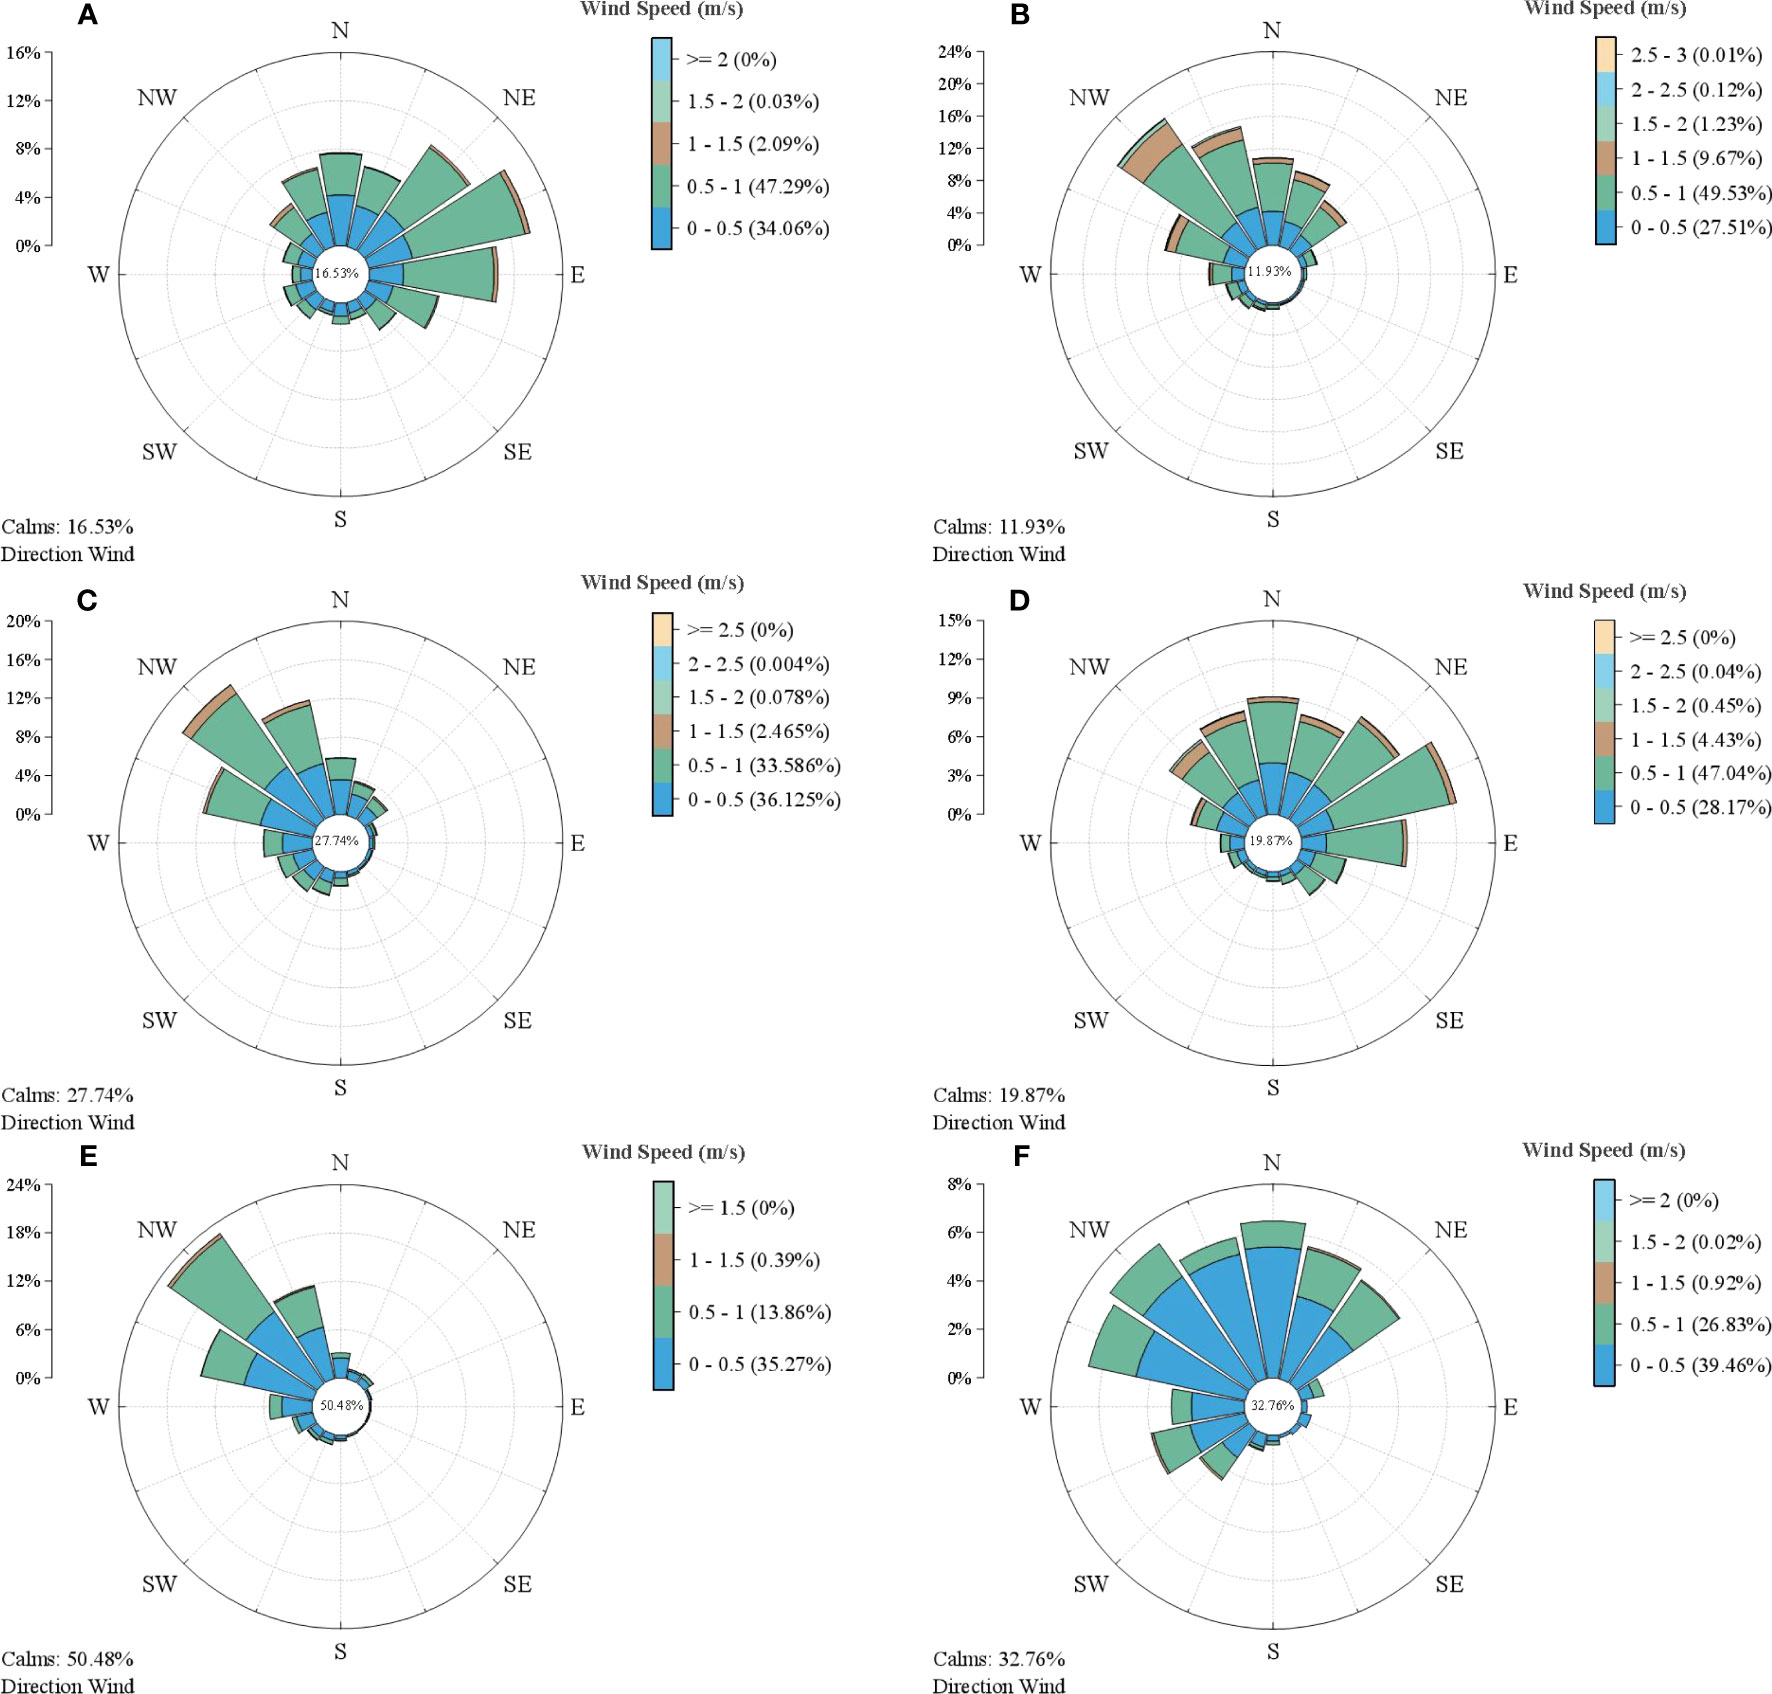
Figure 2 Wind rose diagram at 1 m from the surface at the field experiment site (January 2022). (A–D) Near-surface wind-related data during the day (9:00–17:00). (E, F) Near-surface wind-related data at night (19:00–23:00). The central band represents the calm (no wind) state; the colored bars represent the different wind speeds and the data represent the proportion of the corresponding wind speed; the circular concentric circles and the coordinating scale represent the proportion of wind speeds in different directions.
Field experiments were performed at similar temperatures (close to 10°C). The concentration profiles in the diffusion gas chamber measured using the five CO2 sensors in this environment are shown in Figure 3. Experiments using different tracer gas concentrations indicated that the trends of CO2 concentration within the gas chamber were identical, and that the values at steady state were proportional to the tracer gas concentration. This simulated soil environments with different carbon contents, and allowed us to explore a range of soils, from barren to rich. In addition, the concentration curves for 4,000 and 6,000 μmol·mol−1 tracer gases showed relatively clear plateauing periods, which indicated that the conditions for reaching steady-state concentrations within the diffusion chamber were valid and demonstrated that the tent acts as a barrier to near-surface winds. However, the curve for 2,000 μmol·mol−1 tracer gas showed relatively fluctuating trends, mainly because of the high wind speed on the day of the experiment (the local meteorological office indicated a north-westerly wind of 5–6 m·s−1), which was also shown in Figure 2B (maximum wind speed above 3.0 m·s−1), and fluctuating differential pressure inside and outside the gas chamber. In addition, the tracer gas concentration might have been relatively low during the experiments. When the gas concentration in the diffusion chamber reached stability, the CO2 fluxes in the diffusion chamber calculated from the CO2 concentrations in the collector bottle were 998, 1,797, and 2,498 μmol·mol−1, which correspond to 1.79, 3.93, and 6.25 μmol·m−2·s−1 flux, respectively.
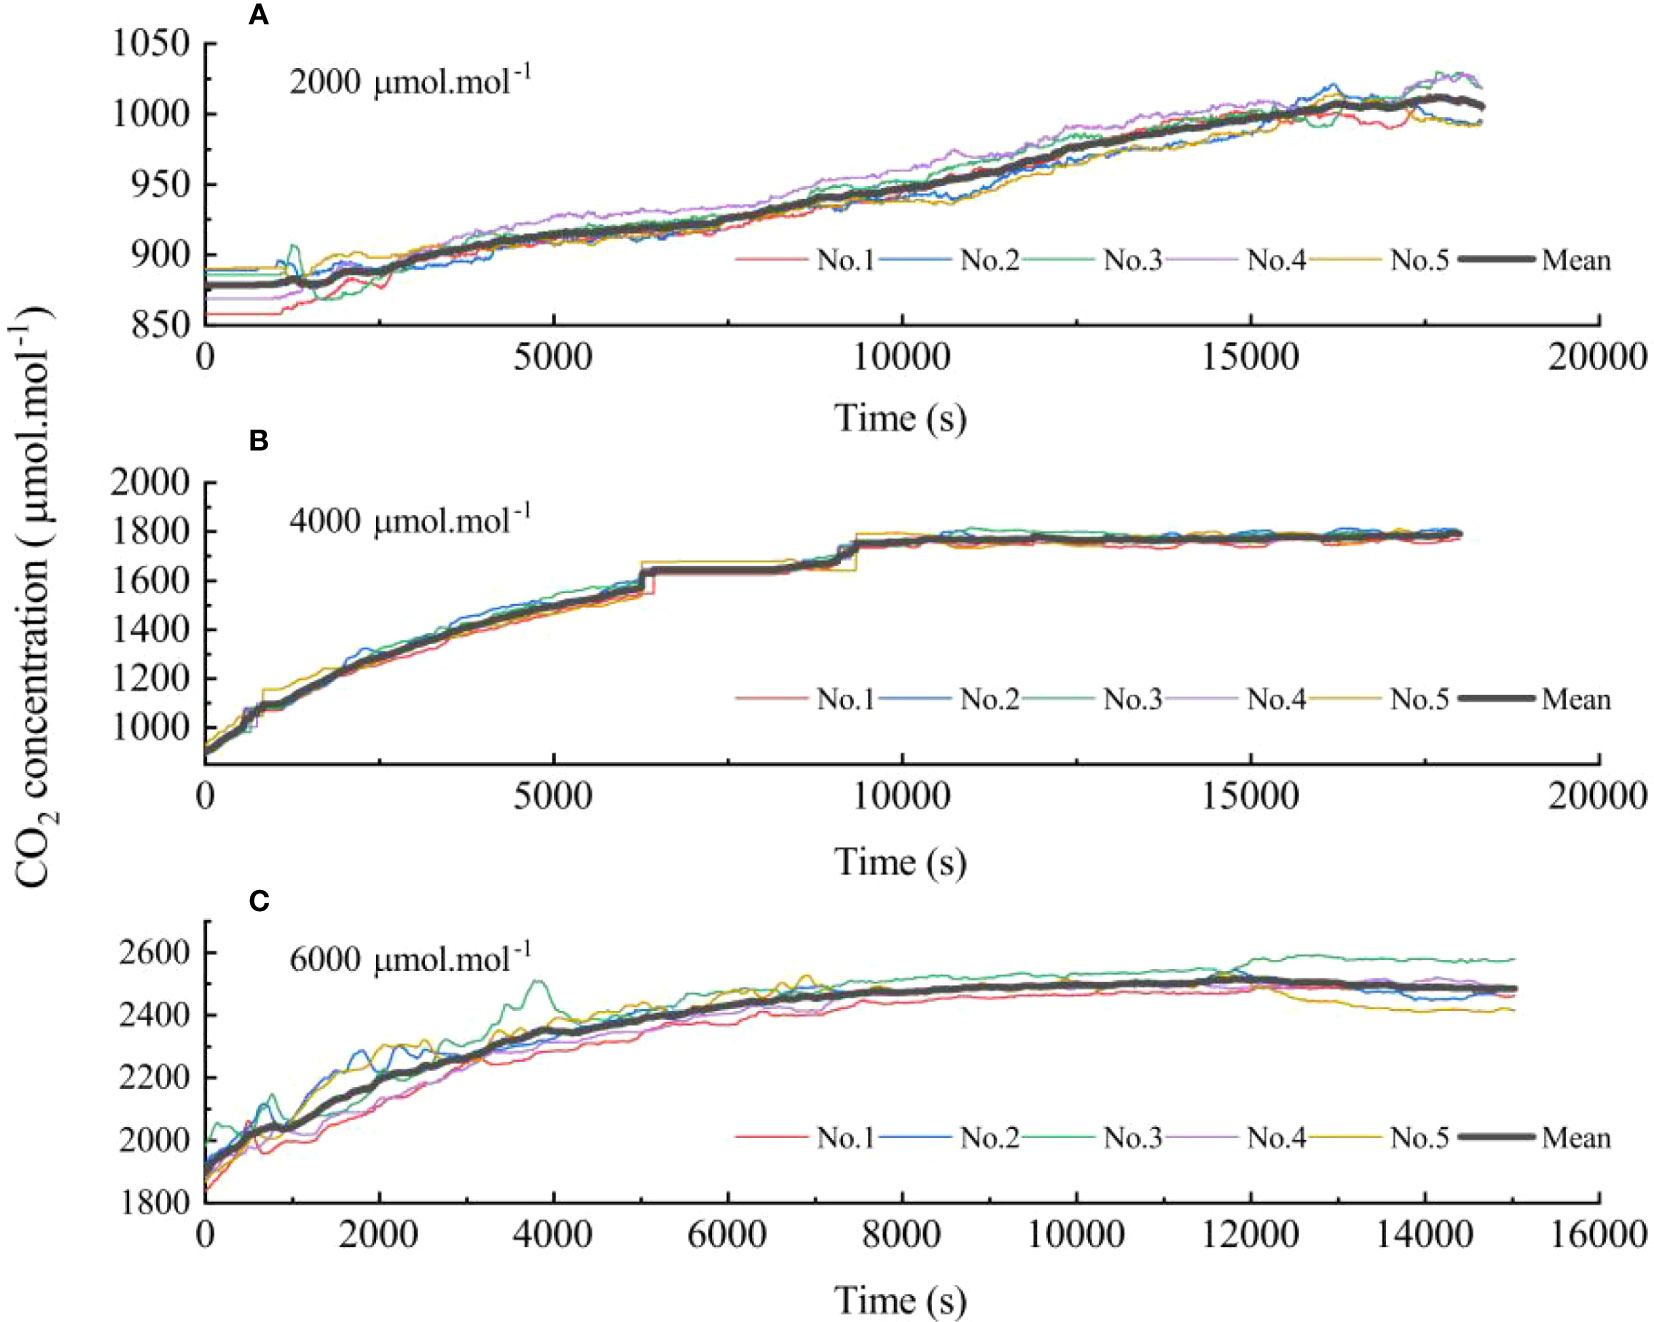
Figure 3 Curve of CO2 concentration in diffusion chamber with time during the experimental process (inlet and outlet gas flow: 0.6 L·min−1). (A–C) CO2 tracer gas concentrations of 2,000, 4,000, and 6,000 μmol·mol−1, respectively. The five different colors represent the readings of five CO2 sensors in the diffusion chamber, and the thick black line represents the average CO2 concentration in the diffusion chamber.
Before exploring the effect of near-surface winds on closed-chamber measurements, the performance of the closed-chamber monitoring was assessed. Figure 4 shows the results of the closed-chamber CO2 flux monitoring at different tracer gas concentrations and flow rates (0.3 and 0.6 L·min−1) with negative flux errors and an underestimation effect. The NSF stability was significant during the measurements, with no discrete points. The coefficient of variation (CV) for a single measurement remained between 1.1 and 1.3, indicating a good fit to the measured concentration data. The CO2 flux measurement error fluctuated less and exhibited a decreasing trend with increasing tracer gas concentration, with a maximum error of<8%. In contrast, the CO2 flux from multiple measurements in the NSNF was more discrete. This was largely related to the flux model used and the time period chosen for the fitting calculations, which generated random errors in the flux measurements. The overall trend in the flux measurement error was positively correlated with the tracer gas concentration, with errors being greater than those measured by the NSF (20–30%). There was a relatively large flux error for a CO2 molar fraction of 2,000 μmol·mol−1, probably because the gas concentration within the diffusion chamber did not reach a steady state. In addition, the flux errors at different gas flow rates were not significantly related, and the incoming and outgoing gas flow rates did not significantly affect the CO2 flux measurements.
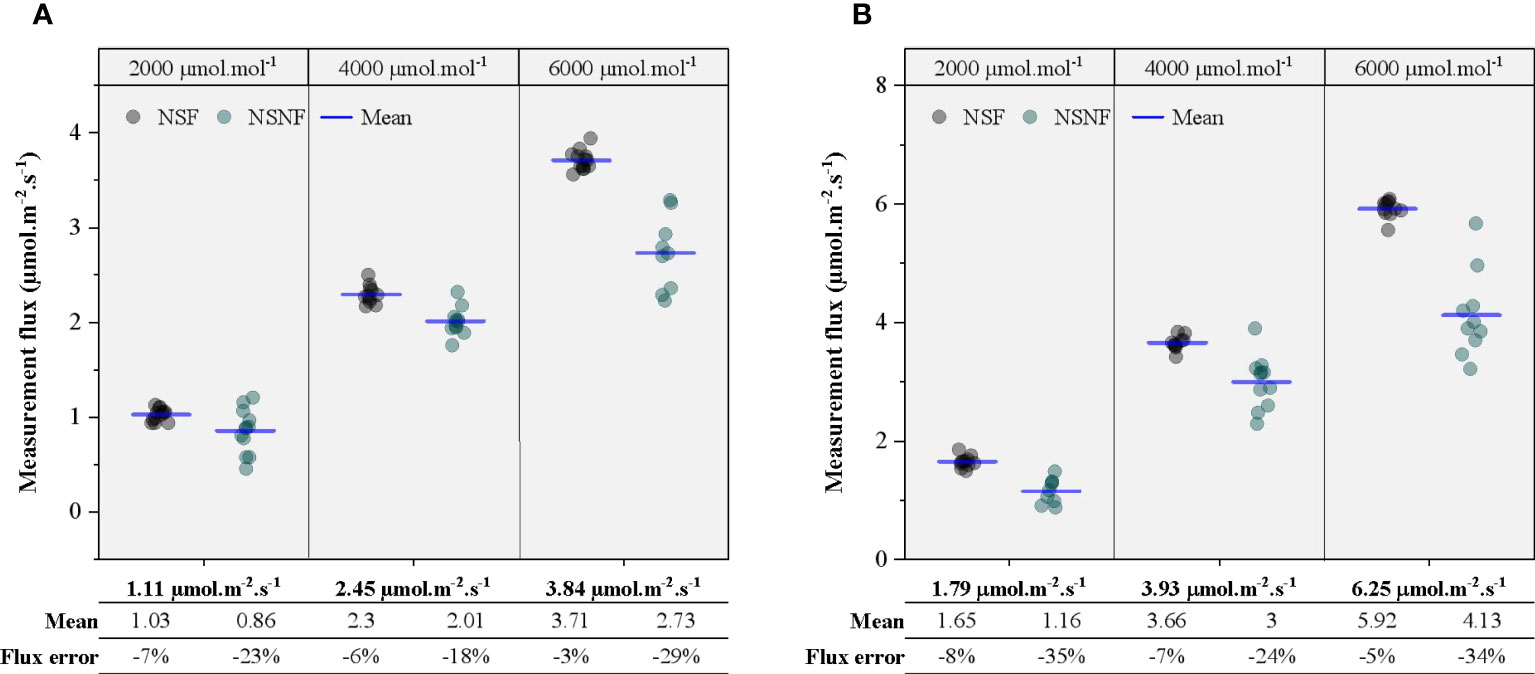
Figure 4 Flux statistics monitored in the enclosed air chamber unexposed to wind. (A, B) Inlet and outlet tracer gas flow rate: 0.3 and 0.6 L·min−1, respectively. The abscissa represents the reference flux of the diffusion chamber, and the flux error is the average measured flux of the closed chamber relative to the reference flux. A negative value implies that the measured CO2 flux of the closed chamber is less than the actual flux of the control system, indicating flux measurement underestimation.
To investigate the response of CO2 concentrations to near-surface wind speeds at different locations, a gas control chamber with concentrations in a steady-state phase was exposed to wind (tent removal), and experimental data from a randomly selected hour were analyzed (Figure 5). Figures 5A–D represent the near-surface wind speed, CO2 concentration at the soil surface, CO2 concentration in the soil, and CO2 concentration in the diffusion chamber, respectively. The shaded areas in Figure 5 show the response relationship between CO2 concentration variations and near-surface wind. When the wind speed was greater than 0.8 m·s−1, the CO2 concentration on the soil surface and inside the diffusion chamber showed a weak response, with the concentration on the soil surface increasing and the corresponding concentration inside the diffusion chamber decreasing, with the most obvious change occurring from 1,700 to 2,200 s. However, when the wind speed was greater than 0.8 m·s−1, the CO2 concentration in the soil layer increased rapidly; the response was significant, showing a stable change pattern. This phenomenon is probably due to the gas concentration at the soil surface being more pronounced owing to wind-induced turbulence, which greatly increases the gas exchange rate and rapidly dilutes CO2 at the soil surface. The diffusion chamber, because of the high concentrations and the isolation of the soil layer from near-surface winds, had relatively stable gas concentrations (10–20 μmol·mol−1). In contrast, the CO2 concentration in the soil layer fell between the first two layers, with relatively favorable concentrations and easily observable trends.
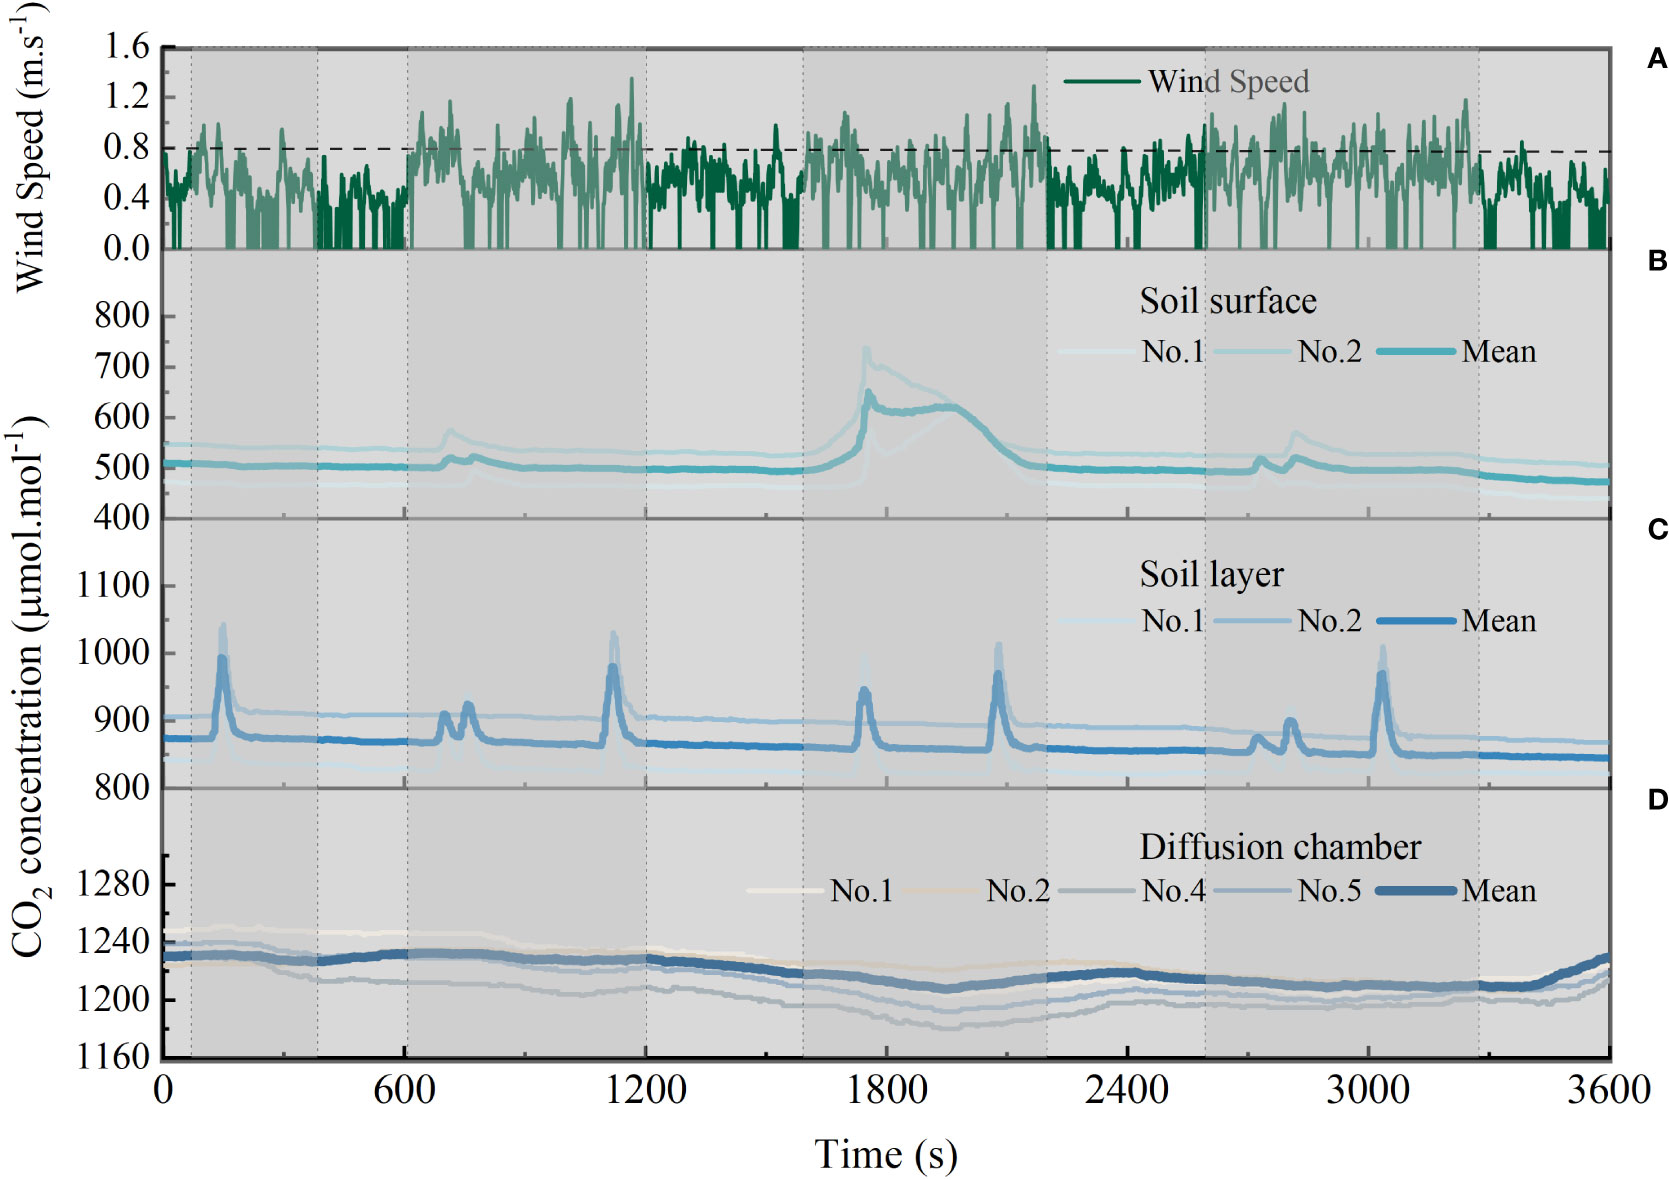
Figure 5 CO2 gas response relationship to near-surface winds in the gas control system (random 1 hour). (A) Total wind speed data at 1 m from the surface over time. (B–D) CO2 concentration change at the soil surface, soil layer, and diffusion chamber, respectively. The different NO symbols in the figure represent the different layers of the sensor.
Wavelet coherence analysis was used to clearly observe and understand the CO2 response relationship between near-surface winds and soil layers (Figure 6). Figure 6 shows significant covariance in the 32–128 s and 512 s bands of the period, indicating a strong correlation between them, corresponding to the shaded areas shown in Figure 5. In the 100–200 s, 1,100–1,200 s, and 1,300 s periods, the significant cross-wavelet power in the 32–64 s band was approximately 0.75–0.85, with the arrow (vector) pointing to the right and remaining essentially horizontal, indicating that the CO2 concentration response was synchronized with wind speed changes. Other periods in the same band (32–64 s) showed opposite phase differences (arrows point to the left), indicating a lag in the response of CO2 in the soil to near-surface winds. In the 950–1,300 s period, the covariance for the 128 s band was approximately 0.85, showing a phase angle of approximately 270°, indicating a 30 s lag in the concentration-response time.
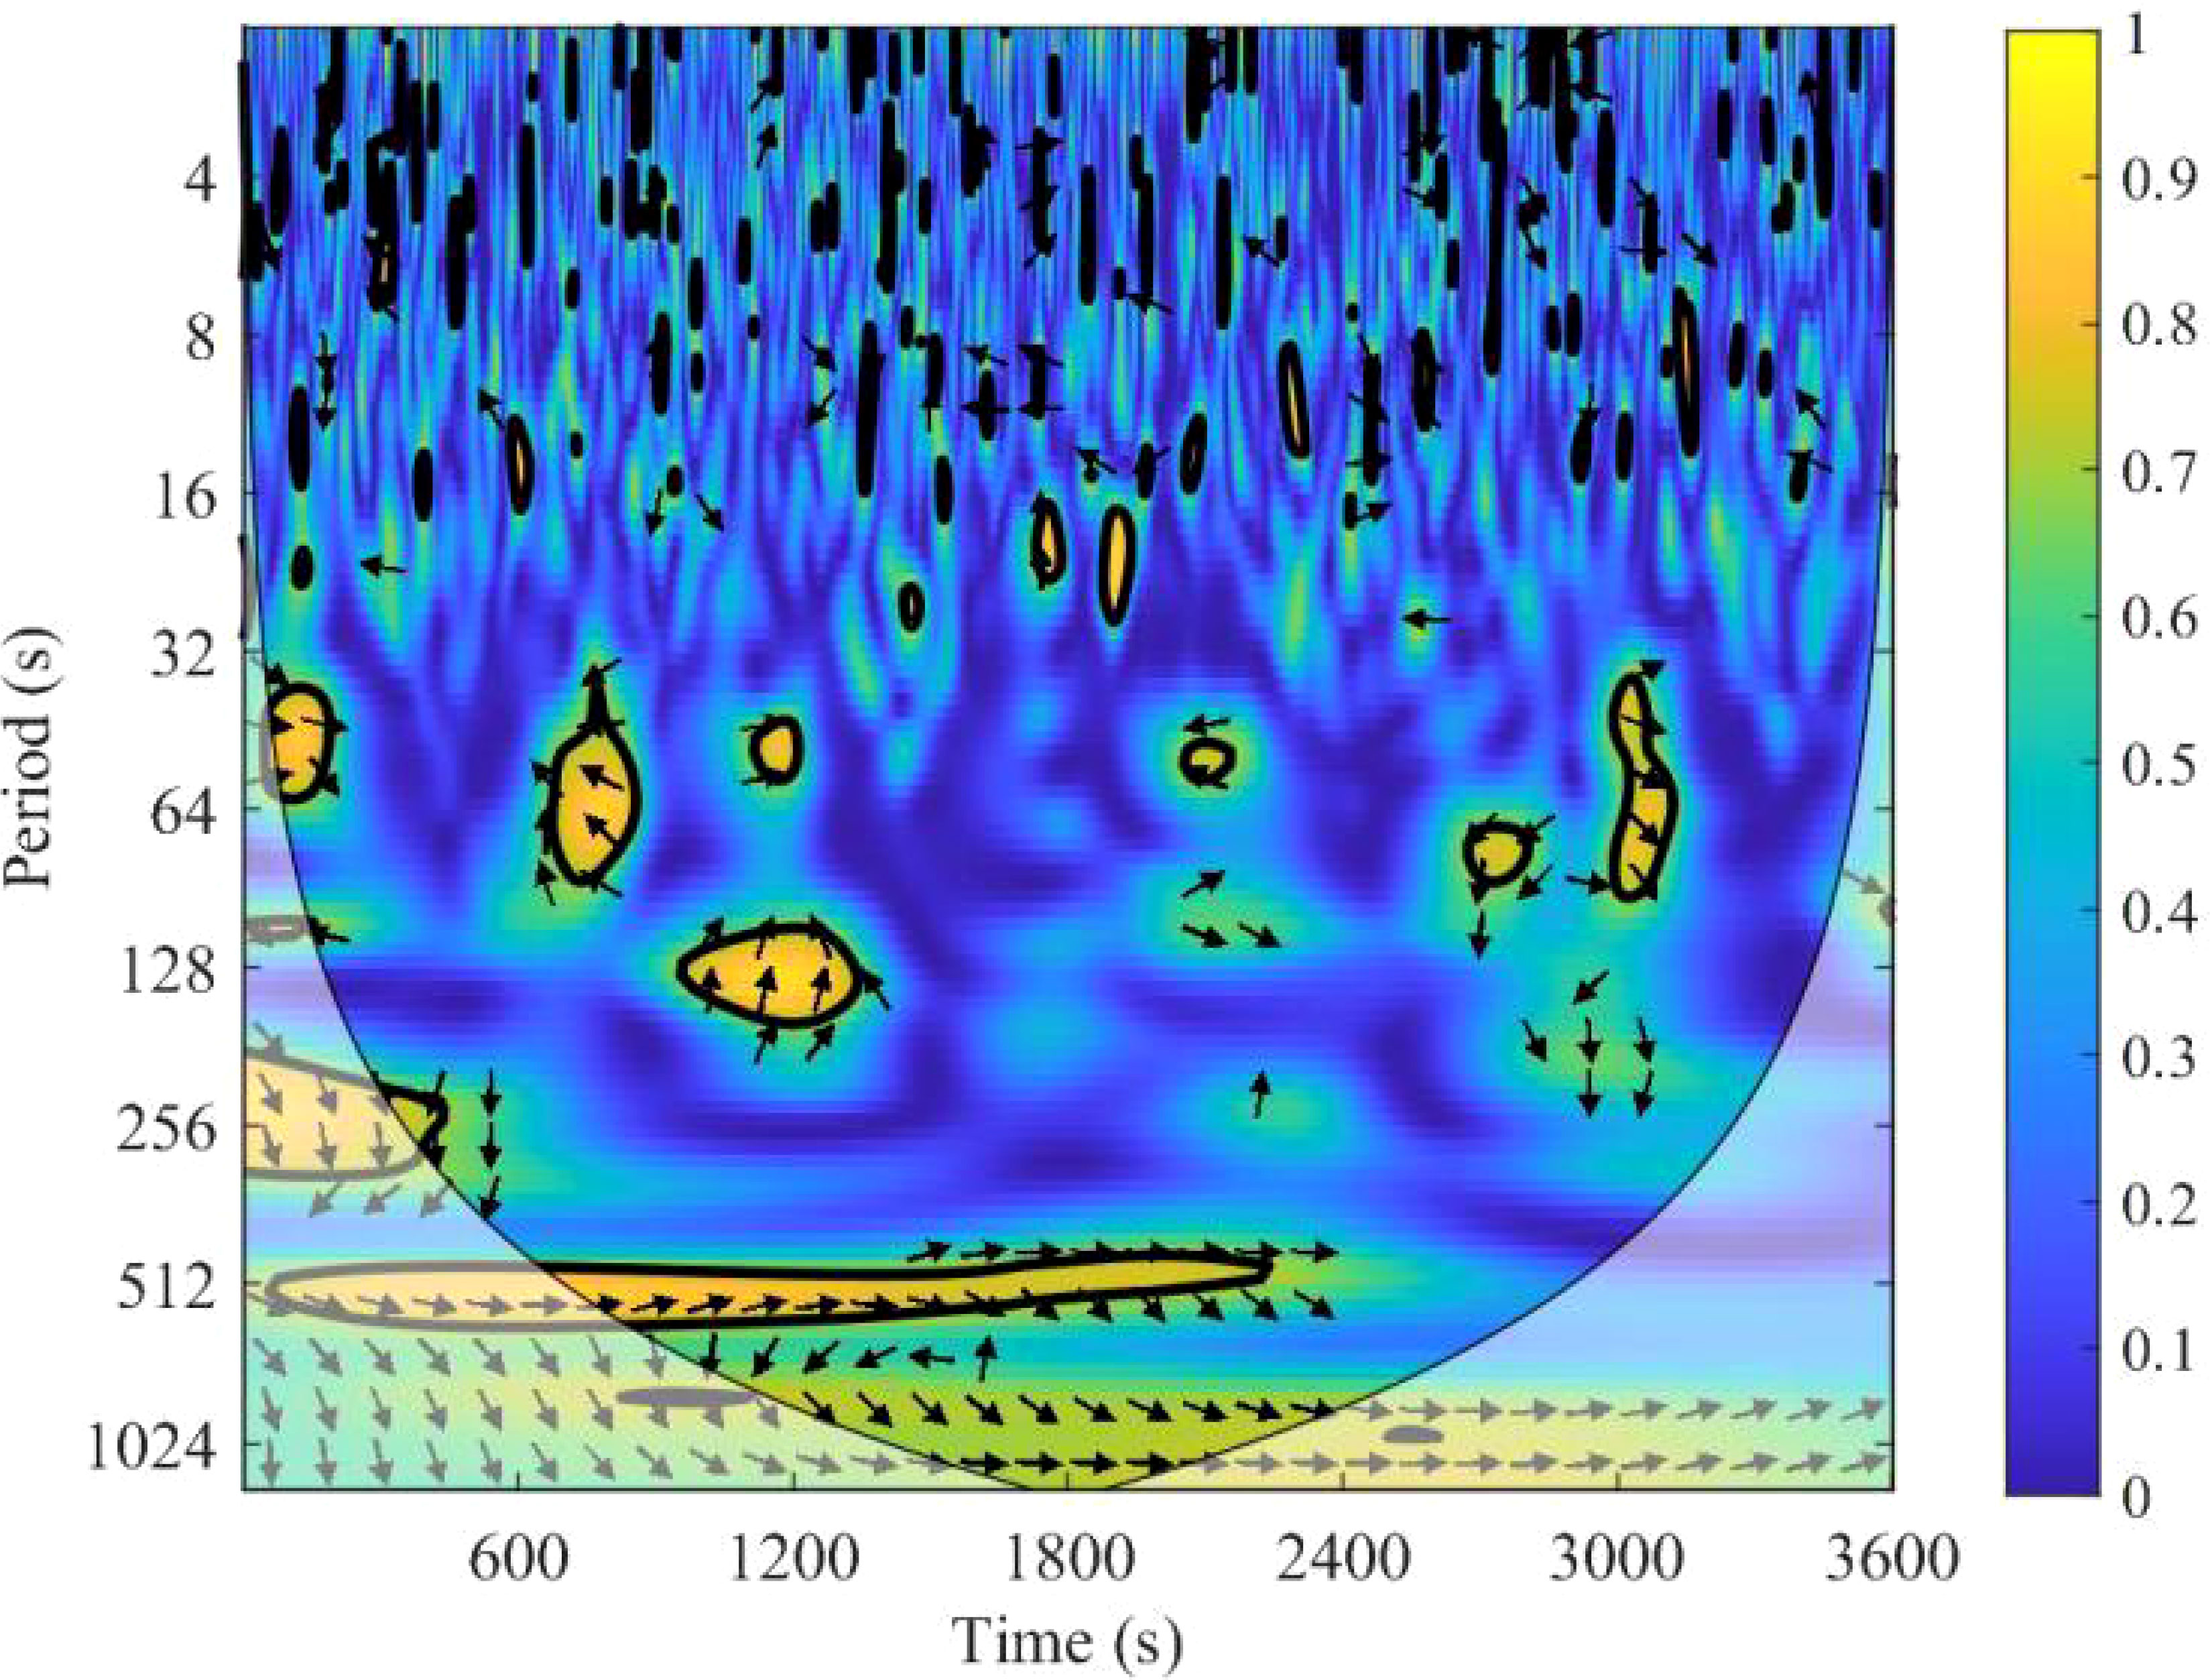
Figure 6 Wavelet coherence analysis (WCA) to test the effect of near-surface winds on CO2 concentrations in the soil layer (same time period as Figure 5). The yellow areas with black contours represent highly significant temporal correlations with a 5% significance level. Shaded areas indicate cones of influence, where correlations are not affected by edge effects. The arrows indicate the phase angle relationship between the two time-series. The horizontal arrows to the right and left (phase angles 0° and 180°, respectively) indicate that the two time-series are in and out of phase, respectively.
The reliability of the CO2 increase in the soil layer can be verified by clarifying the relationship between near-surface winds and the gas response in the soil layer. According to the data from 1,700 to 2,200 s in Figures 5C, D, the near-surface wind induced a 100–150 μmol·mol−1 increase in CO2 concentration in the soil layer, and a corresponding 10–20 μmol·mol−1 decrease in CO2 concentration in the diffusion chamber. The ratio of their effective heights was 3/25, which was verified by the law of conservation of component masses, consistently explaining the induction effect of near-surface winds on the diffusion chamber.
Figure 7 shows the results of CO2 flux monitoring for a wind-exposed closed gas chamber, with the reference flux calculated from the CO2 concentration (gas collection bottle) corresponding to the measurement period in the closed gas chamber, thus avoiding errors caused by fluctuations in the CO2 concentration with wind. Since the gas control room was exposed to the wind, the gases in the diffusion chamber fluctuated with the surface wind and their concentrations changed (10–40 μmol·mol−1), which led to corresponding fluctuations in the reference fluxes. Figure 7A shows that the measurements for the NSF were relatively stable, but the CVs for a single monitoring session (1.6–1.9) were significantly greater than those for the chamber unexposed to the wind, indicating that the near-surface wind affected model fitting. The NSNF measurements were unstable and closely related to the time period chosen for concentration fitting. Both chambers also suffered from measurement underestimation (both flux errors were negative), which was more significant than that measured for a chamber unexposed to wind. This result is also clearly observed in the flux measurement error plot (Figure 7B), where the errors measured for the corresponding air chambers unexposed to wind are higher than those measured for the chambers exposed to wind. In addition, the CO2 flux measurements in the NSF were negatively correlated with the tracer gas concentration, and the relative error decreased as the concentration increased, whereas the measurements in the NSNF were not significantly correlated (Figure 7B). However, when combined with different flow rates, the CO2 flux measurements were generally positively correlated with the tracer gas concentration, with the error (underestimation) increasing (significantly) as the concentration increased. This phenomenon occurred primarily because the gas mixing and flow system in the NSF was designed to prevent concentration build-up at the bottom of the chamber, reduce the gas concentration gradient, and further reduce measurement errors. Diffusion still dominates the gas transport mechanism with increasing concentration, with non-diffusive transport being relatively weak or even negligible. However, high concentrations substantially narrow the diffusion gradient in the concentration build-up in the air chamber, which is not conducive to monitoring NSNF. Moreover, the relative errors measured in the three gas chambers exposed to wind were significant, being 16–24% larger than those in the chambers unexposed to wind (Figure 7B). When combined with near-surface wind speed data, the corresponding half-hourly average wind speeds at these three locations increased, further increasing the flux measurement errors, which is consistent with the phenomenon reported by Maier et al. (2019).
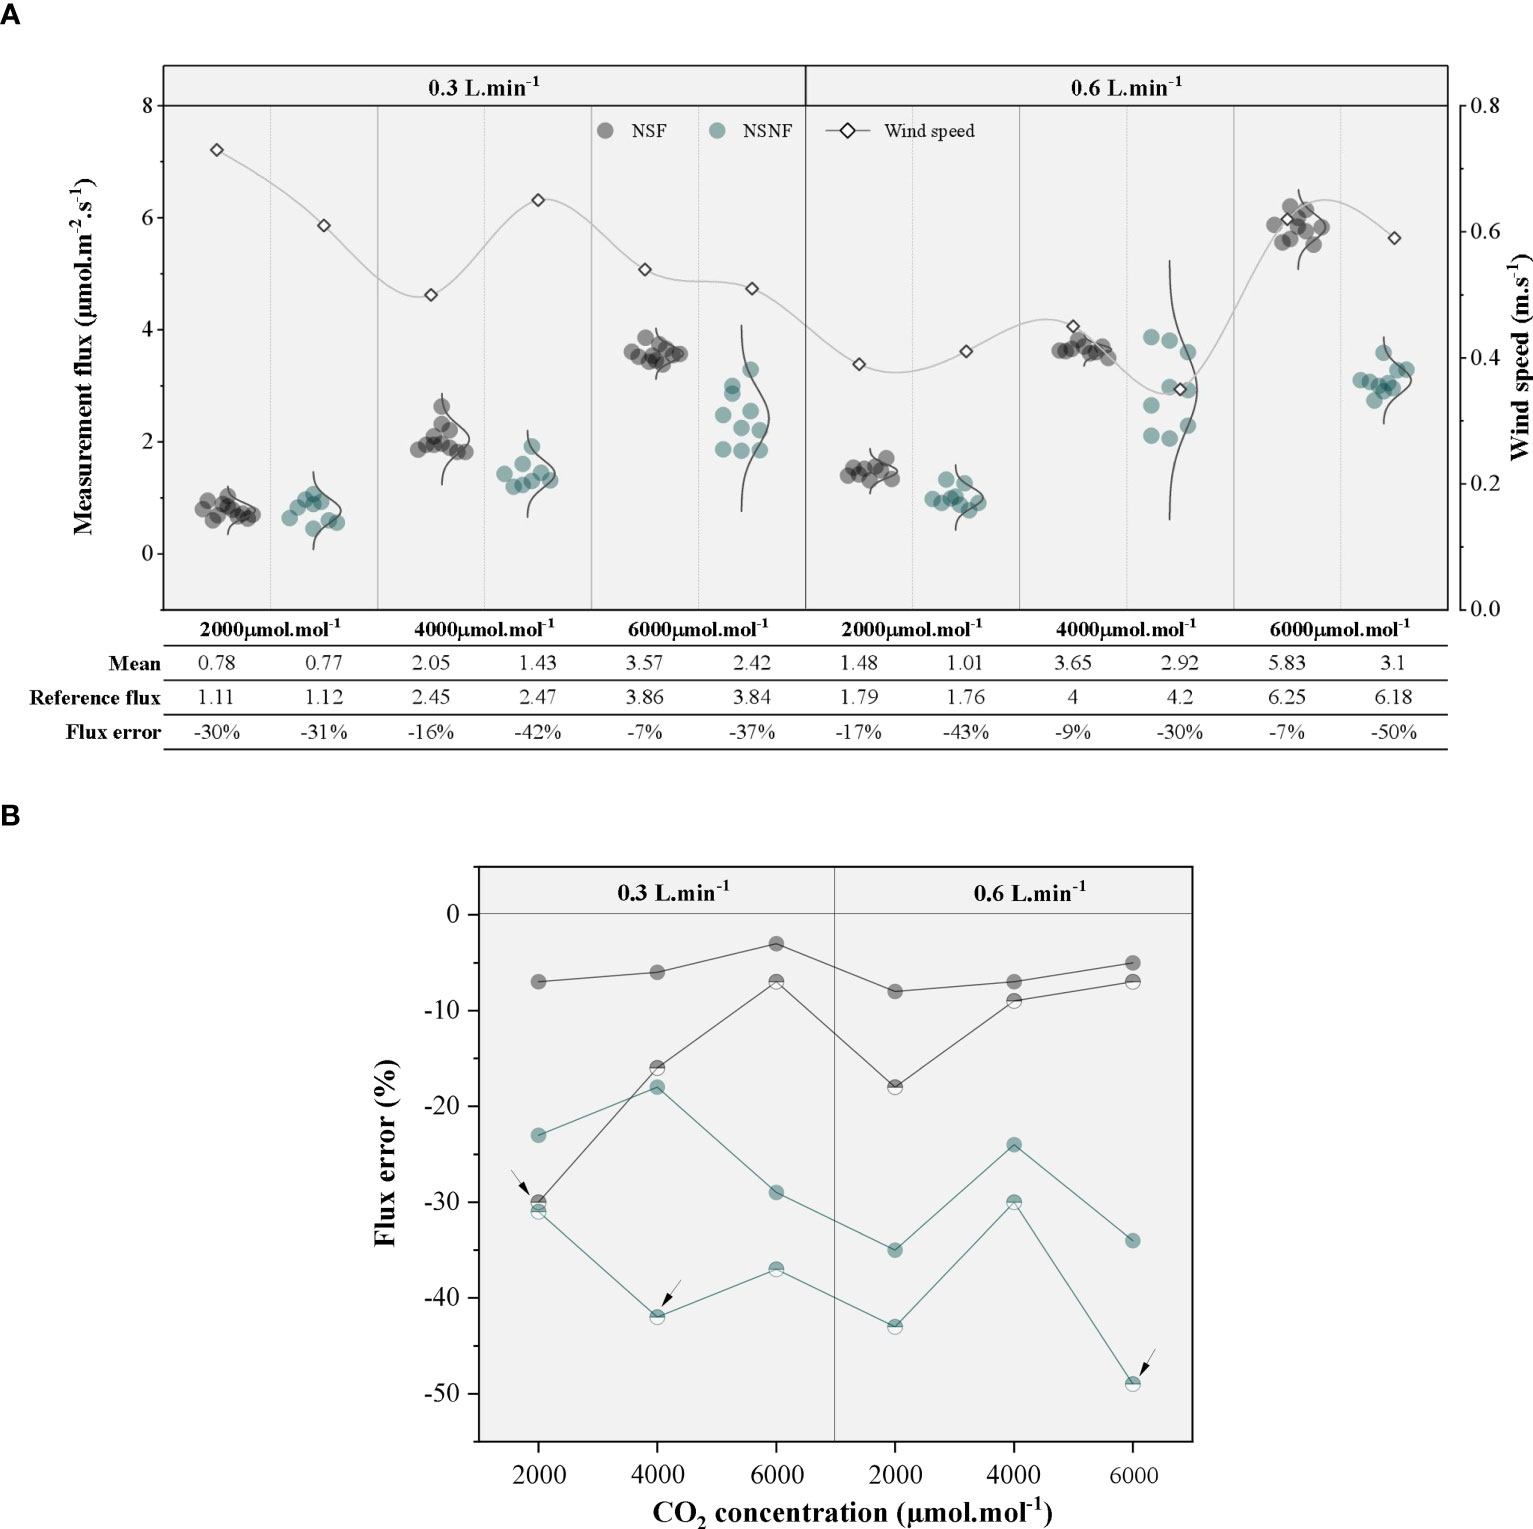
Figure 7 Plot of flux statistics monitored in the closed air chamber exposed to wind, with comparison of flux errors. (A) The flux statistics measured in the closed chamber at different CO2 gas concentrations and flow rates. The horizontal coordinates represent the reference flux of the diffusion chamber. The flux error is the average measured flux of the closed chamber relative to the reference flux. The white dots of the diamond represent the average wind speed during the monitoring of the closed chamber. (B) The error in CO2 flux measurements for closed gas chambers for different experimental variables (gas flow, concentration, and wind speed), where black represents NSF chambers, dark green represents NSNF chambers, solid circles represent chambers not exposed to wind, half-circles represent chambers exposed to wind, and arrows represent significant effects of wind on closed chamber flux measurements. Negative values have the same meaning as before.
Assuming that the design of the closed chamber with regard to the differential pressure balance port is reasonable, the internal environment of the measuring chamber can be maintained consistently. At this point, we analyzed the most commonly used linear and exponential models for closed gas chambers using NDFE, thus expanding Eq. 2 in the power-series form. The results were as follows:
where C(0,t) [μmolCO2·m−3] represents the CO2 concentration in the monitored chamber after deployment. Comparing the linear and exponential models using Eq. 6 reveals that it is simplified by omitting the complex higher-order terms of the power series expansion, which leads to a bias in the calculated flux (f0) that causes it to be lower than the actual flux. By combining the relevant parameters, it can be calculated that the model for being unexposed to wind produces 18.7% (Lin, 5 min monitoring) and 9.8% (Exp, 2 min monitoring) errors, which are similar to the errors in the measurements for the air chamber unexposed to wind. A positive correlation between the error and the air chamber monitoring time is shown in Figure 8. Moreover, Eq. 6 indicates that the effective height of the gas chamber and the relevant parameters of the soil medium (such as porosity and diffusion coefficient) influence the measurement results; an increased effective height of the gas chamber reduces the monitoring error, while the porosity and diffusion coefficient are positively correlated with the monitoring error. A detailed analysis of the errors arising from air chamber monitoring in the absence of wind disturbance is not underway, but has been reported in several previous studies (Gao and Yates, 1998; Livingston et al., 2006; Venterea and Baker, 2008; Sahoo and Mayya, 2010).
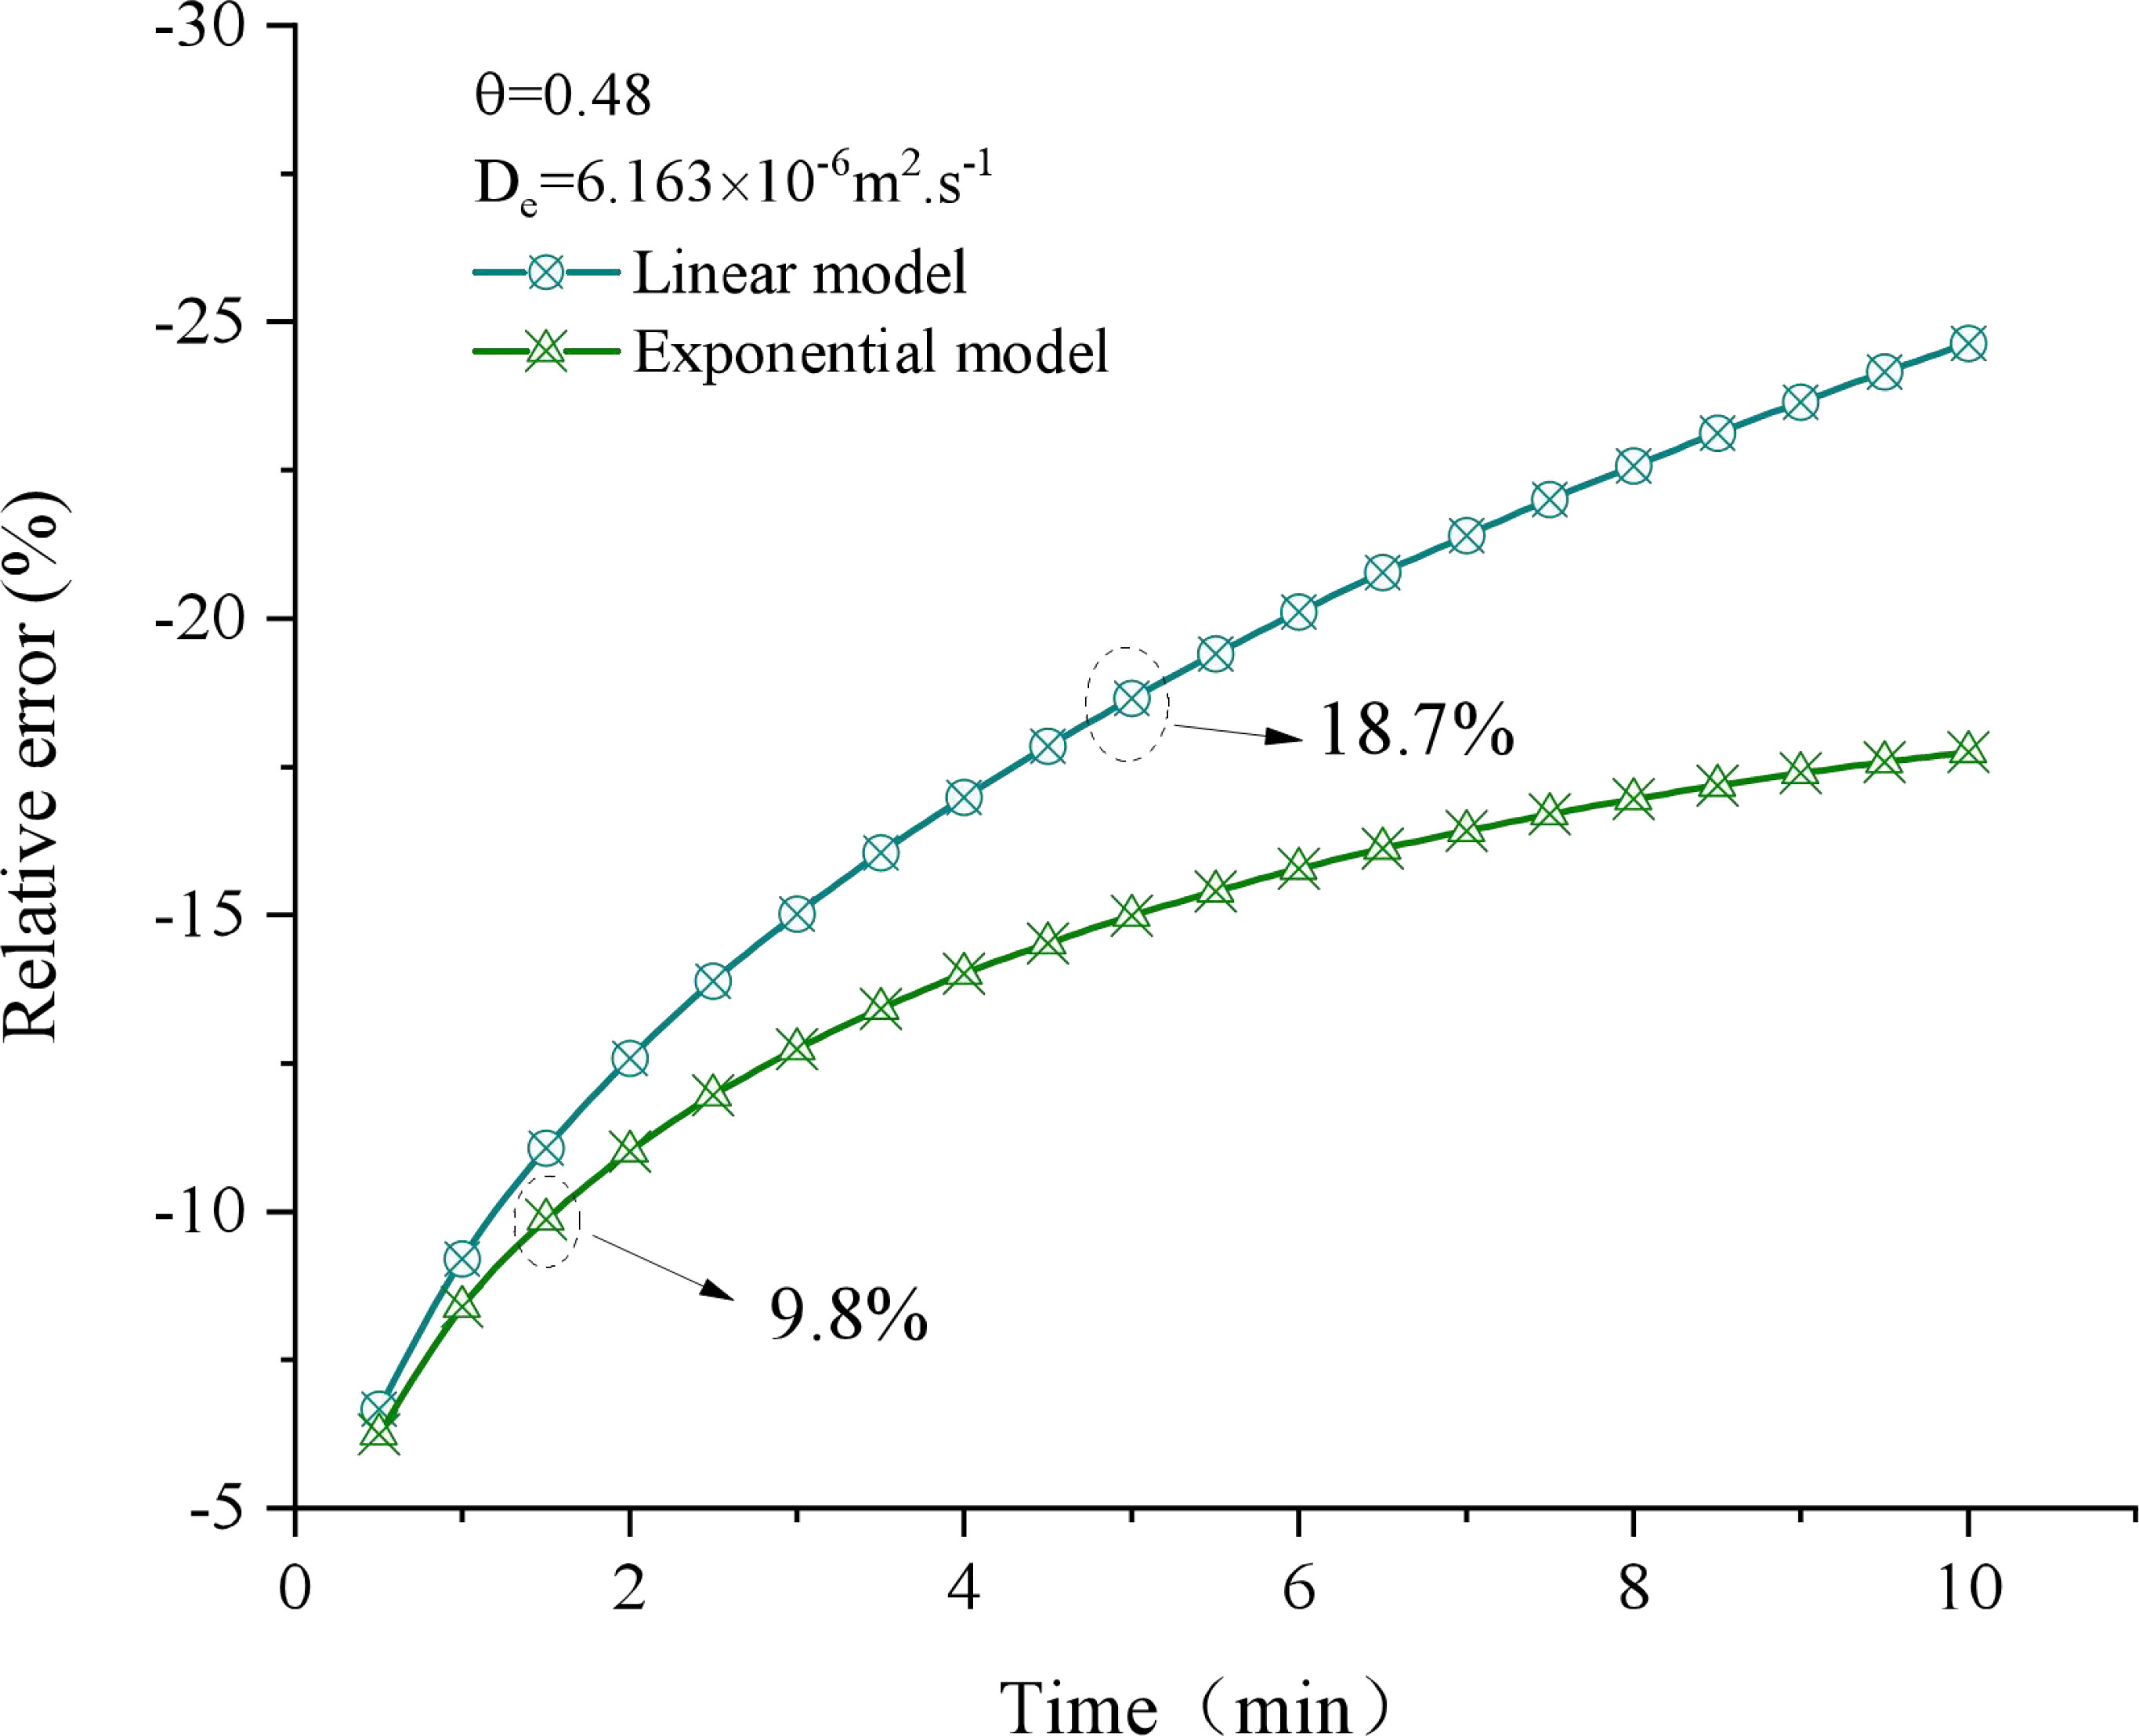
Figure 8 Correlation between the accuracy of the flux (f0) calculation for the selected model and the monitoring period of the closed air chamber. The data marked on the graph represent the flux error corresponding to the deployment time of the selected model in the closed chamber. Negative values indicate that the flux calculated by the selected model in the closed chamber are lower than those calculated by the non-stationary diffusion model (NDFE).
In this study, we investigated the bias in flux calculations in a wind-influenced environment. According to previous studies, near-surface winds enhance soil gas transport; thus, the effective gas diffusion coefficient De (or “apparent diffusion coefficient”) is greater in a windy environment than that in a windless environment. To quantify the enhancement of soil gas transport by near-surface winds, the wind-induced diffusion coefficient Dw was determined by recording the CO2 concentration change rate in the gas chamber after stopping the aeration of the diffusion chamber and allowing the gas to diffuse freely within the chamber. Based on the data in Figure 9, the diffusion chamber flux is 16% greater after being exposed to winds, meaning that near-surface winds enhance soil gas transport and increase gas “apparent diffusion coefficient”. At this point, an error analysis based on the NDFE showed that the error in the flux calculation was positively correlated with both Dw and the monitoring duration (Figure 10). The exponential model yields better estimation results for the same monitoring duration. When gas transport was enhanced by 20% (Dw = 0.2 Ds), the relative error was −15.7% and −20.1% for the exponential and linear models, respectively, for the same monitoring period of 5 min, which significantly underestimated the flux calculation.
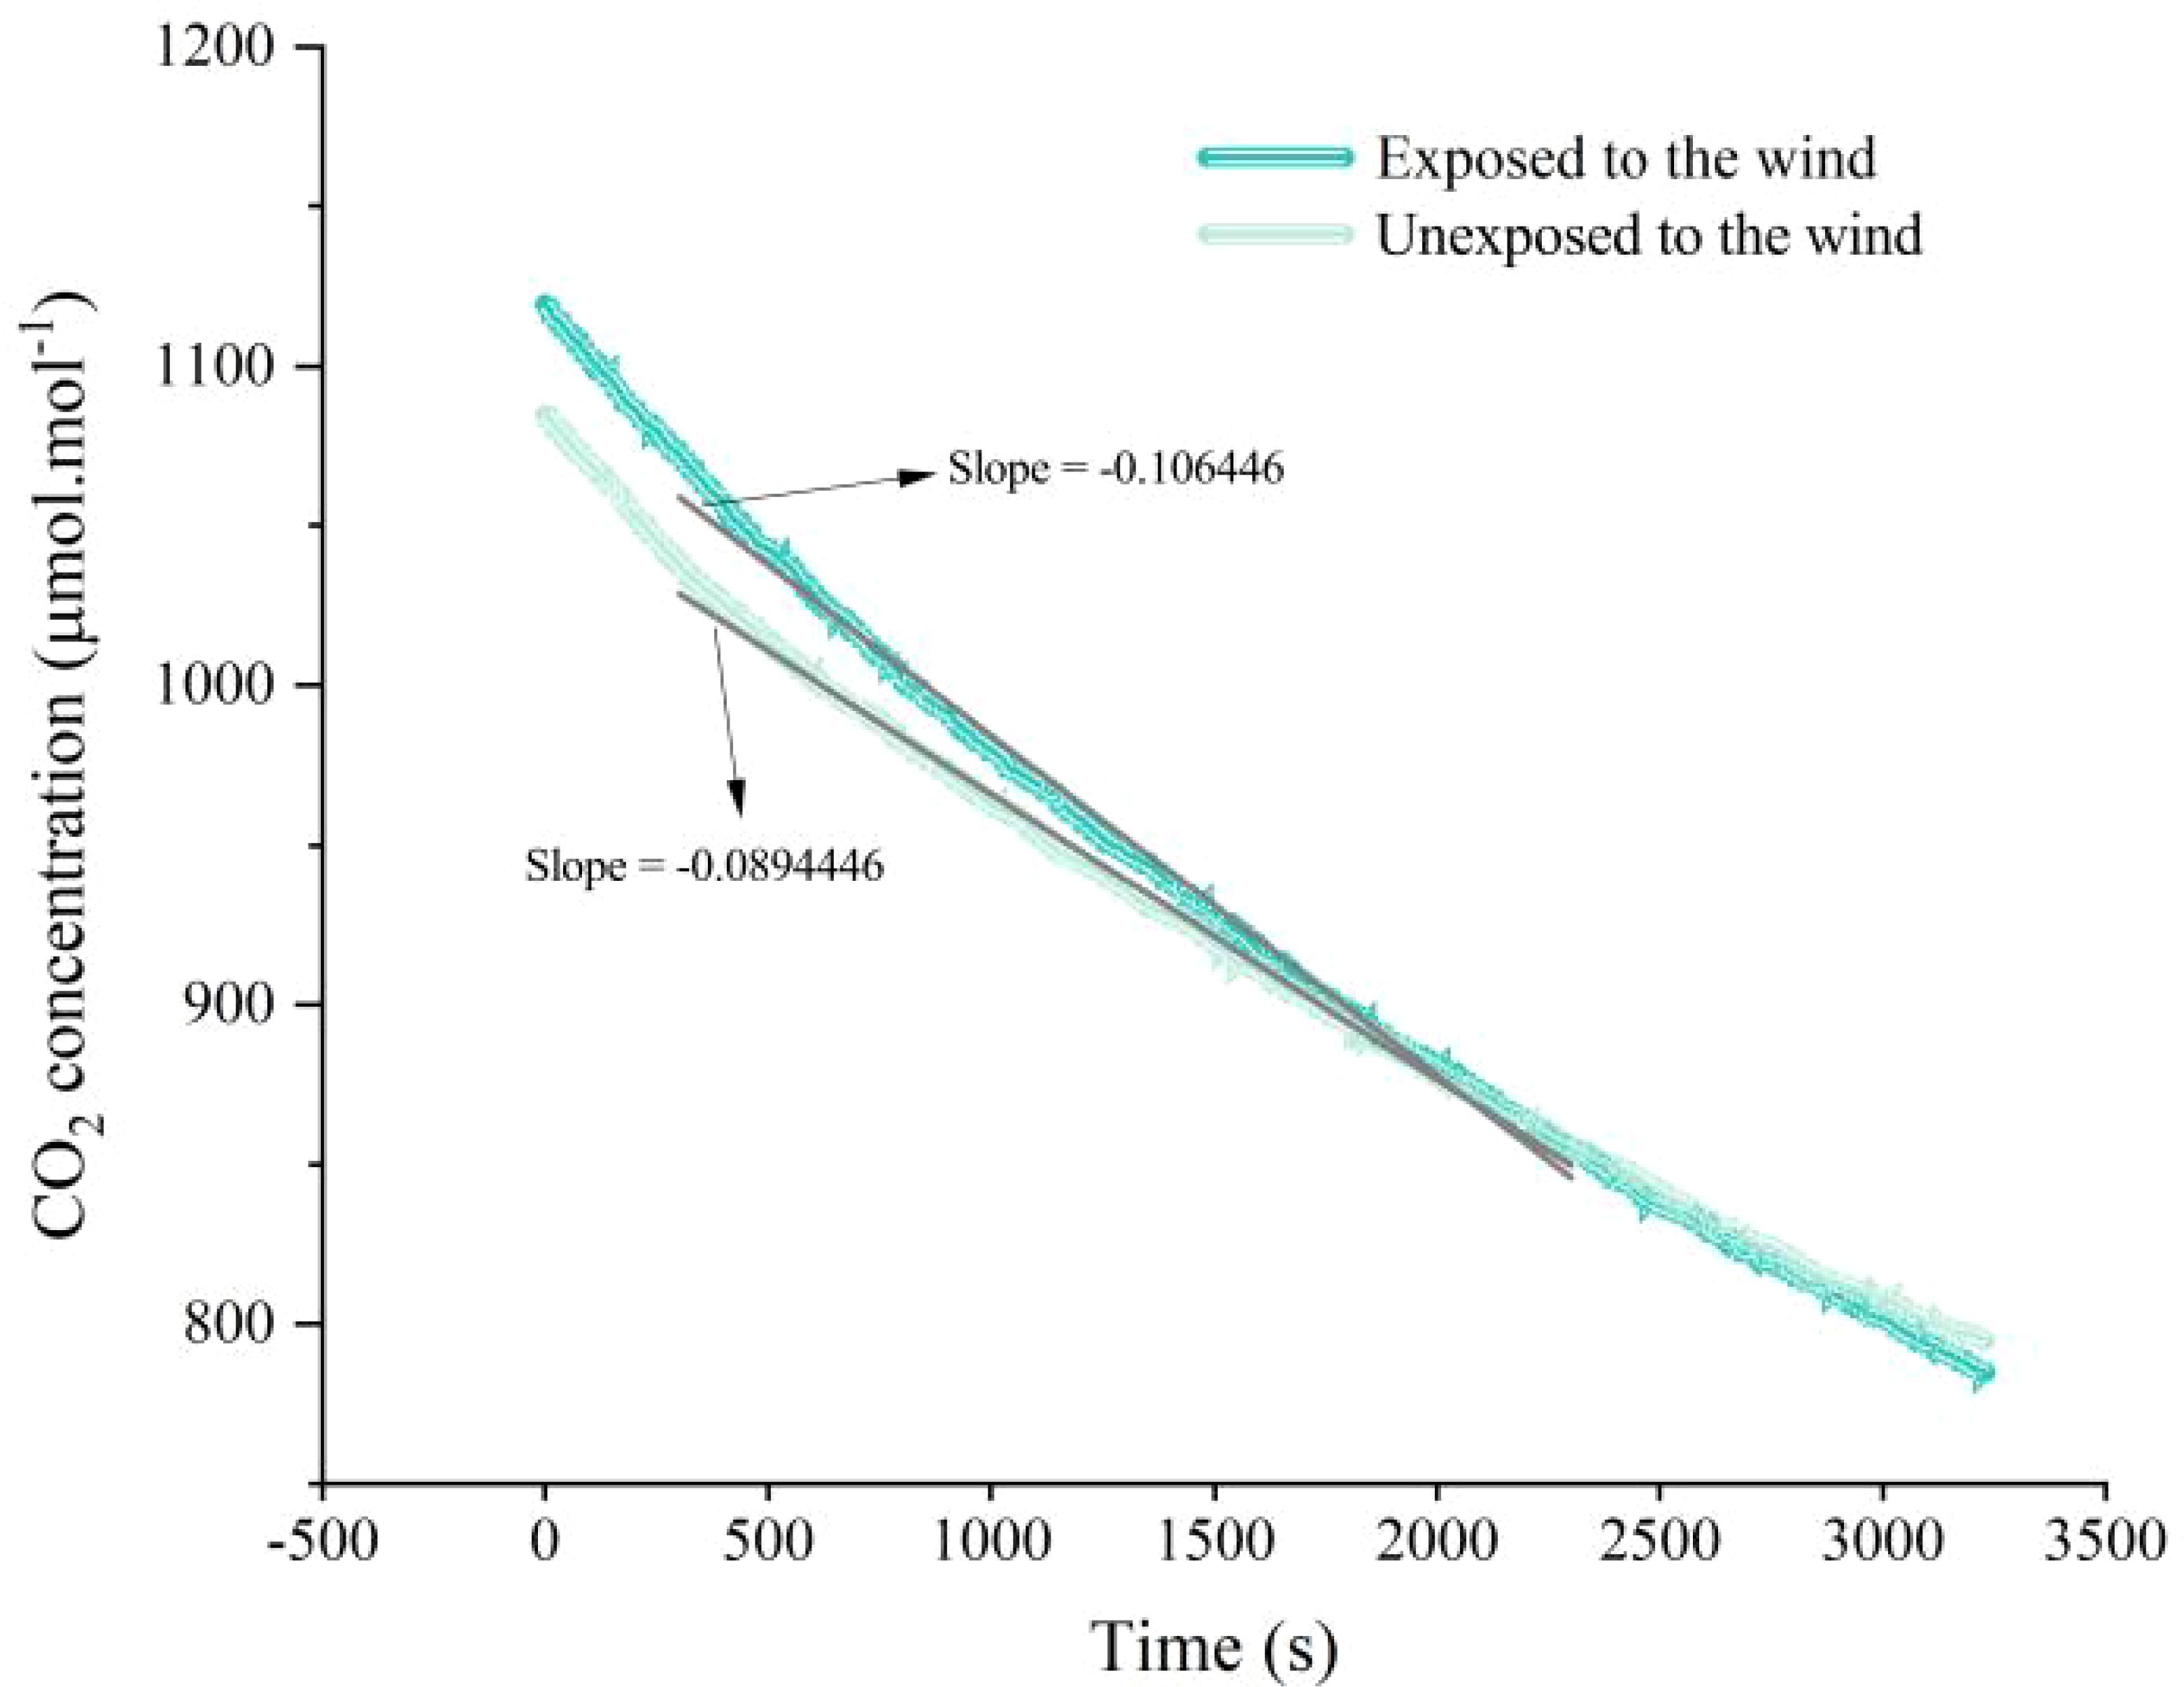
Figure 9 CO2 molar fraction in the diffusion chamber (exposed and unexposed to wind) as a function of time after the control system stops ventilating. The black line represents the slope of the CO2 molar fraction.
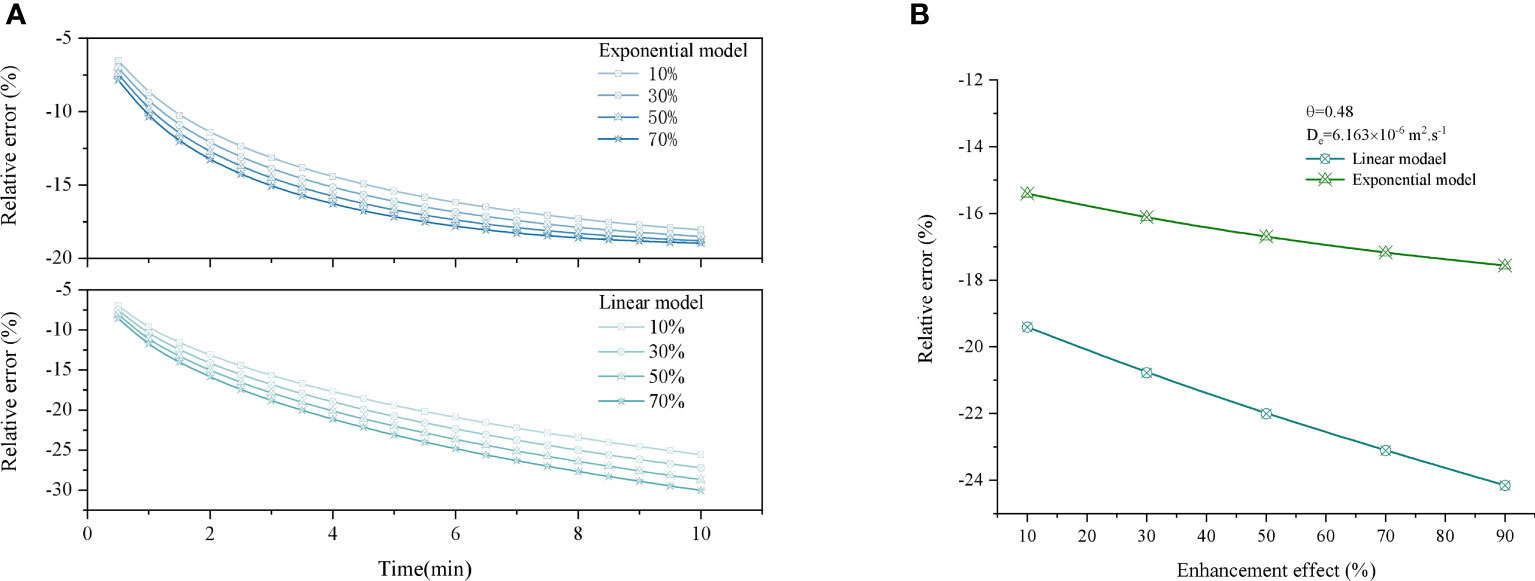
Figure 10 In a windy environment, the accuracy of the flux (f0) calculation for the selected model as a function of the time spent monitoring the closed air chamber and the wind-induced enhancement effect. (A) Model calculation error as a function of air chamber monitoring duration, where the percentage is the wind-induced enhancement, (Dw/Ds). The physical parameters of cohesive soils are used in the analysis. (B) Air chamber deployment for 5 min and model calculation error as a function of wind-induced enhancement effects.
The effects of different porosities on the monitoring of closed gas chambers in humid environments were also studied. Three different soil media (loam, sandy, and sand) with 0.48, 0.41, and 0.36 porosities, respectively, a 4,000 μmol·mol−1 gas concentration, and 0.3 L·min−1 gas flow rate were selected for field experiments in wind in turn. However, the porosity and air chamber monitoring errors (10.9%, 7.5%, and 16.2% for NSF measurement errors; 39.4%, 26.7%, and 31.4% for NSNF measurement errors) were not significantly correlated, probably because of the limited experimental resources that did not allow the three soils to be tested simultaneously. However, the effect of near-surface wind on the air chamber measurements was significant and greater than the measurement bias, owing to the different porosities.
Near-surface winds are closely related to soil-gas emissions and are favorable for soil CO2 transport. Because wind speeds tend to be higher during the day than at night, their enhanced effect on soil CO2 transport is more pronounced, which is consistent with the wind pump effect reported in several previous studies. Therefore, near-surface winds are environmental impact factors that cannot be ignored when studying soil CO2 or other gas emissions. In contrast, near-surface winds significantly affected CO2 fluxes measured in the closed-air chamber.
The measurements for the air chambers not exposed to wind were significantly better than those for the chambers exposed to wind, with NSF being more stable than NSNF. This was primarily because the gas mixing and circulation system in the NSF was designed to prevent concentration build-up at the bottom of the chamber, thereby reducing the gas concentration gradient and measurement errors. However, the flux measurements were underestimated, and they were positively correlated with near-surface wind speed, with the underestimation significance increasing with increasing wind speed. This phenomenon confirmed the inference that the WT affected the air chamber, as mentioned by Levintal et al. (2019). Moreover, the CO2 flux monitoring results of NSF and NSNF differed in soils with different carbon contents, and NSF showed significantly superior performance in soils with high carbon concentrations and large errors in the flux measurements at low concentrations. The underestimation produced by the measurements for NSNF was significantly positively correlated with the concentration. This phenomenon may be related to the gas transport mechanism, which remains diffusion-dominated at high concentrations, with non-diffusive transport being relatively weak or even negligible. However, high concentrations cause a significant build-up of gas chamber concentrations and a narrowing of the diffusion gradient, which in turn is detrimental to NSNF monitoring. Therefore, during practical monitoring in the field, gas concentrations are measured using an NSF as much as possible. However, the influence of soil types, particularly poor and dry soils, on the measurement results should be studied. Moya et al. (2019) reported that the wind or barometric pumping effect is pronounced for gases in dry and barren regions, thereby increasing the gas chamber isolation effects and bias in the measurements. In this study, wavelet coherence was introduced to analyze the response relationship between near-surface wind speed and gases in the soil. Good results were obtained, and these results will provide new ideas for studying soil gas transport; they will also help analyze the significance of the relevant factors.
The flux errors analyzed by the model were very close to those recorded when unexposed to the wind. Further analysis of the model yielded the same results as those of Livingston et al. (2006) and Venterea and Baker (2008), with a positive correlation between measurement errors and monitoring duration. This error occurs primarily because both linear and exponential models simplify the equations by omitting the complex higher-order terms of the power-series expansions (Eq. 6). This phenomenon can be corrected by computational modeling, and experiments are recommended to mitigate flux underestimation using other curve-fitting estimation methods such as exponential curves, whereas single long-term measurements are not recommended. For some closed gas chambers, when using the exponential model to estimate the diffusion rate constant fit, the calculated values can deviate significantly from the actual flux in humid environments. This is because the diffusion rate constant is essentially an integrated expression of the effective gas diffusion coefficient (or “apparent diffusion coefficient”). They are often designed to circumvent CO2 concentration build-up in the gas chamber over time, which rapidly decreases the gas concentration gradient and affects the fit of a key parameter (diffusion rate constant). Therefore, the given gas concentrations change over a sufficiently short period (usually approximately 10–20 s) to fit the data. This is an accepted method of fitting in the absence of wind or environmental disturbances. However, in the presence of wind fluctuations, the fitted values for the first few seconds are used instead of the main parameters for the calculation, and the results deviate from reality. This is because, based on the data in Figure 9, the diffusion chamber flux when exposed to winds is 16% stronger than it would be otherwise, suggesting a high “apparent diffusion coefficient” of the gas in near-surface winds, which would reduce the effectivity of the gas chamber parameter fitting method in gusts and cause biased flux estimates.
Owing to the effect of near-surface winds, the air at the soil surface in the air chamber is rarely in a steady state during flux monitoring, and wind-mediated changes in air movement at the soil surface are random. Therefore, devising a gas chamber method or sampling scheme whereby gas mixing within the chamber accurately simulates the soil gas transport state during or prior to the use of the chamber is difficult, and measurement errors are inevitable, particularly in humid environments. Therefore, multiple flux measurements should be performed during windless periods, using the average to reduce errors and improve flux data accuracy. In addition, special shields (tents) can be used to reduce the instability caused by near-surface winds during the determination of soil respiration using the air chamber method.
The effect of near-surface WT increased the “apparent diffusion coefficient” of soil CO2, and the enhanced effect of gas transport was significant at >0.8 m·s−1 wind speed. Additionally, near-surface winds affected closed-air chamber monitoring, further underestimating the CO2 flux. Moreover, the gas chamber monitoring performance and soil CO2 gas concentration were found to be closely related, and the NSF measurement performance was better than the NSNF for high CO2 gas concentrations. The flux measurement error of the NSNF was positively correlated with soil CO2 gas concentration.
Regarding the calibration of measurement errors in air chambers, near-surface wind speed data-based biases arising from measurements in wind-turbulent environments in closed-air chambers can be corrected in bare soil (in the absence of surface vegetation), and the results are valid. Alternatively, an attempt can be made to correct the gas chamber measurements using either the power spectrum of pore pressure fluctuations measured at the soil level or the pressure pumping coefficient (PPC).
The original contributions presented in the study are included in the article/supplementary material. Further inquiries can be directed to the corresponding authors.
JJ: conceptualization, methodology, investigation, writing – original draft, writing – review and editing, project administration, and data curation. JH: conceptualization, methodology, supervision, project administration, data curation, writing – review and editing, and funding acquisition. XX: conceptualization, methodology, validation, writing – review, and editing. YL: validation, writing – review, and editing. JS: validation, writing – review, and editing. All authors contributed to the article and approved the submitted version.
This study was supported by the National Natural Science Foundation of China (grant number: 31971493,31570629).
We thank the editor and reviewers for their contributions to the peer review of our manuscript.
The authors declare that the research was conducted in the absence of any commercial or financial relationships that could be construed as a potential conflict of interest.
All claims expressed in this article are solely those of the authors and do not necessarily represent those of their affiliated organizations, or those of the publisher, the editors and the reviewers. Any product that may be evaluated in this article, or claim that may be made by its manufacturer, is not guaranteed or endorsed by the publisher.
Bain W. G., Hutyra L., Patterson D. C., Bright A. V., Daube B. C., Munger J. W., et al. (2005). Wind-induced error in the measurement of soil respiration using closed dynamic chambers. Agric. For. Meteorol. 131 (3), 225–232. doi: 10.1016/j.agrformet.2005.06.004
Buckingham E. (1904). Contribution to our knowledge of the aeration of soils. (Washington, DC: U.S. Gov. Print. Office).
Buragiene S., Sarauskis E., Romaneckas K., Adamaviciene A., Kriauciuniene Z., Avizienyte D., et al. (2019). Relationship between CO2 emissions and soil properties of differently tilled soils. Sci. Total Environ. 662, 786–795. doi: 10.1016/j.scitotenv.2019.01.236
Clements W. E., Wilkening M. H. (1974). Atmospheric pressure effects on222Rn transport across the Earth-air interface. J. Geophysical Res. 79 (33), 5025–5029. doi: 10.1029/JC079i033p05025
Conen F., Smith K. A. (1998). A re-examination of closed flux chamber methods for the measurement of trace gas emissions from soils to the atmosphere. Eur. J. Soil Sci. 49, 701–707. doi: 10.1046/j.1365-2389.1998.4940701.x
Davidson E. A., Savage K., Verchot L. V., Navarro R. (2002). Minimizing artifacts and biases in chamber-based measurements of soil respiration. Agric. For. Meteorol. 113 (1), 21–37. doi: 10.1016/S0168-1923(02)00100-4
Denman K. L., Brasseur G. P., Chidthaisong A., Ciais P., Cox P. M., Dickinson R., et al. (2007). “Couplings between changes in the climate system and biogeochemistry,” in Climate Change 2007: The Physical Science Basis. Contribution of Working Group I to the Fourth Assessment Report of the Intergovernmental Panel on Climate Change (New York: Cambridge University Press).
Edwards N. T., Riggs J. S. (2003). Automated monitoring of soil respiration. Soil Sci. Soc. Am. J. 67 (4), 1266–1271. doi: 10.2136/sssaj2003.1266
Fang C., Moncrieff J. B. (1998). An open-top chamber for measuring soil respiration and the influence of pressure difference on CO2 efflux measurement. Funct. Ecol. 12 (2), 319–325. doi: 10.1046/j.1365-2435.1998.00189.x
Fleming N. A., Morais T. A., Mayer K. U., Ryan M. C. (2021). Spatiotemporal variability of fugitive gas migration emissions around a petroleum well. Atmospheric Pollut. Res. 12 (6), 101094. doi: 10.1016/j.apr.2021.101094
Forde O. N., Cahill A. G., Beckie R. D., Mayer K. U. (2019). Barometric-pumping controls fugitive gas emissions from a vadose zone natural gas release. Sci. Rep. 9 (1), 14080. doi: 10.1038/s41598-019-50426-3
Gao F., Yates S. R. (1998). Simulation of enclosure-based methods for measuring gas emissions from soil to the atmosphere. J. Geophysical Res. 103 (D20), 26127–26136. doi: 10.1029/98jd01345
Goffin S., Wylock C., Haut B., Maier M., Longdoz B., Aubinet M. (2015). Modeling soil CO2 production and transport to investigate the intra-day variability of surface efflux and soil CO2 concentration measurements in a Scots Pine Forest (Pinus sylvestris, L.). Plant Soil 390 (1), 195–211. doi: 10.1007/s11104-015-2381-0
Hu J. G. (2016). Studies on Monitoring and Evaluation Methods of Forest Soil Respiration (in Chinese) (PhD) (Beijing, China: Beijing Forestry University).
Jacinthe P. A. (2015). Carbon dioxide and methane fluxes in variably-flooded riparian forests. Geoderma 241-242, 41–50. doi: 10.1016/j.geoderma.2014.10.013
Jenkinson D. S., Adams D. E., Wild A. (1991). Model estimates of CO2 emissions from soil in response to global warming. Nature 351 (6324), 304–306. doi: 10.1038/351304a0
Jiang J. J., Yin W. J., Hu J. G., Hu Y. L. (2022). Study of a calibration system for soil respiration measurement chambers. Environ. Res. Commun. 4 (9), 095006. doi: 10.1088/2515-7620/ac8f16
Kimball B. A., Lemon E. R. (1971). Air turbulence effects upon soil gas exchange. Soil Sci. Soc. Am. J. 35 (1), 16–21. doi: 10.2136/sssaj1971.03615995003500010013x
Kong F., Zhang G. F. (2021). Spatiotemporal evolution characteristics of near surface windless days in China from 1961 to 2018 under the background of global warming(in Chinese). J. Capital Normal University(Natural Sci. Edition) 42, 47–55. doi: 10.19789/j.1004-9398.2021.04.009
Kumar S., Lal R., Liu D., Rafiq R. (2013). Estimating the spatial distribution of organic carbon density for the soils of Ohio, USA. J. Geographical Sci. 23 (2), 280–296. doi: 10.1007/s11442-013-1010-1
Laemmel T., Mohr M., Longdoz B., Schack-Kirchner H., Lang F., Schindler D., et al. (2019). From above the forest into the soil - How wind affects soil gas transport through air pressure fluctuations. Agric. For. Meteorol. 265, 424–434. doi: 10.1016/j.agrformet.2018.11.007
Lebel E. D., Lu H. S., Vielstädte L., Kang M., Banner P., Fischer M. L., et al. (2020). Methane emissions from abandoned oil and gas wells in California. Environ. Sci. Technol. 54 (22), 14617–14626. doi: 10.1021/acs.est.0c05279
Levintal E., Dragila M. I., Weisbrod N. (2019). Impact of wind speed and soil permeability on aeration time in the upper vadose zone. Agric. For. Meteorol. 269-270, 294–304. doi: 10.1016/j.agrformet.2019.02.009
Livingston G. P., Hutchinson G. L. (1995). Enclosure-Based Measurement of Trace Gas Exchange: Application and Sources of Error (Oxford, UK: Blackwell Science Ltd).
Livingston G. P., Hutchinson G. L., Spartalian K. (2006). Trace gas emission in chambers: A non-steady-state diffusion model. Soil Sci. Soc. Am. J. 70, 1459–1469. doi: 10.2136/sssaj2005.0322
Maier M., Mayer S., Laemmel T. (2019). Rain and wind affect chamber measurements. Agric. For. Meteorol. 279, 107754. doi: 10.1016/j.agrformet.2019.107754
Maier M., Schack-Kirchner H., Aubinet M., Goffin S., Longdoz B., Parent F. (2012). Turbulence effect on gas transport in three contrasting forest soils. Soil Sci. Soc. Am. J. 76 (5), 1518–1528. doi: 10.2136/sssaj2011.0376
Massmann J., Farrier D. F. (1992). Effects of atmospheric pressures on gas transport in the vadose zone. Water Resour. Res. 28 (3), 777–791. doi: 10.1029/91WR02766
Midwood A. J., Millard P. (2011). Challenges in measuring the δ13C of the soil surface CO2 efflux. Rapid Commun. Mass Spectrometry 25 (1), 232–242. doi: 10.1002/rcm.4857
Millington R. J., Quirk J. P. (1961). Permeability of porous solids. Trans. Faraday Soc. 57, 1200–1207.
Mohr M., Laemmel T., Maier M., Schindler D. (2020). Inexpensive high-precision system for measuring air pressure fluctuations. Meteorol. Appl. 27 (1), e1815. doi: 10.1002/met.1815
Moya M. R., Sánchez-Cañete E. P., Vargas R., López-Ballesteros A., Oyonarte C., Kowalski A. S., et al. (2019). CO2 dynamics are strongly influenced by low frequency atmospheric pressure changes in semiarid grasslands. J. Geophysical Res.: Biogeosci. 124 (4), 902–917. doi: 10.1029/2018JG004961
Nachshon U., Dragila M., Weisbrod N. (2012). From atmospheric winds to fracture ventilation: Cause and effect. J. Geophysical Res.: Biogeosci. 117 (G2), G02016. doi: 10.1029/2011JG001898
Norman J. M., Kucharik C. J., Gower S. T., Baldocchi D. D., Crill P. M., Rayment M., et al. (1997). A comparison of six methods for measuring soil-surface carbon dioxide fluxes. J. Geophysical Res.: Atmospheres 102 (D24), 28771–28777. doi: 10.1029/97JD01440
Pavelka M., Acosta M., Kiese R., Altimir N., Brümmer C., Crill P., et al. (2018). Standardisation of chamber technique for CO2, N2O and CH4 fluxes measurements from terrestrial ecosystems. Int. Agrophysics 32 (4), 569–587. doi: 10.1515/intag-2017-0045
Piao S., Liu Z., Wang T., Peng S., Ciais P., Huang M., et al. (2017). Weakening temperature control on the interannual variations of spring carbon uptake across northern lands. Nat. Climate Change 7 (5), 359–363. doi: 10.1038/nclimate3277
Poblador S., Lupon A., Sabaté S., Sabater F. (2017). Soil water content drives spatiotemporal patterns of CO2 and N2O emissions from a Mediterranean riparian forest soil. Biogeosciences 14 (18), 4195–4208. doi: 10.5194/bg-14-4195-2017
Poulsen T. G., Furman A., Liberzon D. (2018). Effect of near-surface wind speed and gustiness on horizontal and vertical porous medium gas transport and gas exchange with the atmosphere. Eur. J. Soil Sci. 69 (2), 279–289. doi: 10.1111/ejss.12531
Poulsen T. G., Sharma P. (2011). Apparent porous media gas dispersion in response to rapid pressure fluctuations. Soil Sci. 176 (12), 635–641. doi: 10.1097/SS.0b013e3182372fae
Pourbakhtiar A., Poulsen T. G., Wilkinson S., Bridge J. W. (2017). Effect of wind turbulence on gas transport in porous media: experimental method and preliminary results. Eur. J. Soil Sci. 68 (1), 48–56. doi: 10.1111/ejss.12403
Pumpanen J., Kolari P., Ilvesniemi H., Minkkinen K., Vesala T., Niinistö S., et al. (2004). Comparison of different chamber techniques for measuring soil CO2 efflux. Agric. For. Meteorol. 123 (3), 159–176. doi: 10.1016/j.agrformet.2003.12.001
Raich J. W., Potter C. S. (1995). Global patterns of carbon dioxide emissions from soils. Global Biogeochem. Cycles 9 (1), 23–36. doi: 10.1029/94GB02723
Rittl T. F., Canisares L., Sagrilo E., Butterbach-Bahl K., Dannenmann M., Cerri C. E. P. (2020). Temperature sensitivity of soil organic matter decomposition varies with biochar application and soil type. Pedosphere 30 (3), 336–342. doi: 10.1016/S1002-0160(20)60013-3
Rustad L. E., Huntington T. G., Boone R. D. (2000). Controls on soil respiration: Implications for climate change. Biogeochemistry 48 (1), 1–6. doi: 10.1023/A:1006255431298
Sahoo B. K., Mayya Y. S. (2010). Two dimensional diffusion theory of trace gas emission into soil chambers for flux measurements. Agric. For. Meteorol. 150, 1211–1224. doi: 10.1016/j.agrformet.2010.05.009
Sánchez-Cañete E. P., Kowalski A. S., Serrano-Ortiz P., Pérez-Priego O., Domingo F. (2013). Deep CO2 soil inhalation exhalation induced by synoptic pressure changes and atmospheric tides in a carbonated semiarid steppe. Biogeosciences 10 (10), 6591–6600. doi: 10.5194/bg-10-6591-2013
Sánchez-Cañete E. P., Oyonarte C., Serrano-Ortiz P., Yuste J. C., Pérez-Priego O., Domingo F., et al. (2016). Winds induce CO2 exchange with the atmosphere and vadose zone transport in a karstic ecosystem. J. Geophysical Res.: Biogeosci. 121 (8), 2049–2063. doi: 10.1002/2016JG003500
Sanz-Cobena A., Ding W., Müller C., Zaman M., Heng L. (2021). Mitigating greenhouse gas emissions from croplands and pasturelands — climate-smart agriculture. Pedosphere 31 (2), 227–230. doi: 10.1016/S1002-0160(20)60065-0
Schlesinger W. H., Andrews J. A. (2000). Soil respiration and the global carbon cycle. Biogeochemistry 48 (1), 7–20. doi: 10.1023/A:1006247623877
Subke J.-A., Bahn M. (2010). On the “temperature sensitivity” of soil respiration: Can we use the immeasurable to predict the unknown? Soil Biol. Biochem. 42 (9), 1653–1656-1656. doi: 10.1016/j.soilbio.2010.05.026
Subke J.-A., Reichstein M., Tenhunen J. D. (2003). Explaining temporal variation in soil CO2 efflux in a mature spruce forest in Southern Germany. Soil Biol. Biochem. 35 (11), 1467–1483. doi: 10.1016/S0038-0717(03)00241-4
Takle E. S., Massman W. J., Brandle J. R., Schmidt R. A., Zhou X., Litvina I. V., et al. (2004). Influence of high-frequency ambient pressure pumping on carbon dioxide efflux from soil. Agric. For. Meteorol. 124 (3), 193–206. doi: 10.1016/j.agrformet.2004.01.014
Venterea R. T., Baker J. M. (2008). Effects of soil physical nonuniformity on chamber-based gas flux estimates. Soil Sci. Soc. America J. 72 (5), 1410–1417. doi: 10.2136/sssaj2008.0019
Wang Z., Hoffmann T., Six J., Kaplan J. O., Govers G., Doetterl S., et al. (2017). Human-induced erosion has offset one-third of carbon emissions from land cover change. Nat. Climate Change 7 (5), 345–349. doi: 10.1038/nclimate3263
Xu L. K., Furtaw M. D., Madsen R. A., Garcia R. L., Anderson D. J., McDermitt D. K. (2006). On maintaining pressure equilibrium between a soil CO2 flux chamber and the ambient air. J. Geophysical Res.: Atmospheres 111 (D8), D08S10. doi: 10.1029/2005JD006435
Xu L., Yu G., He N. (2019). Increased soil organic carbon storage in Chinese terrestrial ecosystems from the 1980s to the 2010s. J. Geographical Sci. 29 (1), 49–66. doi: 10.1007/s11442-019-1583-4
Keywords: closed air chamber, flux reference system, near-surface wind, forest soil CO2 flux, underestimation, wavelet coherence analysis
Citation: Jiang J, Hu J, Xu X, Li Y and Sheng J (2023) Effect of near-surface winds on the measurement of forest soil CO2 fluxes using closed air chambers. Front. Ecol. Evol. 11:1163704. doi: 10.3389/fevo.2023.1163704
Received: 07 March 2023; Accepted: 14 July 2023;
Published: 28 July 2023.
Edited by:
Jinshu Chi, Hong Kong University of Science and Technology, Hong Kong SAR, ChinaReviewed by:
Carlos Noriega, Federal University of Pernambuco, BrazilCopyright © 2023 Jiang, Hu, Xu, Li and Sheng. This is an open-access article distributed under the terms of the Creative Commons Attribution License (CC BY). The use, distribution or reproduction in other forums is permitted, provided the original author(s) and the copyright owner(s) are credited and that the original publication in this journal is cited, in accordance with accepted academic practice. No use, distribution or reproduction is permitted which does not comply with these terms.
*Correspondence: Junguo Hu, aHVqdW5ndW9AemFmdS5lZHUuY24=
Disclaimer: All claims expressed in this article are solely those of the authors and do not necessarily represent those of their affiliated organizations, or those of the publisher, the editors and the reviewers. Any product that may be evaluated in this article or claim that may be made by its manufacturer is not guaranteed or endorsed by the publisher.
Research integrity at Frontiers

Learn more about the work of our research integrity team to safeguard the quality of each article we publish.