 Billie Maguire
 Jewel Tomasula2
 Gina M. Wimp
 Matthew B. Hamilton
- 1Department of Biology, University of Massachusetts, Boston, Boston, MA, United States
- 2Department of Biology, Georgetown University, Washington, DC, United States
Introduction: As anthropogenic change alters and fragments habitats, it is apparent that evolutionary change can co-occur with ecological change, though the scale and consequences of this contemporary evolution remain unclear. In coastal salt marshes of eastern North America, the flood tolerant low elevation marsh grass (Spartina alterniflora), is displacing Spartina patens, the flood intolerant high elevation marsh grass. Rising seas restrict S. patens, once occupying large areas of many hectares, to increasingly small patches, some as small as a few square meters.
Methods: Using nine microsatellite loci, we examined the genetic diversity and population structure of Tumidagena minuta, a minute, flightless planthopper and specialist herbivore of S. patens. We sampled T. minuta from S. patens habitat patches of varying radius (3–82 meters) and distances (54–1,100 meters) to test how landscape variation affects population genetic parameters associated with microevolutionary processes. We sampled and genotyped 142 T. minuta individuals across six S. patens patches in a single marsh in New Jersey, USA.
Results: We observed high polymorphism, observing between 7 and 28 alleles per locus and an average of 13.3 alleles per locus. We observed no genetic differentiation among sampled patches (RST = −0.0109). The contemporary genetic effective population size (Ne) was estimated at approximately 360 (95% confidence interval: 208–1325) based on two-locus linkage disequilibrium. Based on an estimate of Nem = 32.4 in the finite island model, the estimated gene flow rate among these patches was 0.09 migrants per generation.
Discussion: These estimates, which are rarely produced for non-model insects, suggest that, despite rapid and precipitous decreases in habitat size and connectivity, T. minuta populations have remained large and have experienced little genetic differentiation due to drift. Ecological changes in patch size and isolation at this scale have not influenced population genetic processes like effective migration rate for T. minuta, consistent with our expectations for an insect with a large population size.
1 Introduction
Anthropogenic activity has profoundly altered vegetation in many habitats, such that they exist as networks of patches (Saunders et al., 1991). In these patchy habitats, the importance of preserving large habitat patches and connecting them through “habitat corridors” for retaining species diversity has long been appreciated by ecologists and habitat managers (MacArthur, 1965; Beier and Noss, 1998; Connor et al., 2000). Research has also focused on predicting how patch area and connectivity might affect the genetic diversity within species (Holderegger and Wagner, 2008; Manel and Holderegger, 2013). Smaller patches support smaller population sizes, lower population densities, and lower effective population sizes (Frankham, 1995). Smaller and more isolated patches receive fewer migrants and have lower colonization rates (Wilson and MacArthur, 1967; Crooks et al., 2001). Further, smaller patches have a larger habitat edge to area ratio, which could compound negative population effects for species with negative edge responses (Ries et al., 2004; Ewers and Didham, 2006). These ecological changes can influence microevolutionary processes by altering drift–migration balance, decreasing effective population size, increasing genetic drift and reducing gene flow, leading to changes in neutral genetic diversity within and among patches subpopulations (Templeton et al., 1990; Keyghobadi, 2007). In addition, patchy systems can be modeled as metapopulations, wherein ecological changes to patch size and connectivity can alter extinction–colonization dynamics by increasing extinction rates, which can threaten metapopulation persistence without frequent recolonization (Hess, 1996). Frequent population turnover (i.e. high extinction and recolonization rates) can then lead to reduction of within and between patch genetic diversity (Pannell and Charlesworth, 2000).
Conserving genetic polymorphism has been considered important in species conservation because loss of polymorphism is expected to lead to (a) the loss of alleles that form high fitness genotypes and genetic variation required for response to selection, (b) increased homozygosity, and (c) the possible manifestation of inbreeding depression, which can negatively affect long-term fitness (Frankham et al., 2002; Reed and Frankham, 2003). Stochastic change in allele frequencies and loss of genetic polymorphism can also alter or reduce phenotypic variation, possibly impacting interspecific interactions (e.g. Bolnick et al., 2011). Reductions in census population size, by causing concurrent reductions in effective population size (Ne), can increase the rate of this stochastic genetic change. Thus, Ne describes an important parameter at the interface between the population ecology of a species and the strength of contemporary evolutionary processes it experiences (Lowe et al., 2017).
Ne describes the rate of genetic drift, the stochastic sampling process leading to loss of polymorphism in finite populations, and is defined as the size of an idealized Wright-Fisher population that would match the rate of loss of heterozygosity by drift observed in an actual population (Wright, 1931). Ne can be estimated by sampling genotypes at a single time-point and measuring two-locus disequilibrium that is attributable to drift. This method generates an estimate of Ne in the very recent past and it is referred to as contemporary Ne, because the disequilibrium on which the estimate is based can change rapidly (e.g. tens of generations) and therefore does not carry a signature of older population history (Waples, 2005). Because Ne describes the tempo of drift, it is important for assessing the genetic vulnerability of a population due to loss of heterozygosity, adaptive polymorphism, and response to selection (Palstra and Ruzzante, 2008). Smaller effective population sizes and stronger drift reduces a population’s response to selection by decreasing the probability of fixing beneficial alleles and increasing the rate of fixation of deleterious alleles, slowing response to natural selection (e.g. Kimura, 1983; Whitlock, 2003). Ne also constrains polygenic adaptation by weakening the response to natural selection across numerous loci that cause variation in continuous phenotypes, with loci of smaller phenotypic effect experiencing weaker selection and therefore stronger drift (Barghi et al., 2020; Hamilton, 2021). Further, the probability of extinction due to the stochastic fixation of deleterious alleles depends on the effective size of the population (Lande, 1994).
Some experimental evidence points toward the role of larger Ne in lowering extinction risk. Experimentally increasing genetic polymorphism has been shown to reduce the number extinctions for experimental field populations (Newman and Pilson, 1997). A similar study in high disturbance ecosystems, however, showed that demographic factors prevail in reducing extinction risk (Wootton and Pfister, 2013). In the laboratory, combined demographic and genetic rescues (increase of N and Ne) most reduced the number of extinctions in experimental populations (Hufbauer et al., 2015). In examinations of literature, some find positive, but weak, relationships between neutral polymorphism and demographic performance (Carley et al., 2022). Others question a clear relationship between polymorphism and extinction risk based on an analysis of IUCN-designated “Red List” species (Teixeira and Huber, 2021). The role of Nein population persistence varies with the particulars of the analysis and the species and system in question, highlighting the importance of empirical estimations of polymorphism and Ne in a broad range of species and ecosystems.
We examined the neutral genetic polymorphism of a mostly flightless planthopper (Tumidagena minuta), which inhabits a patchy and rapidly declining habitat and has a negative density response to decreasing habitat size and high edge habitat (Wimp et al., 2011; Martinson et al., 2012). T. minuta inhabits the coastal salt marshes of eastern North America, which are composed of contiguous monocultures of Spartina grasses. Spartina patens is intolerant to daily tidal inundation and is restricted to relatively high elevation areas within the marsh. As mean tidal height has increased over the past sixty years, Spartina alterniflora, the tide tolerant marsh grass, has displaced S. patens in many areas (Watson et al., 2016). In some marshes, S. patens has declined by 40% and by as much as 80% since 2006 in others (Watson et al., 2016; Rippel et al., 2023). S. patens, once represented by fields as large as 200,000 m2, is now reduced to patches (Raupp and Denno, 1979). S. patens patches support T. minuta (Hemiptera: Delphacidae), the dominant, specialist herbivore found in S. patens, that exhibits a negative population response to the edges of S. patens patches (Wimp et al., 2011). Most T. minuta are short-winged and flightless and are expected to have limited capacity to migrate among patches (Denno and Dingle, 1981). Long distance dispersal of insects by wind and of salt marsh insects by tide can occur, though the effects of this kind of passive dispersal on population genetic parameters are less explored relative to flight dispersal, which is important in planthopper population dynamics and in producing patterns of population genetic differentiation in insects (Foster and Treherne, 1978; Antolin and Strong, 1987; Denno and Roderick, 1990; Hemminga et al., 1990; McCullough et al., 2009). We sought to determine the extent of microevolutionary effects at this scale of habitat loss by asking how S. patens patches size and isolation affects the genetic diversity of T. minuta. We tested the hypothesis that large patches with larger proportions of habitat interior will harbor more T. minuta genetic diversity through larger genetic effective population size and that there will be more genetic diversity among patches that are more geographically isolated. We expected that these patterns can be modeled by an increased rate of drift relative to rate of migration in small patches.
2 Materials and methods
2.1 Study site and organisms
We collected T. minuta samples in the Great Bay Boulevard Wildlife Management Area in Ocean County, New Jersey (39.548° N, 74.332° W) in August 2021. Our study site is a well-protected wildlife refuge with relatively little impact from direct pollution, diking, and development. It is impacted by sea level rise and S. patens has been observed to be highly patchy. T. minuta is a Delphacid phloem feeding planthopper (Hemiptera : Delphacidae) that is abundant on S. patens in eastern coastal salt marshes from New Hampshire to North Carolina. T. minuta is polymorphic for wing-length and there is a tradeoff wherein flighted, long-winged individuals have lower fecundity and a delayed reproduction. Most individuals (>99%) are short-winged and flightless (Denno and Roderick, 1991). Macroptery is polygenic, heritable, and related to the insulin signaling pathway in planthoppers and is also responsive to environmental cues like plant quality and intraspecific crowding (Roff, 1986; Denno and Roderick, 1990; Xu and Zhang, 2017).
2.2 Sampling and DNA extraction
We used a gas engine-driven D-vac suction sampler (Rincon-Vitova Insectaries, Ventura, California, USA) to sample whole arthropod communities of thirteen S. patens patches on August 17th 2021. The samples were stored in 100% ethanol before T. minuta individuals were identified and counted. We recorded the wing-form of each individual. We obtained at least ten individuals from six patches and chose these patches for microsatellite analysis (Figure 1). The patches are named SP1 through SP6. We sampled 142 individuals from patches ranging in size from ~21,000 m2 to ~34 m2 and with pairs of patches ranging from ~54 m to 1.1 km apart, and with some separated by a road. Each entire insect was homogenized with a micropestle in 100 μL of 10% Chelex solution. We added 2 μL of Proteinase K to each sample and incubated at 55°C for 30 minutes and 100°C for 8 minutes. After we centrifuged the samples at maximum speed for 2 mins, we pipetted the supernatant to a fresh tube and discarded the Chelex (Walsh et al., 1991).
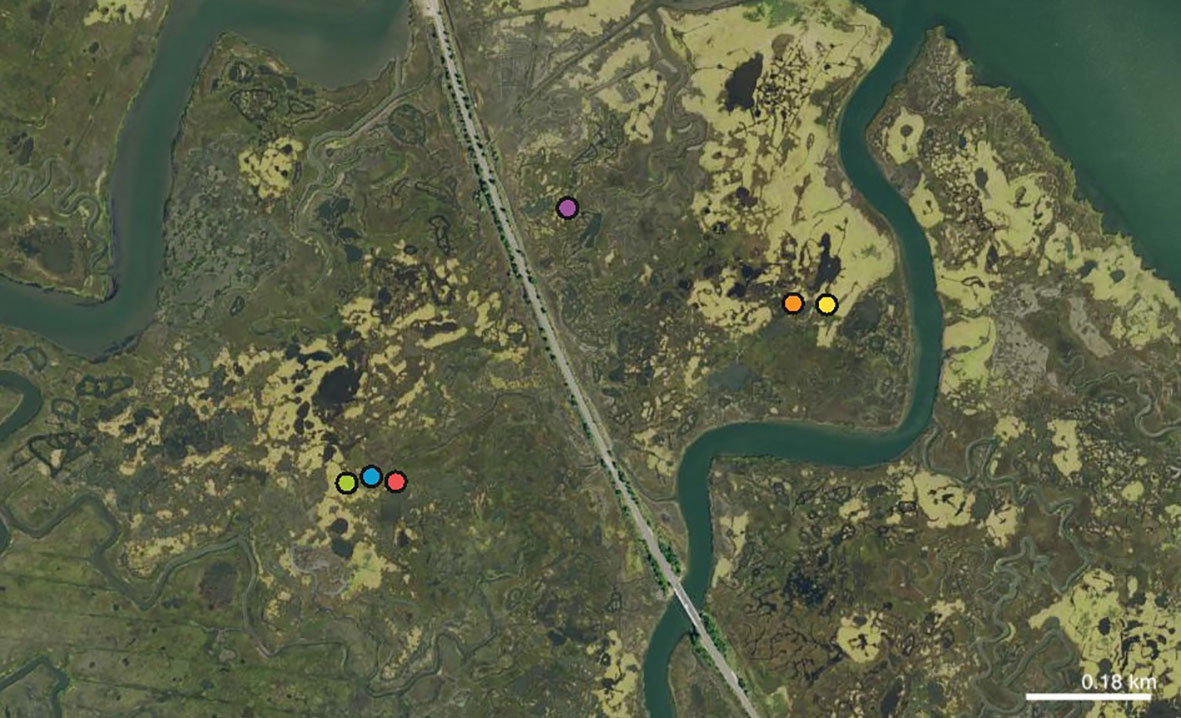
Figure 1 Map showing an aerial photograph of the study site. S. patens is shown in light green, while S. alterniflora is shown in dark green. The sampled patches are labeled with dots (green: SP3, blue: SP2, red: SP1, purple: SP4, orange: SP5, yellow: SP6).
We sampled live S. patens biomass from near the center of each patch using a 0.047 m2 quadrant in August 2021. We separated the live culms from each sample quadrat and dried each sample for at least 3 days at ~ 60°C, and then weighed each sample to assess live biomass. We calculated T. minuta density by dividing patch counts by patch live biomass (Denno, 1980).
2.3 Amplification and fragment analysis
We employed nine polymorphic microsatellite markers (Molecular Ecology Resources Primer Development Consortium et al., 2011) (Table 1). We amplified the loci in two multiplexes using the Type-it Microsatellite PCR Kit (Qiagen, Valencia, California, USA) and a GeneAmp 9700 thermal cycler (PE Applied Biosystems, Waltham, Massachusetts, USA) in a 12 μL volume containing 10 uL of Type-it master mix (6.5 µL Type-it plus 3.5 µL water), 1 μL of template gDNA, and 1 μL primer multiplex mix (2 mM of each oligonucleotide). The thermal profile was: denaturation for 5 minutes at 95°C, followed by 30 cycles of 30 seconds at 95°C, 60 seconds of annealing at 58°C, 75 seconds of extension at 72°C, and, after the cycles, a final extension for 30 minutes at 60°C. PCR products from multiplex 1 (TmAAC252, TmAAC057, TmAAC165, TmAAC062, TmAAC095) amplified strongly and were diluted 1/50 in TE buffer for fragment analysis. PCR products from multiplex 2 (TmAAC236, TmAAC252, DdAAC053, DdAAC206) were not diluted. Forward primers for each locus were labeled with one of four fluorescent dyes: 6FAM (blue), VIC (green), NED (yellow), or PET (red). For multiplex 1, where there were more loci than unique dyes, we labeled both TmAAC252 and TmAAC057 with 6FAM, because they had strongly non-overlapping allele size distributions (TmAAC252: 63–135, TmAAC057: 176–283), allowing us to distinguish between loci in the electropherograms. We conducted fragment analysis by capillary electrophoresis with an Applied Biosystems 3500 Series Genetic Analyzer (Thermo Fisher Scientific, Waltham, Massachusetts, USA), using POP7 polymer on a 50 cm capillary. We used 1 μL of full-strength or dilute PCR product combined with 10.8 μL of formamide and 0.2 μL of GeneScan 500 LIZ dye Size Standard (Thermo Fisher Scientific, Waltham, Massachusetts, USA). Electropherogram files were exported to Geneious R10.2.6 (Geneious, San Diego, California, USA) for allele calling, using a 3rd order least squares sizing method. We created bins for each peak call with a ± 1.0 bp buffer. We took care to call the true peaks, and not stutter peaks nor peaks resulting from non-templated A addition.
2.4 Population genetic diversity analysis
We estimated the relationship between patch size and T. minuta count and density (count per gram of live S. patens biomass) using a simple linear regression implemented in R v4.2.1 (R Core Team, 2013). We estimated RST as a measure of population differentiation and RIS as a measure of inbreeding for each pair of populations and for all populations using GENEPOP v4.7 (Rousset, 2008). RST is an analog of FST formulated to account for allele size in the analysis of microsatellite data via a stepwise mutation model. To test for an association between pairwise inter-patches geographic distance and genetic distance we employed a mantel test in the package “ape” v5.6-2 for R (Paradis et al., 2004). Allele counts and allelic richness were calculated with the package “hierfstat” v0.5-11 in R v4.2.1 (Goudet, 2005). We estimated the observed and expected heterozygosity, deviation from Hardy-Weinberg equilibrium, and the frequency of null alleles using INEST v2.2 (Chybicki and Burczyk, 2009). We inferred population structure and population assignment using Bayesian population assignment approach implemented in STRUCTURE v2.3.4 (Pritchard et al., 2000).
We estimated effective population size (Ne) based on two-locus linkage disequilibrium using SpEED-Ne (Hamilton et al., 2018). We estimated Ne via the squared correlation of gametic disequilibrium using the composite haplotype table method. We used the median of 5000 iterations of random permutation of multilocus genotypes to estimate and account for effects of finite sample size, rare alleles, and within-locus disequilibrium on background disequilibrium. We employed both allele frequency weighting (AFW) and an allele frequency threshold (AFT) of 0.05 to account for the disproportionate impact of low frequency alleles. This estimation approach was shown by Hamilton et al. (2018) to provide better accuracy and precision compared to other estimation approaches using simulated microsatellite data similar to the empirical data reported here. We used a delete-one jackknife over all unique pairs of loci to estimate percentile confidence intervals, shown by Hamilton et al. (2018) to yield 95% confidence intervals that were too broad, and therefore conservative, with 12–24 loci and real Ne of 250. Because there are numerous approaches to estimate Ne and its confidence intervals (see Hamilton et al., 2018), we also report estimates based on a range of estimators and assumptions. The estimate employed genotype permutation to account for effects of finite sample size, rare alleles, and within-locus disequilibrium on background disequilibrium, which can bias estimates of Ne.
Estimates of the scaled migration rate Nem were made according to Slatkin (1995), using an estimate of RST and the independent estimate of Ne. Under the assumptions associated with the infinite island model, the fixation index is a function of the effective migration rate (Nem) (Slatkin, 1985; Whitlock and McCauley, 1999). Slatkin (1995) method relaxes some of these assumptions by incorporating the effect of a finite number of demes.
3 Results
There was no relationship between patches size and T. minuta density (slope = 0.71; F = 2.357; df = 1, 11; p = 0.153). SP6, the largest patches, measured 21,600 m2, while SP2, the smallest patches measured 24 m2. SP2 and SP3, the nearest patches, measured 54 meters apart, and the furthest SP3 and SP6 were 2,100 meters apart. The radii of the sampled patches ranged from ~3 m to ~82 m (Table 2). We observed no macrocopters or flight-capable morphs in our samples.
We observed between 7 and 28 alleles per locus and an average of 13.3 across all loci. Observed genotype frequencies did not differ from HW expectations, save DdAAC053, which exhibited a deficit of heterozygosity due to a relatively high estimated frequency of null alleles (Table 1). Based on these 9 polymorphic microsatellite loci, we estimated an RST of −0.0109 and RIS of 0.0192 across all populations. We obtained similarly low estimates for all pairwise comparisons among patches and we found no correlation between inter-patch distance and RST (z = −35.08702, p = 0.851). Bayesian population assignment analysis showed the highest likelihood of K = 1, consistent with panmixia. ΔK provides strong evidence that K is not equal to 5 or 6 (Evanno et al., 2005), and there is no evidence that these samples are structured with respect to any K (Figure 2). There is no evidence of individuals recently migrating from genetically diverged populations. We found no effect of patch size or isolation on allelic richness of heterozygosity.
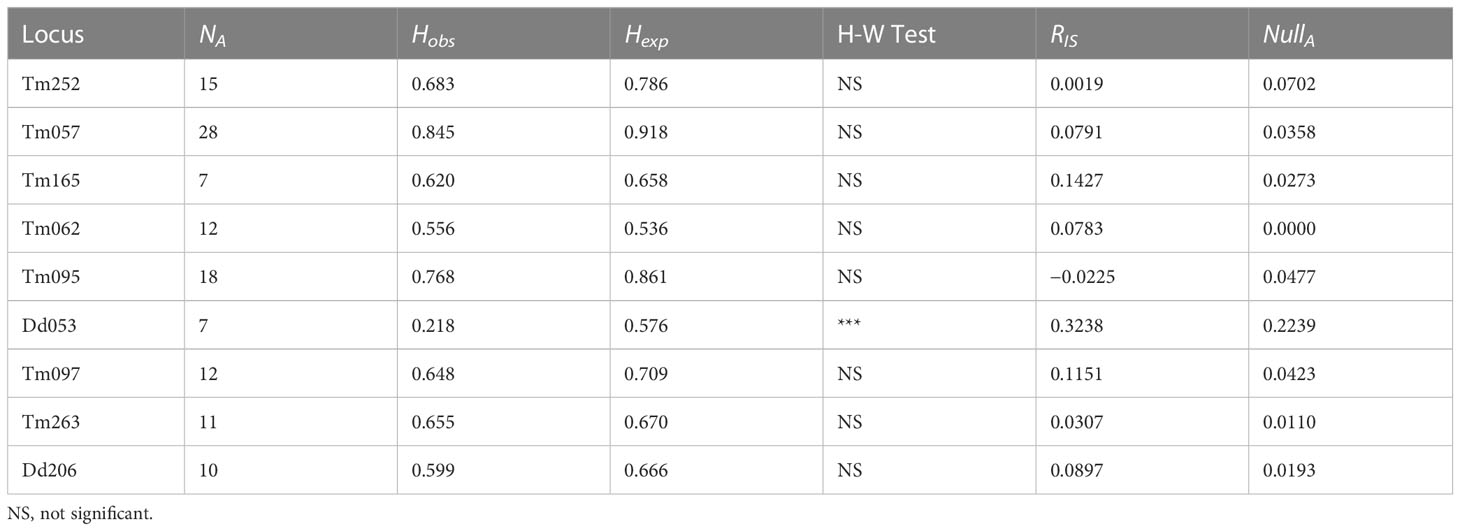
Table 1 Microsatellite loci are listed with estimates of number of alleles (NA), observed heterozygosity (Hobs), expected heterozygosity (Hexp), Hardy-Weinberg exact test (*** indicates significant deviation), fixation index with a stepwise mutation model (RIS), and frequency of null alleles (NullA).
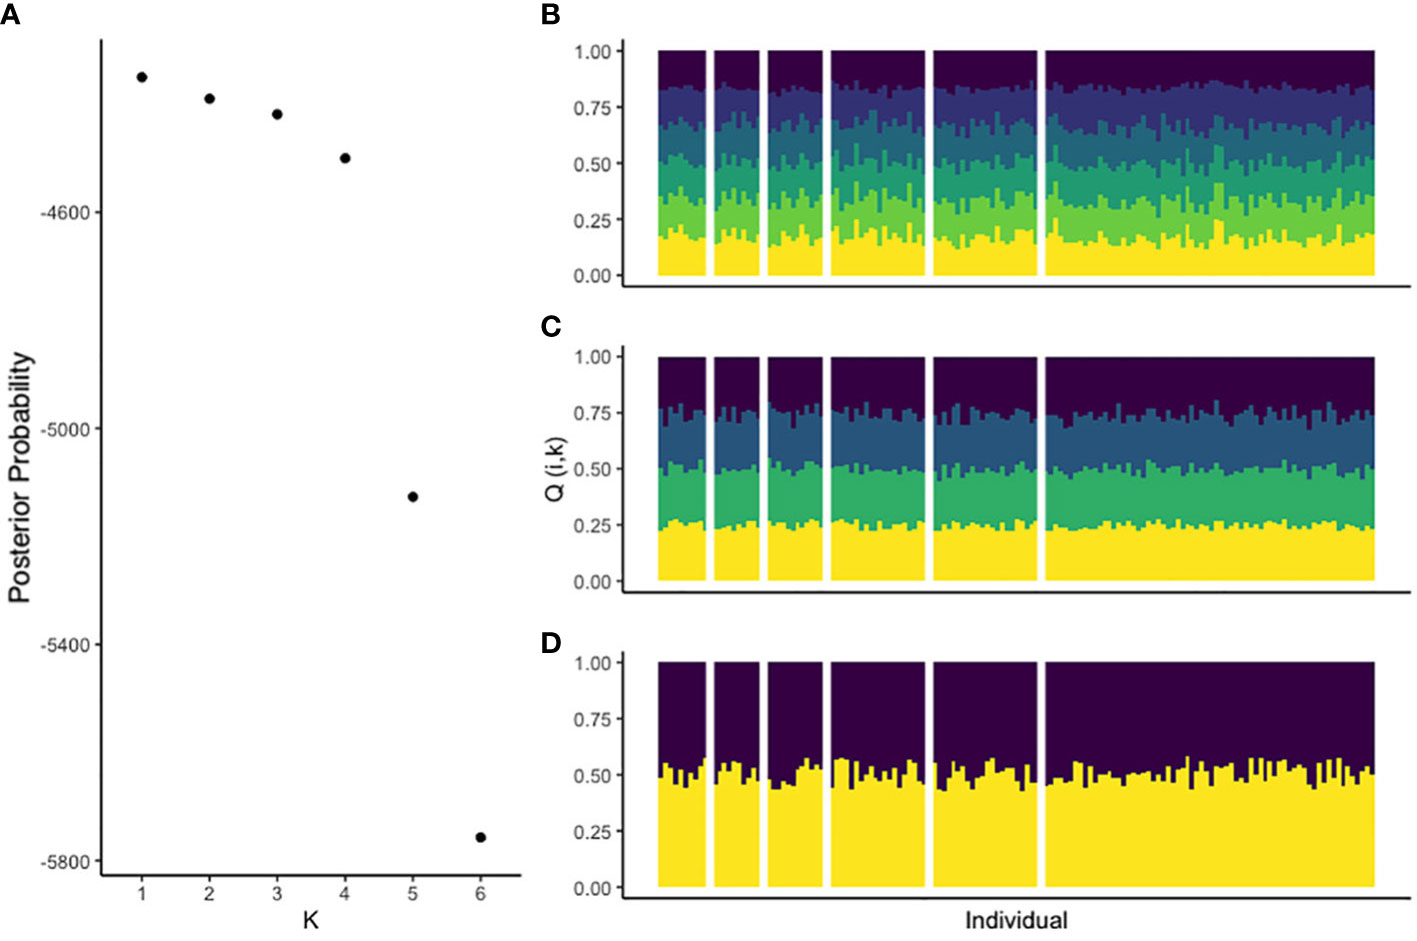
Figure 2 Panel (A) shows the likelihood of the T. minuta microsatellite genotypes being assigned to each possible category of K populations. Panel (B) shows the proportion of each T. minuta multilocus genotype assigned to each inferred population for K = 6. Panel (C) displays K = 4 and panel (D), K = 2. Individuals are represented by columns in the column chart and are separated by vertical white bars into groups that correspond to the patches from which they are sampled, which represent SP1 through SP6 in sequential order from left to right.
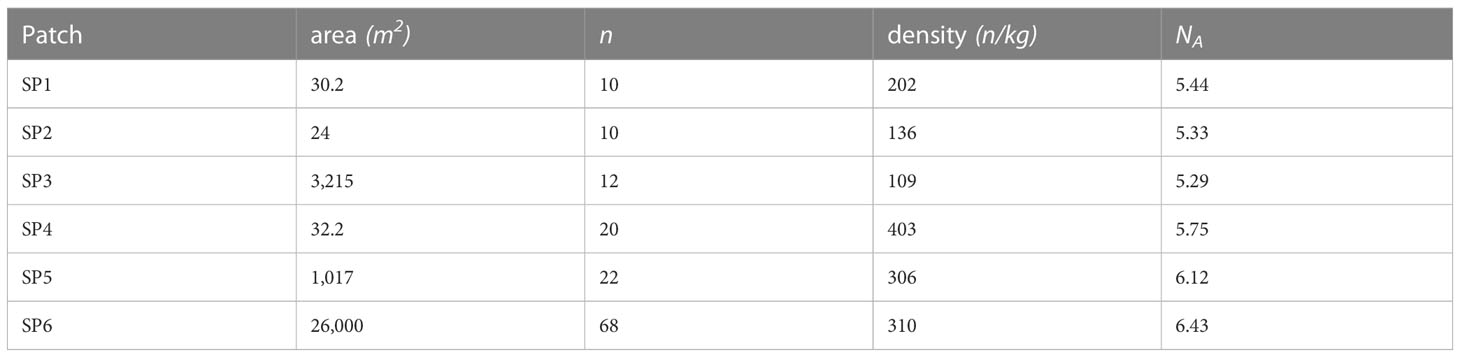
Table 2 The sampled patches are listed, along with their area, number of sampled individuals (n), density of individuals, and allelic richness (NA).
The frequency of null alleles estimated with INEST are shown in Table 1. DdAAC053 was the only locus observed to have a deficit of heterozygotes and the only locus with strong evidence for a frequency of null alleles greater than zero. We found that the model including null alleles (n) and genotyping failures (b) fit the data best with the lowest deviance information criterion value (DIC= 7527.8), though models including mating among relatives (f) and excluding genotyping failures performed similarly. The models not including null alleles (n) fit the data least well, with DICs increased by more than 10.
Using random permutation to remove background disequilibrium and allele frequency weighting (AFW), we estimated Ne to be 973 (CI: 678–∞) for all individuals pooled from all patches. Using allele frequency thresholding (AFT), we estimated Ne to be approximately 360 (CI: 208–1,325) across all patches. Using the widely employed Waples regression fit estimation method with AFT, we estimated Ne to be 361 (CI: 279–507).
Using the finite island model, we estimated Nem = 32.4 or on the order of 101. Taken with our independent estimate of Ne, the number of migrants per generation is estimated to 0.09 or on the order of 10−2, reflecting approximately one migrant in ten generations.
4 Discussion
In the study, we characterized the population genetic diversity of Tumidagena minuta in its patchy habitat in a single marsh in southern New Jersey USA. Our results show that little population structure has emerged among T. minuta inhabiting habitat patches 1 km apart. Our estimates of Ne and Nem reveal little evidence of gene flow among patches. This is consistent with the expectation that T. minuta has a low dispersal ability given its predominantly brachypterous (short-winged) morphology (Denno and Dingle, 1981). Previous research using allozymes similarly documented little population structure in T. minuta across among marsh sites, some as far as 400 km apart (Peterson et al., 2001). Because Peterson et al. (2001) reported low variation in their allozyme data and because microsatellites evolve more rapidly than allozymes, we expected to be able to resolve population structure in T. minuta for more recent genetic divergence and therefore at finer geographic scales (Shaw et al., 1999; Ellegren, 2004).
Using microsatellite markers, we still found little population structure among T. minuta populations within a single salt marsh. We observed that the lack of divergence among subpopulations is due to the maintenance of sufficiently large effective population sizes to prevent neutral divergence by drift, rather than migration among patches homogenizing subpopulations through gene flow, given our low estimates of migration rate. We modeled this system as continuously occupied subpopulations connected by gene flow and in drift–migration equilibrium, though our results are also consistent with extinction–colonization dynamics where extinction is rare and colonization from a migrant pool is frequent. Both scenarios result in the observed pattern of homogeneity and little population genetic differentiation (McCauley, 1991; Pannell, 2003). Distinguishing between these two models would require a temporal sampling strategy to assess densities across the seasons and years, and would be a fruitful avenue for future research.
Raupp and Denno (1979) found T. minuta census sizes (estimated and reported as densities) did not differ between “small” (10,000 m2) and “large” (200,000 m2) S. patens patches in the same marsh where this study was conducted. What those authors called a “small patch” approaches the size of the single largest patch remaining in the marsh and a typical patch in the marsh is now nearer a patch 100 to 1,000 m2 in size (personal observations). In other marshes, researchers have quantified 40–80% loss in S. patens area within this time (Watson et al., 2016; Rippel et al., 2023). We also observed that habitat patch size did not correlate with insect census size and our density estimates are qualitatively similar to those inferred from Raupp and Denno (1979), despite several orders of magnitude of habitat loss. We observed little evidence of density decline or neutral divergence due to drift in T. minuta populations.
We estimated contemporary Ne to be 360 across all patches using two-locus linkage disequilibrium with AFT to control for low frequency alleles. This estimate was on the same order of magnitude as the estimate made using the AFW method, though the upper bound of the AFT estimate confidence interval was finite. The estimate based on the widely employed Waples AFT approach was very similar, though we choose to focus on an estimation approach shown to have lower variance across replicated simulated datasets and robustness to null alleles in the dataset (Hamilton et al., 2018). Estimates of Ne from metapopulations with strong genetic subdivision are expected to be deflated due to variance in vital rates among subpopulations owing to asymmetrical colonization-extinction dynamics (Palstra and Ruzzante, 2011). However, we did not expect our estimate to be similarly deflated given that there was no genetic differentiation among sampling sites and little evidence of mating among relatives within patches.
Prior estimates of Ne for insects are few and are mostly for model species like Drosophila (Frankham, 1995; Nolte and Schloötterer, 2008; Barker, 2011), Estimates of Ne from 240 to 14,000 for mosquitos are also available, usually in the context of vector population control efforts, which exhibit seasonal variation and precipitous reductions after population control measures have been implemented (Athrey et al., 2012; Hodges et al., 2013; Wiltshire et al., 2018).
Some effective population sizes estimates have been made for insects of conservation concern, particularly those found in diminished and patchy habitats (Watts et al., 2007; Saarinen et al., 2010; Monroe and Britten, 2015), as well as crickets and wasps (Dyson et al., 2021; Kaňuch et al., 2021). Monroe and Britten (2015) and Saarinen et al. (2010) report genetic effective population sizes as low as 20 for an endangered dragonfly and critically endangered butterfly, respectively and Watts et al. (2007) reported effective population sizes ranging from 60 to 2,700 and migration rates from 0.06 to 0.75 for a metapopulation of an endangered damselfly that has retained locally large census population sizes. Ne estimates for Delphacid planthoppers have previously been made only for the brown rice planthopper, an important pest of cultivated rice (Sun et al., 2015). As far as we know, Ne has never been estimated for Delphacid or other planthopper in a natural population or conservation context. Such estimates are valuable because they provide insight into the strength of genetic drift in natural populations and provide benchmarks with which to evaluate and compare changing populations and habitats in the future. For example, in salt marshes, researchers showed a decline in Tabanid fly genetic effective population size in areas affected ecologically by the DeepWater Horizon oil spill (Husseneder et al., 2016). Ecological change leading to census size declines (i.e. oil spills, mosquito population control measures) result in clearly detectable reductions in effective population size.
Effective population sizes on the order of 102, such as what we observed, are expected to lead to relatively little allele frequency change due to drift on ecological timescales (Lande, 1988). Among demographically stable populations, Ne estimates vary markedly, from ~50 to ~5,000 (Palstra and Ruzzante, 2008). The scale of habitat loss at which Ne will become small enough that the effects of drift will be apparent in T. minuta populations remain unclear. It is possible, given the high insect densities even in patches one thousand fold smaller than legacy habitats, that the complete collapse of S. patens habitat will occur before genetic effects in T. minuta become clear. Given the Ne we observed, T. minuta is likely to maintain its response to selection, even as its habitat shrinks (Lande, 1988). Future work may investigate if other S. patens specialist herbivores like Delphacodes detecta, which show more clear negative responses to decreasing habitat area, show population genetic effects at this scale of habitat loss (Raupp and Denno, 1979).
We estimated the contemporary effective population size and migration rate for T. minuta, an abundant insect occupying a patchy saltmarsh habitat, using nine microsatellite loci. We estimated little genetic differentiation among our sampling sites, a low migration rate, and a sufficient effective population size to explain the lack of differentiation among our sites. We estimated effective population size, a parameter that describes an important link between demography and evolution, to be 360, which is consistent with other estimates of wild insect populations from the literature. Our approach has been successful in detecting reductions in effective size due to demographic collapse in other studies, and therefore our results suggest that despite several orders of magnitude of habitat loss, T. minuta populations remain large and are likely to retain their response to selection in the face of precipitous declines in habitat.
Data availability statement
The datasets presented in this study can be found in online repositories. The names of the repository/repositories and accession number(s) can be found below: https://github.com/billiemaguire/t.minuta.micro.
Author contributions
All authors contributed to the conception or design of the study. BM, JT, GW, and TR contributed to data collection in the field and laboratory. BM and MH performed statistical analyses and drafted the manuscript. All authors contributed to the article and approved the submitted version.
Acknowledgments
The authors wish to acknowledge and thank J. Nguyen, S. Caslin, and C. McIntosh, who assisted in the laboratory and the field, and the Georgetown University Center for Research and Fellowships, who funded this research through a Summer Mentored Undergraduate Research Fellowship to BM.
Conflict of interest
The authors declare that the research was conducted in the absence of any commercial or financial relationships that could be construed as a potential conflict of interest.
Publisher’s note
All claims expressed in this article are solely those of the authors and do not necessarily represent those of their affiliated organizations, or those of the publisher, the editors and the reviewers. Any product that may be evaluated in this article, or claim that may be made by its manufacturer, is not guaranteed or endorsed by the publisher.
References
Antolin M. F., Strong D. R. (1987). Long-distance dispersal by a parasitoid (Anagrus delicatus, mymaridae) and its host. Oecologia 73, 288–292. doi: 10.1007/BF00377520
Athrey G., Hodges T. K., Reddy M. R., Overgaard H. J., Matias A., Ridl F. C., et al. (2012). The effective population size of malaria mosquitoes: large impact of vector control. PloS Genet. 8 (12), e1003097. doi: 10.1371/journal.pgen.1003097
Barghi N., Hermisson J., Schlötterer C. (2020). Polygenic adaptation: a unifying framework to understand positive selection. Nat. Rev. Genet. 21 (12), 769–781. doi: 10.1038/s41576-020-0250-z
Barker J. S. F. (2011). Effective population size of natural populations of drosophila buzzatii, with a comparative evaluation of nine methods of estimation. Mol. Ecol. 20 (21), 4452–4471. doi: 10.1111/j.1365-294X.2011.05324.x
Beier P., Noss R. F. (1998). Do habitat corridors provide connectivity? Conserv. Biol. 12 (6), 1241–1252. doi: 10.1111/j.1523-1739.1998.98036.x
Bolnick D. I., Amarasekare P., Araújo M. S., Bürger R., Levine J. M., Novak M., et al. (2011). Why intraspecific trait variation matters in community ecology. Trends Ecol. Evol. 26 (4), 183–192. doi: 10.1016/j.tree.2011.01.009
Carley L. N., Morris W. F., Walsh R., Riebe D., Mitchell-Olds T. (2022). Are genetic variation and demographic performance linked? Evolutionary Appl. 15 (11), 1888–1906. doi: 10.1111/eva.13487
Chybicki I. J., Burczyk J. (2009). Simultaneous estimation of null alleles and inbreeding coefficients. J. Heredity 100 (1), 106–113. doi: 10.1093/jhered/esn088
Connor E. F., Courtney A. C., Yoder J. M. (2000). Individuals–area relationships: the relationship between animal population density and area. Ecology 81 (3), 734–748. doi: 10.1890/0012-9658(2000)081[0734:IARTRB]2.0.CO;2
Crooks K. R., Suarez A. V., Bolger D. T., Soulé M. E. (2001). Extinction and colonization of birds on habitat islands. Conserv. Biol. 15 (1), 159–172. doi: 10.1111/j.1523-1739.2001.99379.x
Denno R. F. (1980). Ecotope differentiation in a guild of sap-feeding insects on the salt marsh grass, Spartina patens. Ecology 61 (3), 702–714.
Denno R. F., Dingle H. (Eds.) (1981). Insect life history patterns: habitat and geographic variation (New York: Springer-Verlag), 225.
Denno R. F., Roderick G. K. (1990). Population biology of planthoppers. Annu. Rev. Entomology 35 (1), 489–520. doi: 10.1146/annurev.en.35.010190.002421
Denno R. F., Roderick G. K. (1991). “Influence of patch size, vegetation texture, and host plant architecture on the diversity, abundance, and life history styles of sapfeeding herbivores” in Habitat structure: the physical arrangement of objects in space. (Netherlands: Springer Netherlands), 169–196.
Dyson C. J., Piscano O. L., Durham R. M., Thompson V. J., Johnson C. H., Goodisman M. A. (2021). Temporal analysis of effective population size and mating system in a social wasp. J. Heredity 112 (7), 626–634. doi: 10.1093/jhered/esab057
Ellegren H. (2004). Microsatellites: simple sequences with complex evolution. Nat. Rev. Genet. 5 (6), 435–445. doi: 10.1038/nrg1348
Evanno G., Regnaut S., Goudet J. (2005). Detecting the number of clusters of individuals using the software STRUCTURE: a simulation study. Mol. Ecol. 14 (8), 2611–2620. doi: 10.1111/j.1365-294X.2005.02553.x
Ewers R. M., Didham R. K. (2006). Confounding factors in the detection of species responses to habitat fragmentation. Biol. Rev. 81 (1), 117–142. doi: 10.1017/S1464793105006949
Foster W. A., Treherne J. E. (1978). Dispersal mechanisms in an intertidal aphid. J. Anim. Ecol. 47, 205–217. doi: 10.2307/3932
Frankham R. (1995). Effective population size/adult population size ratios in wildlife: a review. Genet. Res. 66 (2), 95–107. doi: 10.1017/S0016672300034455
Frankham R., Ballou S. E. J. D., Briscoe D. A., Ballou J. D. (2002). Introduction to conservation genetics (Cambridge, England: Cambridge University Press).
Goudet J. (2005). Hierfstat, a package for r to compute and test hierarchical f-statistics. Mol. Ecol. Notes 5 (1), 184–186. doi: 10.1111/j.1471-8286.2004.00828.x
Hamilton M. B., Tartakovsky M., Battocletti A. (2018). Speed-ne: software to simulate and estimate genetic effective population size (Ne) from linkage disequilibrium observed in single samples. Mol. Ecol. Resour. 18 (3), 714–728. doi: 10.1111/1755-0998.12759
Hemminga M. A., Van Soelen J., Koutstaal B. P. (1990). Tidal dispersal of salt marsh insect larvae within the westerschelde estuary. Ecography 13 (4), 308–315. doi: 10.1111/j.1600-0587.1990.tb00623.x
Hess G. R. (1996). Linking extinction to connectivity and habitat destruction in metapopulation models. Am. Nat. 148 (1), 226–236. doi: 10.1086/285922
Hodges T. K., Athrey G., Deitz K. C., Overgaard H. J., Matias A., Caccone A., et al. (2013). Large Fluctuations in the effective population size of the malaria mosquito Anopheles gambiae ss during vector control cycle. Evolutionary Appl. 6 (8), 1171–1183. doi: 10.1111/eva.12094
Holderegger R., Wagner H. H. (2008). Landscape genetics. Bioscience 58 (3), 199–207. doi: 10.1641/B580306
Hufbauer R. A., Szűcs M., Kasyon E., Youngberg C., Koontz M. J., Richards C., et al. (2015). Three types of rescue can avert extinction in a changing environment. Proc. Natl. Acad. Sci. 112 (33), 10557–10562. doi: 10.1073/pnas.1504732112
Husseneder C., Donaldson J. R., Foil L. D. (2016). Impact of the 2010 deepwater horizon oil spill on population size and genetic structure of horse flies in Louisiana marshes. Sci. Rep. 6 (1), 1–11. doi: 10.1038/srep18968
Kaňuch P., Berggren Å., Cassel-Lundhagen A. (2021). A clue to invasion success: genetic diversity quickly rebounds after introduction bottlenecks. Biol. Invasions 23 (4), 1141–1156. doi: 10.1007/s10530-020-02426-y
Keyghobadi N. (2007). The genetic implications of habitat fragmentation for animals. Can. J. Zoology 85 (10), 1049–1064. doi: 10.1139/Z07-095
Kimura M. (1983). The neutral theory of molecular evolution (Cambridge, England: Cambridge University Press).
Lande R. (1988). Genetics and demography in biological conservation. Science 241 (4872), 1455–1460. doi: 10.1126/science.3420403
Lande R. (1994). Risk of population extinction from fixation of new deleterious mutations. Evolution 48 (5), 1460–1469. doi: 10.1111/j.1558-5646.1994.tb02188.x
Lowe W. H., Kovach R. P., Allendorf F. W. (2017). Population genetics and demography unite ecology and evolution. Trends Ecol. Evol. 32 (2), 141–152. doi: 10.1016/j.tree.2016.12.002
MacArthur R. H. (1965). Patterns of species diversity. Biol. Rev. 40 (4), 510–533. doi: 10.1111/j.1469-185X.1965.tb00815.x
Manel S., Holderegger R. (2013). Ten years of landscape genetics. Trends Ecol. Evol. 28 (10), 614–621. doi: 10.1016/j.tree.2013.05.012
Martinson H. M., Fagan W. F., Denno R. F. (2012). Critical patch sizes for food-web modules. Ecology 93 (8), 1779–1786. doi: 10.1890/11-1497.1
McCauley D. E. (1991). Genetic consequences of local population extinction and recolonization. Trends Ecol. Evol. 6 (1), 5–8. doi: 10.1016/0169-5347(91)90139-O
McCullough G. A., Wallis G. P., Waters J. M. (2009). Do insects lose flight before they lose their wings? population genetic structure in subalpine stoneflies. Mol. Ecol. 18 (19), 4073–4087. doi: 10.1111/j.1365-294X.2009.04337.x
Molecular Ecology Resources Primer Development Consortium, Aggarwal R. K., Allainguillaume J., Bajay M. M., Barthwal S., Bertolino P., et al. (2011). Permanent genetic resources added to molecular ecology resources database 1 august 2010–30 September 2010. Mol. Ecol. Resour. 11 (1), 219–222. doi: 10.1111/j.1755-0998.2010.02944.x
Monroe E. M., Britten H. B. (2015). Single-sample estimation of effective population size in several populations of the endangered hine’s emerald dragonfly. Freshw. Sci. 34 (3), 1058–1064. doi: 10.1086/682073
Newman D., Pilson D. (1997). Increased probability of extinction due to decreased genetic effective population size: experimental populations of clarkia pulchella. Evolution 51 (2), 354–362. doi: 10.1111/j.1558-5646.1997.tb02422.x
Nolte V., Schloötterer C. (2008). African Drosophila melanogaster and d. simulans populations have similar levels of sequence variability, suggesting comparable effective population sizes. Genetics 178 (1), 405–412. doi: 10.1534/genetics.107.080200
Palstra F. P., Ruzzante D. E. (2008). Genetic estimates of contemporary effective population size: what can they tell us about the importance of genetic stochasticity for wild population persistence? Mol. Ecol. 17 (15), 3428–3447. doi: 10.1111/j.1365-294X.2008.03842.x
Palstra F. P., Ruzzante D. E. (2011). Demographic and genetic factors shaping contemporary metapopulation effective size and its empirical estimation in salmonid fish. Heredity 107 (5), 444–455. doi: 10.1038/hdy.2011.31
Pannell J. R. (2003). Coalescence in a metapopulation with recurrent local extinction and recolonization. Evolution 57 (5), 949–961. doi: 10.1111/j.0014-3820.2003.tb00307.x
Pannell J. R., Charlesworth B. (2000). Effects of metapopulation processes on measures of genetic diversity. Philos. Trans. R. Soc. London. Ser. B: Biol. Sci. 355 (1404), 1851–1864. doi: 10.1098/rstb.2000.0740
Paradis E., Claude J., Strimmer K. (2004). APE: analyses of phylogenetics and evolution in r language. Bioinformatics 20 (2), 289–290. doi: 10.1093/bioinformatics/btg412
Peterson M. A., Denno R. F., Robinson L. (2001). Apparent widespread gene flow in the predominantly flightless planthopper Tumidagena minuta. Ecol. Entomology 26 (6), 629–637. doi: 10.1046/j.1365-2311.2001.00364.x
Pritchard J. K., Stephens M., Donnelly P. (2000). Inference of population structure using multilocus genotype data. Genetics 155 (2), 945–959. doi: 10.1093/genetics/155.2.945
Raupp M. J., Denno R. F. (1979). The influence of patch size on a guild of sap-feeding insects that inhabit the salt marsh grass Spartina patens. Environ. Entomology 8 (3), 412–417. doi: 10.1093/ee/8.3.412
R Core Team. (2013). R: a language and environment for statistical computing. (Vienna: R Foundation for Statistical Computing). Available at: https://www.R-project.org.
Reed D. H., Frankham R. (2003). Correlation between fitness and genetic diversity. Conserv. Biol. 17 (1), 230–237. doi: 10.1046/j.1523-1739.2003.01236.x
Ries L., Fletcher R. J. Jr., Battin J., Sisk T. D. (2004). Ecological responses to habitat edges: mechanisms, models, and variability explained. Annu. Rev. Ecol. Evol. Syst. 35, 491–522. doi: 10.1146/annurev.ecolsys.35.112202.130148
Rippel T. M., Minsavage-Davis C. D., Shirey V., Wimp G. M. (2023). Simple machine learning with aerial imagery reveals severe loss of a salt marsh foundation species. Estuaries Coasts 46 (4), 1110–1122. doi: 10.1007/s12237-023-01192-z
Roff D. A. (1986). The evolution of wing dimorphism in insects. Evolution 40 (5), 1009–1020. doi: 10.1111/j.1558-5646.1986.tb00568.x
Rousset F. (2008). genepop’007: a complete re-implementation of the genepop software for windows and Linux. Mol. Ecol. Resour. 8 (1), 103–106. doi: 10.1111/j.1471-8286.2007.01931.x
Saarinen E. V., Austin J. D., Daniels J. C. (2010). Genetic estimates of contemporary effective population size in an endangered butterfly indicate a possible role for genetic compensation. Evolutionary Appl. 3 (1), 28–39. doi: 10.1111/j.1752-4571.2009.00096.x
Saunders D. A., Hobbs R. J., Margules C. R. (1991). Biological consequences of ecosystem fragmentation: a review. Conserv. Biol. 5 (1), 18–32. doi: 10.1111/j.1523-1739.1991.tb00384.x
Shaw P. W., Turan C., Wright J. M., O’connell M., Carvalho G. R. (1999). Microsatellite DNA analysis of population structure in Atlantic herring (Clupea harengus), with direct comparison to allozyme and mtDNA RFLP analyses. Heredity 83 (4), 490–499. doi: 10.1038/sj.hdy.6885860
Slatkin M. (1985). Rare alleles as indicators of gene flow. Evolution 39 (1), 53–65. doi: 10.1111/j.1558-5646.1985.tb04079.x
Slatkin M. (1995). A measure of population subdivision based on microsatellite allele frequencies. Genetics 139 (1), 457–462. doi: 10.1093/genetics/139.1.457
Sun J. T., Wang M. M., Zhang Y. K., Chapuis M. P., Jiang X. Y., Hu G., et al. (2015). Evidence for high dispersal ability and mito-nuclear discordance in the small brown planthopper, laodelphax striatellus. Sci. Rep. 5 (1), 1–10. doi: 10.1038/srep08045
Teixeira J. C., Huber C. D. (2021). The inflated significance of neutral genetic diversity in conservation genetics. Proc. Natl. Acad. Sci. 118 (10), e2015096118. doi: 10.1073/pnas.2015096118
Templeton A. R., Shaw K., Routman E., Davis S. K. (1990). The genetic consequences of habitat fragmentation. Ann. Missouri Botanical Garden 77, 13–27. doi: 10.2307/2399621
Walsh P. S., Metzger D. A., Higuchi R. (1991). Chelex 100 as a medium for simple extraction of DNA for PCR-based typing from forensic material. Biotechniques. 10 (4), 506–513. doi: 10.2144/000114018
Waples R. S. (2005). Genetic estimates of contemporary effective population size: to what time periods do the estimates apply? Mol. Ecol. 14 (11), 3335–3352. doi: 10.1111/j.1365-294X.2005.02673.x
Watson E. B., Szura K., Wigand C., Raposa K. B., Blount K., Cencer M. (2016). Sea Level rise, drought and the decline of Spartina patens in new England marshes. Biol. Conserv. 196, 173–181. doi: 10.1016/j.biocon.2016.02.011
Watts P. C., Saccheri I. J., Kemp S. J., Thompson D. J. (2007). Effective population sizes and migration rates in fragmented populations of an endangered insect (Coenagrion mercuriale: odonata). J. Anim. Ecol. 76, 790–800. doi: 10.1111/j.1365-2656.2007.01249.x
Whitlock M. C. (2003). Fixation probability and time in subdivided populations. Genetics 164 (2), 767–779. doi: 10.1093/genetics/164.2.767
Whitlock M. C., McCauley D. E. (1999). Indirect measures of gene flow and migration: FST≠ 1/(4Nm + 1). Heredity 82 (2), 117–125. doi: 10.1038/sj.hdy.6884960
Wilson E. O., MacArthur R. H. (1967). The theory of island biogeography Vol. Vol. 1) (Princeton, NJ: Princeton University Press).
Wiltshire R. M., Bergey C. M., Kayondo J. K., Birungi J., Mukwaya L. G., Emrich S. J., et al. (2018). Reduced-representation sequencing identifies small effective population sizes of anopheles gambiae in the north-western lake Victoria basin, Uganda. Malaria J. 17 (1), 1–12. doi: 10.1186/s12936-018-2432-0
Wimp G. M., Murphy S. M., Lewis D., Ries L. (2011). Do edge responses cascade up or down a multi-trophic food web? Ecol. Lett. 14 (9), 863–870. doi: 10.1111/j.1461-0248.2011.01656.x
Wootton J. T., Pfister C. A. (2013). Experimental separation of genetic and demographic factors on extinction risk in wild populations. Ecology 94 (10), 2117–2123. doi: 10.1890/12-1828.1
Wright S. (1931). Evolution in mendelian populations. Genetics 16 (2), 97. doi: 10.1093%2Fgenetics%2F16.2.97
Keywords: microsatellite, salt marsh, insect, global change, effective population size
Citation: Maguire B, Tomasula J, Rippel T, Wimp GM and Hamilton MB (2023) Sea level rise-induced habitat loss does not alter effective migration rate for the salt marsh insect Tumidagena minuta due to large genetic effective population size. Front. Ecol. Evol. 11:1160232. doi: 10.3389/fevo.2023.1160232
Received: 06 February 2023; Accepted: 15 June 2023;
Published: 30 June 2023.
Edited by:
Gang Song, Chinese Academy of Sciences (CAS), ChinaReviewed by:
Jose Aurelio Castro, University of the Balearic Islands, SpainChuanyin Dai, Guangxi Normal University, China
Copyright © 2023 Maguire, Tomasula, Rippel, Wimp and Hamilton. This is an open-access article distributed under the terms of the Creative Commons Attribution License (CC BY). The use, distribution or reproduction in other forums is permitted, provided the original author(s) and the copyright owner(s) are credited and that the original publication in this journal is cited, in accordance with accepted academic practice. No use, distribution or reproduction is permitted which does not comply with these terms.
*Correspondence: Billie Maguire, d2lsbGlhbS5tYWd1aXJlMDAyQHVtYi5lZHU=