 Katie R. Hooker1*
 L. Mike Conner2
 Steven B. Jack2Gail Morris2William E. Palmer3Brandon T. Rutledge2D. Clay Sisson3Theron M. Terhune3Shane D. Wellendorf3
 Robert A. McCleery1
- 1Department of Wildlife Ecology and Conservation, University of Florida, Gainesville, FL, United States
- 2The Jones Center at Ichauway, Newton, GA, United States
- 3Tall Timbers Research Station and Land Conservancy, Tallahassee, FL, United States
Our understanding of synchrony between populations from different taxonomic groups has been centered on predator–prey dynamics in simple systems but has rarely been examined in complex predator–prey systems. In addition to trophic interactions such as predator–prey dynamics, there is some evidence that exogenous factor such as climatic variation may facilitate synchrony between different taxonomic groups. Using three longitudinal datasets on quail (Colinus virginianus) and cotton rats (Sigmodon hispidus) we examined 1) the consistency of synchrony across time and space, 2) the relative influence of trophic interactions vs. exogenous factors on synchrony and 3) if trophic interactions were positively associated with synchrony between populations. We found evidence of consistent synchrony in cotton rat and bobwhite populations at both the site and regional levels. We found that trophic interactions between cotton rats and bobwhite were associated with relative synchrony between these populations, but these interactions appeared to weaken in years of greater synchrony. We did not find evidence that exogenous factors influenced relative synchrony at the regional level. Given the lack of a clear mechanistic explanation of the patterns observed in our data, we propose an alternative climate-mediated predation framework to explain synchrony in complex predator–prey systems. This framework includes both classic bottom-up theories of regulation while integrating trophic interactions via components of the shared predator hypothesis.
Introduction
Wildlife populations that co-vary in time and space have been investigated by scientists since the birth of ecology (Chapman, 1928; Elton, 1949; Andrewartha and Birch, 1954; Krebs, 1985; Brewer, 1988). Synchronous population dynamics, defined as coincident changes in abundance (Liebhold et al., 2004), have been observed across taxonomic groups, including invertebrates (Sutcliffe et al., 1996), fish (Myers et al., 1997), birds (Michel et al., 2016), and mammals (Ims and Steen, 1990). Despite its historical foundation, the patterns, causes, and consequences of synchronous population fluctuations are still not well understood (Liebhold et al., 2004). Most examples of synchrony come from disjunct populations of the same species (Burrows et al., 2002; Post and Forchhammer, 2002; Bellamy et al., 2003; Krebs et al., 2013) or closely related species (Raimondo et al., 2004a; Raimondo et al., 2004b; Robertson et al., 2015).
Synchrony between populations from different taxonomic groups is thought to be driven by exogenous factors such as environmental stochasticity (Moran, 1953) and trophic interactions such as competition and predation (Liebhold et al., 2004). There is considerable evidence that exogenous factors can cause synchrony in closely related species (Cavanaugh and Marshall, 1972; Ranta et al., 1997; Kendall et al., 2000; Koenig and Liebhold, 2016). Two sympatric populations may co-occur without synchronizing until a catalyst, such as changes in weather patterns, creates conditions for synchrony (Moran, 1953). Additionally, factors such as changes in habitat quality and weather patterns (i.e., the North Atlantic Oscillation) can alter the amount of synchrony found among populations across space and time (Hurrell, 1995; Ranta et al., 1997; Ranta et al., 1998; Koenig, 2001; Allstadt et al., 2015). While these patterns appear to be clear for closely related species, they are unclear when synchrony occurs in populations of different taxonomic groups.
Much of our understanding of synchrony between populations from different taxonomic groups has centered on trophic interactions, via predator–prey dynamics (Ims and Steen, 1990; De Roos et al., 1991; Gurney et al., 1998; Spiller et al., 2016) that occur in relatively simple communities of predators and prey (Lack, 1954; Angelstam et al., 1984). While the concepts generated from simple systems have been broadly applied (Davenport and Chalcraft, 2012; Nordberg and Schwarzkopf, 2019), rarely have they been examined in complex predator–prey systems. Meanwhile, other trophic mechanisms like competition for resources (Koenig, 2001; Jones et al., 2003) and similarity in species’ reproductive strategies may also increase the opportunity for synchrony (Moran, 1953; Liebhold et al., 2004). Additionally, there is some evidence (Liebhold et al., 2004) but little understanding of how trophic interactions and exogenous factors may interact to influence synchrony between populations from different taxonomic groups (Bjørnstad et al., 1999).
Two species that may allow us to better understand the influence of the synergies of exogenous factors and trophic interactions in a complex food web are hispid cotton rats (Sigmodon hispidus) and northern bobwhite (Colinus virginianus; hereafter bobwhite; Staller et al., 2005; Morris et al., 2011). Cotton rats and bobwhite are dominant primary consumers in ecosystems throughout the southeastern United States. Both species serve as an important food source to several shared generalist avian, mammalian, and reptilian secondary consumers (Schnell, 1968; Barrett et al., 2001). Anecdotal evidence of synchronous population fluctuations in cotton rat and bobwhite populations have been observed, leading some to hypothesize a trophic interaction mechanism of synchrony (Errington and Stoddard, 1938; Schnell, 1968; Barrett et al., 2001; Staller et al., 2005). However, environmental conditions can also influence both populations, for example, bobwhite chick survival can be sensitive to rainfall during their restricted breeding season (Terhune et al., 2019). Alternatively, variation in seasonal temperatures has been correlated with cotton rat reproductive activity (Goertz, 1965) and abundance (Rehmeier et al., 2005).
Our objective was to understand the patterns and drivers of synchrony for two sympatric primary consumers in a complex food web. Specifically, we wanted to address the following questions: 1) Do bobwhite and cotton rats synchronize consistently across space and time? 2) What is the relative influence of trophic interactions vs. exogenous factors on the amount of synchrony between populations, and 3) does the strength of trophic interactions increase with increasing synchrony between populations? Using datasets from sites in their southeastern geographic ranges, we predicted that bobwhite and cotton rats would exhibit punctuated but inconsistent periods of synchrony because the species’ reproductive potential is influenced differently by environmental variation. In support of Moran’s theorem of synchrony (Moran, 1953; Stien et al., 2012), we predicted that periods of synchronous fluctuations would be more closely associated with exogenous factors because populations of these species can be sensitive to climatic variation (Eifler and Slade, 1999; Perez et al., 2002; Hernández et al., 2005; Rehmeier et al., 2005). Finally, we predicted that trophic interactions (e.g., predation and competition) would not vary with the relative amount of synchrony between populations because empirical evidence (Miller and Epstein, 1986; Post and Forchhammer, 2002; Raimondo et al., 2004a) and theory suggest that exogenous factors drive synchrony in unrelated species (Moran, 1953; Royama, 1992; Koenig, 2001).
Materials and methods
Study species
Cotton rat and bobwhite distributions overlap in the southern United States and Mexico. Both species are ~160 g as adults (cotton rat range: 100 to 225 g; bobwhite range: 140 to 170 g; Cameron, 1999; Brennan et al., 2014) and primarily herbivorous, consuming grass and forb seeds, fruits, leafy vegetation, and sometimes invertebrates (Fleharty and Olson, 1969; Campbell-Kissock et al., 1985). Although they share similar resources, cotton rats and bobwhite select different vegetation structure. Cotton rat density generally increases with grass height and density (Goertz, 1964) whereas bobwhite prefer bunchgrasses and shrubs for cover and nesting (Wells, 2008). They also differ in life history strategies. Cotton rats can breed year-round if environmental conditions are favorable (Linzey, 1998), while bobwhite reproduction is restricted to a defined breeding season, primarily May–August (DeVos and Mueller, 1993).
Both bobwhite and cotton rat populations can be sensitive to environmental variation. Bobwhite abundance and survival have been linked to climatic conditions (Speake and Haugen, 1960; Jackson, 1962; Perez et al., 2002; Hernández et al., 2005). Although deviations from average seasonal environmental conditions can influence populations of both species, extreme weather events (e.g., extreme heat and drought) during the bobwhite breeding season can have a greater relative impact on their demographics (Perez et al., 2002; Tri et al., 2012). Similarly, extreme summer temperatures and cold winters have been shown to reduce cotton rat reproduction and abundance (Eifler and Slade, 1999; Rehmeier et al., 2005).
Study sites
To investigate the patterns of cotton rat and bobwhite population fluctuations, we used long-term data from three study sites: Tall Timbers Research Station (TT) in Leon County, Florida, the Jones Center at Ichauway (JC) in Baker County, Georgia, and a private property (Private) in Baker County, Georgia (Private; Figure 1).
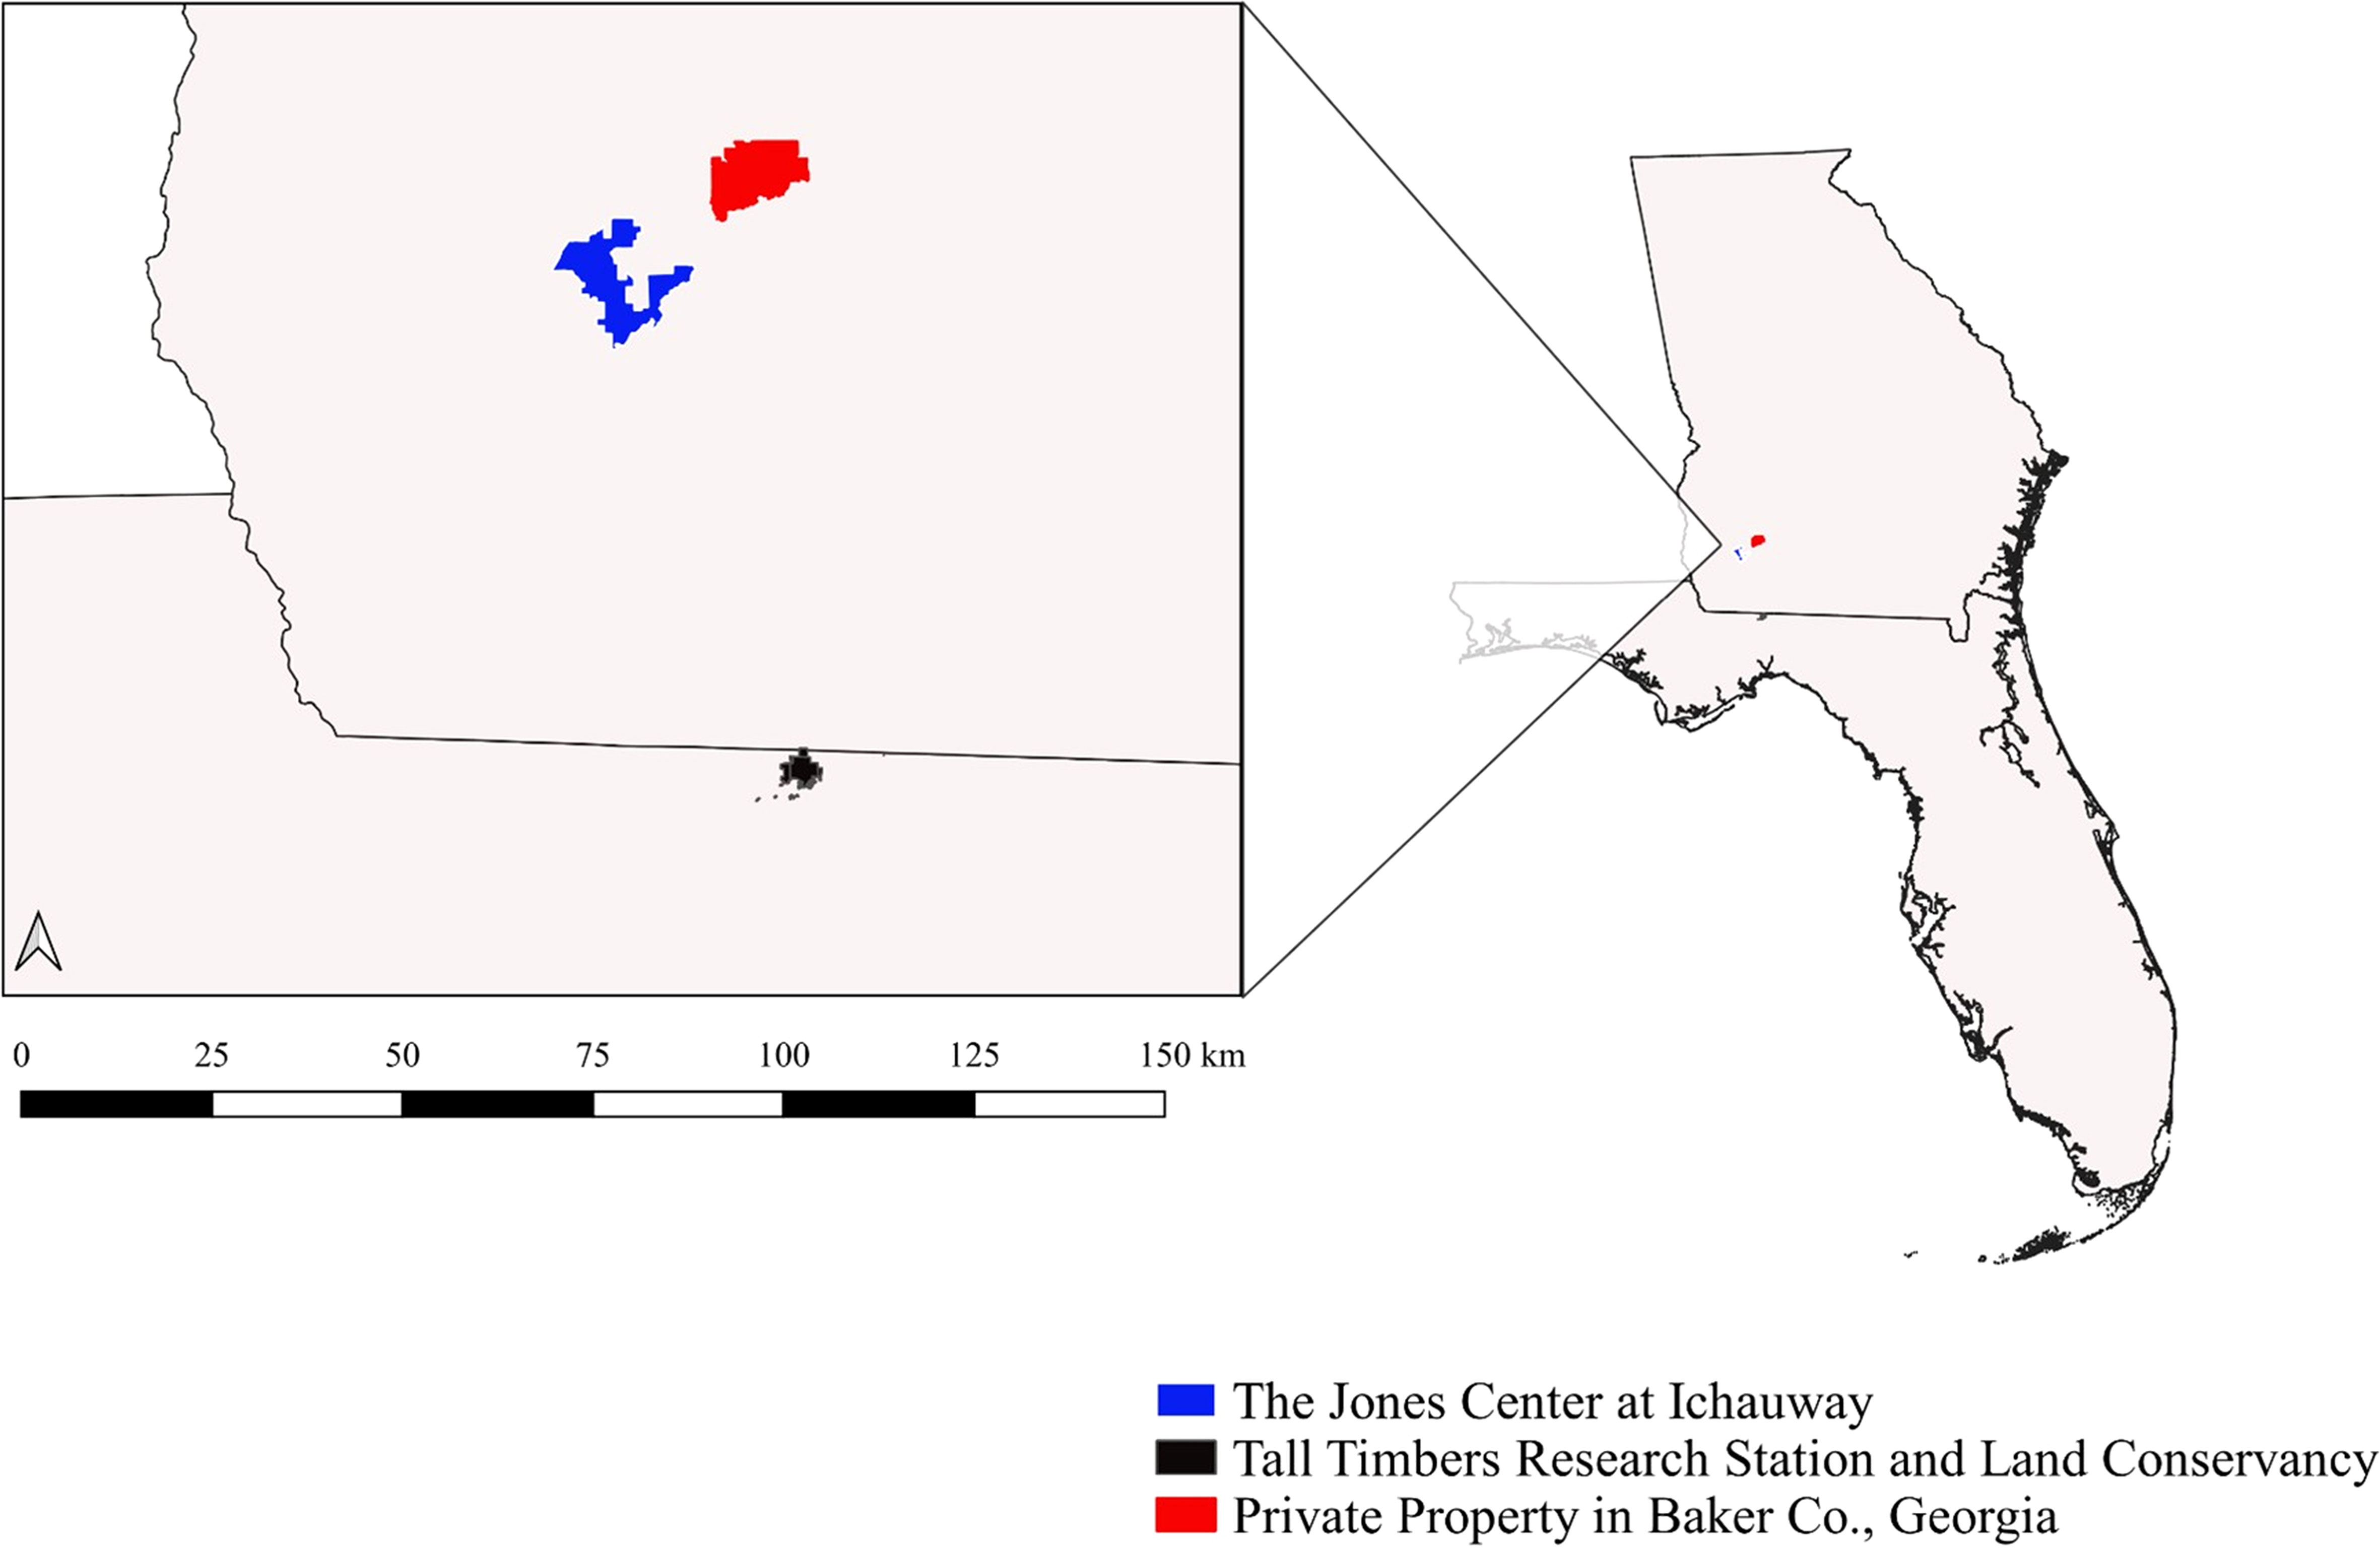
Figure 1 Study sites including the Jones Center at Ichauway, Baker Co., GA, a private property in Baker Co., GA, and Tall Timbers Research Station, Leon Co., FL.
Tall Timbers is a 1,600-ha forest in Leon County, Florida, USA, approximately 33.3 km north of Tallahassee, Florida. Tall Timbers’ landscape is dominated by sparsely distributed pine trees and a diverse understory of forbs and grasses. Characterized by a humid, subtropical climate and summer rainy season, TT has an average air temperature of 19.78°C and an average annual precipitation of 1.50 m.
The Jones Center at Ichauway is a 12,000-ha research facility in Baker County, Georgia, USA, approximately 20 km southwest of Newton, Georgia. The Jones Center is dominated by longleaf pine (Pinus palustris) and a diverse understory of grasses, forbs, and shrubs. The climate at JC is characterized by long, hot summers and cool, short winters (Lynch et al., 1986) with an average annual temperature of 18.11°C and average annual precipitation of 1.41 m.
The private property in Baker County, Georgia is a 6,000-ha forest approximately 24 km southwest of Albany, Georgia. In the Upper Coastal Plain physiographic region, this property is characterized by sandy-loam soils with low natural fertility (Palmer et al., 2012). The temperate, subtropical climate receives an average of 1.41 m of annual precipitation and has an average annual air temperature of 18.11°C. The dominant vegetation community is defined by low density upland pines, predominantly slash (P. elliottii), longleaf, and loblolly (P. taeda) and a diverse understory of forbs, legumes, and native warm season grasses (Yates et al., 1995).
Population data collection
Cotton rats
At TT, we established eight 1.82-ha plots, made up of 100 Sherman live traps (7.62 × 8.89 × 22.86 cm, H. B. Sherman Traps, Inc., Tallahassee, FL) arranged in a 10 × 10 grid. We placed traps 15 m apart and baited them with oats. At JC, in late July to mid-August each year from 2003 to 2017, we also trapped on eight plots with 144 Sherman live traps in 12 × 12 grids with 15 m spacing (2.72-ha). At the private property, each August from 2008 to 2017, we established four 1.82-ha plots made up of 100 Sherman live traps arranged in a 10 × 10 grid spaced 15 m apart. We trapped at each of these locations annually in late July–August (TT: 2002–2017, JC: 2003–2017, Private: 2008–2017), for four consecutive nights. We trapped cotton rats in August based on the within-year cycles of cotton rat populations observed in the region, which include annual peak densities in August each year (Hannon, 2006). We marked individuals with a unique numeric ear tag (Style 1005-1, National Band and Tag Co., Newport, KY) and collected data on location. We released marked animals at place of capture. Our trapping and handling methods followed the recommendations of the Animal Care and Use Committee of the American Society of Mammalogists (Sikes and Animal Care and Use Committee of the American Society of Mammalogists, 2016). Our methods were approved by Tall Timbers Research Station under (IACUC permit GB-2001-01-15), at the Jones Center at Ichauway under the Georgia Department of Natural Resources (scientific collecting permit 1000528068), and at the private property under the Georgia Department of Natural Resources (scientific collecting permit 1000650622).
Bobwhite
We conducted annual autumn covey counts at TT between September and November from 2002 to 2017 based on the methodology of Wellendorf and Palmer (2005). Each year, we randomly established twelve 25-ha quadrants. We placed a trained observer at the midpoint of each side of the quadrant (4 observers/quadrant). During the 45 minutes before sunrise, we recorded the estimated distance, bearing, and location of all calling coveys on a map of the quadrant and surrounding areas. We determined calling covey locations via triangulation based on observers’ bearings and distances. We grouped estimated distances from observer to covey into four categories: 0–100 m, 101–250 m, 251–500 m, and > 500 m. We estimated covey size based on flush counts conducted following point counts. We used this same methodology at the private property, where we conducted annual autumn (September–November) covey counts on four randomly established 25-ha quadrants from 2008 to 2017.
At JC, we conducted point count covey call surveys on a 92-station grid covering 6,997-ha from mid-October to early-November from 2003 to 2017. Beginning 45 minutes before sunrise, we recorded each covey heard until all calling had ceased. We grouped estimated distances from observer to covey into five distance bands: 0–25 m, 25–50 m, 50–100 m, 100–250 m, and 250–500 m. We assumed 12 bobwhite/covey based on published average covey size (Janke et al., 2013).
Environmental data collection
We selected a suite of environmental variables to determine the influence of exogenous factors on patterns of cotton rat and bobwhite population fluctuations. Enhanced vegetation index (EVI) is an optimized index that quantifies the “greenness” of vegetation based on the difference between the visible and near-infrared light reflected by vegetation (Huete et al., 2006). We chose EVI over the traditionally used NDVI (normalized difference vegetation index) because EVI has improved sensitivity to high biomass regions and is less influenced by cloud cover compared to NDVI (Huete et al., 2006). We downloaded EVI data from NASA’s MODIS platform (Didan, 2015) using product MOD13Q1 at a 250 m spatial resolution and 16-day temporal scale. We averaged these data for seasonal (spring: March–May, summer: June–August, autumn: September–November, winter: December–February) EVI measurements at all sites. Additionally, we focused on seasonal climatic variation due to the well-established links with both bobwhite and cotton rat population growth. Specifically, we obtained seasonal mean precipitation (cm) and temperature (°C) from NOAA’s National Centers for Environmental Information (NCEI, 2020) closest to each study site (mean distance ~21 km from study sites) from 2001 to 2017. We paired environmental data from the winter and spring prior to animal capture, the summer concurrent with cotton rat and prior to bobwhite capture, and the autumn after cotton rat and concurrent with bobwhite capture.
Statistical analyses
Animal density estimation
We estimated cotton rat density at TT, JC and the private property using annual August capture data. We calculated density based on a subset of Otis’ closed capture models (null (M0), time-varying (Mt), behavioral response (Mb); Otis et al., 1978; SI 1) using a conditional likelihood approach of two parameters: capture probability (p) and recapture probability (c; Huggins, 1989; Cooch and White, 2012). We chose a closed capture framework due to the single trapping session each year. We grouped each capture by “Plot” and “Year.” We used both ΔAICC and model weight to identify the most parsimonious model (AICC; Akaike, 1973; Burnham and Anderson, 2002; Burnham and Anderson, 2004). We derived plot-level abundance estimates from the most parsimonious model using the package RMark (Laake, 2013) in Program R (R Core Team, 2021). We averaged estimated abundance across plots within each year to provide a single annual cotton rat abundance estimate for each site.
We estimated bobwhite density at TT and the private property based on a global distance function from a subset of available detection functions in Program DISTANCE (Thomas et al., 2010) using an information theoretic criterion (AIC; Akaike, 1973) and model fit using chi-square model fit statistics (Burnham and Anderson, 1998). We estimated bobwhite density at JC based on an annual calling rate calculated given daily weather conditions (Wellendorf and Palmer, 2005), the assumed covey size, and the number of coveys heard. Different methodologies were used to estimate density at TT and JC due to differences in data collection methods across organizations/sites.
Synchrony of cotton rats and bobwhite
To determine if bobwhite and cotton rats consistently synchronize at each site, across the region, and through time we used concordance as a proxy for relative synchrony or the coincident population fluctuations (Gouhier and Guichard, 2014; Borgmann-Winter et al., 2021) of bobwhite and cotton rats. We measured concordance with a Kendall’s W test of concordance (kendall.global function) in the vegan package (Oksanen et al., 2013) in R (R Core Team, 2021). Kendall’s W is a non-parametric test of agreement among independent measures (i.e., judges) of same attributes which provides a concordance estimate ranging from 0 (no concordance) to 1 (full concordance), an F statistic, and probability (p). We treated cotton rat and bobwhite densities from each site as judges to measure relative synchrony at the site level. Then we treated cotton rat and bobwhite densities in each year as judges to test regional relative synchrony across years. The magnitude of agreement among judges can be interpreted as slight (0 < W < 0.20), fair (0.20 < W < 0.40), moderate (0.40 < W < 0.60), substantial (0.60 < W < 0.80), or almost perfect (0.80 < W < 1.0; Landis and Koch, 1977). We used the default 999 permutations and a Holm probability correction (Legendre, 2005) with α = 0.05 level of significance. We conducted post-hoc testing (kendall.post function) of the results to determine which judges significantly (α ≤ 0.05) influenced the overall concordance statistic. Each species’ annual density contributes to overall measures of concordance independently (Legendre, 2005). In some years, bobwhite or cotton rat density may have a greater influence than the other on the overall synchrony of population fluctuations. To acknowledge the effect of noise in the empirical data and understand how extremes in population abundances shaped patterns of synchrony, we measured the patterns the proportion of peaks (maxima) and troughs (minima) common to both bobwhite and cotton rat populations in time series. Specifically, we assessed the proportion of concurrent peaks and troughs using a Monte Carlo randomization to shuffle each species’ time series, destroying both the autocorrelation structure and cross correlation between series. We assessed peaks and troughs with all sites pooled (regionally) and at each site individually (locally). We conducted our analysis using the synchrony package (Gouhier and Guichard, 2014) in Program R, which computed a p-value based on the number of randomizations conducted (N = 999).
Drivers of population density
To determine the relative influence of exogenous factors on bobwhite and cotton rat densities we generated generalized linear models (GLM) in the glmmTMB package (Magnusson et al., 2017) in R (R Core Team, 2021). We developed two additive models to evaluate the linkages between bobwhite and cotton rat densities and exogenous factors. We averaged our seasonal exogenous factors and measures of density across sites, providing a single seasonal estimate of each variable per year. We justified consolidating these data based on the similar relative synchrony observed across all study sites. We parameterized the model with a Gaussian distribution and seasonal estimates of EVI, precipitation, and temperature, and the annual densities of bobwhite and cotton rats (Models 1 and 2). Prior to modeling, we scaled each variable and analyzed the variance inflation factor (VIF) in package car (Fox et al., 2019) in R (R Core Team, 2021) to assess each temporal dataset for multicollinearity of explanatory variables. We removed variables with > 2.5 VIF (Allison, 1999) one-by-one to reduce correlation.
Model 1:
Bobwhite Density ~ Seasonal EVI + Seasonal Temperature (°C) + Seasonal Precipitation (cm)
Model 2:
Cotton Rat Density ~ Seasonal EVI + Seasonal Temperature (°C) + Seasonal Precipitation (cm)
We assessed model fit based on visual inspection of the normality of residuals and met the assumptions of normality. We computed a Wald-z-statistic from a Wald chi-square test (Wald and Wolfowitz, 1943) to calculate the p-values of the explanatory variables in each model with a significance level of α ≤ 0.05. We evaluated the relative strength of these predictors by comparing their scaled beta estimates and displaying them graphically.
Drivers of synchrony
To determine the relative influence of trophic interactions and exogenous factors on synchrony we generated a generalized linear model (GLM) in the glmmTMB package (Magnusson et al., 2017) in R (R Core Team, 2021). We developed an additive model to evaluate the linkages between our measure of regional relative synchrony (Kendall’s W averaged from cotton rat and bobwhite Kendall’s Ws), exogenous factors, and trophic interactions (e.g., bobwhite and cotton rat densities). We averaged our seasonal exogenous factors and measures of density across sites, providing a single seasonal estimate of each variable per year. We justified consolidating these data based on the similar relative synchrony observed across all study sites. We parameterized the model with a Gaussian distribution and seasonal estimates of EVI, precipitation, and temperature, and the annual densities of bobwhite and cotton rats (Model 3). Prior to modeling, we scaled each exogenous factor variable and analyzed the variance inflation factor (VIF) in package car (Fox et al., 2019) in R (R Core Team, 2021) to assess each temporal dataset for multicollinearity of explanatory variables. We removed variables with > 2.5 VIF (Allison, 1999).
Model 3:
Relative Synchrony ~ Seasonal EVI + Seasonal Temperature (°C) + Seasonal Precipitation (cm) + Cotton Rat Density + Bobwhite Density
For each parameter, we computed a Wald-z-statistic from a Wald chi-square test (Wald and Wolfowitz, 1943) to calculate the p-values of the explanatory variables. We considered the explanatory relevance of each parameter, using a significance level of α ≤ 0.05. We evaluated the relative strength of these predictors by comparing their scaled beta estimates and displaying them graphically.
Trophic interactions and synchrony
To determine if trophic interactions were influenced by the amount of synchrony between the populations, we regressed the density of each species against an interaction between the other species density and our measure of relative synchrony (Kendall’s W; Models 4 and 5). We also included exogenous factors (significant variables from Model 3) to account for their known influence on densities and synchrony. We parameterized the models as a GLM in the glmmTMB package (Magnusson et al., 2017) in R (R Core Team, 2021) with the bobwhite and cotton rat densities modeled to fit with a Gaussian distribution and evaluated the residuals to determine if any assumptions of normality were violated.
Models 4 and 5:
Bobwhite Density ~ Significant Exogenous Factors from Model 3 + Cotton Rat Density + Relative Synchrony + Cotton Rat Density*Relative Synchrony
Cotton Rat Density ~ Significant Exogenous Factors from Model 3 + Bobwhite Density + Relative Synchrony + Bobwhite Density*Relative Synchrony
For each parameter, we computed a Wald-z-statistic from a Wald chi-square test (Wald and Wolfowitz, 1943) to calculate the p-values of the explanatory variables. We considered the explanatory relevance of the interaction parameter as well as other variables, using a significance level of α ≤ 0.05. We evaluated the relative strength of these predictors by comparing their scaled beta estimates and displaying them graphically.
Results
Estimates of animal density
Cotton rats
The most parsimonious model of cotton rat density across sites was the behavioral response model p(.),c(.): TT: AICc = 19099.67, model weight: 1.0; JC: AICc = 10175.56, model weight: 1.0; Private property: AICc = 2753.53, model weight: 0.99 (SI 2). Cotton rat density averaged 25.40 ± SE 1.46 cotton rats/ha from 2002 to 2017 at TT, 10.90 ± SE 1.18 cotton rats/ha from 2003 to 2017 at JC, and 15.8 ± SE 3.74 cotton rats/ha from 2008 to 2017 at the private property (SI 3).
Bobwhite
We estimated the density of bobwhite at TT and the private property based on the most competitive detection model, with a uniform detectability with simple polynomial adjustments, AIC = 146.5 (Wellendorf and Palmer, 2005). Bobwhite density averaged 3.48 ± SE 0.19 birds/ha at TT, 4.82 ± SE 0.34 birds/ha at the private property, and varied little at JC, averaging 1.69 ± SE 0.05 birds/ha (SI 4).
Environmental variation
Enhanced vegetation index varied by site and year and was, on average, highest in summer (0.48 ± SE 0.007) and lowest in winter (0.27 ± SE 0.003) across all sites. Precipitation varied across years and sites. Precipitation peaked in summer (30.2 ± SE 3.22 cm) and was lowest in autumn (14.7 ± SE 2.25 cm). Air temperature varied across seasons and years, with the highest average temperatures in summer (27.20 ± SE 0.15° C) and lowest in winter (11.70 ± SE 0.36° C) across all sites (SI 5).
Drivers of population density
After removing highly correlated environmental variables (winter, spring, and autumn EVI and winter, autumn, and summer precipitation) using VIF, our model of bobwhite density included winter temperature, spring precipitation and temperature, summer EVI and temperature, and autumn temperature as explanatory variables. Bobwhite density was significantly associated with previous spring precipitation (β = 0.22 ± SE 0.11, z = 1.98, p = 0.05) and concurrent autumn temperature (β = 0.26 ± SE 0.13, z = 2.03, p = 0.04; Table 1).
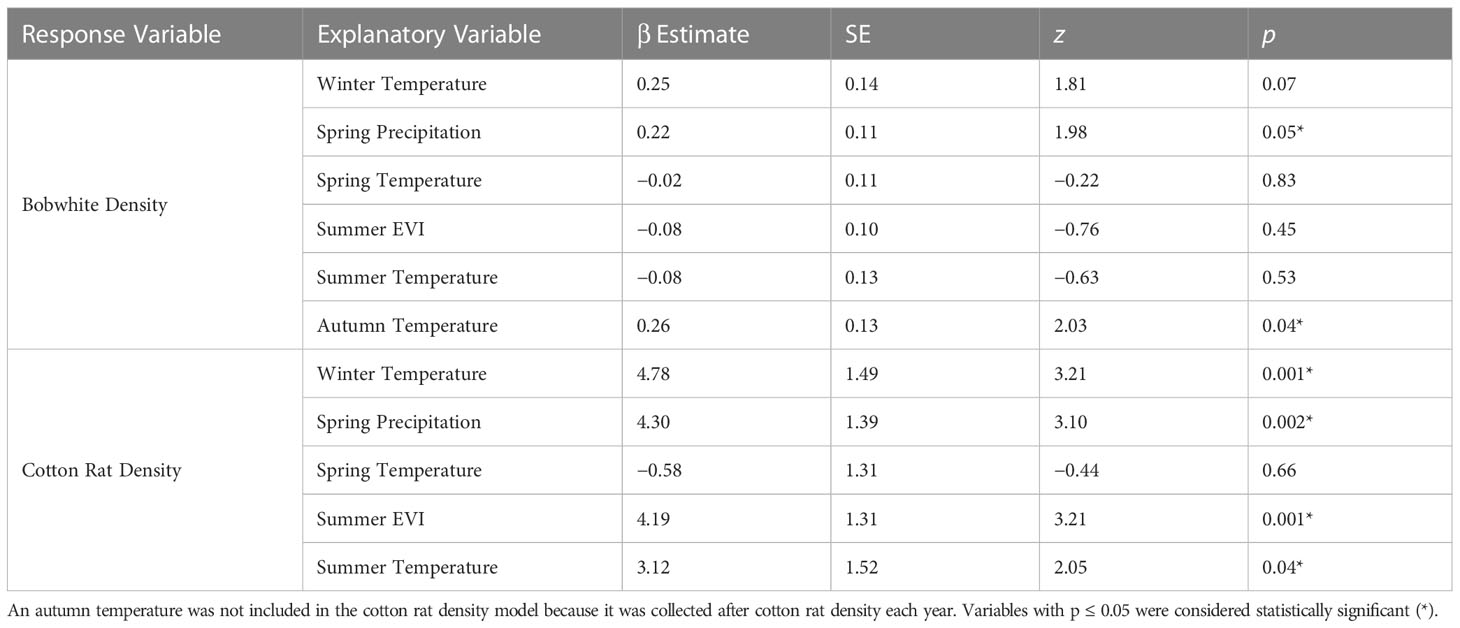
Table 1 Generalized linear mixed model results of the exogenous factors influence on bobwhite and cotton rat densities at the Jones left at Ichauway, a private property in Baker Co., GA, and Tall Timbers Research Station from 2002 to 2017.
Our model predicted that as prior spring precipitation increases from 5.5 to 32.51 cm, bobwhite density would increase from 2.82 ± SE 0.19 to 3.49 ± SE 0.20 individuals per hectare. Similarly, as autumn temperature increases from 18.74 to 23.28°C, bobwhite density is predicted to increase from 2.58 ± SE 0.29 to 3.63 ± SE 0.26 bobwhite per hectare (Figure 2).
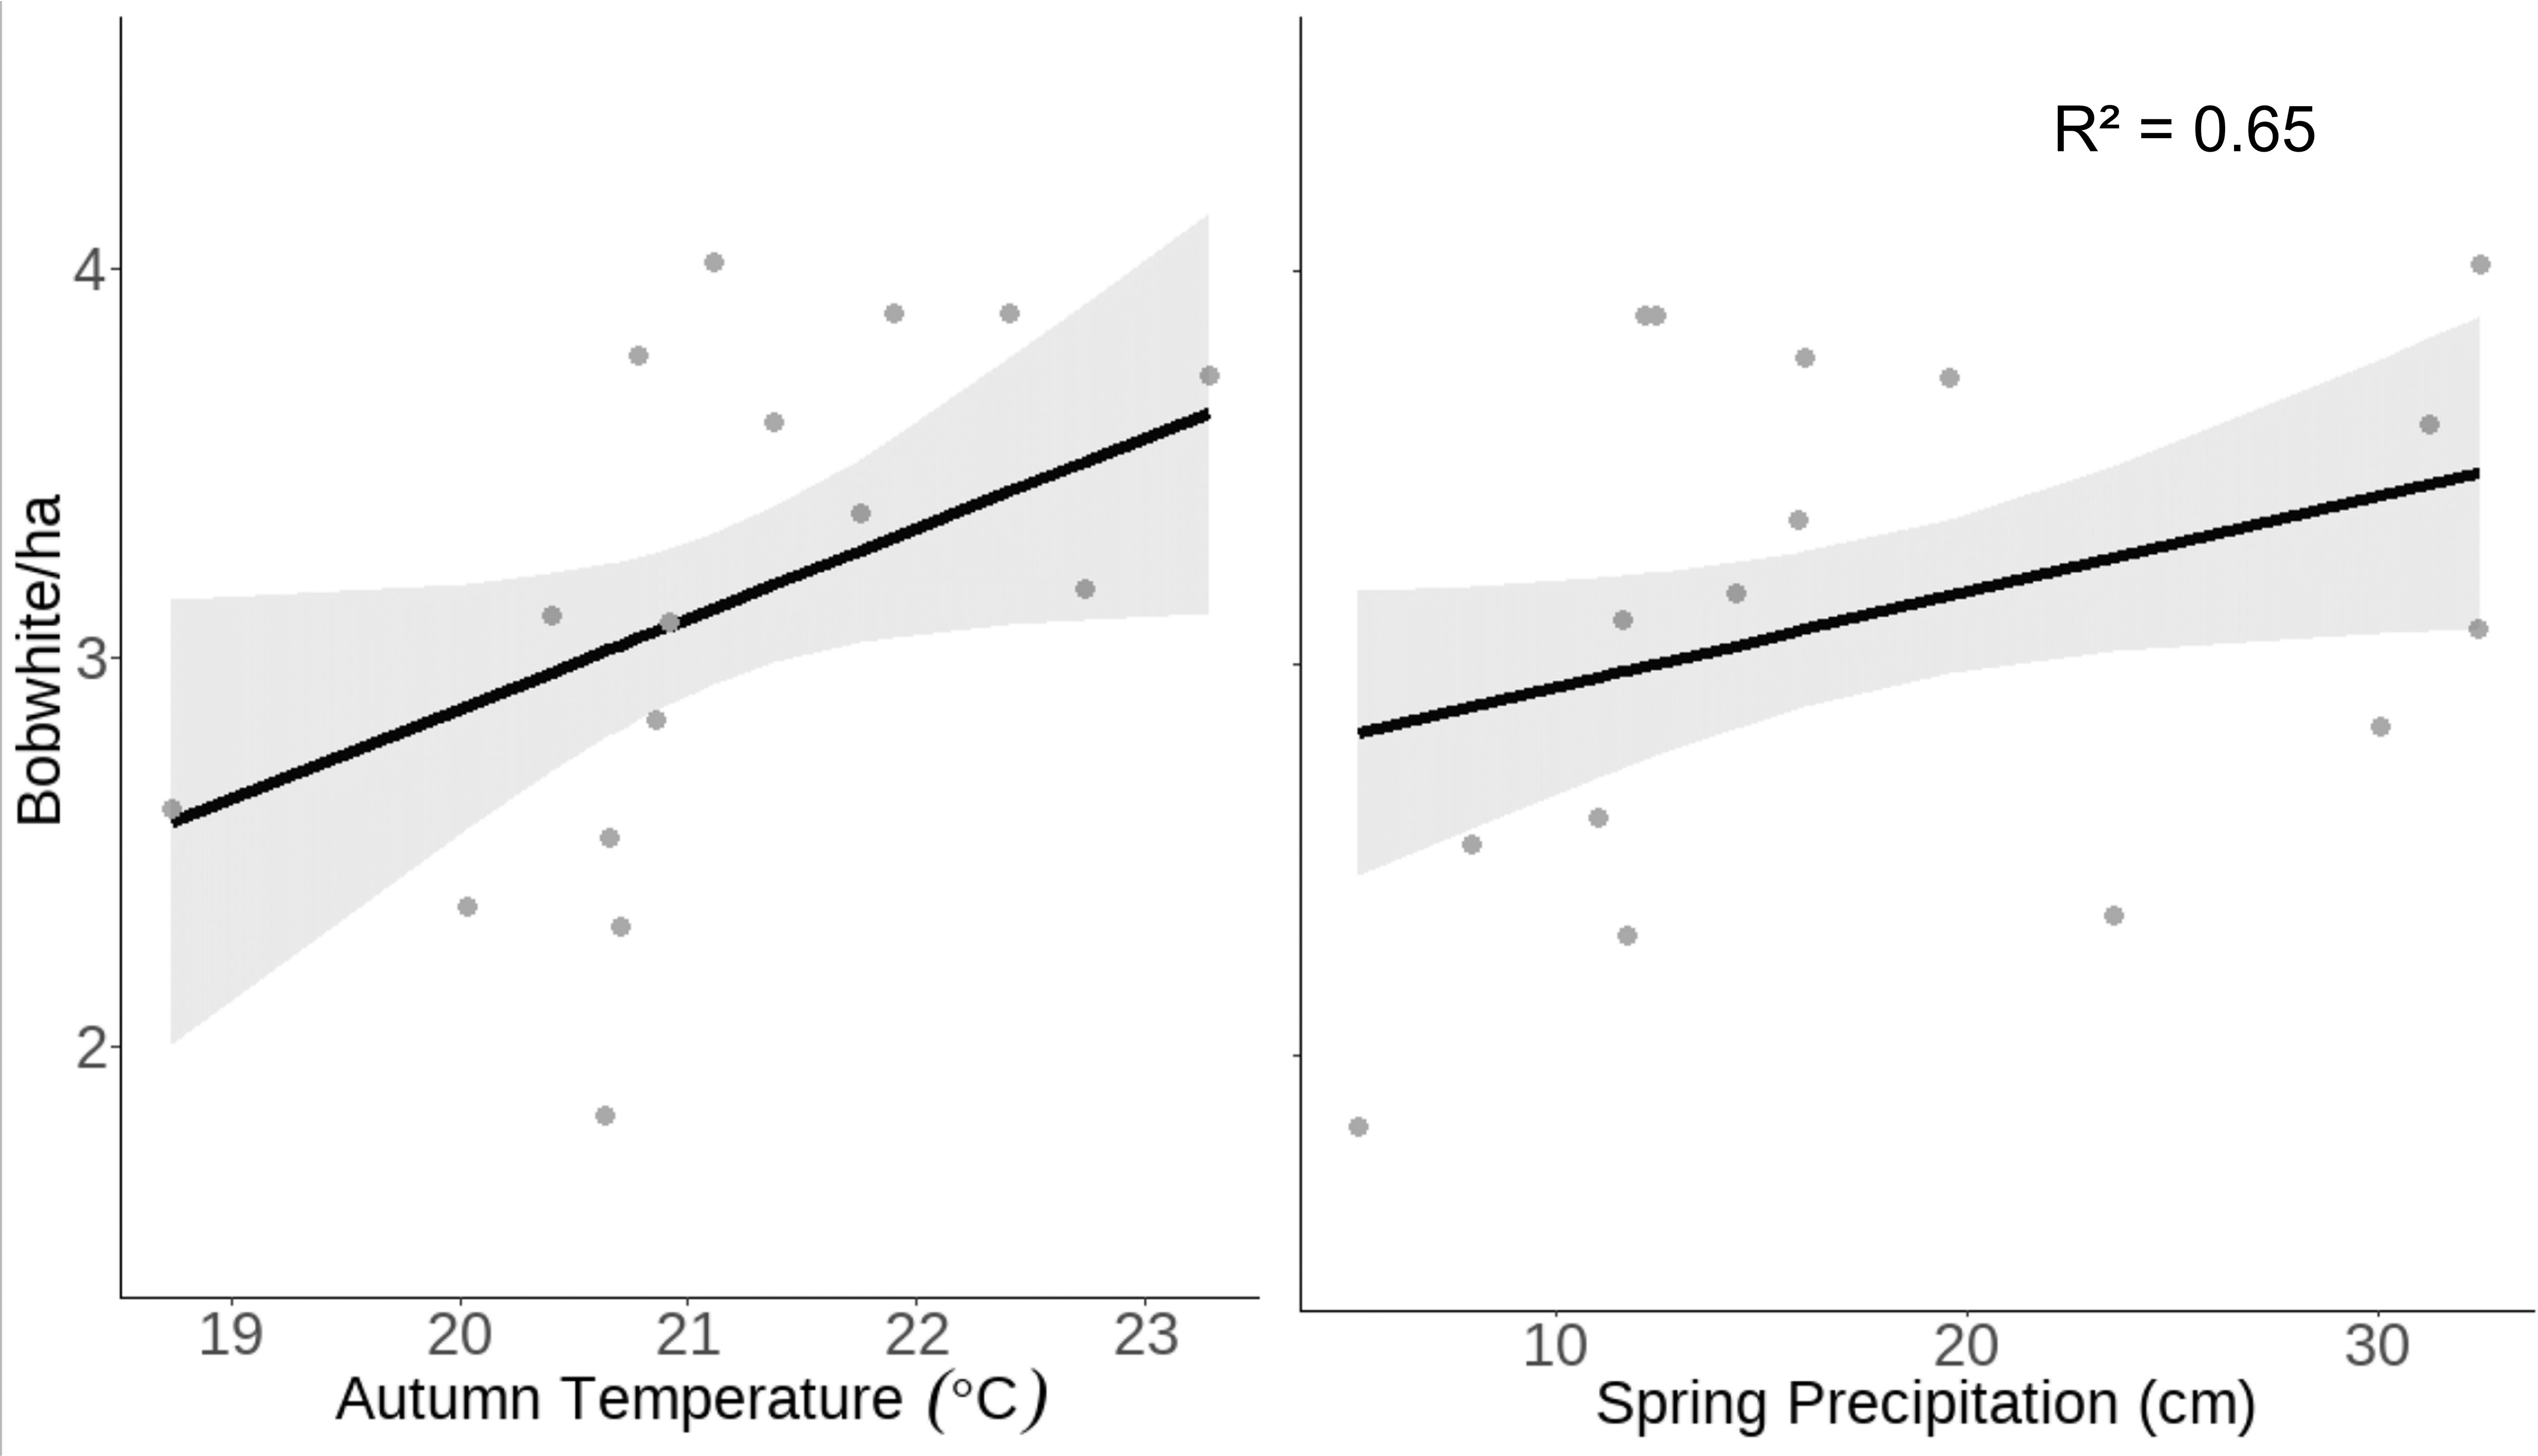
Figure 2 Raw data (gray dots) and model-predicted bobwhite density (black line) ± 95% confidence intervals (gray band) as prior spring precipitation and concurrent autumnal temperature increases at the Jones Center at Ichauway, a private property in Baker Co., GA, and Tall Timbers Research Station from 2002 to 2017.
Our model of cotton rat density included the same environmental variables as our model of bobwhite density except autumn temperature because those data were collected after cotton rat density each year. Cotton rat density was significantly associated with a number of variables, including positive significant relationships with winter (β = 5.83 ± SE 1.40, z = 4.17, p < 0.001) and summer temperature (β = 2.95 ± SE 1.40, z = 2.11, p = 0.04), spring precipitation (β = 4.21 ± SE 1.29, z = 3.26, p = 0.001), and summer EVI (β = 4.81 ± SE 1.25, z = 3.84, p < 0.001; Table 1).
Our model of cotton rat density predicted that as winter temperature increases from 8.81 to 14.46° C, cotton rat density would increase from 9.76 ± SE 3.03 to 27.84 ± SE 3.13 cotton rats/ha. Similarly, as summer temperature increases from 26.38 to 28.24° C, cotton rat density is predicted to increase from 13.93 ± SE 2.60 to 23.67 ± SE 2.75 cotton rats/ha. Our model predicted that as spring precipitation increases from 5.15 to 32.51 cm, cotton rat density will double, increasing from 12.59 ± SE 2.31 to 25.45 ± SE 2.53 individuals/ha. Our model predicted that as summer EVI increases from 0.43 to 0.55, cotton rat density will nearly triple, increasing from 12.49 ± SE 2.83 to 29.32 ± SE 3.56 cotton rats/ha (Figure 3).
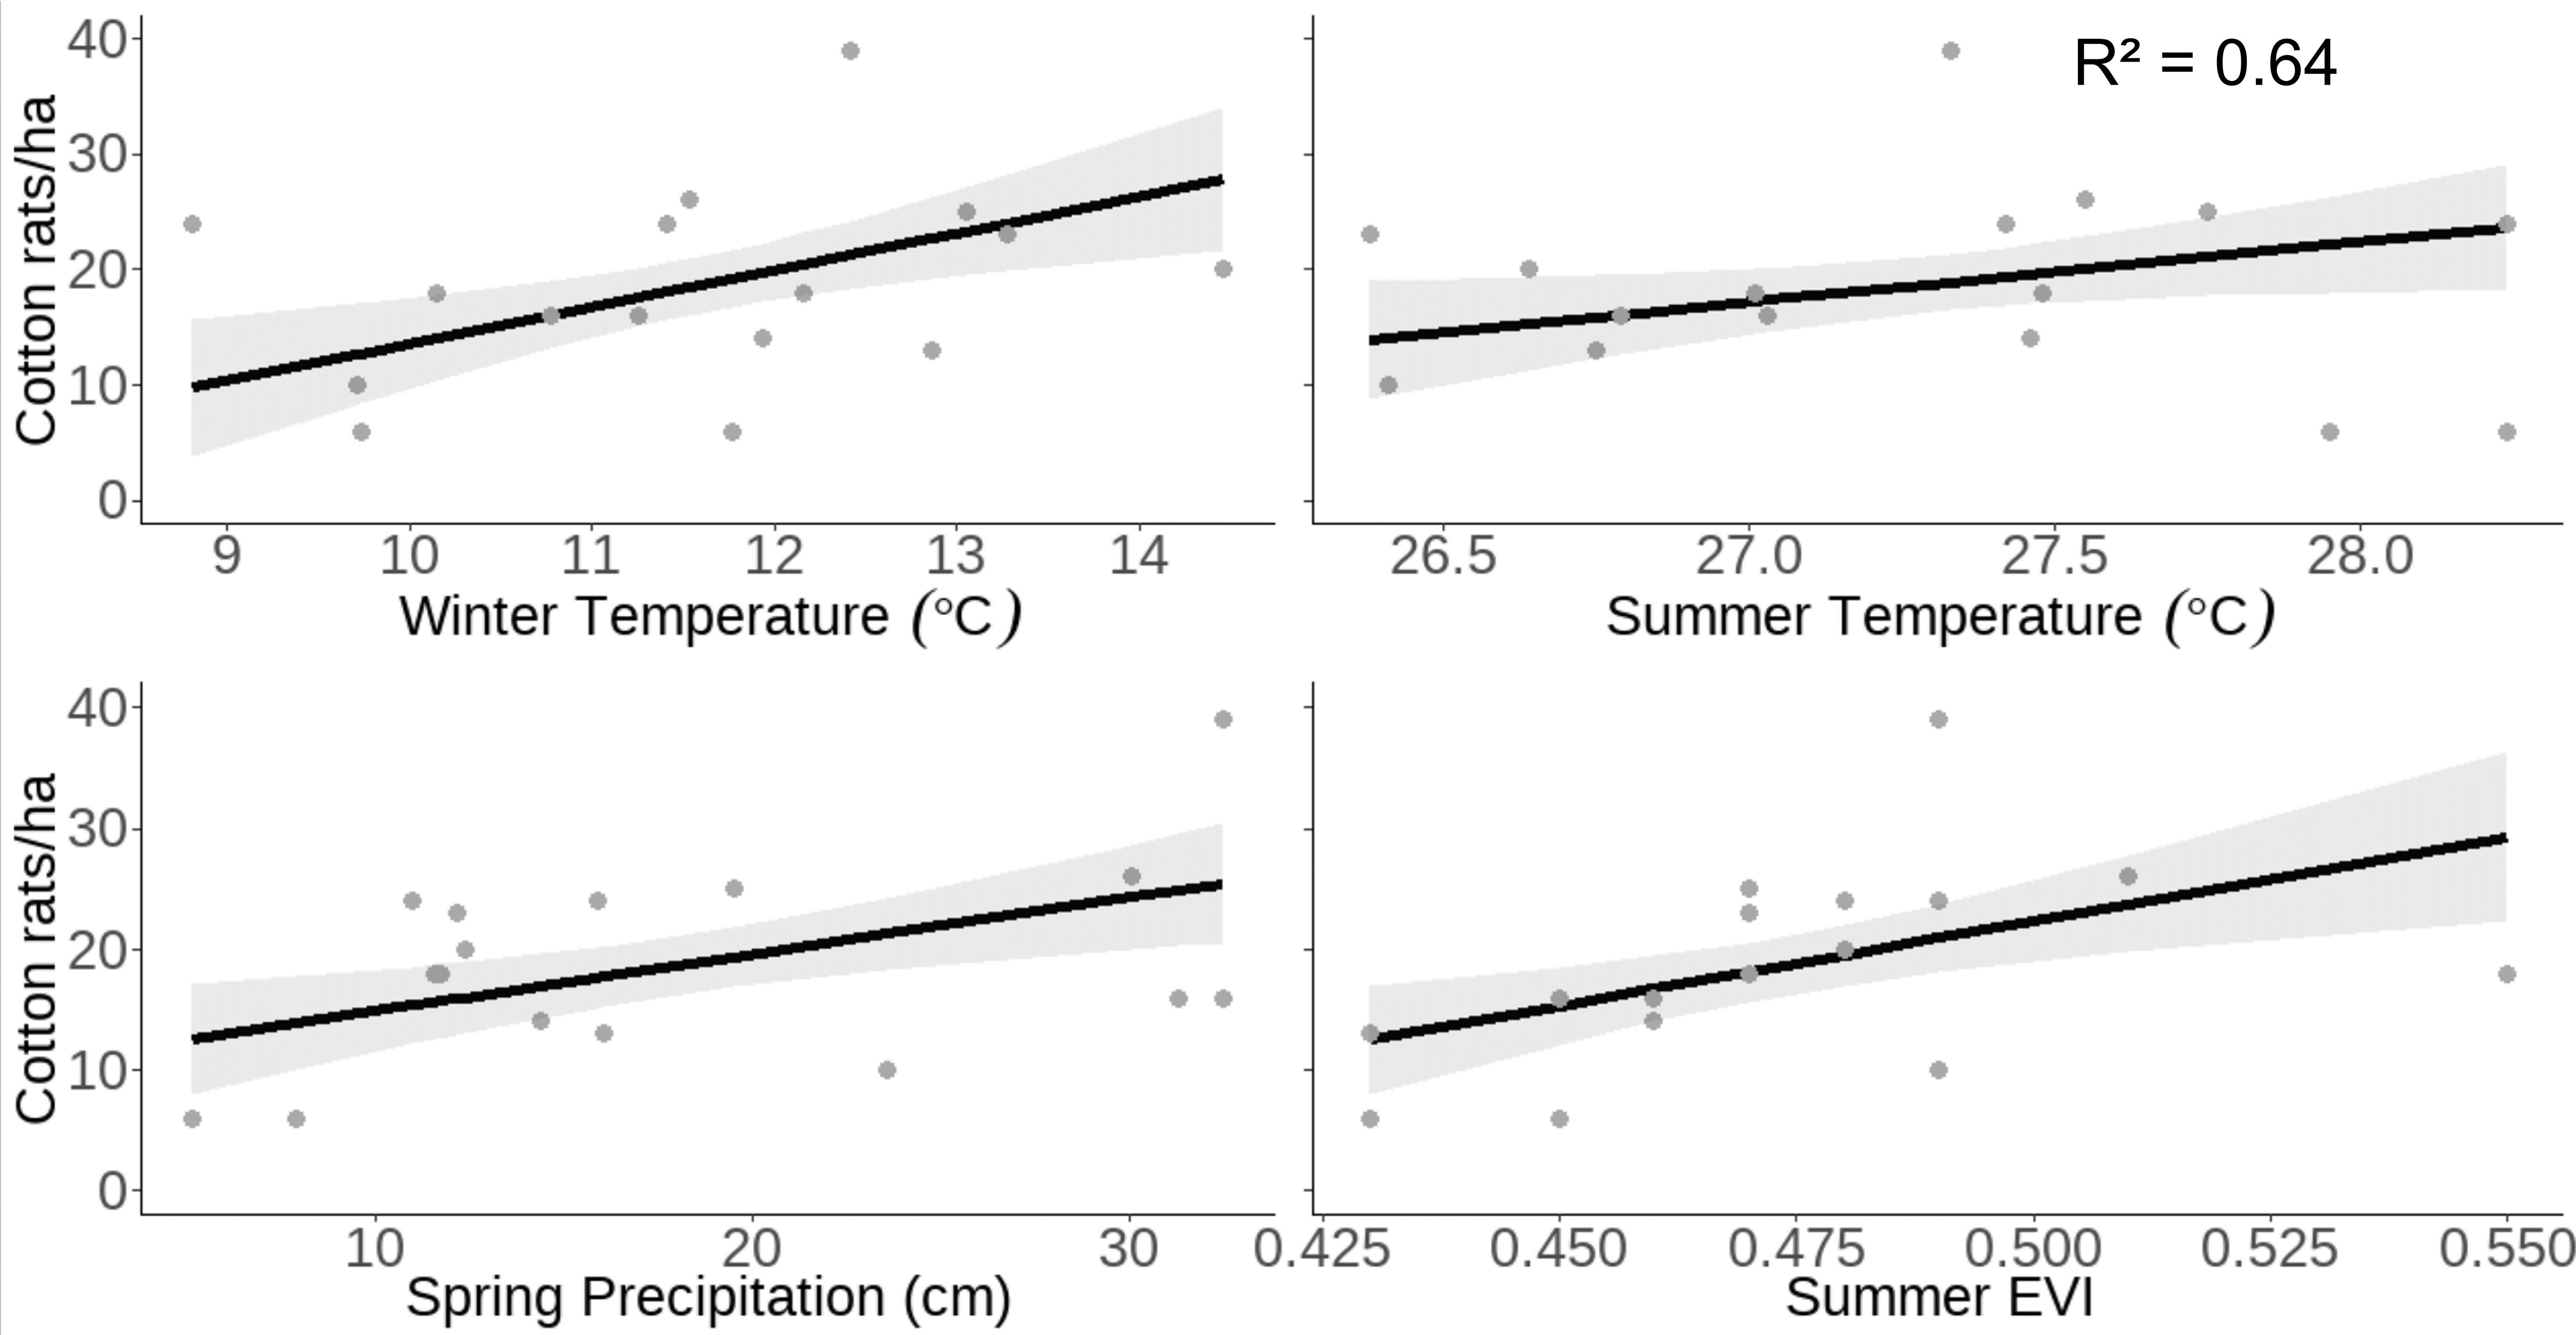
Figure 3 Raw data (gray dots) and model-predicted cotton rat density (black line) ± 95% confidence intervals (gray band) as prior winter temperature, prior spring precipitation, and concurrent summer EVI and temperature increase at the Jones Center at Ichauway, a private property in Baker Co., GA, and Tall Timbers Research Station from 2002 to 2017.
Synchrony of cotton rats and bobwhite
Regionally, when we pooled cotton rat and bobwhite density across sites as judges (N = 2), we found significant concordance (W = 0.76, F3 = 3.09, p < 0.001, χ2 = 58.93, corrected p < 0.001) indicating substantial levels of regional relative synchrony. At the site level, relative synchrony ranged from substantial at the Jones Center (W = 0.73; p = 0.05) and private property (W = 0.79; p = 0.04) to almost perfect at Tall Timbers (W = 0.90; p <0.001; Table 2). Overall, we found significant but fair levels of regional synchrony across years (W = 0.40, F32 = 20.87, p < 0.001, χ2 = 25.75, corrected p = 0.001). Post-hoc testing revealed that the strongest indication of synchrony were bobwhite and cotton rat densities in 2003, 2005, 2006, 2007, 2016, and 2017 (all W = 0.63), and bobwhite from 2011 to 2016 (all W = 0.63; SI 6). The regional proportion of concurrent peaks of bobwhite and cotton rat population maxima and minima was 56% (p = 0.01) suggesting synchrony occurred when abundances were relatively high and low.
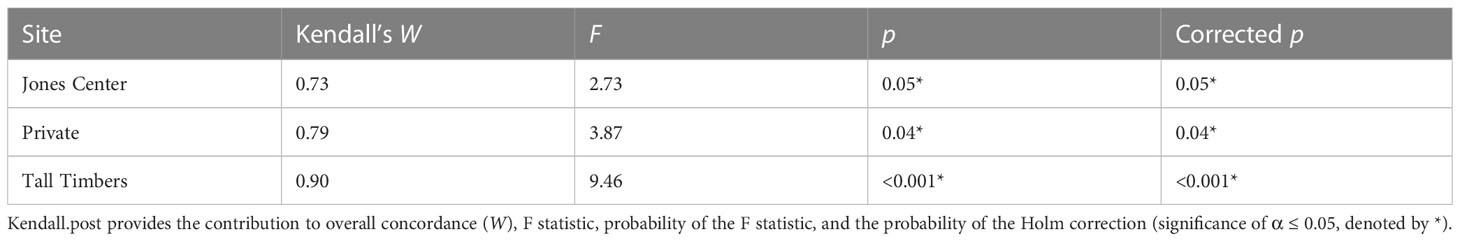
Table 2 Results of post-hoc testing of Kendall’s W showing the synchrony of cotton rats and bobwhite at each site relative to overall concordance (W).
Drivers of synchrony
After removing highly correlated environmental variables (winter, spring, and autumn EVI and winter, autumn, and summer precipitation), our model of relative synchrony included winter temperature, spring precipitation and temperature, summer EVI and temperature, autumn temperature, and bobwhite and cotton rat densities as explanatory variables. Relative synchrony was negatively associated with bobwhite density (β = −0.26 ± SE 0.10, z = −2.68, p = 0.007; Table 3). Our model predicted that as bobwhite density increases from 1.82 to 4.49 individuals per hectare, relative synchrony will decrease from 0.95 ± SE 0.19 to 0.10 ± SE 0.13 (Figure 4).
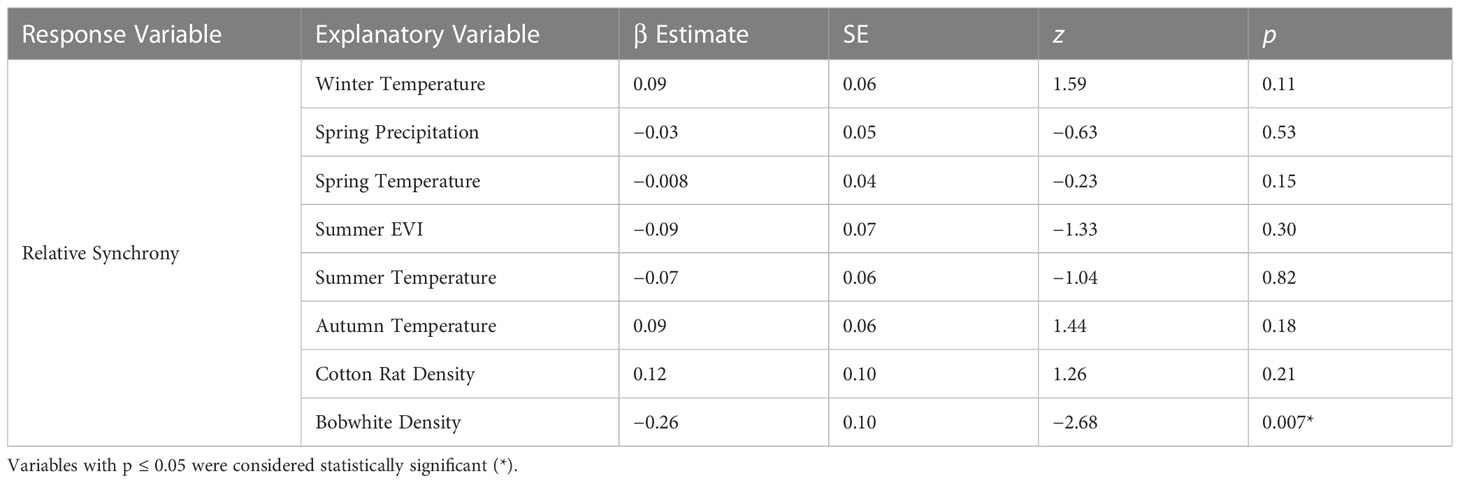
Table 3 Generalized linear mixed model results of the exogenous and trophic interaction factors on relative synchrony at the Jones Center at Ichauway, a private property in Baker Co., GA, and Tall Timbers Research Station from 2002 to 2017.
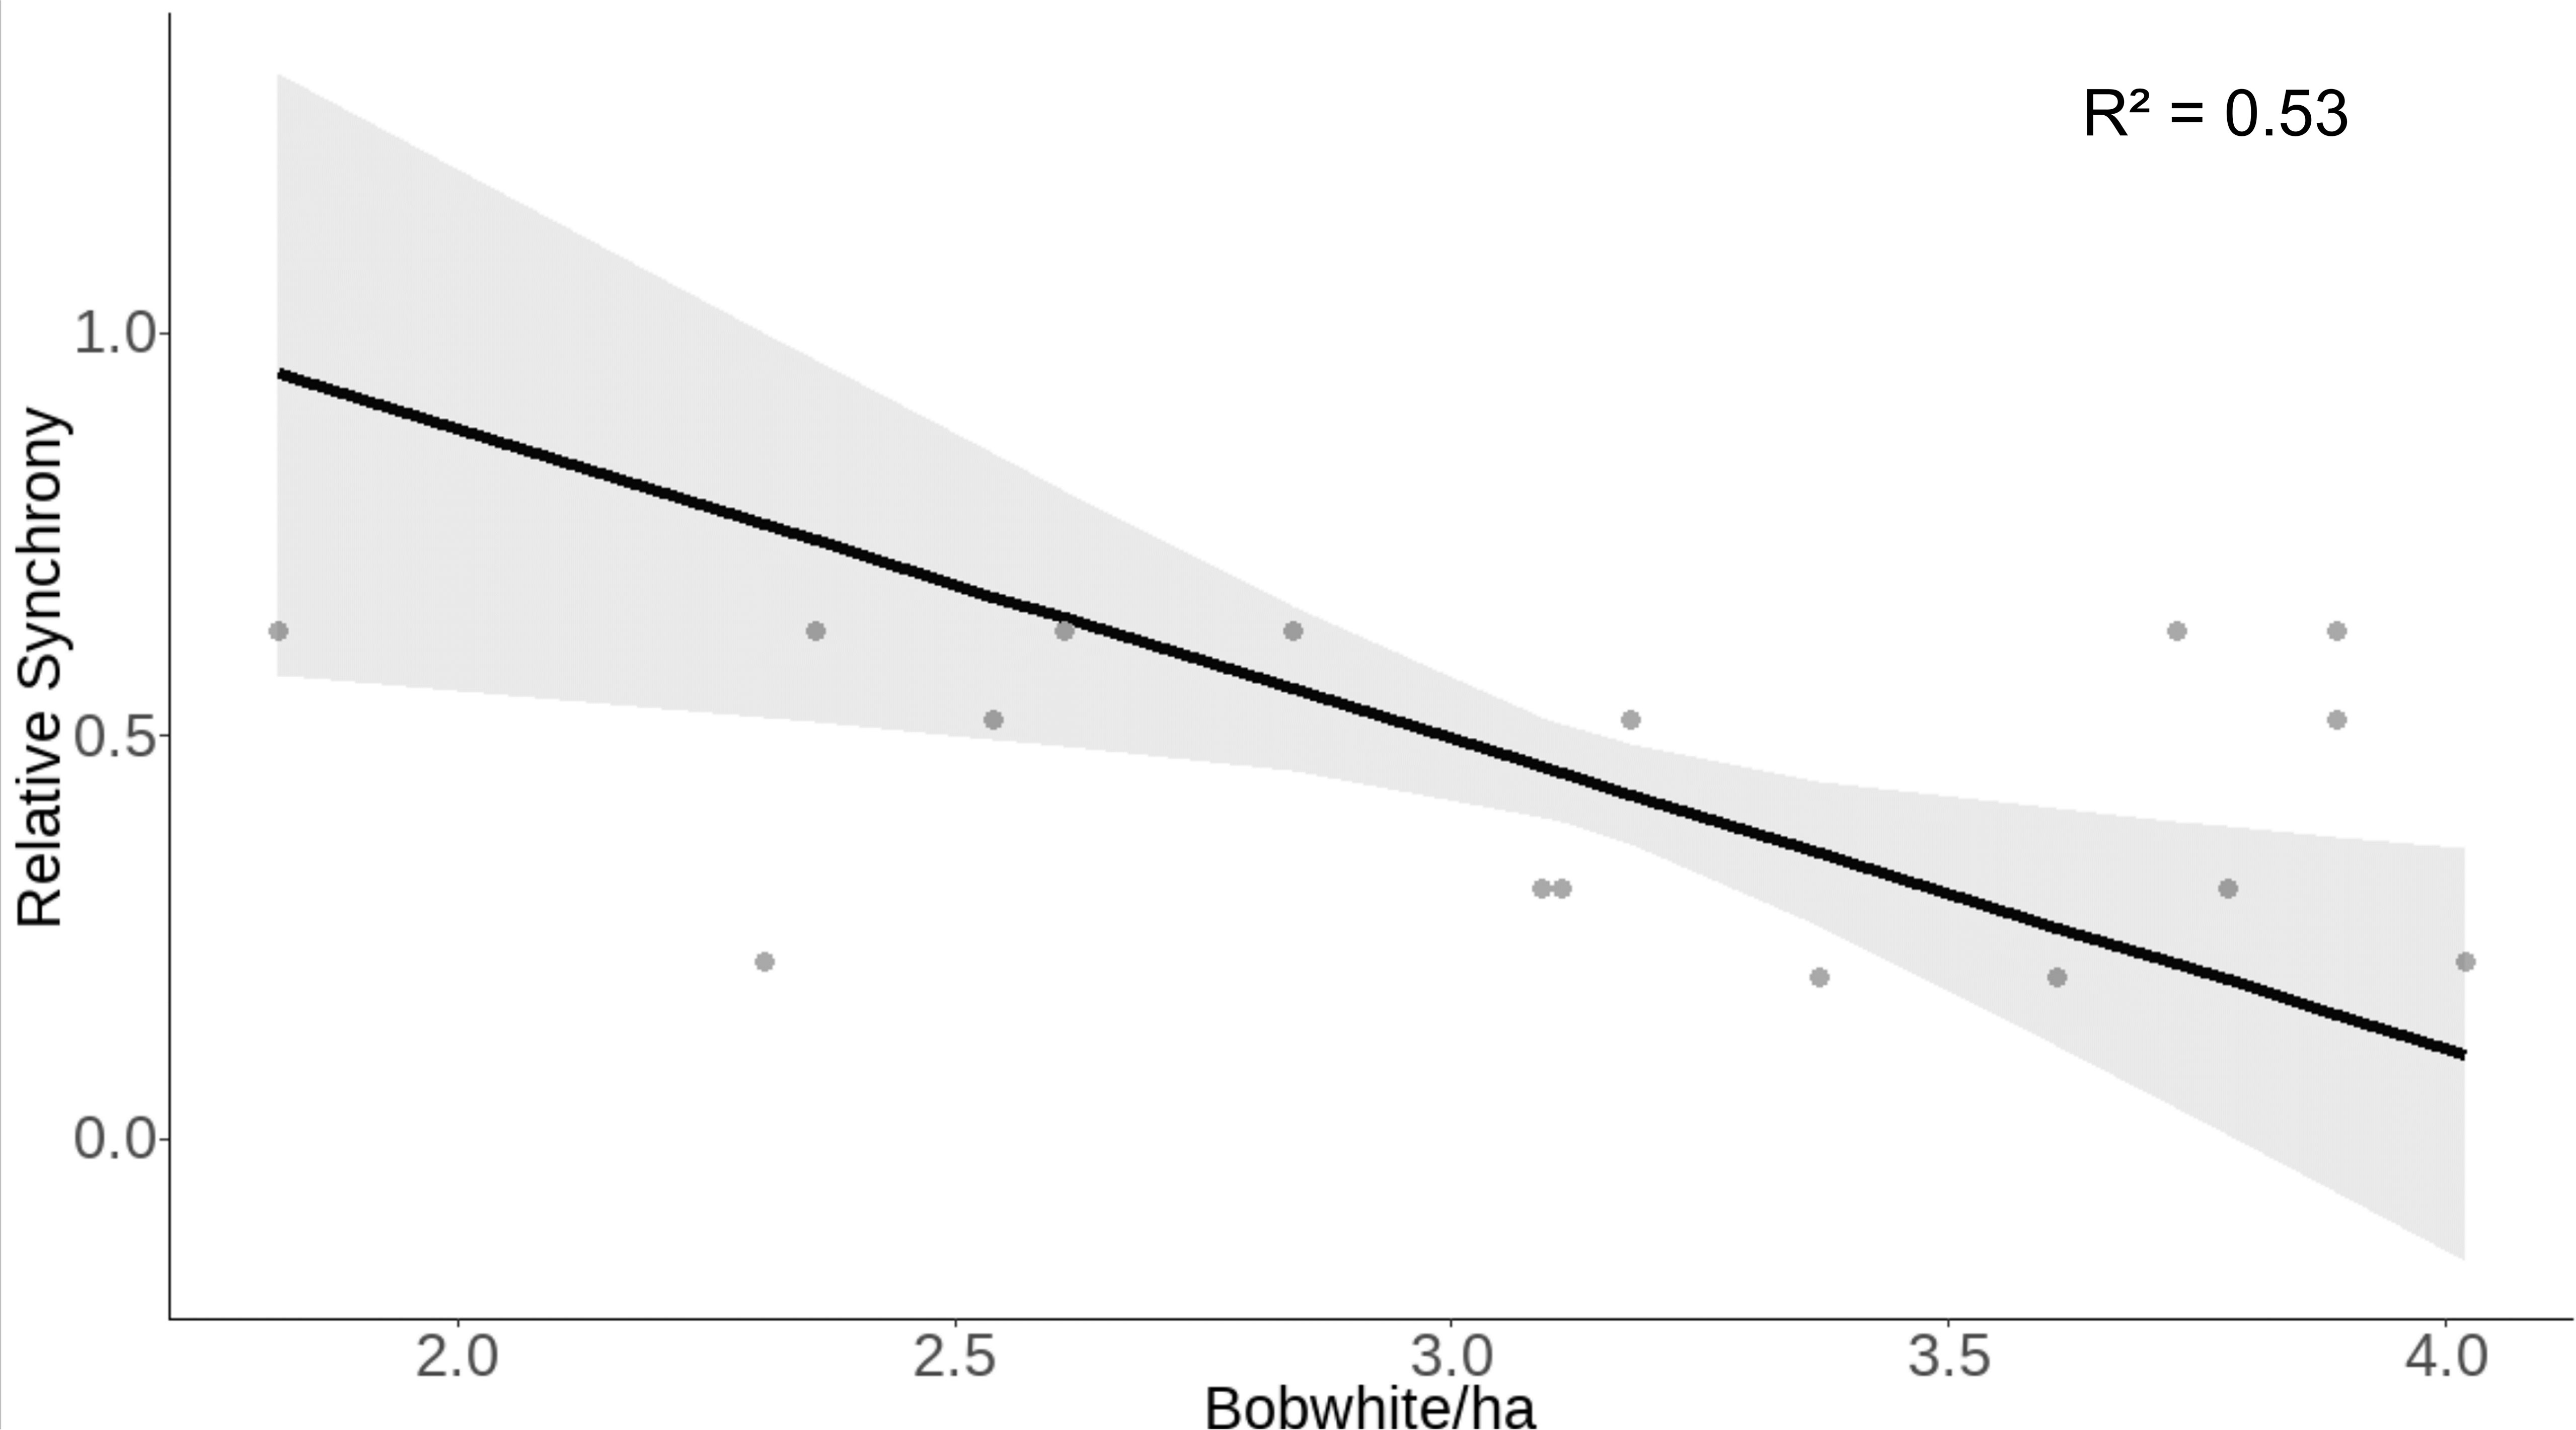
Figure 4 Raw data (gray dots) and model-predicted relative synchrony (black line) ± 95% confidence intervals (gray band) as bobwhite density increases at the Jones Center at Ichauway, a private property in Baker Co., GA, and Tall Timbers Research Station from 2002 to 2017.
Trophic interactions and synchrony
We found evidence that both bobwhite and cotton rats were positively associated with the density of the other species. We modeled bobwhite density with the significant environmental factors from Model 1 (spring precipitation and autumn temperature), relative synchrony, and the interaction of relative synchrony and cotton rat density. Bobwhite density was positively associated with cotton rat density (β = 0.30 ± SE 0.11, z = 2.58, p = 0.01; Table 4) but not the interaction of cotton rat density and synchrony. Our model predicted that as cotton rat density increases from 6 to 39 individuals/ha, bobwhite density will increase from 2.71 ± SE 0.20 to 3.87 ± SE 0.30 bobwhite/ha (Figure 5).
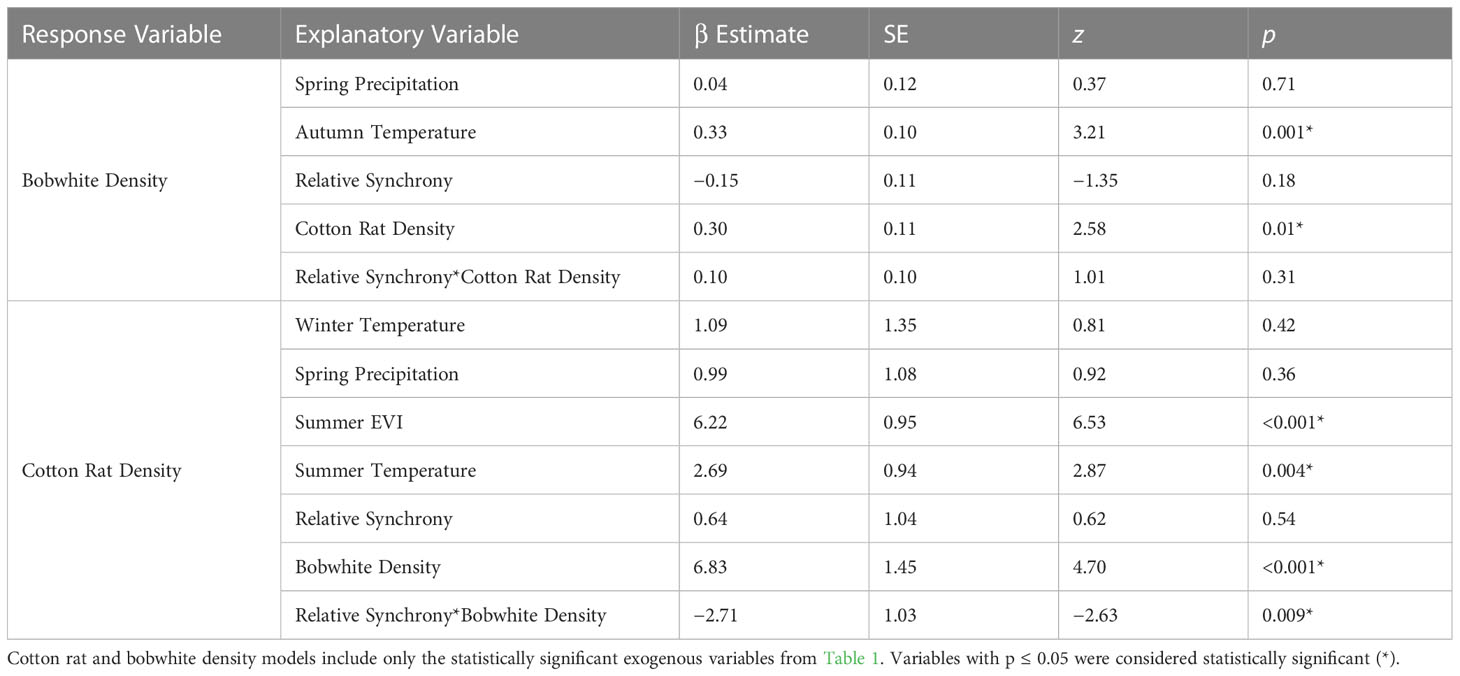
Table 4 Generalized linear mixed model results of the global model of exogenous factors and synchrony at the Jones Center at Ichauway, two sites at a private property in Baker Co., GA, and Tall Timbers Research Station from 2002 to 2017.
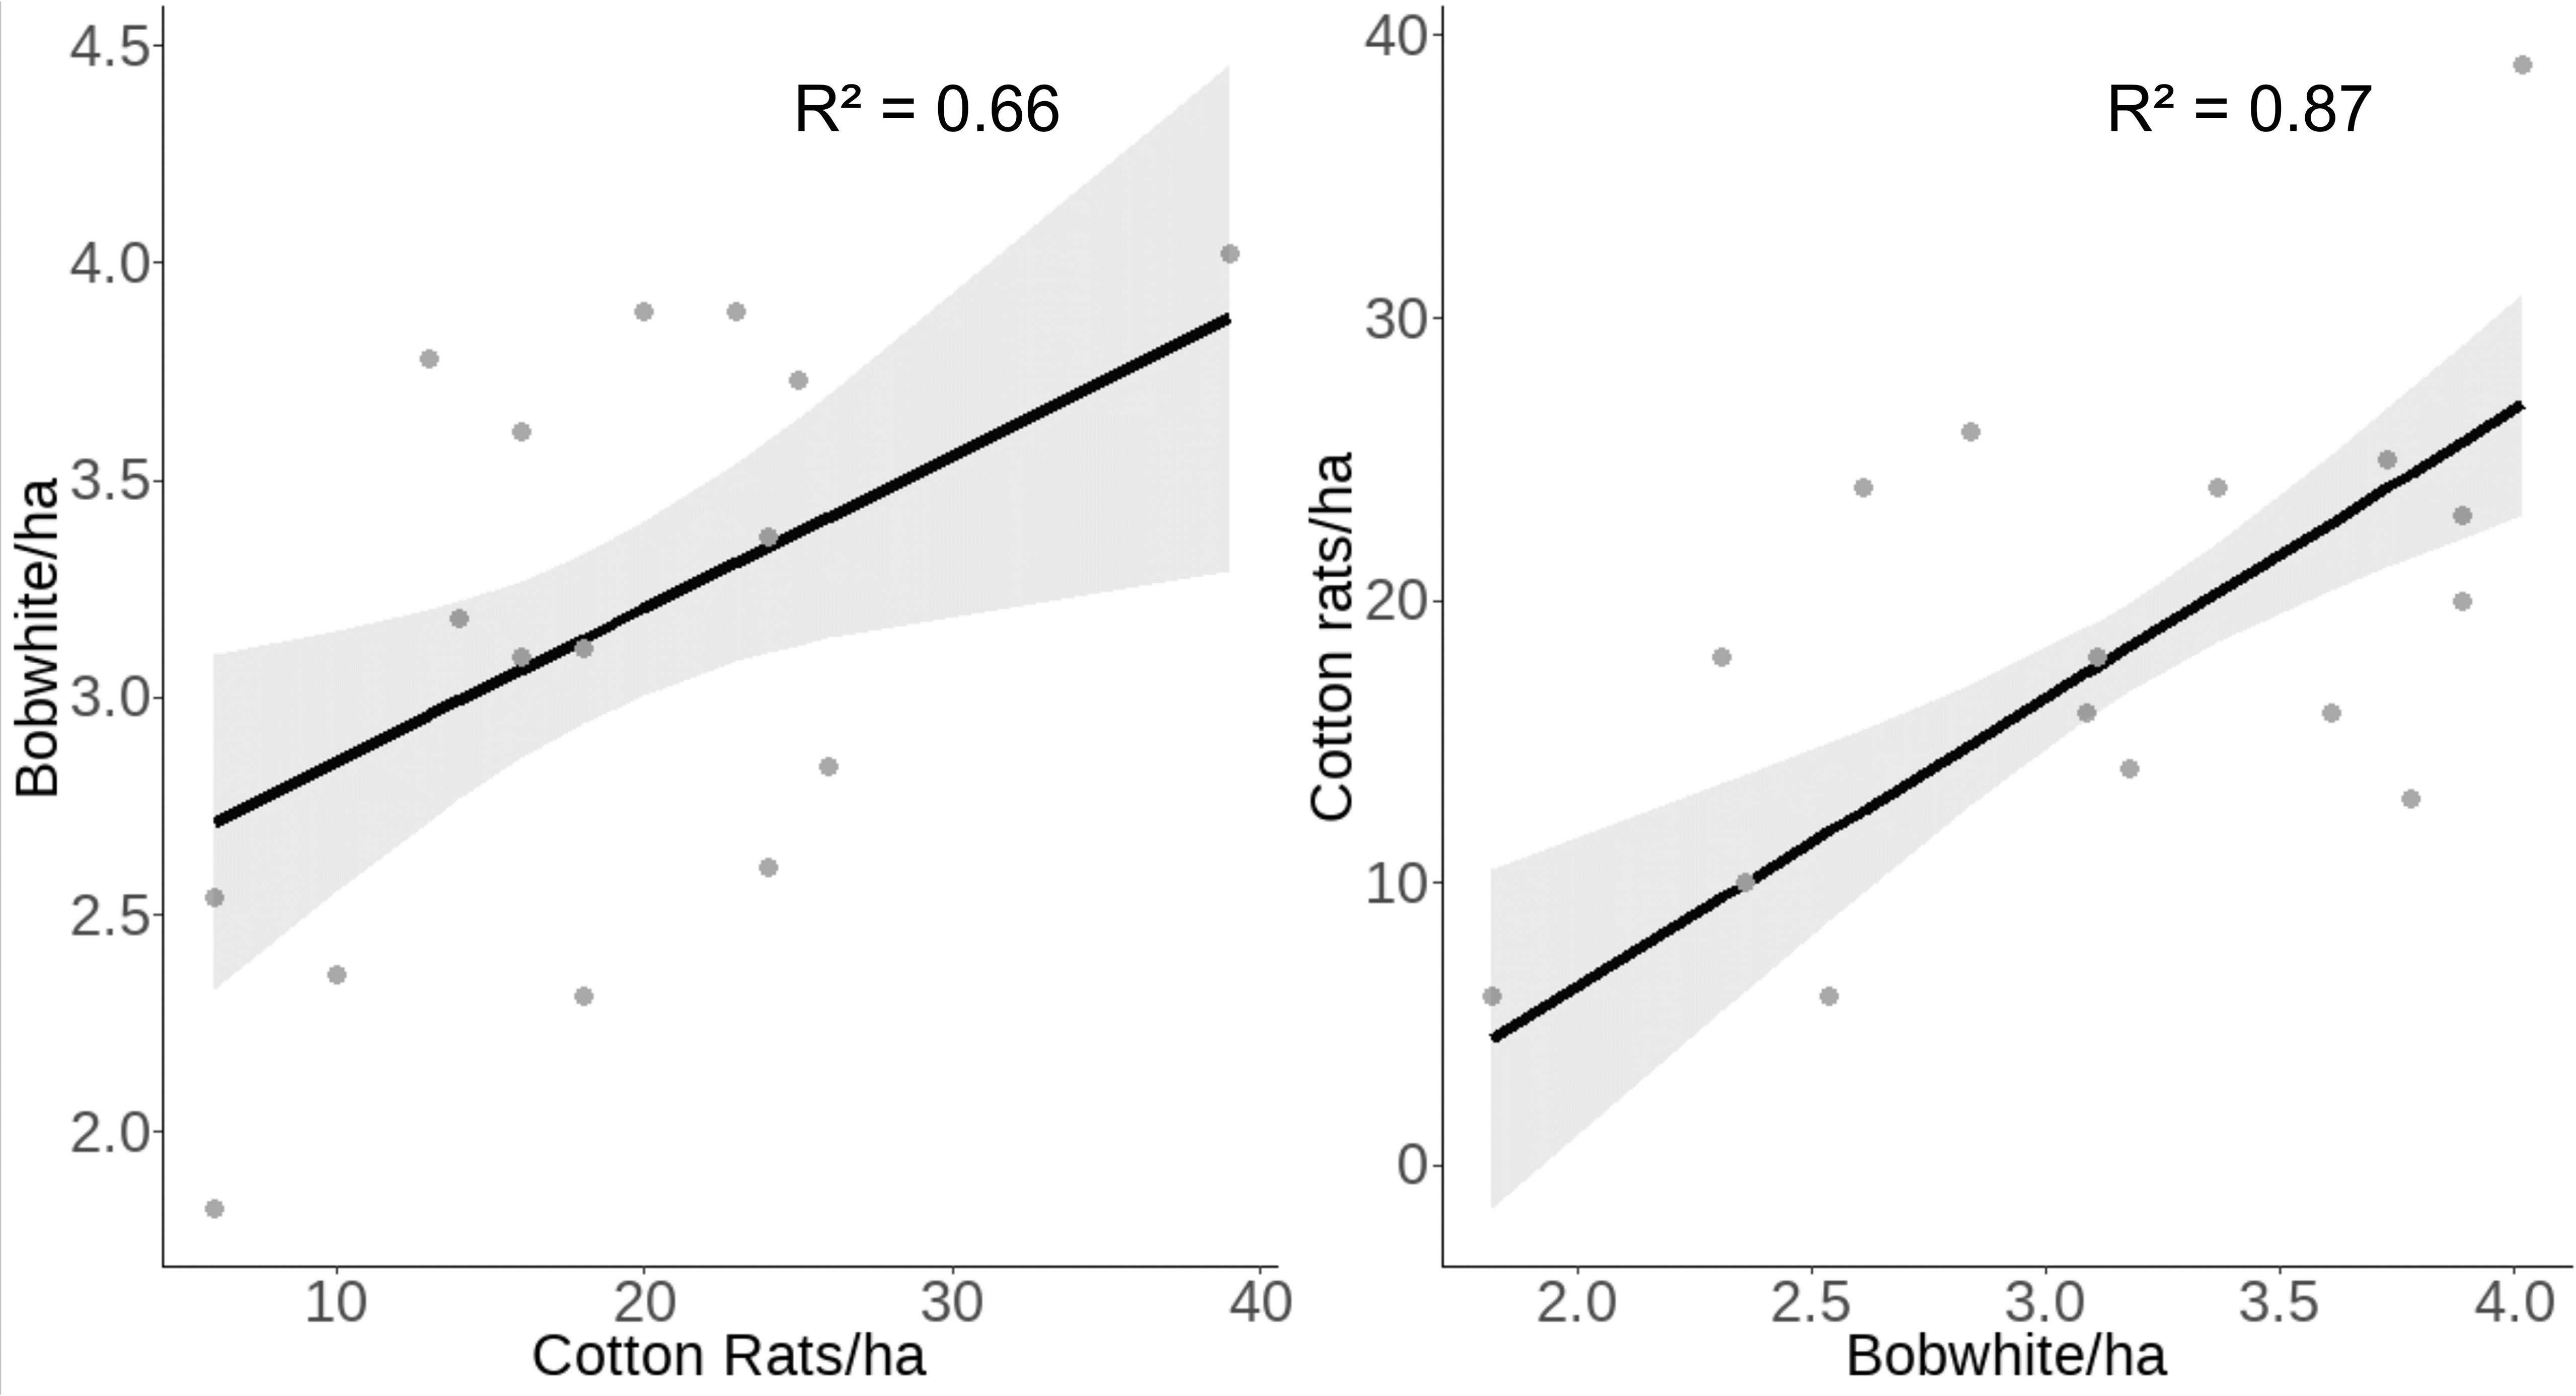
Figure 5 Raw data (gray dots) and model-predicted cotton rat and bobwhite density (black line) ± 95% confidence intervals (gray band) as the other species’ density increases at the Jones Center at Ichauway, a private property in Baker Co., GA, and Tall Timbers Research Station from 2002 to 2017.
We modeled cotton rat density from the significant environmental variables from Model 2 (winter and summer temperature, spring precipitation, and summer EVI), relative synchrony, bobwhite density, and the interaction of relative synchrony and bobwhite density. Cotton rat density was positively associated with bobwhite density (β = 6.83 ± SE 1.45, z = 4.70, p < 0.001) and negatively associated with the interaction of relative synchrony and bobwhite density (β = −2.71 ± SE 1.03, z = −2.63, p = 0.009; Table 4). Our model of cotton rat density predicted that as bobwhite density increases from 1.82 to 4.02 bobwhite/ha, cotton rat density will increase from 4.45 ± SE 3.07 to 26.93 ± SE 1.99 cotton rats/ha (Figure 5). Our model indicated that as synchrony between species increases, the association between bobwhite density on cotton rat density decreases. At low levels of concordance (W = 0.20), our model predicted a positive association between bobwhite density and cotton rat density, predicting that as bobwhite density increases from 1.82 to 4.02 bobwhite/ha, cotton rat density would increase from 0.0 ± SE 5.58 to 30.88 ± SE 2.79 cotton rats/ha. Similarly, at fair levels of synchrony (W = 0.31), as bobwhite density increases from 1.82 to 4.02 individuals/ha, cotton rat density is predicted to increase from 0.06 ± SE 4.35 to 29.10 ± SE 2.19 cotton rats/ha. At the highest levels of synchrony observed between species (W = 0.63), as bobwhite density increases from 1.82 to 4.02 individuals/ha, cotton rat density is predicted to increase from 10.51 ± SE 2.49 to 23.93 ± SE 2.77 cotton rats/ha (Figure 6).
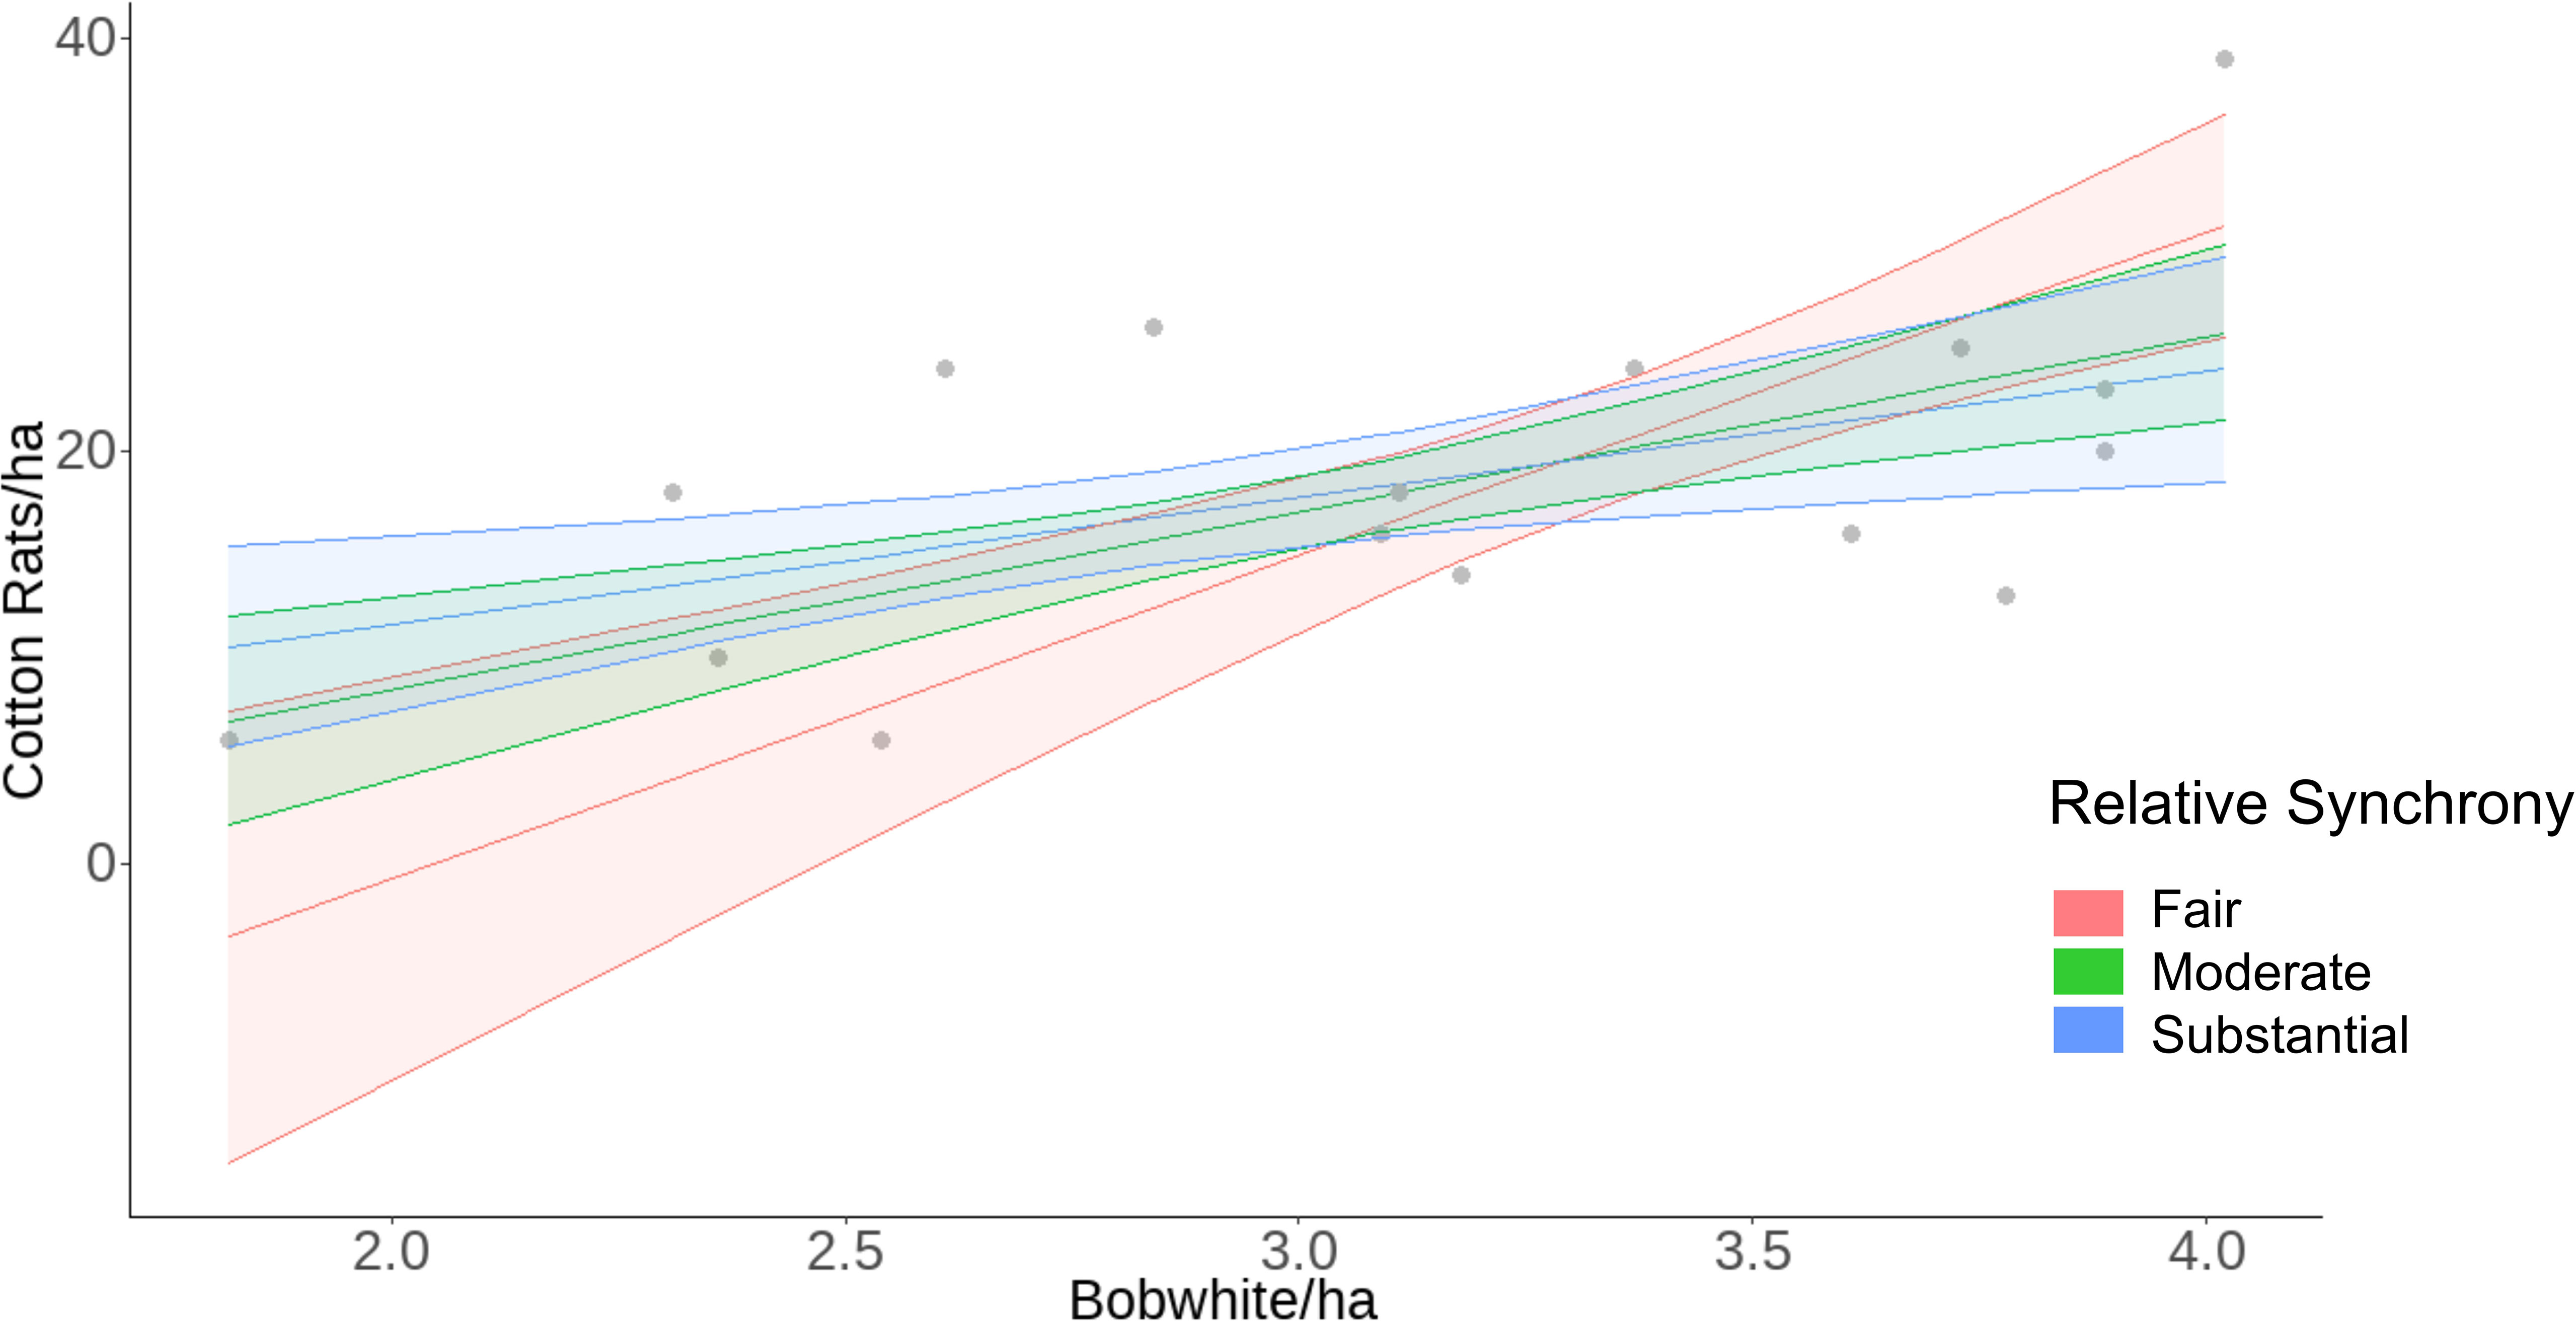
Figure 6 Raw data (gray dots) and model predicted relationship of the interaction of bobwhite density and relative synchrony on cotton rat density at the Jones Center at Ichauway, a private property in Baker Co., GA, and Tall Timbers Research Station from 2002 to 2017.
Discussion
In our examination of a complex predator–prey system, we found evidence of regional and site-specific synchrony between two taxonomically divergent primary consumers demonstrated by both substantial levels of concordance and high proportions of concurrent maxima and minima. Unlike many synchronous populations, we found negligible evidence that variation in the relative amounts of synchrony were tied to exogenous factors (Post and Forchhammer, 2002; Stien et al., 2012). We did find that trophic interactions between cotton rats and bobwhite were associated with relative synchrony between these populations, but these interactions appeared to weaken in years of greater synchrony (Lee et al., 2020). If populations were synchronized by mechanisms like predation and competition, we would have expected a positive association between synchrony and trophic interactions (Ims and Steen, 1990; De Roos et al., 1991). Accordingly, our research suggests that the patterns of fluctuation among taxonomically divergent primary consumers in our system cannot be easily explained by our current suite of theoretical constructs that focus solely on exogenous factors (Moran, 1953) or trophic predator–prey interactions (Hagen, 1952; Lack, 1954; Angelstam et al., 1984) and may be influenced by the interaction of these factors (Coulson et al., 2004; Stenseth et al., 2004).
The pattern of synchrony between bobwhite and cotton rats varied considerably across years, fluctuating from no relationship to moderate synchrony. Declines in relative synchrony were associated with increasing bobwhite density. When regional synchrony between the populations was highest (2003, 2005, 2006, 2007), environmental conditions were characterized by above average greenness across multiple seasons and summer precipitation. During those same years, bobwhite density which are known to be sensitive to temperature and precipitation (Table 1; Lusk et al., 2001), was low; and cotton rat density, sensitive to seasonal greenness, precipitation, and temperature (Table 1; Reed and Slade, 2006), was variable. Alternatively, during years of reduced synchrony (2002, 2004, 2010), environmental conditions were characterized by above average spring precipitation and below average winter and summer precipitation as well as reduced cotton rat densities and average bobwhite densities. These patterns suggest that differences in synchrony can potentially be partially explained by the subtly different ways climatic conditions influence the population densities of these taxonomically divergent species. Yet they do not conform well with Moran (1953), commonly used to explain patterns between populations, suggests synchrony occurs during extreme weather events that reduce population densities. Following this concept, we would have expected increases in synchrony when bobwhite and cotton rat densities were both at their lowest. Based on maxima and minima across sites, bobwhite and cotton rat populations fluctuated concurrently in more than 50% of the study years (SI 7); however, these fluctuations were not clearly linked to exogenous factors as indicators of population change. Across sites, cotton rats appear to deviate from synchronous fluctuations more frequently than bobwhite (SI 7), possibly due to their reproductive plasticity relative to bobwhite’s defined breeding season. Cotton rats’ natural history facilitates opportunistic breeding when environmental conditions are favorable (Linzey, 1998), while bobwhite are restricted to a defined breeding season (Stoddard, 1931). Accordingly, although exogenous factors appeared to influence the population dynamics of each species individually and the proportions of concurrent maxima and minima were substantial across sites, there was not a strong relationship between synchrony and exogenous factors. However, it is important to note that we did not observe the extreme weather events that commonly support Moran (1953).
While both populations were positively associated with one another, only cotton rats were influenced by the interaction of relative synchrony and bobwhite density (Table 4). Numerous observational studies have suggested that cotton rats positively influence bobwhite density through generalist predators switching their prey selection (Staller et al., 2005; Ellis-Felege et al., 2017; Palmer et al., 2019). Predation by birds of prey and mammals is the leading cause of bobwhite mortality at all life stages (Burger et al., 1995; Rollins and Carroll, 2001; Cox et al., 2004). Similarly, avian and mammalian predators account for the majority of mortalities of adult cotton rats (Morris et al., 2011; McCampbell et al., 2023). Moreover, seasonal predation pressure has been shown to considerably alter both cotton rat (Wiegert, 1972) and bobwhite populations (Carroll et al., 2007). We found that as synchrony between bobwhite and cotton rats increases, the positive association of bobwhite density on cotton rat density declines, possibly due to prey switching by predators when both species populations are at relatively high densities. This differs from the trophic interactions commonly attributed to synchrony in taxonomically divergent primary consumer species. The alternative prey hypothesis (APH) suggests that predators are selective and synchronize prey population densities by depredating their primary prey (i.e., numerically dominant) until its population declines before switching to an alternative prey and instigating its decline (Hagen, 1952; Lack, 1954; Angelstam et al., 1984). We have no evidence that the generalist predators in our system are selective (Godbois et al., 2003; Cherry et al., 2016; Rectenwald et al., 2021), and if the APH was occurring, we would expect an inverse relationship between prey densities. As cotton rat densities are reduced by predation, bobwhite density would increase to synchronize with cotton rat densities (Angelstam et al., 1984). However, we observed periods of elevated synchrony after years of both increasing and decreasing cotton rats.
Another explanation of trophic interactions is the shared predator hypothesis which posits that predators can synchronize prey species populations through indiscriminate predation of primary and alternate prey to cause simultaneous increases and declines (Norrdahl and Korpimäki, 2000). Synchrony seemed to occur after years of both increasing and decreasing cotton rats; however, these associations were inconsistent. Under the shared predator hypothesis, we would also expect that alternative prey (e.g., bobwhite) and primary prey (e.g., cotton rat) would consistently decline after spikes in the population of the numerically dominant prey, which should facilitate increased predator activity and encounter rates (Bety et al., 2002; Ježková et al., 2014); however, we did not see evidence of this pattern either (Ydenberg, 1987; Ims and Steen, 1990).
Without a clear mechanistic explanation of the patterns in our data, we propose an alternative climate- mediated predation framework for understanding the linkages of prey in complex predator–prey systems with numerous non-selective predators. First, in keeping with classic bottom-up theories of regulation (White, 1978; Hunter and Price, 1992), exogenous conditions influence the populations of each prey species via availability of resources (Meserve et al., 2001; Meserve et al., 2009). Next, population fluctuations of the numerically dominant prey changes predator communities. Finally, changes in the predator community alter the predation risk and populations of species with the same predators in a manner consistent with the shared predator hypothesis. While this hypothesis needs to be tested, there is substantial support for its components, 1) fluctuations of numerically dominant prey are closely linked to climate-induced changes in resources (Lima et al., 1999; Ernest et al., 2000), 2) fluctuations of numerically dominate prey are tied to changes in populations and communities of their predators (Post and Forchhammer, 2002; Beaugrand et al., 2009; Turkia et al., 2020), and 3) changes in predator communities alter the population demographics of species with the same predators (Rooney et al., 2006; Stoessel et al., 2019; Quéroué et al., 2021). This framework (Figure 7) is more consistent with many patterns of our data than existing constructs.
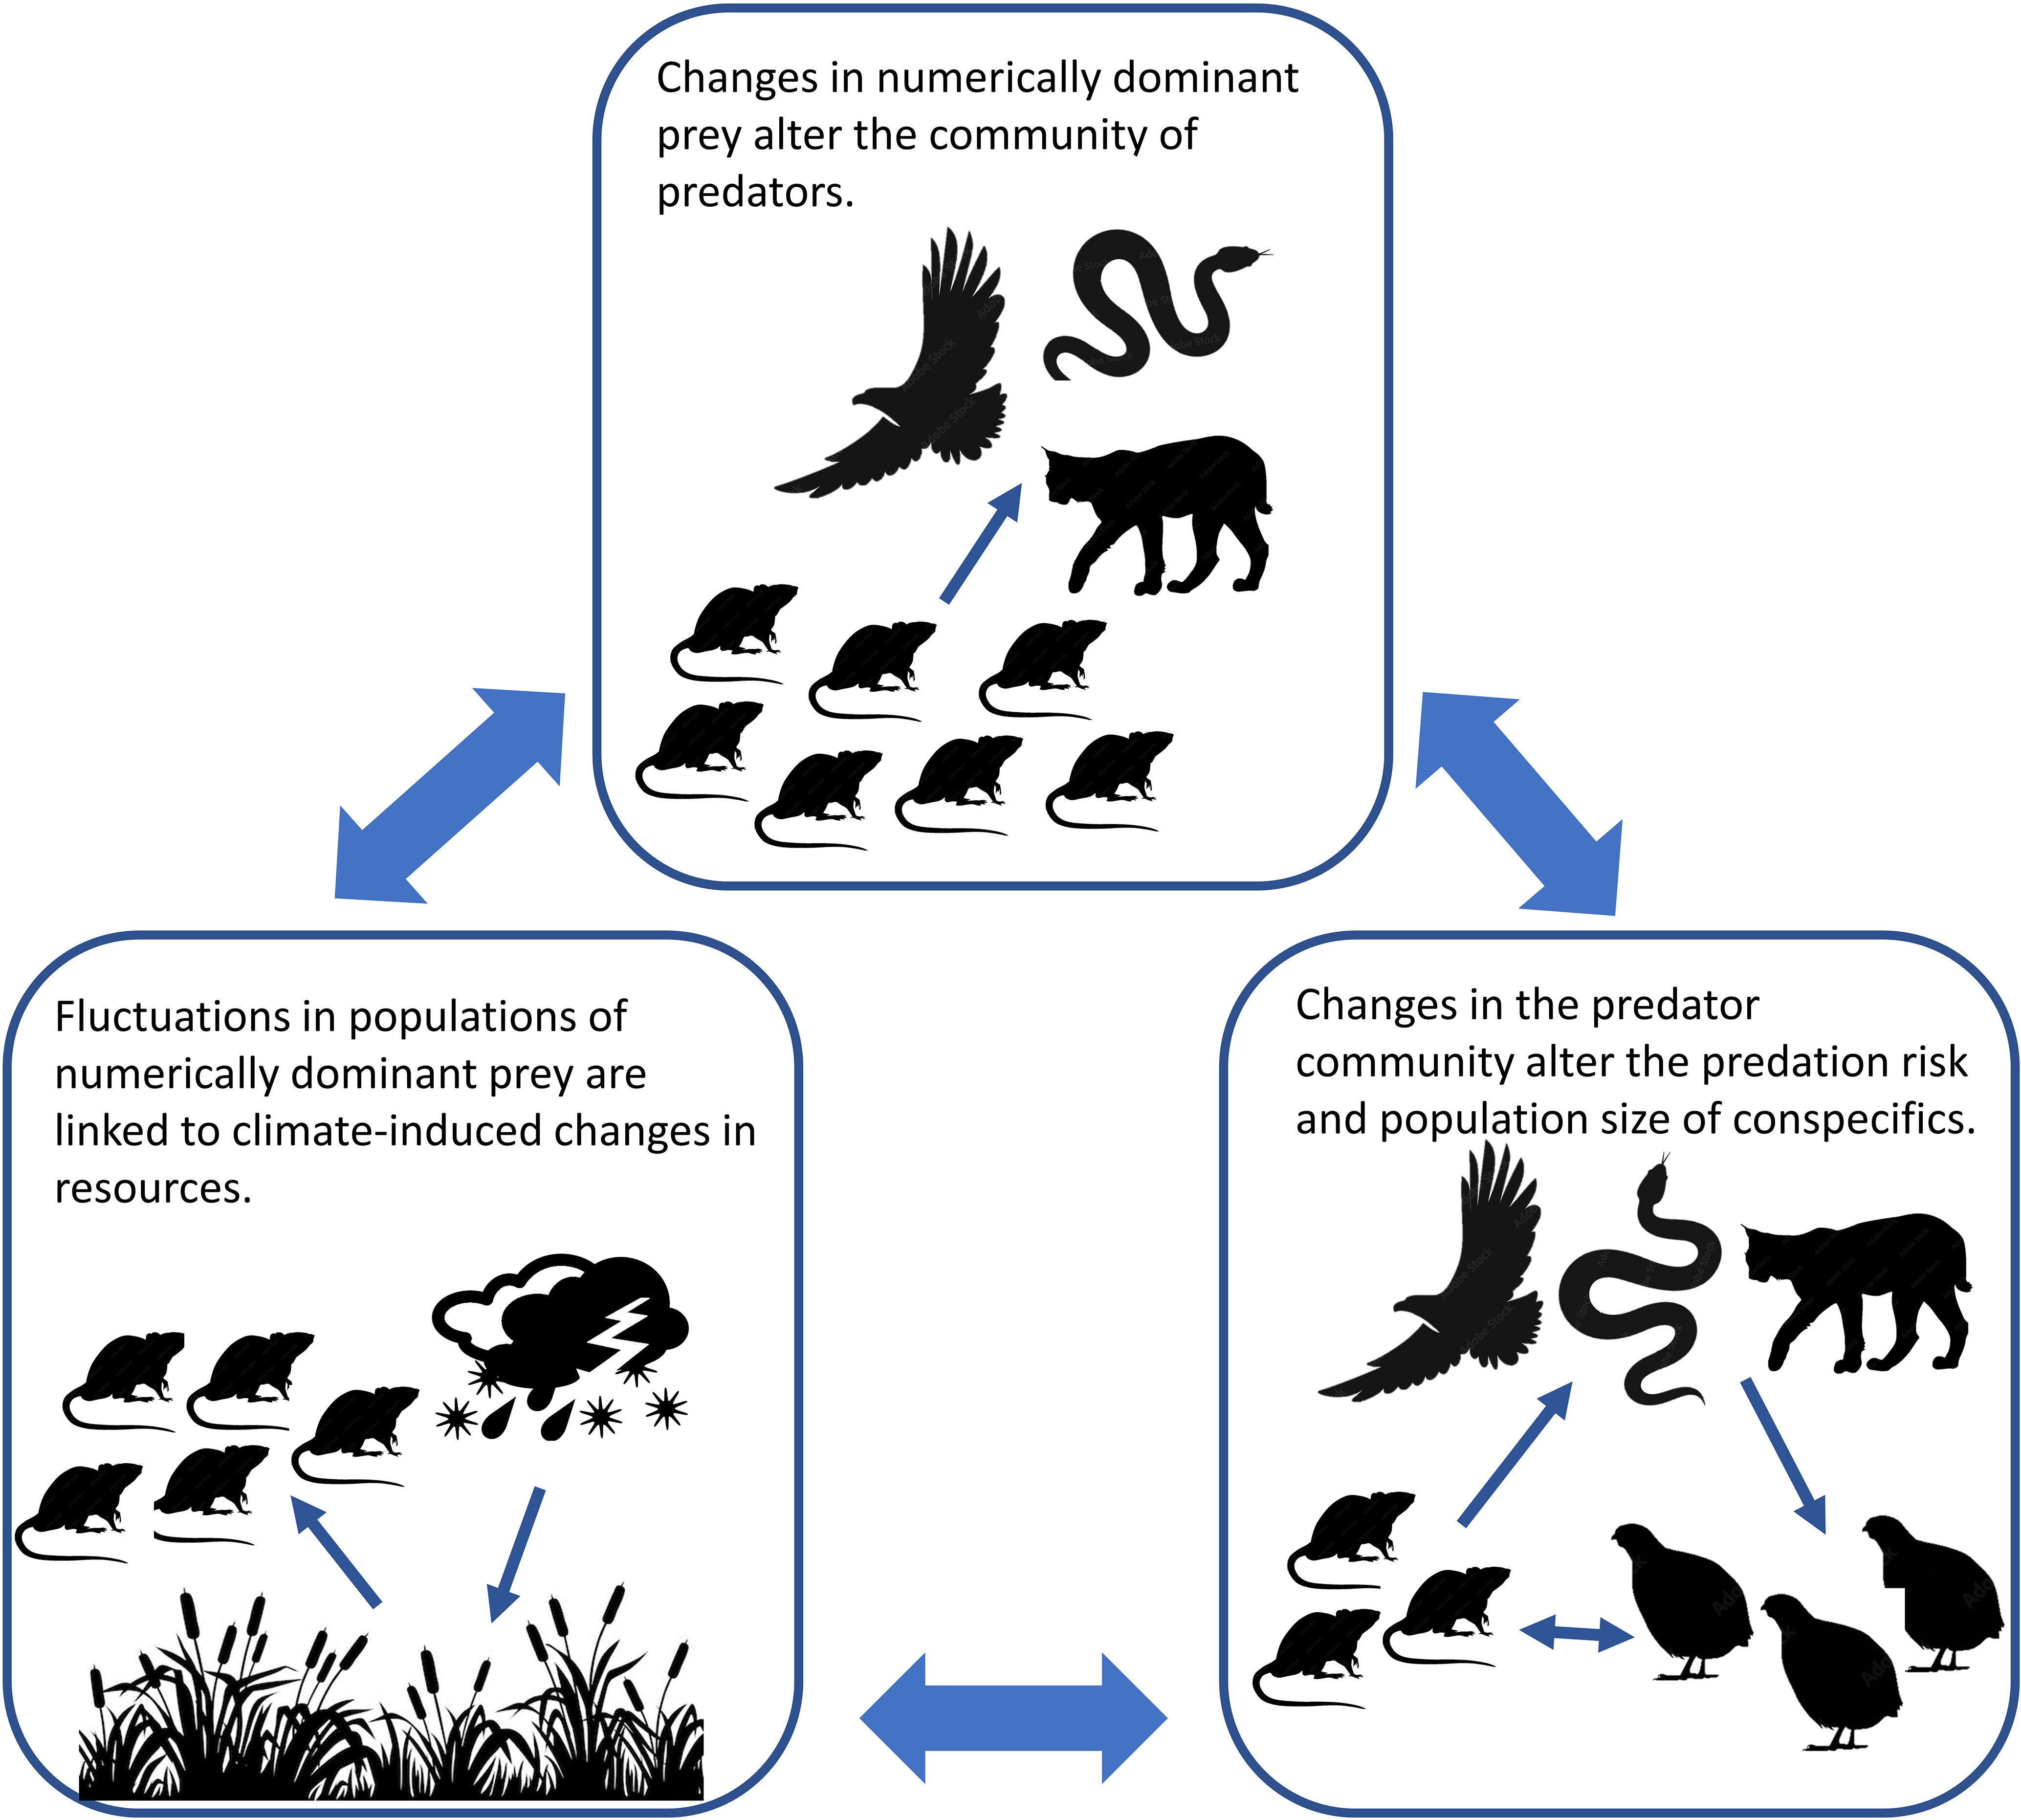
Figure 7 Climate-mediated predation framework proposed to explain the simultaneous interactions of the environment, predators, and prey species in ecosystems with numerous non-selective predators.
Although we used data from three sites across 15 years, our study had several limitations which should be noted. Most importantly, because of the coarse spatial and temporal resolution (i.e., annual) of our population and remote sensing data, the patterns in our data might change at more biologically relevant temporal and spatial scales that more closely track species’ interactions. Another important caveat was that cotton rat and bobwhite population data were collected in different areas of each study site, which may have inadvertently influenced our findings as the species were not experiencing the same microclimatic conditions. Moreover, while annual population density data were collected at times of peak density, our sampling occurred at slightly different seasons for each species, potentially limiting our ability to detected linkages between them. Both species have an average lifespan of approximately 6 months (Brennan, 1999; Curlee and Cooper, 2012; McCampbell et al., 2023), suggesting limited annual carryover of population densities; however, we did not investigate this assumption with the inclusion of time lags. Additionally, without data on predator density we were unable to fully investigate the drivers of bobwhite and cotton rat population fluctuations. Although cotton rats are the most commonly trapped small mammal at these sites, they are not the only small mammals in these systems. Fluctuations in other small mammal populations, most notably Peromyscus gossypinus (cotton mouse) and Mus musculus (house mouse) may have influenced our results and therefore these populations should be acknowledged and accounted for in future studies. Another concern was the variation in population data collection, especially bobwhite density, across sites. While two sites used the same methodology, the assumptions made regarding covey size at the Jones Center may have skewed the data and influenced the results. Lastly, our lack of strong effects may have been influenced by the removal or mesomammalian predators and supplemental feeding that occurred across all sites and throughout the study. Although we have identified factors associated with synchrony within our dataset, further investigation should aim to collect population and predator data on finer spatial and temporal scales to capture the within-year variation in population fluctuations.
While a climate-mediated predation framework may provide a better explanation of the fluctuation patterns in populations of taxonomically divergent primary consumers in complex food webs, there is considerable work that needs to be done before attributing mechanisms to these patterns. Specifically, we suggest two important steps to determine the applicability of this construct. First, there is a need to link survival, cause-specific mortality, predator populations, and specific resources (i.e., vegetation characteristics, food availability) to the annual fluctuations of primary and alternative prey species. To do this, contrary to the coarse resolution of this study, research will need to investigate these populations on finer spatiotemporal scales that allow for the inference of mechanism. Second, we advocate for manipulations of resources for the numerically dominant prey to determine if they lead to population increases, alter predator communities, and change the predation rate of other prey populations in the system. We present this paper as a foundation to generate a greater understanding of the integral drivers of synchrony within complex systems.
Data availability statement
The raw data supporting the conclusions of this article will be made available by the authors, without undue reservation.
Ethics statement
The animal study was reviewed and approved by Tall Timbers Research Station and Land Conservancy: IACUC permit GB-2001-01-15; the Jones Center at Ichauway: Georgia Department of Natural Resources Scientific collecting permit 1000528068; the private property in Baker County, Georgia: Georgia Department of Natural Resources Scientific collecting permit 1000650622.
Author contributions
KRH: data analysis, study design, manuscript writing. LC: study design, data collection, manuscript editing. SJ: study design, data collection. GM: data collection, manuscript editing. WP: study design, data collection, manuscript editing. BR: study design, data collection. DS: study design, data collection, manuscript editing. TT: data analysis, study design, manuscript editing. SW: study design, data collection, manuscript editing. RM: study design, data analysis, manuscript writing. All authors contributed to the article and approved the submitted version.
Funding
Funding provided by Tall Timbers Research Station and Land Conservancy.
Acknowledgments
The authors thank the numerous interns, staff, and administrative personnel of Tall Timbers Research Station and Land Conservancy, the Jones Center at Ichauway, and the private property in Baker County, Georgia for their assistance in data collection, logistics, and support. Additionally, we would like to thank Drs. Dale Rollins and Brad Kubečka, as well as Rebekah Ruzicka for feedback and review of previous versions of this manuscript.
Conflict of interest
The authors declare that the research was conducted in the absence of any commercial or financial relationships that could be construed as a potential conflict of interest.
Publisher’s note
All claims expressed in this article are solely those of the authors and do not necessarily represent those of their affiliated organizations, or those of the publisher, the editors and the reviewers. Any product that may be evaluated in this article, or claim that may be made by its manufacturer, is not guaranteed or endorsed by the publisher.
Supplementary material
The Supplementary Material for this article can be found online at: https://www.frontiersin.org/articles/10.3389/fevo.2023.1159464/full#supplementary-material
References
Akaike H. (1973). Information theory as an extension of the maximum likelihood principle–in: second international symposium on information theory. Eds. Petrov B. N., Csaki F. (BNPBF Csaki Budapest: Academiai Kiado).
Allstadt A. J., Liebhold A. M., Johnson D. M., Davis R. E., Haynes K. J. (2015). Temporal variation in the synchrony of weather and its consequences for spatiotemporal population dynamics. Ecology 96, 2935–2946. doi: 10.1890/14-1497.1
Andrewartha H. G., Birch L. C. (1954). The distribution and abundance of animals (Chicago, IL: University of Chicago Press).
Angelstam P., Lindström E., Widén P. (1984). Role of predation in short-term population fluctuations of some birds and mammals in fennoscandia. Oecologia 62, 199–208. doi: 10.1007/BF00379014
Barrett G. W., Peles J. D., Bowne D. R. (2001). Predation on the hispid cotton rat (Sigmodon hispidus) by snakes and owls. Georgia J. Sci. 59, 94–100.
Beaugrand G., Luczak C., Edwards M. (2009). Rapid biogeographical plankton shifts in the north Atlantic ocean. Global Change Biol. 15, 1790–1803. doi: 10.1111/j.1365-2486.2009.01848.x
Bellamy P. E., Rothery P., Hinsley S. A. (2003). Synchrony of woodland bird populations: the effect of landscape structure. Ecography 26, 338–348. doi: 10.1034/j.1600-0587.2003.03457.x
Bety J., Gauthier G., Korpimaki E., Giroux J. F. (2002). Shared predators and indirect trophic interactions: lemming cycles and arctic-nesting geese. J. Anim. Ecol., 88–98. doi: 10.1046/j.0021-8790.2001.00581.x
Bjørnstad O. N., Ims R. A., Lambin X. (1999). Spatial population dynamics: analyzing patterns and processes of population synchrony. Trends Ecol. Evol. 14, 427–432. doi: 10.1016/S0169-5347(99)01677-8
Borgmann-Winter B. W., Oggenfuss K. M., Ostfeld R. S. (2021). Blacklegged tick population synchrony between oak forest and non-oak forest. Ecol. Entomol. 46, 827–833. doi: 10.1111/een.13019
Brennan L. A., Hernández F., Williford D. (2014). Northern bobwhite (Colinus virginianus). version 2.0. the birds of north America. Ed. Poole A. F. (Ithaca, New York: Cornell Lab of Ornithology).
Burger L. W. Jr., Dailey T. V., Kurzejeski E. W., Ryan M. R. (1995). Survival and cause-specific mortality of northern bobwhite in Missouri. J. Wildlife Manage. 59, 401–410. doi: 10.2307/3808954
Burnham K. P., Anderson D. R. (1998). “Practical use of the information-theoretic approach,” in Model selection and inference (New York, NY: Springer), 75–117.
Burnham K. P., Anderson D. R. (2002). Model selection and multimodel inference: a practical information-theoretical approach (New York, NY: Springer-Verlag).
Burnham K. P., Anderson D. R. (2004). Multimodel inference: understanding AIC and BIC in model selection. Sociol Methods Res. 33, 261–304. doi: 10.1177/0049124104268644
Burrows M. T., Moore J. J., James B. (2002). Spatial synchrony of population changes in rocky shore communities in Shetland. Mar. Ecol. Prog. Series 240, 39–48. doi: 10.3354/meps240039
Cameron G. N. (1999). “Sigmodon hispidus,” in North American I mammals. Eds. Wilson D., Ruff. S. (Washington, DC: Smithsonian Institute).
Campbell-Kissock L., Blankenship L. H., Stewart J. (1985). Plant and animal foods of bobwhite and scaled quail in southwest Texas. Southwestern Nat. 30, 543–553. doi: 10.2307/3671048
Carroll J. P., Ellis-Felege S. N., Palmer W. E. (2007). Impacts of predators on northern bobwhites in the southeast. Trans. North Am. Wildlife Natural Resour. Conf. 72, 246–257.
Cavanaugh D. C., Marshall J. D. Jr. (1972). The influence of climate on the seasonal prevalence of plague in the republic of Vietnam. J. Wildlife Dis. 8, 85–94. doi: 10.7589/0090-3558-8.1.85
Chapman R. N. (1928). The quantitative analysis of environmental factors. Ecology 9, 111–122. doi: 10.2307/1929348
Cherry M. J., Turner K. L., Howze M. B., Cohen B. S., Conner L. M., Warren R. J. (2016). Coyote diets in a longleaf pine ecosystem. Wildlife Biol. 22, 64–70. doi: 10.2981/wlb.00144
Cooch E., White G. (2012). A gentle introduction to program mark (Fort Collins: Colorado State University).
Coulson T., Rohani P., Pascual M. (2004). Skeletons, noise and population growth: the end of an old debate? Trends Ecol. Evol. 19, 359–364. doi: 10.1016/j.tree.2004.05.008
Cox S. A., Peoples A. D., DeMaso S. J., Lusk J. J., Guthery F. S. (2004). Survival and cause-specific mortality of northern bobwhites in western Oklahoma. J. Wildlife Manage. 68, 663–671. doi: 10.2193/0022-541X(2004)068[0663:SACMON]2.0.CO;2
Curlee J. F., Cooper D. M. (2012). Cotton rat. the laboratory rabbit, Guinea pig, hamster, and other rodents (London: Academic Press), 1105–1113.
Davenport J. M., Chalcraft D. R. (2012). Evaluating the effects of trophic complexity on a keystone predator by disassembling a partial intraguild predation food web. J. Anim. Ecol. 81, 242–250. doi: 10.1111/j.1365-2656.2011.01906.x
De Roos A. M., McCauley E., Wilson W. G. (1991). Mobility versus density-limited predator-prey dynamics on different spatial scales. proceedings of the royal society of London. Ser. B.: Biol. Sci. 246, 117–122. doi: 10.1098/rspb.1991.0132
DeVos T., Mueller B. S. (1993). “Reproductive ecology of northern bobwhite in north Florida,” in Quail III: national quail symposium. Eds. Church K. E., Dailey T. V. (Kansas Department of Wildlife and Parks, Pratt), 83–90.
Didan K. (2015). MOD13Q1 MODIS/Terra vegetation indices 16-day L3 global 250m SIN grid V006 (NASA EOSDIS Land Processes DAAC), 10. doi: 10.5067/MODIS/MOD13Q1.006
Eifler M. A., Slade N. A. (1999). Effect of weather on individual growth rates in cotton rats, sigmodon hispidus. J. Mammal 80, 1277–1287. doi: 10.2307/1383178
Elton C. S. (1949). Population interspersion: an essay on animal community patterns. J. Ecol. 37, 1–23. doi: 10.2307/2256726
Ellis-Felege S., Albeke S. E., Nibbelink N. P., Conroy M. J., Sisson D. C., Palmer W. E., et al. (2017). Landscape features affecting northern bobwhite predator-specific nest failures in southeastern USA. Natl. Quail Symposium Proc. 8, 89.
Ernest S. M., Brown J. H., Parmenter R. R. (2000). Rodents, plants, and precipitation: spatial and temporal dynamics of consumers and resources. Oikos 88, 470–482. doi: 10.1034/j.1600-0706.2000.880302.x
Errington P. L., Stoddard H. L. (1938). Modifications in predation theory suggested by ecological studies of the bobwhite quail. Transactions of the north American wildlife and natural resources conference 3, 736–740.
Fleharty E. D., Olson L. E. (1969). Summer food habits of microtus ochrogaster and sigmodon hispidus. J. Mammal 50, 475–486. doi: 10.2307/1378774
Fox J., Weisberg S., Price B., Adler D., Bates D., Baud-Bovy G., et al. (2019) Car: companion to applied regression. r package version 3.0-2. Available at: https://CRAN.R-project.org/package=car (Accessed 17 March 2020).
Godbois I. A., Conner L. M., Warren R. J. (2003). “Bobcat diet on an area managed for northern bobwhite,” in Proceedings of the southeastern association of fish and wildlife agencies, 57, 228–234.
Goertz J. W. (1964). The influence of habitat quality upon density of cotton rat populations. Ecol. Monogr. 34, 359–381. doi: 10.2307/2937068
Goertz J. W. (1965). Reproductive variation in cotton rats. Am. Midland Nat. 74, 329–340. doi: 10.2307/2423263
Gouhier T. C., Guichard F. (2014). Synchrony: quantifying variability in space and time. Methods Ecol. Evol. 5, 524–533. doi: 10.1111/2041-210X.12188
Gurney W. S. C., Veitch A. R., Cruickshank I., McGeachin G. (1998). Circles and spirals: population persistence in a spatially explicit predator–prey model. Ecology 79, 2516–2530. doi: 10.1890/0012-9658(1998)079[2516:CASPPI]2.0.CO;2
Hannon C. L. (2006). Hispid cotton rat (Sigmodon hispidus) ecology in north florida. thesis (Athens, GA: University of Georgia).
Hernández F., Hernández F., Arredondo J. A., Bryant F. C., Brennan L. A., Bingham R. L. (2005). Influence of precipitation on demographics of northern bobwhites in southern Texas. Wildlife Soc. Bull. 33, 1071–1079. doi: 10.2193/0091-7648(2005)33[1071:IOPODO]2.0.CO;2
Huete A. R., Didan K., Shimabukuro Y. E., Ratana P., Saleska S. R., Hutyra L. R., et al. (2006). Amazon Rainforests green-up with sunlight in dry season. Geophysical Res. Lett. 33, 1–4. doi: 10.1029/2005GL025583
Huggins R. M. (1989). On the statistical analysis of capture experiments. Biometrika 76, 133–140. doi: 10.1093/biomet/76.1.133
Hunter M. D., Price P. W. (1992). Playing chutes and ladders: heterogeneity and the relative roles of bottom-up and top-down forces in natural communities. Ecology 73, 724–732. doi: 10.2307/1940152
Hurrell J. W. (1995). Decadal trends in the north Atlantic oscillation: regional temperatures and precipitation. Science 269, 676–679. doi: 10.1126/science.269.5224.676
Ims R. A., Steen H. (1990). Geographical synchrony in microtine population cycles: a theoretical evaluation of the role of nomadic avian predators. Oikos 57, 381–387. doi: 10.2307/3565968
Jackson A. (1962). A pattern to population oscillations of the bobwhite quail in the lower plains grazing ranges of northwest Texas. Proc. Southeastern Assoc. Game Fish. Commissioners 16, 120–126.
Janke A. K., Gates R. J., Wiley M. J. (2013). Covey membership and size dynamics in a low-density population of northern bobwhites. Wilson J. Ornithol. 125, 833–840. doi: 10.1676/13-062.1
Ježková M., Svobodová J., Kreisinger J. (2014). Dynamics of rodent abundance and ground-nest predation risks in forest habitats of central Europe: no evidence for the alternative prey hypothesis. Folia Zool. 63, 269–280. doi: 10.25225/fozo.v63.i4.a6.2014
Jones J., Doran P. J., Holmes R. T. (2003). Climate and food synchronize regional forest bird abundances. Ecology 84, 3024–3032. doi: 10.1890/02-0639
Kendall B. E., Bjørnstad O. N., Bascompte J., Keitt T. H., Fagan W. F. (2000). Dispersal, environmental correlation, and spatial synchrony in population dynamics. Am. Nat. 155, 628–636. doi: 10.1086/303350
Koenig W. D. (2001). Synchrony and periodicity of eruptions by boreal birds. Condor 103, 725–735. doi: 10.1093/condor/103.4.725
Koenig W. D., Liebhold A. M. (2016). Temporally increasing spatial synchrony of north American temperature and bird populations. Nat. Climate Change 6, 614–617. doi: 10.1038/nclimate2933
Krebs C. J. (1985). Do changes in spacing behaviour drive population cycles in small mammals? in behavioural ecology. Eds. Sibly R. M., Smith R. H. (Oxford: Blackwell Scientific Publications).
Krebs C. J., Kielland K., Bryant J., O’Donoghue M., Doyle F., McIntyre C., et al. (2013). Synchrony in the snowshoe hare (Lepus americanus) cycle in northwestern north america 1970–2012. Can. J. Zool. 91, 562–572. doi: 10.1139/cjz-2013-0012
Laake J. L. (2013). RMark: an r interface for analysis of capture-recapture data with MARK. Alaska Fish. Sci. Cent., NOAA, Natl. Mar. Fish. Serv. (Seattle, WA).
Lack D. (1954). The natural regulation of animal numbers. the natural regulation of animal numbers (Oxford: Clarendon Press).
Landis J. R., Koch G. G. (1977). The measurement of observer agreement for categorical data. Biometrics 33, 159. doi: 10.2307/2529310
Lee A. M., Sæther B. E., Engen S. (2020). Spatial covariation of competing species in a fluctuating environment. Ecology 101, e02901. doi: 10.1002/ecy.2901
Legendre P. (2005). Species associations: the Kendall coefficient of concordance revisited. J. Agricult. Biol. Environ. Stat 10, 226–245. doi: 10.1198/108571105X46642
Liebhold A., Koenig W. D., Bjørnstad O. N. (2004). Spatial synchrony in population dynamics. Annu. Rev. Ecol. Evolutionary Systems 35, 467–490. doi: 10.1146/annurev.ecolsys.34.011802.132516
Lima M., Marquet P. A., Jaksic F. M. (1999). El Niño events, precipitation patterns, and rodent outbreaks are statistically associated in semiarid Chile. Ecography 22, 213–218. doi: 10.1111/j.1600-0587.1999.tb00470.x
Linzey D. (1998). The mammals of Virgina (Blacksburg, VA: The McDonald and Woodward Publishing Company).
Lusk J. J., Guthery F. S., DeMaso S. J. (2001). Northern bobwhite (Colinus virginianus) abundance in relation to yearly weather and long-term climate patterns. Ecol. Model. 146, 3–15. doi: 10.1016/S0304-3800(01)00292-7
Lynch J., Gholson A., Baker W. (1986). Natural features inventory of ichauway plantation, georgia. volume I (Chapel Hill, NC: The Nature Conservancy Southeast Regional Office).
Brooks M.E., Kristensen K., van Benthem K.J., Magnusson A., Berg C.W., Nielsen A., et al. (2017). glmmTMB Balances Speed and Flexibility Among Packages for Zero-inflated Generalized Linear Mixed Modeling. The R Journal 9 (2), 378. doi: 10.32614/RJ-2017-066
McCampbell M. E., Hunter M. E., Stechly J. V., Leist K. N., Hart K., McCleery R. A. (2023). Compensatory mortality explains rodent resilience to an invasive predator. J. Mammal, gyad043. doi: 10.1093/jmammal/gyad043
Meserve P. L., Gutiérrez J. R., Kelt D. A., Previtali M. A., Milstead W. B. (2009). Global climate change and biotic-abiotic interactions in the northern Chilean semiarid zone: potential long-term consequences of increased El ninos. ocean circulation and El nino (New York: Nova Science Publishers), 139–162.
Meserve P. L., Milstead W. B., Gutiérrez J. R. (2001). Results of a food addition experiment in a north-central Chile small mammal assemblage: evidence for the role of “bottom-up” factors. Oikos 94, 548–556. doi: 10.1034/j.1600-0706.2001.940316.x
Michel N. L., Smith A. C., Clark R. G., Morrissey C. A., Hobson K. A. (2016). Differences in spatial synchrony and interspecific concordance inform guild-level population trends for aerial insectivorous birds. Ecography 39, 774–786. doi: 10.1111/ecog.01798
Miller W. E., Epstein M. E. (1986). Synchronous population fluctuations among moth species (Lepidoptera). Environ. Entomol. 15, 443–447. doi: 10.1093/ee/15.3.443
Moran P. A. (1953). The statistical analysis of the Canadian lynx cycle. Aust. J. Zool. 1, 291–298. doi: 10.1071/ZO9530291
Morris G., Hostetler J. A., Conner L. M., Oli M. K. (2011). Effects of prescribed fire, supplemental feeding, and mammalian predator exclusion on hispid cotton rat populations. Oecologia 167, 1005–1016. doi: 10.1007/s00442-011-2053-6
Myers R. A., Mertz G., Bridson J. (1997). Spatial scales of interannual recruitment variations of marine, anadromous, and freshwater fish. Can. J. Fish. Aquat. Sci. 54, 1400–1407. doi: 10.1139/f97-045
NCEI (2020). Global monthly summaries of temperature and precipitation (15 January 2020). https://ncei.noaa.gov/access
Nordberg E. J., Schwarzkopf L. (2019). Predation risk is a function of alternative prey availability rather than predator abundance in a tropical savanna woodland ecosystem. Sci. Rep. 9, 1–11. doi: 10.1038/s41598-019-44159-6
Norrdahl K., Korpimäki E. (2000). Do predators limit the abundance of alternative prey? experiments with vole-eating avian and mammalian predators. Oikos 91, 528–540. doi: 10.1034/j.1600-0706.2000.910315.x
Oksanen J., Blanchet F. G., Kindt R., Legendre P., Minchin P. R., O’hara R. B., et al. (2022). vegan: Community Ecology Package_. R package version 2.6-2. https://CRAN.R-project.org/package=vegan.
Otis D. L., Burnham K. P., White G. C., Anderson D. R. (1978). Statistical inference from capture data on closed animal populations. Wildlife Monogr. 62, 3–135.
Palmer W. E., Sisson D. C., Wellendorf S. D., Bostick A. M., Terhune T. M., Crouch T. L. (2012). Habitat selection by northern bobwhite broods in pine savanna ecosystems. National Quail Symposium Proceedings 7 (1), 70.
Palmer W. E., Carroll J. P., Sisson D. C., Wellendorf S. D., Terhune T. M., Ellis-Felege S. N., et al. (2019). Reduction in meso-mammal nest predators improves northern bobwhite demographics. J. Wildlife Manage. 83 (3), 646–656.
Perez R. M., Gallagher J. F., Frisbie M. C. (2002). “Fine scale influence of weather on northern bobwhite abundance, breeding success, and harvest in south Texas,” in Quail V: proceedings of the fifth national quail symposium. Eds. DeMaso S. J., Kuvlesky W. P. Jr, Hernandez F., Berger M. E. (Austin, TX: Texas Parks and Wildlife Department), 106–110.
Post E., Forchhammer M. C. (2002). Synchronization of animal population dynamics by largescale climate. Nature 420, 168–171. doi: 10.1038/nature01064
Quéroué M., Barbraud C., Barraquand F., Turek D., Delord K., Pacoureau N., et al. (2021). Multispecies integrated population model reveals bottom-up dynamics in a seabird predator–prey system. Ecol. Monogr. 91, 01459. doi: 10.1002/ecm.1459
Raimondo S., Liebhold A. M., Strazanac J. S., Butler L. (2004a). Population synchrony within and among Lepidoptera species in relation to weather, phylogeny, and larval phenology. Environ. Entomol. 29, 96–105. doi: 10.1111/j.0307-6946.2004.00579.x
Raimondo S., Turcáni M., Patoèka J., Liebhold A. M. (2004b). Interspecific synchrony among foliage-feeding forest Lepidoptera species and the potential role of generalist predators as synchronizing agents. Oikos 107, 462–470. doi: 10.1111/j.0030-1299.2004.13449.x
Ranta E., Kaitala V., Lindström J., Helle E. (1997). The Moran effect and synchrony in population dynamics. Oikos 78, 136–142. doi: 10.2307/3545809
Ranta E., Kaitala V., Lundberg P. (1998). Population variability in space and time: the dynamics of synchronous population fluctuations. Oikos 83, 376–382. doi: 10.2307/3546852
R Core Team (2021) R: a language and environment for statistical computing. r foundation for statistical computing, Vienna, Austria. Available at: https://www.R-project.org/.
Rectenwald J. A., Bellier E., Sisson D. C., Terhune T. M., Martin J. A. (2021). Top–down effects of raptor predation on northern bobwhite. Oecologia 197, 143–155. doi: 10.1007/s00442-021-04995-8
Reed A. W., Slade N. A. (2006). Demography and environmental stochasticity: empirical estimates of cotton rat survival. J. Mammal 87, 433–439. doi: 10.1644/05-MAMM-A-131R2.1
Rehmeier R. L., Kaufman G. A., Kaufman D. W., McMillan B. R. (2005). Long-term study of abundance of the hispid cotton rat in native tallgrass prairie. J. Mammal 86, 670–676. doi: 10.1644/1545-1542(2005)086[0670:LSOAOT]2.0.CO;2
Robertson G. S., Bolton M., Morrison P., Monaghan P. (2015). Variation in population synchrony in a multi-species seabird community: response to changes in predator abundance. PloS One 10, e0131543. doi: 10.1371/journal.pone.0131543
Rollins D., Carroll J. P. (2001). Impacts of predation on northern bobwhite and scaled quail. Wildlife Soc. Bull. 29, 39–51.
Rooney N., McCann K., Gellner G., Moore J. C. (2006). Structural asymmetry and the stability of diverse food webs. Nature 442, 265–269. doi: 10.1038/nature04887
Royama T. (1992). Analytical population dynamics. vol. 10. population and community biology series (London: Chapman & Hall).
Schnell J. H. (1968). The limiting effects of natural predation on experimental cotton rat populations. J. Wildlife Manage. 32, 698–711. doi: 10.2307/3799543
Sikes R. S., Animal Care and Use Committee of the American Society of Mammalogists (2016). 2016 guidelines of the American society of mammalogists for the use of wild mammals in research and education. J. Mammal 97, 663–688. doi: 10.1093/jmammal/gyw078
Speake D. W., Haugen A. (1960). Quail reproduction and weather in Alabama. Proc. Southeastern Assoc. Game Fish. Commissioners 14, 85–97.
Spiller D. A., Schoener T. W., Piovia-Scott J. (2016). Predators suppress herbivore outbreaks and enhance plant recovery following hurricanes. Ecology 97, 2540–2546. doi: 10.1002/ecy.1523
Staller E. L., Palmer W. E., Carroll J. P., Thornton R. P., Sisson D. C. (2005). Identifying predators at northern bobwhite nests. J. Wildlife Manage. 69, 124–132. doi: 10.2193/0022-541X(2005)069<0124:IPANBN>2.0.CO;2
Stenseth N. C., Chan K. S., Tavecchia G., Coulson T., Mysterud A., Clutton-Brock T., et al. (2004). Modelling non–additive and nonlinear signals from climatic noise in ecological time series: Soay sheep as an example. Proc. R. Soc. London. Ser. B: Biol. Sci. 271 (1552), 1985–1993.
Stien A., Ims R. A., Albon S. D., Fuglei E., Irvine R. J., Ropstad E., et al. (2012). Congruent responses to weather variability in high arctic herbivores. Biol. Lett. 8, 1002–1005. doi: 10.1098/rsbl.2012.0764
Stoddard H. L. (1931). The bobwhite quail; its habitats preservation and increase (New York: Charles Scribner’s Sons).
Stoessel M., Elmhagen B., Vinka M., Hellström P., Angerbjörn A. (2019). The fluctuating world of a tundra predator guild: bottom-up constraints overrule top-down species interactions in winter. Ecography 42 (3), 488–499. doi: 10.1111/ecog.03984
Sutcliffe O. L., Thomas C. D., Moss D. (1996). Spatial synchrony and asynchrony in butterfly population dynamics. J. Anim. Ecol. 65, 85–95. doi: 10.2307/5702
Terhune T. M., Palmer W. E., Wellendorf S. D. (2019). Northern bobwhite chick survival and effects of weather. J. Wildlife Manage. 83 (4), 963–974.
Thomas L., Buckland S. T., Rexstad E. A., Laake J. L., Strindberg S., Hedley S. L., et al. (2010). Distance software: design and analysis of distance sampling surveys for estimating population size. J. Appl. Ecol. 47, 5–14. doi: 10.1111/j.1365-2664.2009.01737.x
Tri A. N., Hernandez F., Hewitt D. G., Kuvlesky W. P. Jr., Brennan L. A. (2012). Effects of carbohydrate-based and protein-carbohydrate rations on wild bobwhite nesting and harvest demographics. Natl. Quail Symposium Proc. 7 (1), 68. doi: 10.7290/nqsp0781b2
Turkia T., Jousimo J., Tiainen J., Helle P., Rintala J., Hokkanen T., et al. (2020). Large-Scale spatial synchrony in red squirrel populations driven by a bottom-up effect. Oecologia 192, 425–437. doi: 10.1007/s00442-019-04589-5
Wald A., Wolfowitz J. (1943). An exact test for randomness in the non-parametric case based on serial correlation. Ann. Math. Stat 14, 378–388. doi: 10.1214/aoms/1177731358
Wellendorf S. D., Palmer W. E. (2005). Investigating the use of covey call point counts to estimate autumn density of northern bobwhites. Wildlife Biol. Pract. 1, 140–145. doi: 10.2461/wbp.2005.1.16
Wells R. (2008). Quail habitat management. Habitat management for bobwhites: a basic guide for the land manager (Americus, KS: Quail Unlimited).
White T. C. (1978). The importance of a relative shortage of food in animal ecology. Oecologia 33, 71–86. doi: 10.1007/BF00376997
Wiegert R. G. (1972). Avian versus mammalian predation on a population of cotton rats. J. Wildlife Manage. 36, 1322–1327.
Yates S. W., Sisson D. C., Stribling H. L., Speake D. W. (1995). Northern bobwhite brood habitat use in south georgia. Proceedings of the annual conference of the southeastern association of fish and wildlife agencies 49. 498–504.
Keywords: climate, Colinus virginianus, Moran’s theorem, shared predator hypothesis, Sigmodon hispidus
Citation: Hooker KR, Conner LM, Jack SB, Morris G, Palmer WE, Rutledge BT, Sisson DC, Terhune TM, Wellendorf SD and McCleery RA (2023) Trophic interactions between primary consumers appear to weaken during periods of synchrony. Front. Ecol. Evol. 11:1159464. doi: 10.3389/fevo.2023.1159464
Received: 06 February 2023; Accepted: 27 June 2023;
Published: 18 July 2023.
Edited by:
Jurek Kolasa, McMaster University, CanadaReviewed by:
William Harrower, Government of British Columbia, CanadaSungwoo Ahn, East Carolina University, United States
Copyright © 2023 Hooker, Conner, Jack, Morris, Palmer, Rutledge, Sisson, Terhune, Wellendorf and McCleery. This is an open-access article distributed under the terms of the Creative Commons Attribution License (CC BY). The use, distribution or reproduction in other forums is permitted, provided the original author(s) and the copyright owner(s) are credited and that the original publication in this journal is cited, in accordance with accepted academic practice. No use, distribution or reproduction is permitted which does not comply with these terms.
*Correspondence: Katie R. Hooker, VHRhNEBjZGMuZ292