 Sheng Li
 Hui Guo
 Chun-Ying Du1
 Xu Pang
 Yun Li
94% of researchers rate our articles as excellent or good
Learn more about the work of our research integrity team to safeguard the quality of each article we publish.
Find out more
ORIGINAL RESEARCH article
Front. Ecol. Evol., 01 June 2023
Sec. Population, Community, and Ecosystem Dynamics
Volume 11 - 2023 | https://doi.org/10.3389/fevo.2023.1159161
This article is part of the Research TopicBiomonitoring freshwater ecosystems health in a changing world: the significance of socio-ecological approachesView all 6 articles
Temperature variation affects the growth performance of fish species due to growing constraints and trade-off on physiological functions. Here we experimentally investigated several metabolic and physiological parameters in Sinilabeo rendahli, an endemic fish species found in the Yangtze River in China. After a 14-day acclimation period, we measured routine metabolic rate (RMR), individual metabolic rate (MO2), temperature quotient (Q10), loss of equilibrium (LOE), and critical oxygen tension (Pcrit) at three different temperatures (15, 20, and 25°C). Moreover, we sampled the muscle tissue from juvenile S. rendahli under experimental conditions after 28 days of acclimation and performed transcriptome-RNA sequencing (RNA-seq). The Pcrit of the fish at the above acclimation temperatures were determined to be 1.07, 1.28, and 1.33 mg·L−1, respectively, and corresponded with increasing acclimation temperatures (15–25°C). RMR was positively correlated with Pcrit (r = 0.4711, P = 0.0201), negatively correlated with LOE (r = −0.4284, P = 0.0367), and significantly positively correlated with MRcrit (r = 0.8797, P < 0.001) at temperatures ranging from 15 to 25°C. In addition, a total of 4,710 differentially expressed genes (DEGs) were identified. The results of DEG analysis and KEGG clustering analysis indicated that energy metabolism played a central role in thermal stress in S. rendahli for the major upregulated genes. This was followed by autophagy, mitophagy, cardiac muscle contraction, extracellular matrix (ECM)-receptor interaction, and protein digestion and absorption. This study is significant for understanding the adaptive response of S. rendahli to thermal stress. Even more importantly, this study demonstrates that S. rendahli is more suitable for cold-water life.
The physiological state of animals under the effects of temperature and dynamic change in the ecological sense is a critical issue (Machac et al., 2012; Morash et al., 2021). Variations in water temperature due to climate change severely challenge the fitness of fish species (Frolicher and Laufkotter, 2018; McKenzie et al., 2021). Water temperature is an environmental factor that affects the survival and distribution of fish. It is generally accepted that the dissolved oxygen level in water decreases with increasing temperature and that the routine metabolic rate (RMR) increases in the appropriate temperature range (Xie and Sun, 1989; Cook et al., 2006; Killen et al., 2010). Temperature changes affect the hypoxia tolerance of fish, such as critical oxygen pressure (Pcrit) and critical oxygen metabolic rate (MRcrit). Temperature acclimation, as a unique life history characteristic of ectotherms such as fish and reptiles, allows them to adjust their physiological functions, biochemical reactions, and behavior patterns to adapt to climate change in the appropriate temperature range (Chen et al., 2019).
Sinilabeo rendahli (Cypriniformes: Labeoninae) is an endemic fish in the middle and upper reaches of the Yangtze River (Zhang and Chen, 2006). This species has recently been listed into local law which encourages artificial breeding as a way to reduce the demand on the wild population and to help wildlife conservation (Yang et al., 2021); however, research on S. rendahli is limited to nutritional physiology (Zhang et al., 2010; Zhu et al., 2010), reproductive biology (Li et al., 2005; Ying et al., 2005; Zheng and Wu, 2011), population genetics (Zheng, 2007; Shao et al., 2013), and other aspects. In addition, researchers are dedicated to defining the metabolism and hypoxia tolerance of various fish species of aquaculture importance (Ott et al., 1980; Sørensen et al., 2014; He et al., 2015; Xia et al., 2017), and the response of S. rendahli to thermal variations at the physiological and biochemical levels remains unknown. Furthermore, the gene regulatory network of thermal adaptation can be analyzed using transcriptome level analysis.
In the current study, we explored the physiological response of juvenile S. rendahli to temperature acclimation from the perspective of routine metabolic rate and hypoxia tolerance. In addition, the adaptation mechanism of S. rendahli in response to persistent hyperthermia was further explored at the transcriptome level. This study aimed to elucidate the metabolic pathway of S. rendahli under different temperatures and to provide a theoretical basis for constructing signal transduction pathways, discovering temperature tolerance genes, and identifying adaptation mechanisms.
The Institutional Animal Care and Use Committee of Southwest University, China, approved experimental procedures. Experimental S. rendahli (N = 90) was transported from a local fishery (Pingchang, Sichuan, China) and reared in an indoor aerated recirculating aquaculture system (diameter 3 m, height 1.2 m) at a water temperature of 22 ± 0.5°C. In total, 20% of the water was renewed daily for oxygen supply.
Experimental fish (with the body weight of each fish being ~4 g) were randomly divided into three experimental groups: LT (15°C), MT (20°C), and HT (25°C) (which stand for low, medium, and high temperature, respectively), according to the seasonal temperature changes (Wang et al., 2014). The experimental fish were transferred to a 100-L glass tank, and there were 30 fish in each group. The thermal regime protocol used in this study follows that described in Li et al.'s (2021) study with slight modifications due to species. Dissolved oxygen in the experiment was above 7.0 mg L−1, with 10% of the water renewed daily. The fish-housed photoperiod was 12L: 12D, and the experimental fish were fed commercial diets once daily, after which the residual feed was siphoned. The contents of protein, fat, crude ash, and water in fish meals were 35, 4, 15, and 12.5%, respectively. The duration for carrying out the experimental procedures was 28 days.
Experimental fish were denied food for 48 h before the determination of routine metabolic rate (Sandblom et al., 2014). After 14 days of acclimation, a streamlined respiratory metabolism instrument was used to determine the routine metabolic rate (RMR; unit: mg h-1 kg-1). In total, 48 experimental fish were assigned to receive the same three treatments as in the acclimation phase. The body weight and length of the experimental fish were measured before the assignment. Each experimental fish was then individually placed in the respiratory chamber (size: 3 cm diameter, volume: 130 mL) of the metabolic analyzer for 12 h on the night before the measurement. A breathing chamber without fish was set as a blank control (Fu et al., 2007). The oxygen consumption rate (unit: mg h−1 kg−1) of the experimental fish was measured by a flowing-water respiratory metabolism instrument. With these settings, the dissolved oxygen of the flowing water in each chamber was monitored quantitatively to adjust the velocity for controlling the concentration of dissolved oxygen within 0.5–1.0 mg L−1 between the chamber with fish and the empty one. The dissolved oxygen of all respiratory rooms in the apparatus was measured six times at the outlet using a dissolved oxygen meter (HQ30d, Hach Company, Loveland, CO, USA), with measurements once every hour. The mean value of dissolved oxygen was taken to calculate the routine metabolic rate of the individual fish in this experiment. In formal testing, the testing environment (including dissolved oxygen, water temperature, light, etc.) was consistent with the acclimation treatment.
The formula for calculating the routine metabolic rate (RMR) of MO2 is
where ΔO2 is the difference between the dissolved oxygen level in the respiratory chamber of the blank tank and that in the respiratory chamber of the one with experimental fish (unit: mg·L−1); V is the water flow rate in the respiratory section of laboratory fish (unit: L·h−1); M is the final body mass of experimental fish (unit: kg).
The calculation formula for the temperature coefficient Q10 is as follows:
where R1 and R2 are the physiological parameters T1 and T2, respectively.
After the determination of the RMR, eight fish were randomly selected. The Pcrit of a single experimental fish was determined using a closed respiratory and metabolic instrument (220 mL) made of polymethylmethacrylate (PMMA) (Chen et al., 2019). The experimental fish were individually transferred to the closed respirator for at least 1 h after adjusting velocity to keep them swimming. During the adaptation period, water was allowed to flow into the upper part of the closed breathing chamber to maintain communication with the water environment of the water tank, ensuring sufficient oxygen and preventing experimental fish from escaping. An additional circulating pump was installed outside the breathing room and activated to provide low-speed water flow at selected adaptive temperatures. During the measurement, it was necessary to seal the breathing room port, use the dissolved oxygen meter (HQ30d, Hach Company, Loveland, CO, USA) to seal the top port of the breathing room, and apply petroleum jelly (Vaseline) at the seal to ensure that the breathing room was completely closed. The changes in dissolved oxygen in the respiratory chamber were continuously monitored. Dissolved oxygen and the oxygen percentage were recorded every 3 min. In formal testing, the testing environment (including dissolved oxygen, water temperature, light, etc.) was consistent with the acclimation treatment. Pcrit and Mrcrit were determined using the double-line method (Yeager and Ultsch, 1989).
The formula for calculating the respiration and oxygen consumption rates of the experimental fish at each unit time interval is as follows:
where [O2] k is the dissolved oxygen value (mgO2 L−1) at the previous moment; [O2] k+1 is the dissolved oxygen value at the next moment; V represents the volume (L) of fish removed in the breathing room; t represents the interval time (h) between the previous point and the next point; and Mb represents the weight (kg) of the tail fish.
Experimental fish were deprived of food for 48 h after temperature acclimation for 28 days. Triplicates of 12 fish from each treatment (LT and HT) were euthanized, with the muscle tissue (white muscle at the dorsal fin) attributed to three biological replicates. Shanghai Paisenuo Company powered the service for digital RNA sequencing (RNA-seq).
An equal amount (~1.5 g of each mixed sample) of muscle tissue samples was acquired from the LT and control groups (HT) for the analysis of RNA-seq and expression profiles. Before sample acquisition, total RNA was extracted from Sinilabeo rendahli muscle tissues (LT and HT all had four samples) using RNA extraction lysis buffer (RNAiso Plus, TaKaRa, Japan) according to the manufacturer's instructions. The RNA purity and concentration were checked using a NanoDrop spectrophotometer (NanoDrop Technologies, Wilmington, USA). Equal amounts of 6 μg of qualified RNA were obtained from the LT and HT groups as input material for RNA-seq library preparation. After the library was constructed, library fragments were enriched using PCR amplification. Then, the concentration and the quality of the library were detected using an Agilent 2100 Bioanalyzer (Agilent Technologies, Inc., America). Then, the effective concentration of the library was accurately quantified using the quantitative real-time PCR (qPCR) technology, and the different libraries that passed the library inspection were sequenced on the Illumina NovaSeq PE150 platform according to the effective concentration (Personal Biotechnology Co., Ltd., Shanghai, China).
The raw reads were converted from raw image files using the software of the sequencing platform. Afterward, the clean reads of LT and HT samples were obtained by removing reads containing three terminal sequences with adapters and low-quality reads (quality score <20) using Cutadapt and then assembled using Trinity for de novo assemblies. With these clean reads, the longest transcript of each gene was selected as the representative sequence of the gene, a unigene.
Six public databases, namely, NCBI non-redundant protein sequences (NR), Gene Ontology (GO), Kyoto Encyclopedia of Genes and Genomes (KEGG), evolutionary genealogy of genes: Non-supervised Orthologous Groups (eggNOG), Swiss-Prot (manually annotated and reviewed protein sequence database), and Pfam, were selected to compare with unigene sequences and annotate gene functions using Blastx with an E-value of <10−5. Transcriptome sequences and FPKM values were calculated to quantify gene expression using DESeq (Simon and Wolfgang, 2010; Dewey and Li, 2011) using the software package to analyze differentially expressed genes and gene expression levels that were significant at| Log2FoldChange | ≥ 1 or a P-value of <0.05. Databases such as GO (Gene Ontology Consortium, 2004) and KEGG (Kanehisa et al., 2010) were used for the functional annotation of differentially expressed genes.
To further validate the confidence of our RNA-seq sequencing data, 20 DEGs were selected randomly and analyzed for qPCR analysis using the same RNA samples from the muscle RNA-Seq. Total RNA was purified and evaluated according to the above method. Then, 5 μg of total RNA from each test sample was reverse transcribed using the GoScript™ Reverse Transcription System (Promega, USA) following the manufacturer's protocols, synthesizing cDNA for qPCR. The qPCR was carried out with a CFX96 Real-Time PCR Detection System (Bio-Rad, USA). The total reaction volume of 15 μl reactions contained 7.5 μl of GoTaq® qPCR Master Mix (Promega, USA), 1 μl of diluted cDNA or nuclease-free water for the template as a negative control, 5.7 μl of nuclease-free water, and 0.4 μl of 10 mM stock solutions of each primer. The amplification profile was as follows: 95°C for 30 min, 95°C for 30 s, 40 amplification cycles of 95°C for 5 s, and 60°C for 1 min. Each qPCR assay was performed in triplicate for analysis, and target specificity was determined using dissociation curve analysis. Primers were designed according to unigenes obtained by Trinity splicing of RNA-seq. Software Primer 6.0 was used to design qPCR primers. β-actin genes were selected as the internal reference, and the samples from the control group were used as calibrators. The relative mRNA expression of the target gene was determined using the 2−ΔΔCT method.
Equal variances and a Gaussian distribution of residuals were checked before one-way ANOVA prior to multiple comparisons. The Pcrit was obtained using the “two-line method” (Yeager and Ultsch, 1989). The qPCR results were converted into the relative expression of each gene calculated by 2−ΔΔCT (Livak and Schmittgen, 2001). The result was expressed as “mean ± error (Std. Error of Mean, SEM)”. A t-test was used to compare the expression of qPCR on the muscle tissue of Sinilabeo rendahli between the LT and HT groups. The obtained data were statistically analyzed and plotted using GraphPad Prism 9.0 software or R, and the significance level was set at a P-value of <0.05.
After 14 days of temperature acclimation, there was no significant difference in body length and weight among all temperature groups in Supplementary Table 1 (P > 0.05; Figures 1A, B). After 28 days of temperature acclimation, the statistical results of body weight and body length showed significant differences between the LT and HT groups (P < 0.05; Figures 1C, D).
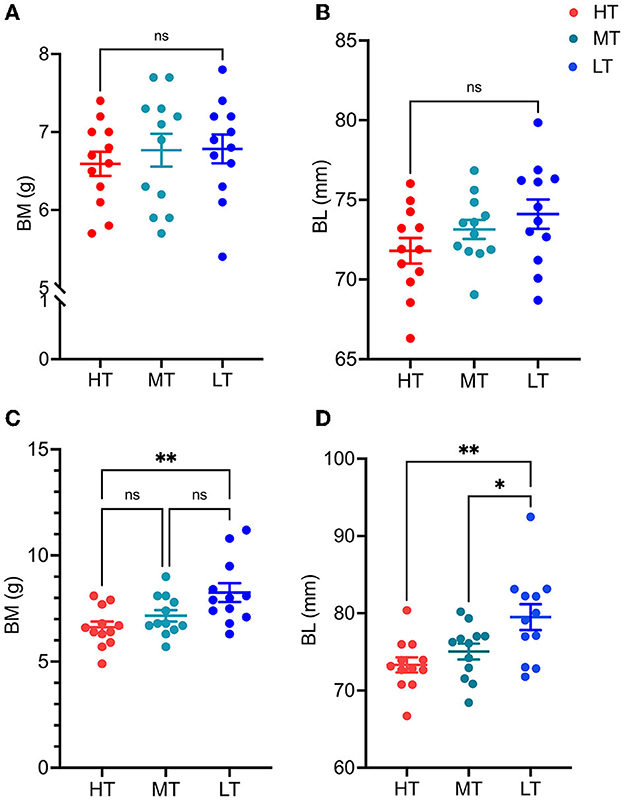
Figure 1. Growth performance of S. rendahli at different temperatures at 14 days and 28 days of acclimation. HT, MT, and LT denote 25, 20, and 15°C groups, respectively. (A, B) represent body length and weight at 14 days of acclimation. (C, D) denote body weight and length at 28 days of acclimation, respectively (n = 12). *means P ≤ 0.05; **means P ≤ 0.01.
The body length and weight of juvenile S. rendahli used in the experiment measuring the resting metabolic rate were not statistically significant among the three temperature groups (Supplementary Table 1). It was observed that, with increasing domestication temperatures, the resting metabolic rate also increased among the different temperature groups. The Pcrit of the LT, MT, and HT groups was 1.07, 1.28, and 1.33 mg·L−1, respectively (Figure 2). The MO2 was 92 (Figure 2A), 136 (Figure 2B), or 175 mg·h−1 kg−1. The LOE was 0.36, 0.42, and 0.27 mg·L−1 (Supplementary Table 1), respectively. MRcrit was 88.79, 141.1, and 178.0 mg·h−1·kg−1 (Supplementary Table 1), respectively. The metabolic level of the experimental fish remained at a relatively stable level until the dissolved oxygen concentration in the environment decreased below Pcrit (the crossing point of the two black lines in Figure 2). The metabolic level decreased with a decline in dissolved oxygen in the environment. Moreover, RMR was positively correlated with Pcrit (r = 0.4711, P= 0.0201), negatively correlated with LOE (r = −0.4284, P = 0.0367), and significantly positively correlated with MRcrit (r = 0.8797, P < 0.001).
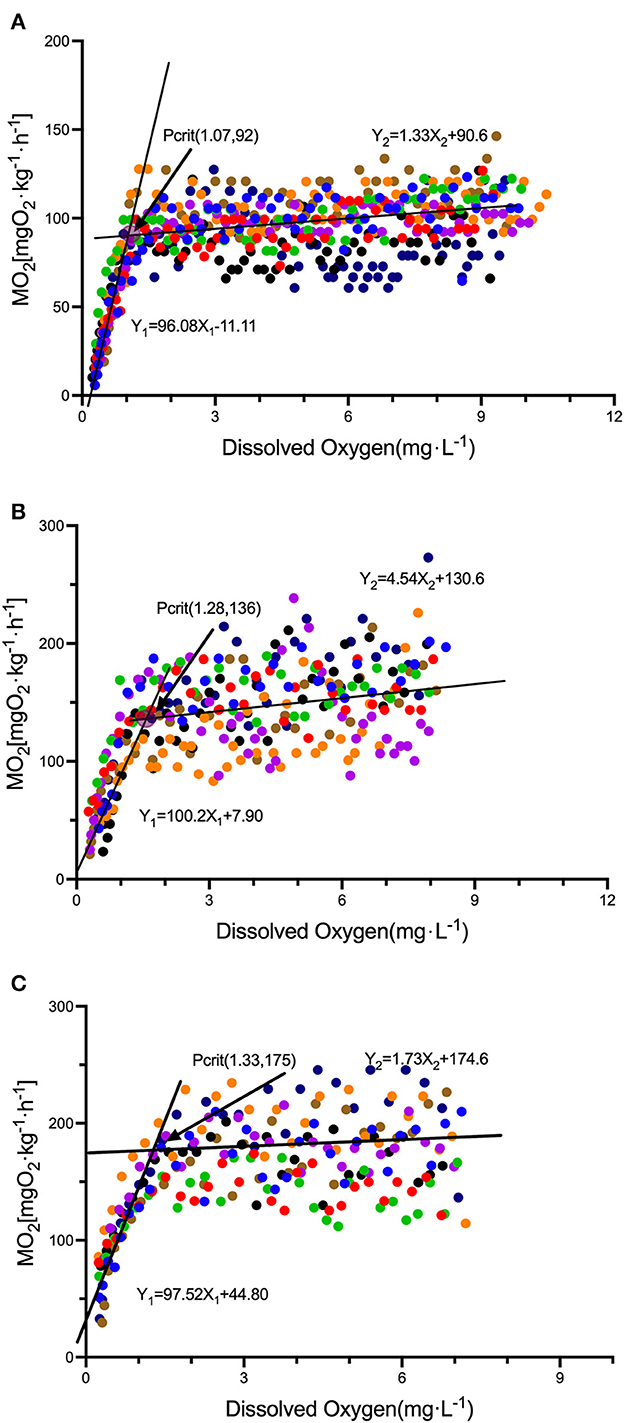
Figure 2. Responses of the metabolic level of S. rendahli to the level of dissolved oxygen in the environment under different temperature acclimation (n = 8). Different colors indicate the oxygen consumption rate of different individuals in an environment with dissolved oxygen, and (A–C) indicates the 15, 20, and 25°C groups, respectively.
Two test points, each with three replicates (LT and HT), were analyzed using RNA-Seq. Six digital RNA-seq libraries were sequenced from the control and treatment groups, generating an average of 47,899,330 raw reads and 44,040,656 clean reads after filtering out low-quality sequences (Table 1). The percentage of Q30 bases in each sample was more than 95% (Table 1). These data indicate that the sequencing depth was sufficient for transcriptome coverage in S. rendahli. The sequencing results are shown in Table 1. After sequencing quality control, the percentage of Q30 bases in each sample was not <95%, and the GC base content was ~42%. This finding suggests that the digital RNA-seq data were reliable and sufficient for subsequent bioinformatics analysis. The RNA-Seq data were uploaded to the NCBI Sequence Read Archive (SRA) database in NCBI at https://submit.ncbi.nlm.nih.gov/subs/sra/ with accession number PRJNA902088.
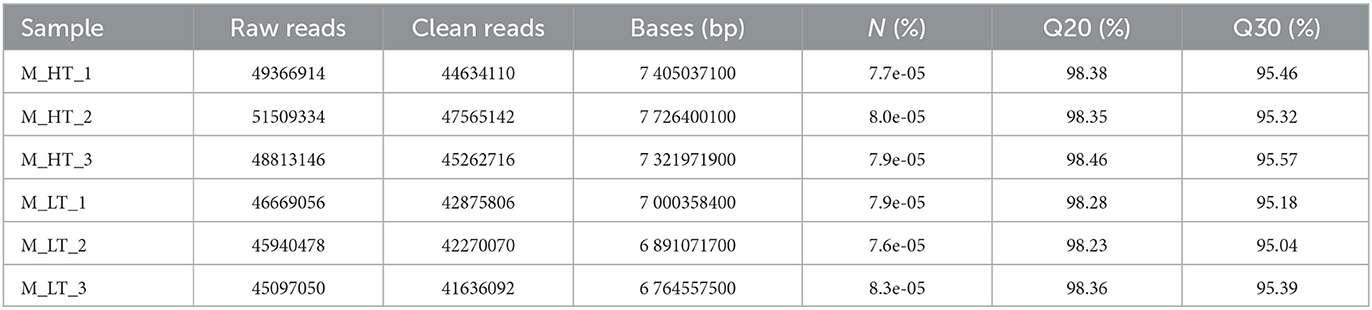
Table 1. Summary of illumina sequencing results.
Based on differential expression analysis with an adjusted P-value of <0.05 as the threshold, 4,710 DEGs were identified from samples collected from the muscle of the fish at different temperatures (Figure 3B). Compared with the LT group, the HT group had 2,215 upregulated genes, including hspb1, hsp70, hsp30, myh6, myoa5, myh7, c-jun, mstnb, and ldha (Table 2). A total of 2,495 genes were downregulated, including hif1a, pgm2l1, g6pd, mapk14a, cyp2k1, cyp2k4, and npy.
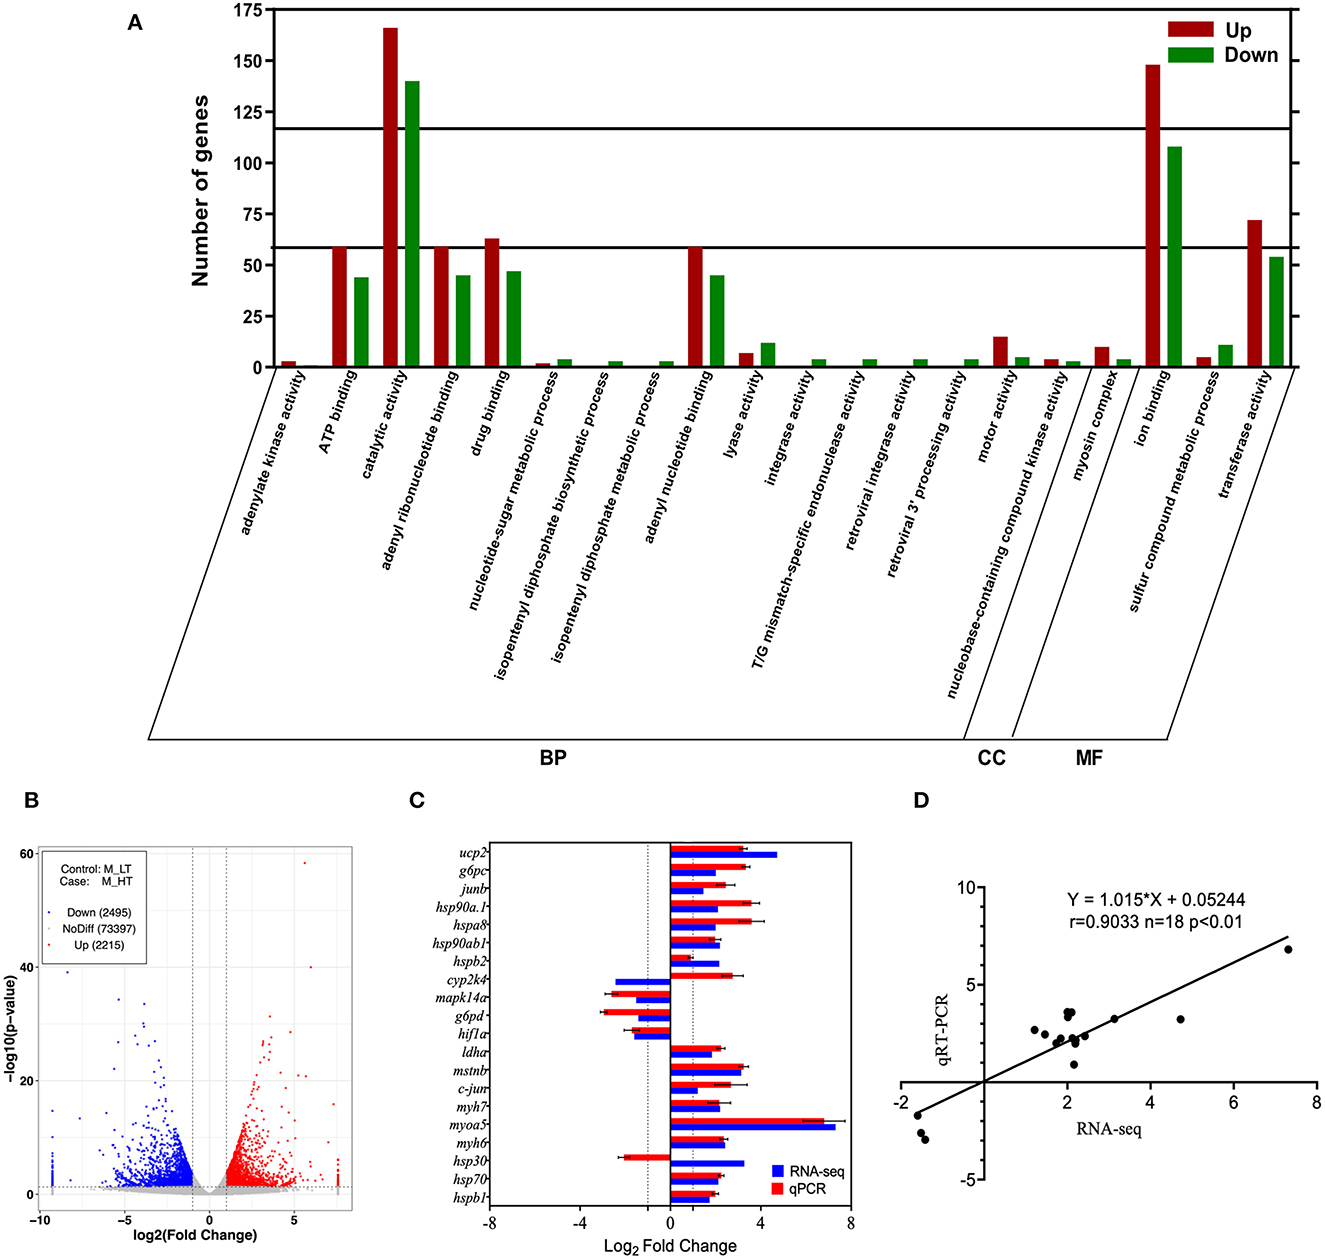
Figure 3. Correlation plot of differentially expressed genes. (A) GO enrichment of the top 20 most significant functions. (B) Volcano plot of differentially expressed genes in the muscle of high-temperature group (M_HT) vs. control group (M_LT). (C) Sequencing results of differentially expressed gene qPCR validation. (D) Correlation analysis of validation results and sequencing results. BP, Biological Processes; MF, Molecular Function; CC, Cellular Component; LT, low temperature; HT, high temperature.
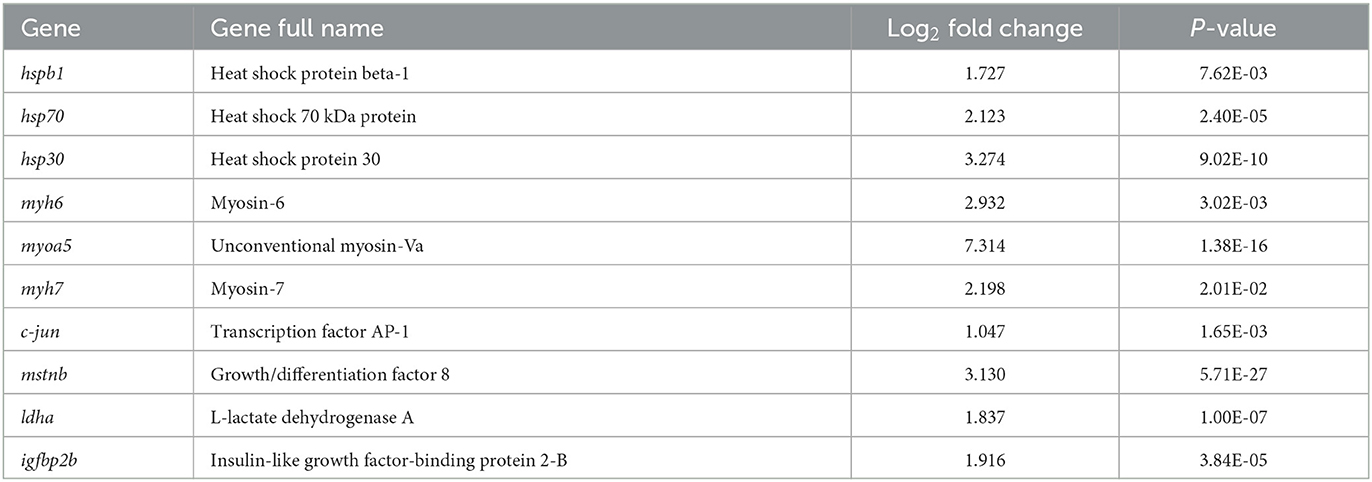
Table 2. Several upregulated genes after thermal acclimation (25°C) of S. rendahli.
We performed GO and KEGG functional enrichment analyses of the 4,710 DEGs. GO enrichment analysis showed that the 20 most significant GO enrichment items were mainly related to exercise activity and ATP binding (Figure 3A). The results of the KEGG cluster analysis showed that the pathways enriched in the muscles of M_LT and M_HT refer to muscle (M) RNA-Seq on the low temperature (LT) group and high temperature (HT) group respectively after 28 days of temperature treatment were mainly concentrated in the metabolic and biological systems, and several tracks related to muscle function were upregulated in the HT group, such as autophagy, mitophagy-animal, cardiac muscle contraction, extracellular matrix (ECM)-receptor interaction, and protein digestion and absorption (Table 3).

Table 3. KEGG pathway of differentially expressed genes.
To validate the DEGs identified using RNA-seq analysis, we randomly selected 20 genes (hspb1, hsp70, hsp30, myh6, myoa5, myh7, c-jun, mstnb, ldha, hif1a, g6pd, mapk14a, cyp2k4, hspb2, hsp90ab1, hspa8, hsp90a.1, junb, g6pc, and ucp2) for qPCR confirmation at different temperatures. The expression levels of these 20 DEGs were evaluated using qPCR and compared with the expression levels obtained from the RNA-Seq analysis. The qPCR results were mostly consistent with those of the RNA-Seq experiments (Figures 3C, D), with similar upregulation and downregulation patterns.
Temperature is a significant environmental factor that has profound effects on all levels of biological organization, ranging from molecules to ecosystems (Dickson and Graham, 2004). Two important functions of fish at high temperatures are exercise metabolism and hypoxia tolerance. Previous studies have demonstrated that variations in water temperature have an impact on the homeostasis of fish behavior and metabolism (Lv and Yuan, 2017). However, there is still a lack of basic biological research on behavioral strategies, metabolic strategies, and other related aspects of S. rendahli at different environmental temperatures. Therefore, our primary goal in the study was to better understand the metabolic characteristics, hypoxia tolerance, and molecular regulation mechanisms of S. rendahli at different temperatures.
In this study, we measured exercise metabolism and hypoxia tolerance at three temperatures (15, 20, and 25°C) after 14 days of acclimation in S. rendahli. At the same time, we conducted digital RNA-Seq analysis of gene-trait correlations to analyze muscle gene expression at 15 and 25°C after 28 days of acclimation in S. rendahli.
The individual cost of maintaining the metabolic level in poikilothermic animals is at most 50% of total (Steyermark et al., 2005). Due to polymorphisms in temperature sensitivity among different species, there are different degrees of interspecific differences in their physiological response parameters. In the current study, we observed that the Q10 value of the RMR of juvenile S. rendahli was close to or <2 in the temperature ranges of 15–20°C and 20–25°C. However, the Q10 of the RMR of widespread temperature fish, such as Parabramis pekinensis and Carassius auratus, is generally <2. Salmonids have been reported to adapt to cold-water life year-round, and the Q10 of the RMR of low-temperature fish, such as Oncorhynchus nerka and Salmo salar, is the opposite, that is, >2. Combined with the temperature coefficient Q10 of S. rendahli, the results showed that the sensitivity of S. rendahli to temperature was more substantial than that of common ectotherm cyprinid fish but weaker than that of salmonids.
The RMR of fish exhibits a thermal dependence in a suitable temperature range (Kelly et al., 2014; Xia et al., 2017). RMR refers to the level of metabolism that a fish needs to maintain its life when it is at rest or on an empty stomach, which reflects its ability to maintain its metabolic characteristics. Studies have shown that, in the temperature range of 4–10°C, the resting metabolic rate of Gadus macrocephalus remains relatively stable or even does not increase with increasing temperature (Hölker, 2003; Hanna et al., 2008). In this study, temperature acclimation had a significant effect on the metabolic level of juvenile S. rendahli, and RMR increased with increasing temperature. Due to the instability of the natural environment, the metabolic level of S. rendahli was correspondingly changed by the ambient temperature. The reason for the instability is that the activities of related respiratory and metabolic enzymes in S. rendahli change with temperature, as reflected in swimming ability, reflecting the strength of sports function (He et al., 2015).
Different fish strategies for coping with high-temperature and low-oxygen environments were peculiar, showing similarities and differences in plasticity (Dhillon et al., 2013). The continuous temperature generated different degrees of body weight effects in S. rendahli after 28 days of treatment compared to that observed after 14 days of treatment. The response pattern of Pcrit to temperature changes is different in a hypoxic environment. In this study, we observed that, after continuous temperature treatment for 14 days, the metabolism and hypoxia tolerance of S. rendahli were significantly affected. RMR and Pcrit increased with temperature, and the Pcrit of the experimental fish increased by 24.2%. Studies have shown that hypoxia tolerance in fish species exhibit a stable or increasing pattern even in a narrow variation (Barrionuevo and Burggren, 1999; Mandic et al., 2009). It is generally understood that, with an increase in ambient temperature, fish metabolism doubles, oxygen demand increases, and anoxic tolerance decreases, and this study provides further evidence for these trends (Sørensen et al., 2014). Therefore, it has been speculated that the physiological plasticity of S. rendahli enables it to cope with acute hypoxia. With an increase in temperature, the RMR of S. rendahli may be associated with a change in hypoxia tolerance, and its internal adaptation mechanism requires further study.
Continuous high-temperature acclimation produced a strong stress response in S. rendahli. The KEGG enrichment pathway showed a significant upregulation of autophagy-related pathways in the muscle tissues, which may have exacerbated the process of apoptosis. Heat shock proteins are generally synthesized in response to stress caused by environmental treatments and are essential for stabilizing cell structure and maintaining cell function (Fujimoto and Nakai, 2010). In this study, the expression of stress-related genes was upregulated in the muscle tissue, such as hspb1, hsp70, hsp30, and hsp90ab1, which are genes in the heat shock protein family. It is believed that the acclimation process may occur primarily through the acceleration of metabolic processes at the molecular and physiological levels in response to the high-temperature environment to regulate life activities and maintain the normal growth activities of the organism.
In this study, GO enrichment showed that the ion binding and transport activities of different genes were significantly enriched at a high temperature (25°C). The permeability of biological membranes may be enhanced during continuous high-temperature acclimation, which accelerates the exchange rate between substances transported across the membrane. It will also increase the storage and turnover of environmental contaminants in the muscles of S. rendahli in China (Nikinmaa, 2013). In addition, temperature, as a stress factor, tends to induce the transcription of genes most often associated with toxic effects. At the same time, cytochrome P450-related pathways that concern the metabolism of endogenous substrates and detoxifying heterologous compounds may also activate the immune response of S. rendahli.
In an aquaculture orientation, this study determined the metabolic characteristics and changes in hypoxia tolerance at different temperatures (15, 20, and 25°C) after 14 days of temperature acclimation in S. rendahli. We also measured the effects of different temperatures on the expression of metabolism-related genes in S. rendahli at different temperatures (15 and 25°C) after 28 days of temperature acclimation. The main conclusions are given below.
The metabolic rate and hypoxia tolerance of Siniperca chuatsi changed with different acclimation temperatures. Under high temperatures, the ability of S. rendahli to maintain metabolism, exercise activity, and adaptability was enhanced. Under low temperatures, the individual metabolism of S. rendahli was low, with strong hypoxia tolerance, poor exercise ability, and poor adaptability. Transcriptome gene expression difference analysis indicated that, compared with low temperatures (15°C), high temperatures (25°C) produced a stronger stress response, which affected its normal physiological metabolism. Fatty acids, as energy storage substances, may be used more in muscles to maintain the swimming demand at high temperatures.
Under continuously high temperatures (25°C), the growth rate of S. rendahli was inhibited by enhancing metabolism, which was the reason for low oxygen tolerance; therefore, it was inferred that S. rendahli is a type of fish that is more adapted to cold-water life.
The datasets presented in this study can be found in online repositories. The name of the repository and accession number can be found below: NCBI; PRJNA902088.
Ethical review and approval was not required for the animal study because SARS-CoV-2 negatively interrupts the normal approval workflow, and in practical terms our study involves less than minimal risk, and therefore not require ethical review.
SL: software, validation, investigation, data curation, writing—review and editing, and visualization. HG: software: validation, investigation, data curation, writing—original draft, writing—review, editing, and visualization. C-YD and Y-XT: software, investigation, and data curation. J-YF: formal analysis, investigation, and data curation. HX: formal analysis and investigation. XP: conceptualization, methodology, resources, funding acquisition, and project administration. YL: conceptualization, methodology, funding acquisition, project administration, supervision, validation, writing—review, and editing. All authors contributed to the article and approved the submitted version.
The study was supported by the Key Research Project of Chongqing Fishery Science and Technology Innovation Alliance (No. 4322200053); the Evaluation on the Effectiveness of Fishery Stock Enhancement Project of Chongqing Municipal Agricultural and Rural Committee (CQLT-2022-011); and the study on Physiological Diversity of Fish Based on Energy Metabolism (cstc2020jcyj-msxmX0479). The funders had no role in the study design, data collection and analysis, publication decision, or manuscript preparation.
We wish to thank the editors and reviewers for their comments and suggestions. We thank Lang Xie for their advice on the experimental design. We are also grateful to Wenbo Wang and Zhentao Nie for their laboratory assistance.
The authors declare that the research was conducted in the absence of any commercial or financial relationships that could be construed as a potential conflict of interest.
All claims expressed in this article are solely those of the authors and do not necessarily represent those of their affiliated organizations, or those of the publisher, the editors and the reviewers. Any product that may be evaluated in this article, or claim that may be made by its manufacturer, is not guaranteed or endorsed by the publisher.
The Supplementary Material for this article can be found online at: https://www.frontiersin.org/articles/10.3389/fevo.2023.1159161/full#supplementary-material
Barrionuevo, W. R., and Burggren, W. W. (1999). O2 consumption and heart rate in developing zebrafish (Danio rerio): influence of temperature and ambient O2. Am. J. Physiol. Regul. 276, R505–R513. doi: 10.1152/ajpregu.1999.276.2.R505
Chen, B. J., Fu, S. J., Cao, Z. D., and Wang, Y.-X. (2019). Effect of temperature on critical oxygen tension (Pcrit) and gill morphology in six cyprinids in the Yangtze River, China. Aquaculture 508, 137–146. doi: 10.1016/j.aquaculture.2019.04.057
Cook, A. M., Duston, J., and Bradford, R. G. (2006). Thermal tolerance of a northern population of striped bass Morone saxatilis. J. Fish Biol. 69, 1482–1490. doi: 10.1111/j.1095-8649.2006.01211.x
Dewey, C. N., and Li, B. (2011). RSEM: accurate transcript quantification from RNA-Seq data with or without a reference genome. BMC Bioinformatics 12, 323. doi: 10.1186/1471-2105-12-323
Dhillon, R. S., Yao, L., Matey, V., Chen, B.-J., Zhang, A.-J., Cao, Z.-D., et al. (2013). Interspecific differences in hypoxia-induced gill remodeling in carp. Physiol. Biochem. Zool. 86, 727–739. doi: 10.1086/673180
Dickson, K. A., and Graham, J. B. (2004). Evolution and consequences of endothermy in fishes. Physiol. Biochem. Zool. 77, 998–1018. doi: 10.1086/423743
Frolicher, T. L., and Laufkotter, C. (2018). Emerging risks from marine heat waves. Nat. Commun. 9, 650. doi: 10.1038/s41467-018-03163-6
Fu, S. J., Cao, Z. D., and Peng, J. L. (2007). The effects of chasing and air exposing on oxygen consumption in Pelteobag vachelli. Chin. J. Zool. 42, 111–115.
Fujimoto, M., and Nakai, A. (2010). The heat shock factor family and adaptation to proteotoxic stress. FEBS J. 277, 4112–4125. doi: 10.1111/j.1742-4658.2010.07827.x
Gene Ontology Consortium (2004). The gene ontology (GO) database and informatics resource. Nucleic Acids Res. 32, 258D–D261. doi: 10.1093/nar/gkh036
Hanna, S. K., Haukenes, A. H., Foy, R. J., and Buck, C. L. (2008). Temperature effects on metabolic rate, swimming performance and condition of Pacific cod Gadus macrocephalustilesius. J. Fish Biol. 72, 1068–1078. doi: 10.1111/j.1095-8649.2007.01791.x
He, W., Cao, Z. D., and Fu, S. J. (2015). Effect of temperature on hypoxia tolerance and its underlying biochemical mechanism in two juvenile cyprinids exhibiting distinct hypoxia sensitivities. Comp. Biochem. Physiol. Part A Mol. Integr. Physiol. 187:232–241. doi: 10.1016/j.cbpa.2014.05.004
Hölker, F. (2003). The metabolic rate of roach in relation to body size and temperature. J. Fish Biol. 62, 565–579. doi: 10.1046/j.1095-8649.2003.00048.x
Kanehisa, M., Goto, S., Furumichi, M., Tanabe, M., and Hirakawa, M. (2010). KEGG for representation and analysis of molecular networks involving diseases and drugs. Nucleic Acids Res. 38, D355–D360. doi: 10.1093/nar/gkp896
Kelly, N. I., Burness, G., McDermid, J. L., and Wilson, C. C. (2014). Ice age fish in a warming world: minimal variation in thermal acclimation capacity among lake trout (Salvelinus namaycush) populations. Conserv. Physiol. 2, cou025. doi: 10.1093/conphys/cou025
Killen, S. S., Atkinson, D., and Glazier, D. S. (2010). The intraspecific scaling of metabolic rate with body mass in fishes depends on lifestyle and temperature. Ecol. Lett. 13, 184–193. doi: 10.1111/j.1461-0248.2009.01415.x
Li, P., Zhang, Y. G., Yin, J. X., Tuo, Y., Jin, L., and Zhao, H. P. (2005). Preliminary studies on the sperm motility of Sinilabeo rendahli. J. Southwest China Normal Univ. 30, 1100–1104. doi: 10.13718/j.cnki.xsxb
Li, S., Guo, H., Chen, Z., Jiang, Y., Shen, J., Pang, X., and Li, Y. (2021). Effects of acclimation temperature regime on the thermal tolerance, growth performance and gene expression of a cold-water fish, Schizothorax prenanti. J. Therm. Biol. 98, 102918. doi: 10.1016/j.jtherbio.2021.102918
Livak, K. J., and Schmittgen, T. D. (2001). Analysis of relative gene expression data using real-time quantitative PCR and the 2-ΔΔCT method. Methods 25, 402–408. doi: 10.1006/meth.2001.1262
Lv, W. Q., and Yuan, M. Z. (2017). The literature review of temperature change effect on fish behavior. J. Shanghai Ocean Univ. 26, 828–835. doi: 10.12024/jsou.20150501459
Machac, A., Zrzavý, J., Smrckova, J., and Storch, D. (2012). Temperature dependence of evolutionary diversification: differences between two contrasting model taxa support the metabolic theory of ecology. J. Evol. Biol. 25, 2449–2456. doi: 10.1111/jeb.12019
Mandic, M., Todgham, A. E., and Richards, J. G. (2009). Mechanisms and evolution of hypoxia tolerance in fish. Proc. R. Soc. B Biol. Sci. 276, 735–744. doi: 10.1098/rspb.2008.1235
McKenzie, D. J., Zhang, Y., Eliason, E. J., Schulte, P. M., Claireaux, G., Blasco, F. R., et al. (2021). Intraspecific variation in tolerance of warming in fishes. J. Fish Biol. 98, 1536–1555. doi: 10.1111/jfb.14620
Morash, A. J., Speers-Roesch, B., Andrew, S., and Currie, S. (2021). The physiological ups and downs of thermal variability in temperate freshwater ecosystems. J. Fish Biol. 98, 1524–1535. doi: 10.1111/jfb.14655
Nikinmaa, M. (2013). Climate change and ocean acidification—interactions with aquatic toxicology. Aquat. Toxicol. 126, 365–372. doi: 10.1016/j.aquatox.2012.09.006
Ott, M. E., Heisler, N., and Ultsch, G. R. (1980). A re-evaluation of the relationship between temperature and the critical oxygen tension in freshwater fishes. Comp. Biochem. Physiol. Part A Physiol. 67, 337–340. doi: 10.1016/S0300-9629(80)80005-3
Sandblom, E., Gräns, A., Axelsson, M., and Seth, H. (2014). Temperature acclimation rate of aerobic scope and feeding metabolism in fishes: implications in a thermally extreme future. Proc. R. Soc. B Biol. Sci. 281, 20141490. doi: 10.1098/rspb.2014.1490
Shao, K., Xiong, M. H., Xu, N., Zhu, B., and Shi, F. (2013). Characterization of microsatellite loci in Sinilabeo rendahli and cross-amplification in four other Chinese cyprinid species. Conserv. Genet. Resour. 5, 9–13. doi: 10.1007/s12686-012-9717-3
Simon, A., and Wolfgang, H. (2010). Differential expression analysis for sequence count data. Genome Biol. 11, R106. doi: 10.1186/gb-2010-11-10-r106
Sørensen, C., Munday, P. L., and Nilsson, G. E. (2014). Aerobic vs. anaerobic scope: sibling species of fish indicate that temperature dependence of hypoxia tolerance can predict future survival. Glob. Change Biol. 20, 724–729. doi: 10.1111/gcb.12399
Steyermark, A. C., Miamen, A. G., Feghahati, H. S., and Lewno, A. W. (2005). Physiological and morphological correlates of among-individual variation in standard metabolic rate in the leopard frog Rana pipiens. J. Exp. Biol. 208, 1201–1208. doi: 10.1242/jeb.01492
Wang, Q., Zhang, M., Wang, S., Ma, Q., and Sun, M. (2014). Changes in temperature extremes in the Yangtze River Basin, 1962–2011. J. Geogr. Sci. 24, 59–75. doi: 10.1007/s11442-014-1073-7
Xia, J. G., Chen, M., Xiao, J., Fu, S. J., et al. (2017). The metabolism and hypoxia tolerance of Brachymystax lenok tsinlingensis in relation to temperature acclimation. J. Aquat. Biol. 41, 201–205. doi: 10.7541/2017.25
Xie, X. J., and Sun, R. Y. (1989). New perspective of the studies on several important ecological factors influencing metabolism of fishes—a review. J. Southwest Normal Univ. 141–149. doi: 10.13718/j.cnki.xsxb.1989.04.014
Yang, L. P., Li, M. Y., Wu, J. H., and Cai, C. L. (2021). Understanding and application of “opinions on implementing the yangtze river protection law”. Peoples Just. 10, 45–50. doi: 10.19684/j.cnki.1002-4603.2021.10.009
Yeager, D. P., and Ultsch, G. R. (1989). Physiological regulation and conformation: a BASIC program for the determination of critical points. Physiol. Zool. 62, 888–907. doi: 10.1086/physzool.62.4.30157935
Yin, J. X., Zhang, Y. G., Li, P., and Tuo, Y. (2005). A preliminary study on the histology and histochemistry of the digestive tract of the Sinilabeo rendahli. Freshwater Fish. 35, 7–10.
Zhang, E., and Chen, Y. Y. (2006). Revised diagnosis of the genus Bangana Hamilton (1822). (Pisces: Cyprinidae), with taxonomic and nomenclatural notes on the Chinese species. Zootaxa 1281, 1. doi: 10.11646/zootaxa.1281.1.3
Zhang, Z. Q., Zhu, L., Hu, S. R., Huang, H., and Li, Z. Y. (2010). Analysis of meat content and muscle nutrient composition of Sinilabeo rendahli under artificial culture conditions. Qilu Fishery 27, 1–5.
Zheng, S. M., and Wu, Q. (2011). Scanning electron microscopic observation of the morphological structure of the gill surface of the Sinilabeo rendahli. J. Sichuan Zool. 30, 212–213.
Zheng, T. S. (2007). RAPD analysis of genetic diversity of Cirrhinus molitorella, Sinilabeo decorus tungting and Sinilabeo renahli. A thesis in Hunan Agricultural University.
Keywords: Sinilabeo rendahli, temperature acclimation, critical oxygen tension (Pcrit), routine metabolic rate (RMR), RNA-seq
Citation: Li S, Guo H, Du C-Y, Tao Y-X, Feng J-Y, Xu H, Pang X and Li Y (2023) Effect of temperature on exercise metabolism, hypoxia tolerance, and RNA-seq analysis in Sinilabeo rendahli from the Yangtze River, China. Front. Ecol. Evol. 11:1159161. doi: 10.3389/fevo.2023.1159161
Received: 16 February 2023; Accepted: 04 May 2023;
Published: 01 June 2023.
Edited by:
Augustine Ovie Edegbene, Federal University of Health Sciences Otukpo, NigeriaReviewed by:
Olusegun Olatunji, Samuel Adegboyega University, NigeriaCopyright © 2023 Li, Guo, Du, Tao, Feng, Xu, Pang and Li. This is an open-access article distributed under the terms of the Creative Commons Attribution License (CC BY). The use, distribution or reproduction in other forums is permitted, provided the original author(s) and the copyright owner(s) are credited and that the original publication in this journal is cited, in accordance with accepted academic practice. No use, distribution or reproduction is permitted which does not comply with these terms.
*Correspondence: Yun Li, YXF1YXRpY3NAc3d1LmVkdS5jbg==
†These authors have contributed equally to this work
Disclaimer: All claims expressed in this article are solely those of the authors and do not necessarily represent those of their affiliated organizations, or those of the publisher, the editors and the reviewers. Any product that may be evaluated in this article or claim that may be made by its manufacturer is not guaranteed or endorsed by the publisher.
Research integrity at Frontiers
Learn more about the work of our research integrity team to safeguard the quality of each article we publish.