 Emma C. Underwood1*
 Quinn M. Sorenson1Charlie C. Schrader-Patton2Nicole A. Molinari3Hugh D. Safford1,4
- 1Department of Environmental Science and Policy, University of California, Davis, Davis, CA, United States
- 2RedCastle Resources, Inc., Contractor to: US Department of Agriculture Forest Service Western Wildlands Environmental Threat Assessment Center (WWETAC), Bend, OR, United States
- 3US Department of Agriculture Forest Service, Los Padres National Forest, Solvang, CA, United States
- 4Vibrant Planet, Incline Village, NV, United States
Mediterranean-climate region (MCR) shrublands have evolved a set of regeneration strategies in response to periodic, high intensity wildfires: obligate seeding (OS), obligate resprouting (OR), and facultative seeding (FS) species. In the North American MCR, data on their spatial and temporal variability is currently lacking, which is a significant information gap for resource managers. We developed a multinomial model using dynamic and static variables to predict the distribution of the three shrub post-fire regeneration strategies, plus trees and herbs, in southern California. Cross-validation showed 50% of the predicted values for each of the five plant groups were within 8–24 percent of the actual value. We assessed variation in shrub regeneration strategies in three ways. First, we found the three major shrub community types (mixed chaparral, chamise-redshank chaparral, and coastal sage scrub) had proportionally greater biomass of FS (37–43% of total biomass) than OR or OS. Second, we assessed the spatial variability using (a) moisture availability (climatic water deficit and solar radiation) and found FS accounted for an increasingly greater proportion of total aboveground live biomass as water became limited, while OR biomass decreased; and (b) ecosystem productivity (NDVI) which showed the proportion of OS, OR, and tree biomass increased with productivity (with a corresponding dramatic decrease in herb biomass). We also assessed temporal variability using time since fire and found OS represented an initially small proportion of total biomass immediately post-fire (8–10%) which increased with time since fire (13–17%). Third, spatial outputs from the multinomial model indicated FS dominated pixels were most widely distributed across the study area (~3.4 million ha, 71%), compared to OR and OS covering 5% each. FS also occurred more frequently on warmer, south facing slopes and summits whereas OR preferred cooler, north facing slopes and valleys (p < 0.0001). Better understanding the distribution of OS, OR, and FS shrubs is important for resource management, including quantifying shrubland carbon storage and identifying areas for post-fire restoration, as described in a case study of the Bobcat Fire on the Angeles National Forest.
Introduction
All of the world’s Mediterranean-climate regions (MCRs) are characterized by expansive evergreen, sclerophyllous shrublands known by a variety of regional names including fynbos in South Africa, kwongan in western Australia, and case chaparral in the North American MCR. These shrubland ecosystems are highly species diverse (Cowling et al., 1996; Rundel, 2018) and – except in Chile, where fire was largely absent before European settlement – they are also characterized by a set of shared regeneration strategies driven by adaptation to intense wildfire (Bond and Midgley, 2001; Bond and Midgley, 2003; Keeley et al., 2011; Clarke et al., 2015; Keeley and Safford, 2016). These regeneration strategies include fire-stimulated germination of soil-stored seeds, serotiny, and resprouts from apical, basal, epicormic, or underground structures (Clarke et al., 2013; Lawes et al., 2022).
In the ecological literature, shrub species exhibiting different combinations of these syndromes are typically placed in three groups (Keeley, 1991). “Obligate seeders” (OS) are shrub taxa that have lost the ability to resprout – which is a trait of most woody angiosperm taxa – but whose seed germination is stimulated by fire (this group technically includes serotinous taxa, which are not found in shrubs in the North American MCR but rather in some associated conifer tree taxa). “Obligate resprouters” (OR) are taxa that lack fire-stimulated seed germination and rely entirely on resprouting to regenerate after fire; the OR group includes taxa with and without specialized underground storage structures. A third group, “facultative seeders” (FS), is composed of taxa whose post-fire regeneration occurs via resprouting as well as via fire-stimulated seedling recruitment. The evolutionary relationships between these groups are incompletely understood. Resprouting post-fire is thought to be an ancestral trait across woody plants, with facultative seeding derived from resprouting species (Bond and Midgley, 2003; Pausas and Keeley, 2014). Non-resprouting obligate seeders are hypothesized to be subsequently derived from facultative seeders within lineages of resprouters experiencing reliably intense, but relatively infrequent, fires (Pausas and Keeley, 2014).
Spatial variation of different regeneration strategies is seen at multiple spatial scales. At a global scale, resprouting has a strong relationship with productivity (Pausas and Bradstock, 2007; Clarke et al., 2015). For example, in a study in Australia, Lawes et al. (2022) recorded an increase in resprouting ability with higher productivity (rainfall, primary productivity), albeit mediated by fire regimes. More productive environments provided ample resources for the provision and protection of resprouting organs and/or provide a selective force through relatively frequent disturbance by fires (Gosper et al., 2019). Alternatively, obligate seeding is strongly associated with aridity and vegetation prone to infrequent but intense crown fires – such as heath in Australia (Bellingham and Sparrow, 2000; Bond and Midgley, 2001; Bond and Midgley, 2003; Pausas and Keeley, 2014; Lawes et al., 2022). At a finer spatial resolution, within shrubland ecosystems in California, Meentemeyer et al. (2001) found shrub abundance at the landscape scale most strongly associated with annual soil moisture and solar radiation. OR species were found to have a higher abundance in mesic environments: their non-refractory seeds generally germinate during longer fire-free intervals on sheltered, north facing slopes with moist, cool, shaded soil conditions with ample litter (Gordon and White, 1994; Meentemeyer et al., 2001). In addition, OR seeds are short-lived, do not accumulate in the seedbank, and are sensitive to higher temperatures (Keeley, 1991). OR species develop deep, extensive root systems to avoid drought stress (Poole and Miller, 1975). In contrast, OS species have a higher abundance in xeric environments, with shallow roots which must survive summer water stress in the first year of growth. In southern Australia, for example, Clarke et al. (2015) found proportionally more obligate seeders in drier Mediterranean to semi-arid climates. The ability for OS to survive dry periods has been attributed to highly sclerophyllous leaves, cryptic stomata, and the resistance of stem xylem to water stress-induced embolism (Davis et al., 1999; Meentemeyer and Moody, 2002; Jacobson et al., 2007).
In turn, different regeneration strategies, and their relative proportions, confer different levels of shrub environmental fitness, influencing the resilience of ecosystems to disturbance from fire (Bellingham and Sparrow, 2000; Bond and Midgley, 2003). In post-fire environments with suitable moisture conditions, OR shrubs can respond with vigorous and aggressive resprouting from surviving biomass (often belowground). For example, in the California MCR, OR quickly refill the space previously occupied by the mature plant and can reach reproductive maturity sooner than OS and even FS species (which do not resprout as vigorously as OR under good site conditions), demonstrating little demographic change post-fire (Keeley, 1986). This post-fire advantage has been attributed to deep roots, high root-to-shoot ratios, and high nutrient stores in the root and root crown (Desouza et al., 1986), which allows for rapid recovery and resprouting of OR post-fire. Recovery of FS and OS from seed is typically delayed until the rainy season when germination is triggered. OS recruitment is largely restricted to the first-year post-fire which produces an even-aged cohort that suffers extreme mortality after fire (Keeley, 1986). Seedlings of OS establish more successfully post-fire than seedlings of FS as OS have greater tolerance to water stress (Keeley and Zedler, 1978; Jacobson et al., 2007) and because FS species also resprout, making them more successful post-fire regenerators under most conditions. Note that for OS species, the longer time to maturity and slow accumulation of seed in the seed bank presents an immaturity risk in instances of short fire intervals (Zedler, 1995; Enright et al., 1998).
Consequently, excessive short interval, frequent fire in California has a major influence on shrubland dynamics and on the distribution of regeneration strategies (Syphard et al., 2018; Safford et al., 2022). Southern California experiences very high ignition densities associated with expanding human development and increasing cover of highly flammable invasive grasses. Short interval fires (specifically time since last fire) can have major impacts on the reproductive ability and regeneration potential of shrubs. For example, most post-fire obligate seeding Ceanothus species are negatively impacted by time since last fire of <10 years, while obligate seeding Arctostaphylos species require much longer fire return intervals (Keeley and Davis, 2007). These negative impacts of short interval, high frequency fire on OS species are multiplied as subsequent fires occur, and the seed pool is progressively reduced, with consequences for population growth and genetic variability of OS (Zedler et al., 1983; Clarke et al., 2015). Very high fire frequencies can lead to local extirpation of OS species, resulting in the increased dominance of (often non-native) grasses and forbs, which then feeds back into even more frequent fire (Franklin, 2002; Syphard et al., 2018).
Understanding spatial and temporal variation in the distribution of OR, OS, and FS species will allow resource managers to better predict vegetation response and prioritize management activities that aid the recovery from ecosystem disturbances and stressors, such as short interval fire and drought. This is especially valuable in southern California, where shrublands account for more than half of the vegetation of four federally-managed National Forests and where resource managers are actively engaged in managing wildfires, addressing non-native annual species, planning for a warmer and drier climate, and attempting to maximize and balance a variety of ecosystem services (Safford et al., 2018; USFS, 2022). In addition, an improved understanding of the spatial variation in shrub regeneration strategies can support the quantification of belowground, standing dead, and litter carbon pools in shrublands whose carbon storage and sequestration capacities have traditionally been ignored or undervalued (Langley et al., 2002; Jenerette et al., 2018; Underwood et al., 2018).
In this study, we describe the development of a multinomial model to predict the relative biomass proportions of five plant groups – three shrub regeneration types (OR, OS, and FS), and herb and tree life forms – across the southern California ecoregion. Previous attempts to determine the distribution of species with different regeneration strategies have relied on temperature, annual precipitation, solar radiation, slope, topographic moisture index and soil type (Syphard and Franklin, 2010), or soil moisture and substrate rockiness (Meentemeyer et al., 2001). Here, we build on previous efforts by increasing the number of environmental variables to consider both static and dynamic predictors, using field plots with high spatial accuracy to train our model, and generating data over a larger spatial area.
Using the results from our model, in this contribution we: (a) describe variation in the proportions of OS, FS, OR, herb and tree by three shrub community types (mixed chaparral, chamise redshank chaparral and coastal sage scrub); (b) assess the influence of two moisture – related variables (climatic water deficit and solar radiation), productivity (NDVI) and temporal variation in time since last fire; (c) quantify spatial variation in regeneration strategies at the landscape scale; and finally (d) to highlight the implications of our results for resource managers, we provide a case study of the Bobcat Fire on the Angeles National Forest describing the use of OS data to support decision making.
Materials and methods
Study area
Our study area consists of shrublands within a 31,069 km2 (7,677,317 acres) footprint that encompasses all Level 4 USGS ecoregions (Omernik and Griffith, 2014) that overlap with the Angeles, Cleveland, Los Padres, and San Bernardino National Forests in southern California, USA, ranging from sea level to 3,506 m. National forest lands account for over 50% of the study area (15,920 km2 or 3,933,992 ac). The region is characterized by a Mediterranean-type climate with a warm to hot dry season and a cool wet season of three to five months. Vegetation physiognomic types in the study region are dominated by shrubland [62% (determined using FVEG; FRAP, 2015)], grassland (16%), broadleaf woodland (8%), and conifer and mixed conifer-broadleaf forests (8%). We base our vegetation type delineations on the California Wildlife Habitat Relations classification (Barbour et al., 2007; https://wildlife.ca.gov/Data/CWHR/Wildlife-Habitats), which is widely used in California. In shrublands the major communities are mixed chaparral (29%; dominated by scrub oak [Quercus berberidifolia], various species of Ceanothus and manzanita [Arctostaphylos], and other mostly resprouting shrub species); sage scrub (12%; dominated by California sagebrush [Artemisia californica], purple sage [Salvia leucophylla], black sage [Salvia mellifera], and California buckwheat [Eriogonum fasiculatum]); and chamise/redshank chaparral (6%; dominated by chamise [Adenostoma fasciculatum] and/or redshank [Adenostoma sparsifolium]). The chaparral-dominated communities (evergreen, sclerophyllous shrubs), are found at higher elevations while coastal sage scrub (drought-deciduous, soft-leaved shrubs) are found at lower elevations and inland desert margins with lower precipitation and shorter growing seasons (Gray, 1982).
Plot data
To estimate the proportion of biomass for shrubs with different regeneration strategies we used plot data from the USDA Forest Service Forest Inventory and Analysis (FIA) program (Burkman, 2005). We analyzed 222 of the 434 total FIA plots available omitting 212 owing to incomplete data, occurrence within uncommon vegetation types (defined as <1% of the study area, FRAP, 2015), or insufficient sample size (i.e., where there were <10 plots in a vegetation type). Many of these less common vegetation types were dominated by trees with limited shrub abundance, e.g., CWHR types blue-oak foothill pine, Eastside pine, Ponderosa Pine, valley foothill riparian, redwood, sierra mixed conifer, and coastal oak woodland. We also removed any plot that had more than 90% of total biomass comprised of trees to avoid the possibility of including plots that were misclassified as shrublands. One note, is the FIA program is designed to measure forest conditions across the US and therefore does not typically include non-forest plots, but the National Forests in southern California extended the FIA sampling to include shrubland plots. Since coastal and desert scrub communities are not well represented on Forest Service lands in southern California, OS present in these communities may be underrepresented in the plots.
FIA plots are comprised of four, 14.64-m diameter circular subplots arranged triangularly with one subplot at plot center and 3 subplots positioned 36.6 m from plot center at angles of 0°, 120° and 240° (Burkman, 2005). FIA permanent plots are remeasured periodically with the goal of a complete remeasurement of all plots every ten years (https://frap.fire.ca.gov/research-monitoring/forest-inventory-and-analysis/), thus 10% of the plots are visited each year. The plots used in this study were visited in 2001, 2002, 2004, 2008, 2010 or 2012. Plot measurements included species, crown diameter, and height of all individual shrubs in each subplot. To estimate shrub aboveground biomass, we applied species-specific allometric equations to shrub species where possible (Wakimoto, 1978; McGinnis et al., 2010), otherwise, we used a generalized shrub-herb biomass equation (Lutes et al., 2006, see Schrader-Patton and Underwood, 2021 for details).
We assigned each species in the FIA plot to one of three lifeform categories: shrub, tree or herb (forbs and grasses). Shrub species (the focus of this current study) were further categorized into one of three post-fire regeneration strategies: obligate seeder (OS), facultative seeder (FS), or obligate resprouter (OR) using descriptions of regeneration strategy and life history reported in primary literature and public databases (Gordon and White, 1994; Borchert et al., 2004; CNPS, 2021; FEIS, 2021). For each plot, we calculated the proportion of aboveground live biomass for each of these five plant groups: OS, FS, OR, tree, and herb, by dividing the estimated biomass of each by the summed total biomass across all groups.
Predicting the distribution and variation of shrub regeneration strategies
To predict the distribution of the three shrub regeneration strategies (OS, FS, OR), along with trees and herbs, we modeled changes in the proportion of biomass within each regeneration strategy using a multinomial regression model in the statistical software R (R Core Team, 2016) with the package ‘nnet’ (Ripley and Venables, 2021).
We analyzed the following variables using the function multinom to predict the distribution of the five plant groups: average annual solar radiation, actual evapotranspiration (AET), climate water deficit (CWD), average annual precipitation, the normalized difference vegetation index (NDVI, using the maximum composite value from July to August each year), modeled aboveground biomass (a proxy for productivity), eastness (a measure of continentality and dryness), slope, flow accumulation, soil bulk density, soil clay content, and soil percent carbon (see Table S1). Finally, we included vegetation type from the CWHR classification system from the FVEG vegetation data (FRAP, 2015) and time since last fire from the Fire Return Interval Departure geodatabase (Safford and Van de Water, 2014; USDA, 2015). We selected time since last fire rather than, for example, average fire return interval, as we wanted to account for the transition from early seral fire-following species to the dominance of other regeneration strategies over time. The time since last fire temporal variable was calculated for each plot by first intersecting the plot with the fire perimeter data obtained (https://frap.fire.ca.gov/frap-projects/fire-perimeters/). Next, we subtracted the year of the most recent fire from the year the FIA plot was visited.
To avoid variance inflation, we did not include variables that were strongly correlated (r > 0.55). We considered the predictor variables northness and elevation but excluded them because they were closely correlated (r > 0.57) with other variables (solar radiation, AET, and CWD). We retained solar radiation, AET, and CWD because they are more mechanistically linked to water stress and productivity (Stephenson, 1998). Total aboveground biomass, flow accumulation, time since fire were natural-log transformed to improve model fit. To reduce the number of parameters included, we only tested interactions that were biologically meaningful, such as an interaction between CWD and solar radiation.
To select the best model, we started with a full model and removed predictors sequentially using Akaike Information Criteria (AIC) to evaluate model fit. Predictor variables remained in the final model if they improved model fit by a minimum ΔAIC of –2 (Anderson and Burnham, 2004). For the final model, p-values were generated with a Wald-z test. Obligate seeder shrubs were selected as the baseline variable for the multinomial model against which the other four plant groups are calculated (therefore OS are not displayed in Results). We chose OS as a baseline because our focus was on determining differences among different shrub regeneration strategies and we expected OS to differ most from FS and OR. The p-values reported (Table 1) for FS, OR, tree and herb indicate how likely the estimate is different from 0, i.e., relative to OS. To evaluate the performance of the final model, we performed leave-k-out cross validation with k = 8 (Hastie et al., 2009, see code in Supplementary Material). To do this, we randomly withheld eight observations from the dataset, refit the model, and evaluated the difference between predicted and observed values of the excluded observations. This procedure was iterated 3,000 times to generate a distribution of model accuracy. To fully evaluate the predictive accuracy and fit of the model, we examined the distribution of cross-validation errors: mean, standard deviation, kurtosis, skew, and interquartile range.
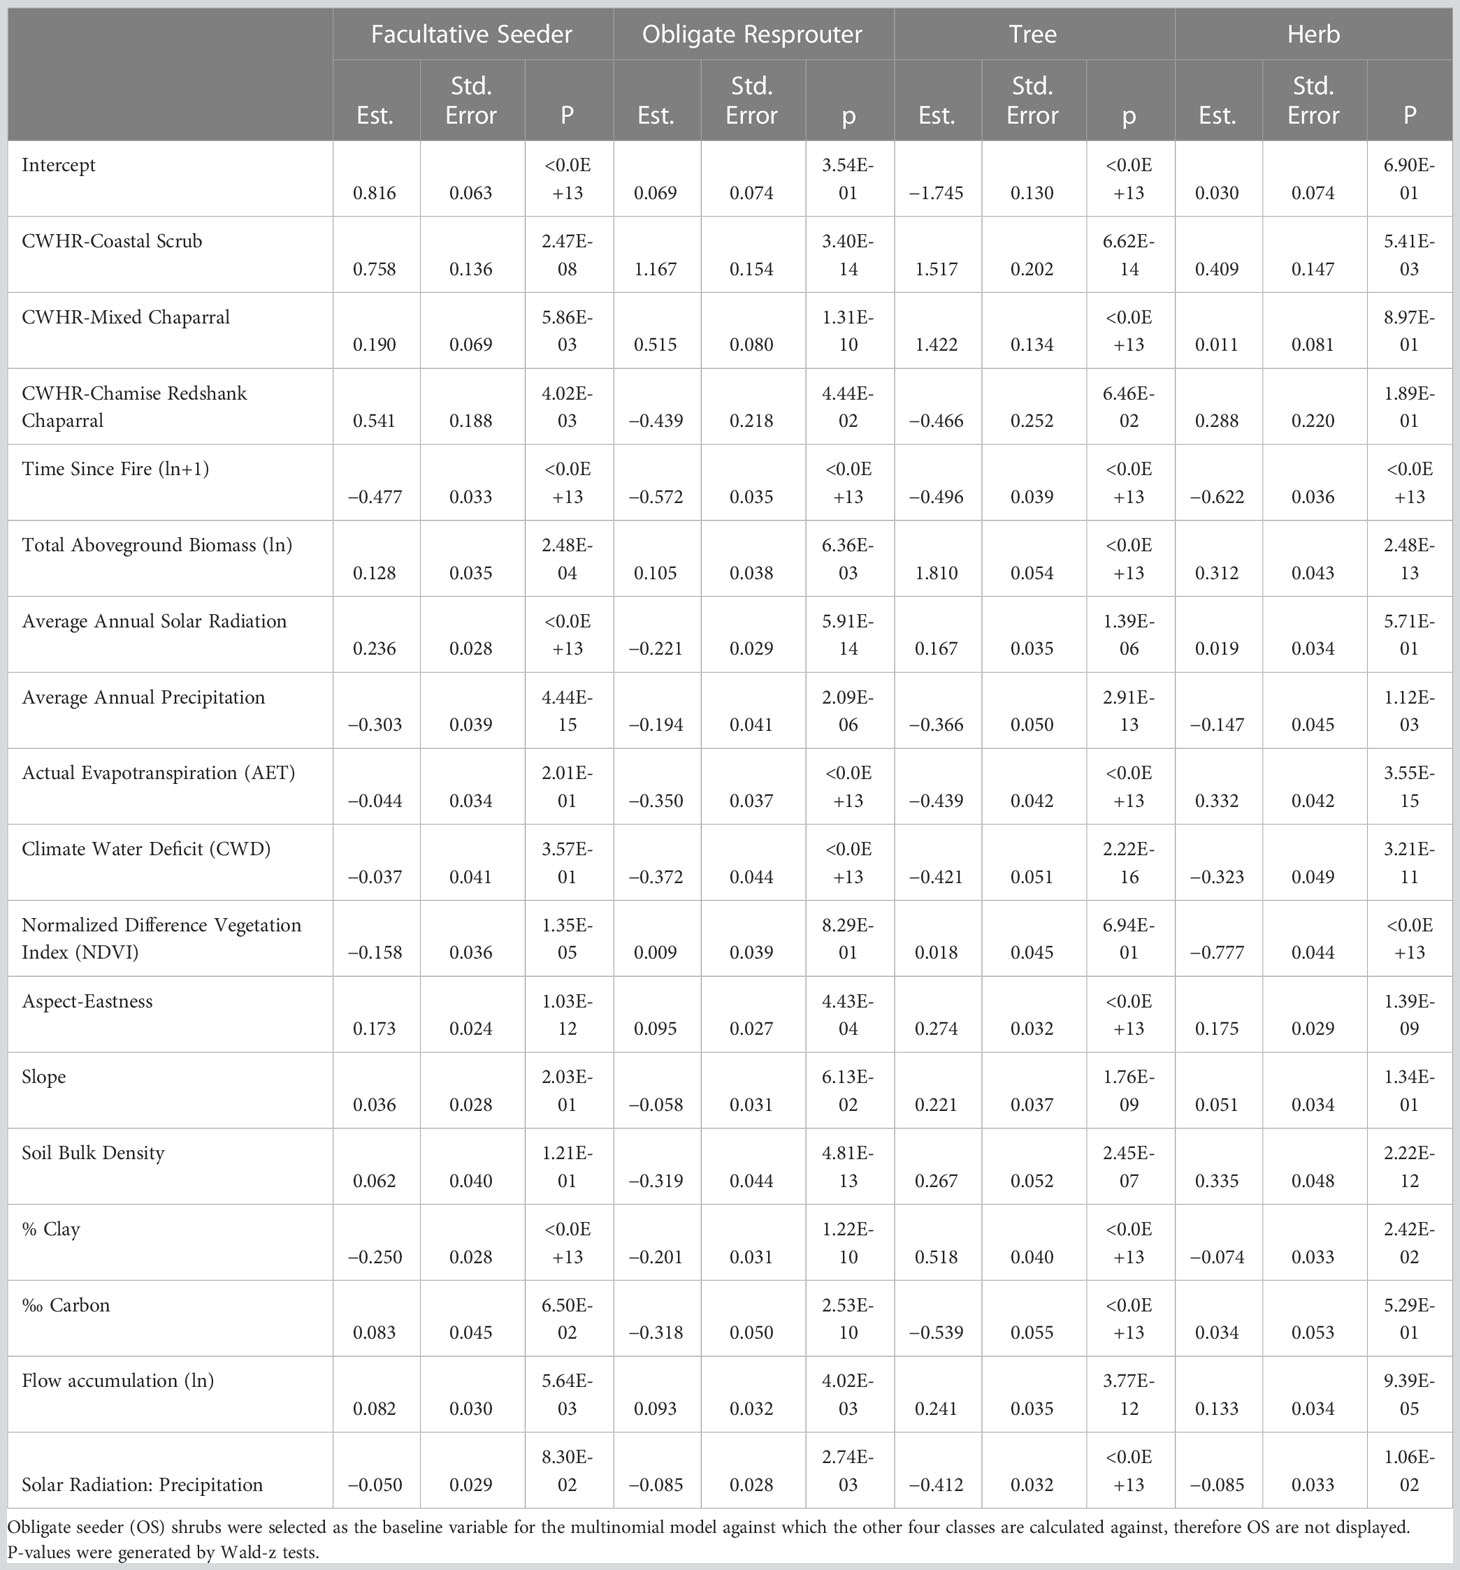
Table 1 Model estimates (log-odds) from the final multinomial model and standard error.
We then used the raster surfaces corresponding to each predictor (Table S1) as model inputs into the ‘predict’ function in R software (R Core Team, 2016). We created a raster spatial layer (30 m resolution) with the proportion of biomass for each of the five plant groups. This process essentially applies the model predictions of the proportion of each plant group to each pixel in our study area. Finally, to investigate distribution patterns of the three types of shrub regeneration strategies across southern California, we created three raster outputs based on a query of: shrub proportion in a pixel is >33% and where OS or FS or OR is >33%, to identify pixels dominated by shrubs with different regeneration strategies.
Using these data, we report on variation in shrub regeneration strategies by the following three areas: first, we assessed variation in the five groups across the three major CWHR shrub communities in southern California: mixed chaparral, chamise redshank chaparral, and coastal sage scrub (https://wildlife.ca.gov/Data/CWHR/Wildlife-Habitats), by estimating the proportion of OR, OS, FS, trees, and herbs as predicted from the model while holding all other variables at their median value. Second, to examine influence of water availability and time in explaining the variation of shrub regeneration types across the landscape, we calculated the proportion of biomass in the five groups in response to two moisture-related variables (climatic water deficit and solar radiation) and productivity (NDVI), and time since last fire. Third, we summarized the distribution of shrub regeneration types at the landscape scale. We tested for differences in the mean proportion of shrub reproductive strategy using a linear regression (using lm function in the ‘stats’ package in R, R Core Team, 2016) to assess differences in the dominance of OR and OS between warmer, south facing slopes, summits and ridges, and cooler, north facing slopes, valleys and depressions by calculating the mean average value of OS, FS, and OR by topographic facet (vegetation x aspect x topographic units; Hollander and Underwood, 2021). Model performance assumptions were checked for residual normality and homoscedasticity, and P-values were corrected using the Tukey method.
Results
The final selected model for determining the biomass of the five plant groups included vegetation type, time since fire), estimated aboveground live biomass, NDVI, slope, eastness, AET, CWD, flow accumulation, soil bulk density, percent clay, carbon (grams per kg of fine earth soil), and the interaction between mean annual solar radiation and mean annual precipitation (Figure S1; Tables 1, 2). Cross validation indicated that the model can predict the relative proportion of biomass represented by each of the five plant groups (OS, FS, OR, tree and herb) with 50% of predictions falling within 5 to 24 percent of the actual value depending on the type of regeneration strategy, as shown by the interquartile ranges (Table 3). Of the shrub regeneration strategies, OS are best predicted, with the narrowest interquartile range of −4.98–11.42%, while FS and OR showed a broader range of prediction with interquartile ranges of −19.7–23.3%, and −14.8–16.5% respectively. Trees and herbs had more narrow ranges of predictability with interquartile ranges of 0.50–4.83% and −4.11–10.1%, respectively (Table 3; Figure 1). All five plant groups had a high level of accuracy, with the error distribution closely centered around 0 (−0.57 to 1.24, Table 3).
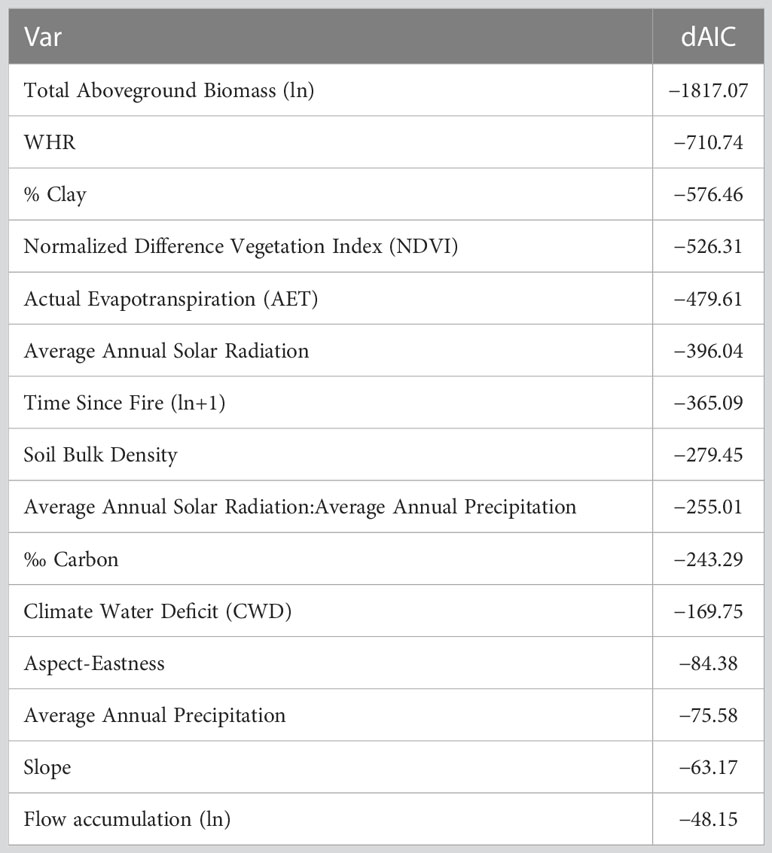
Table 2 Change in Akaike Information Criteria for each parameter when each was removed from the biomass model.
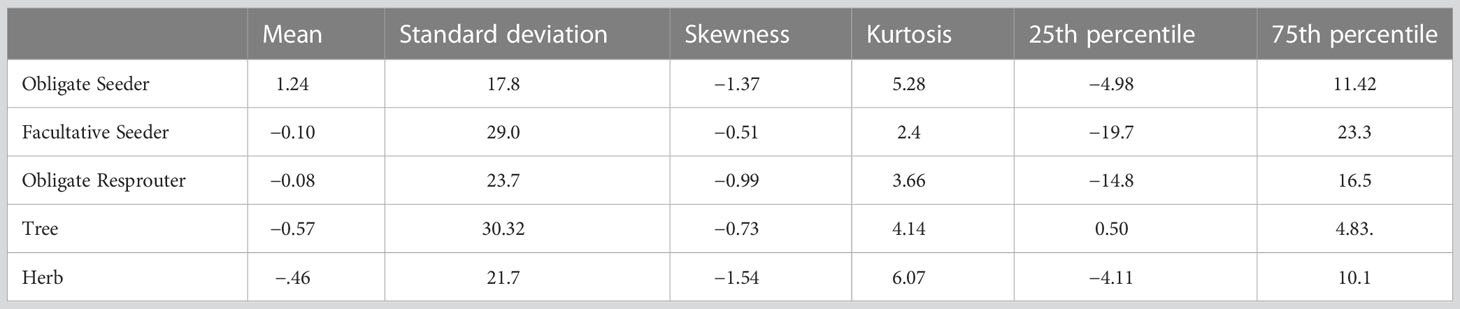
Table 3 Summary of cross validation distributions: mean, standard deviation, 25th percentile, 75th percentile.

Figure 1 Cross validation distribution of model accuracy. Each histogram represents the observed minus the predicted value for eight randomly selected plots iterated 3,000 times.
Variation of the five plant groups within three shrub communities
We found FS biomass dominated in the three shrub communities – mixed chaparral, chamise redshank chaparral, and coastal sage scrub – accounting for 37%, 41% and 43% respectively of the total biomass (Figure 2). There was slightly more OS than OR biomass (20% versus 16%) in chamise redshank chaparral, and slightly more OR than OS biomass (20% versus 15%) in mixed chaparral. However, OR biomass was proportionally greater (25%) than OS (10%) in coastal sage scrub. Among vegetation types, model outputs indicated tree biomass is greatest in mixed chaparral (13%) and herb biomass greatest in chamise redshank chaparral (18%, Figure 2) compared to the other two shrub communities.
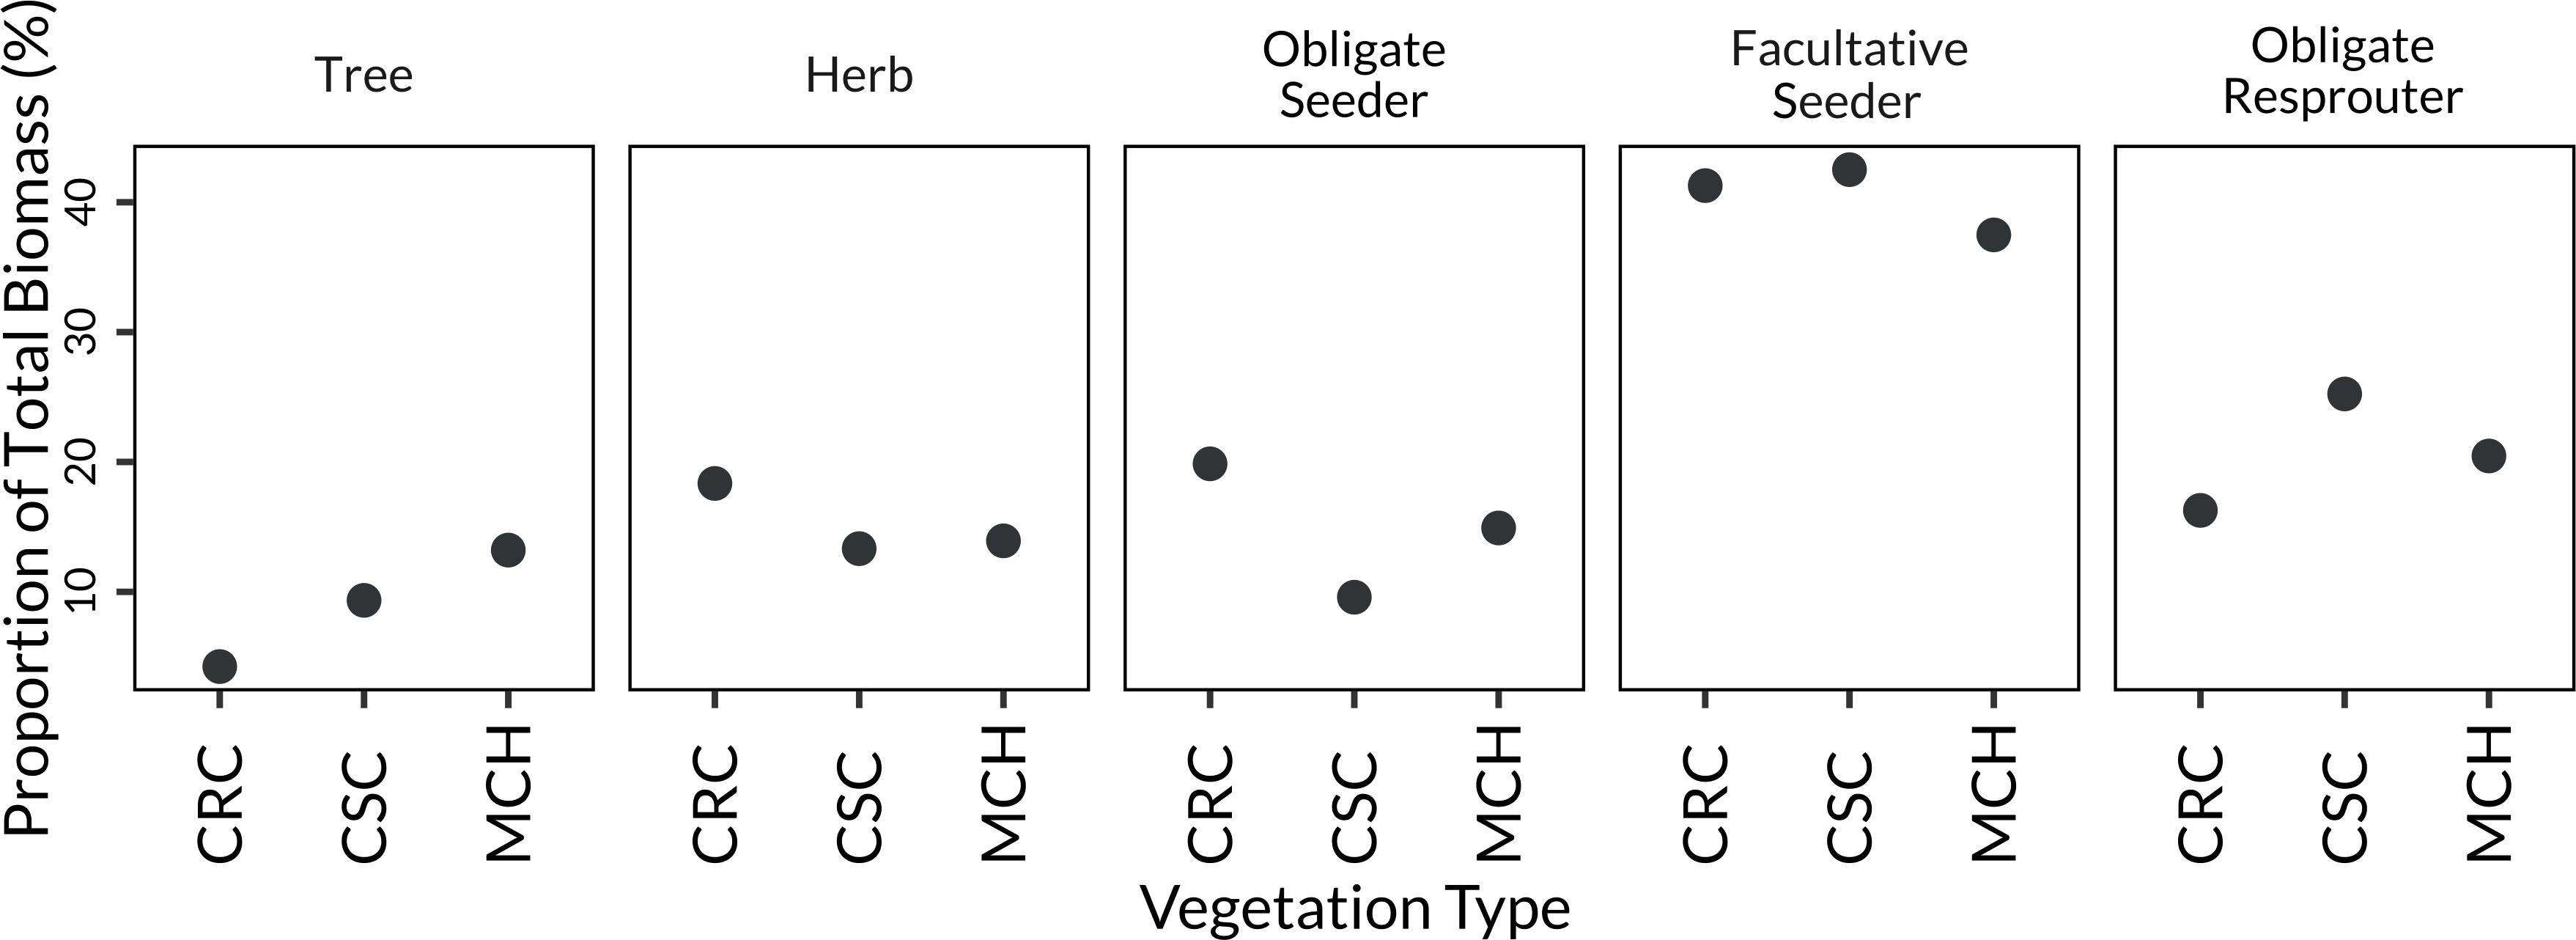
Figure 2 Estimated proportion of biomass by different life history types as predicted from the model of life history types within the three major shrubland vegetation types: MCH = mixed chaparral, CRC = chamise redshank chaparral; and CSC = coastal sage scrub. Note, all other variables in model are held at their median value.
Influence of time since fire, water availability, and productivity on the proportion of each shrub regeneration strategy
The influence of time since fire across all shrub communities was most notable for OS species. OS represent a small fraction of biomass immediately after fire, but this increased steeply (from an average of 5% to an average of 18%) in the first 25 years post-fire, and then more gradually as time since fire increased (Figure 3A). A closer examination of the first 25 years post-fire shows the relative proportions of OS, FS and OR is similar in the first two decades post-fire [with the exception of OS biomass in chamise redshank chaparral, which increased more rapidly than OS in mixed chaparral or coastal sage scrub (Figure S2)]. All other groups decreased slightly to account for the increase in OS biomass, and OR and herb decreased most sharply during the first decade post-fire. The proportion of FS biomass on the landscape dominated all time points following fire compared to the other plant groups and stayed relatively constant over time, accounting for 35%–38% of the total biomass.
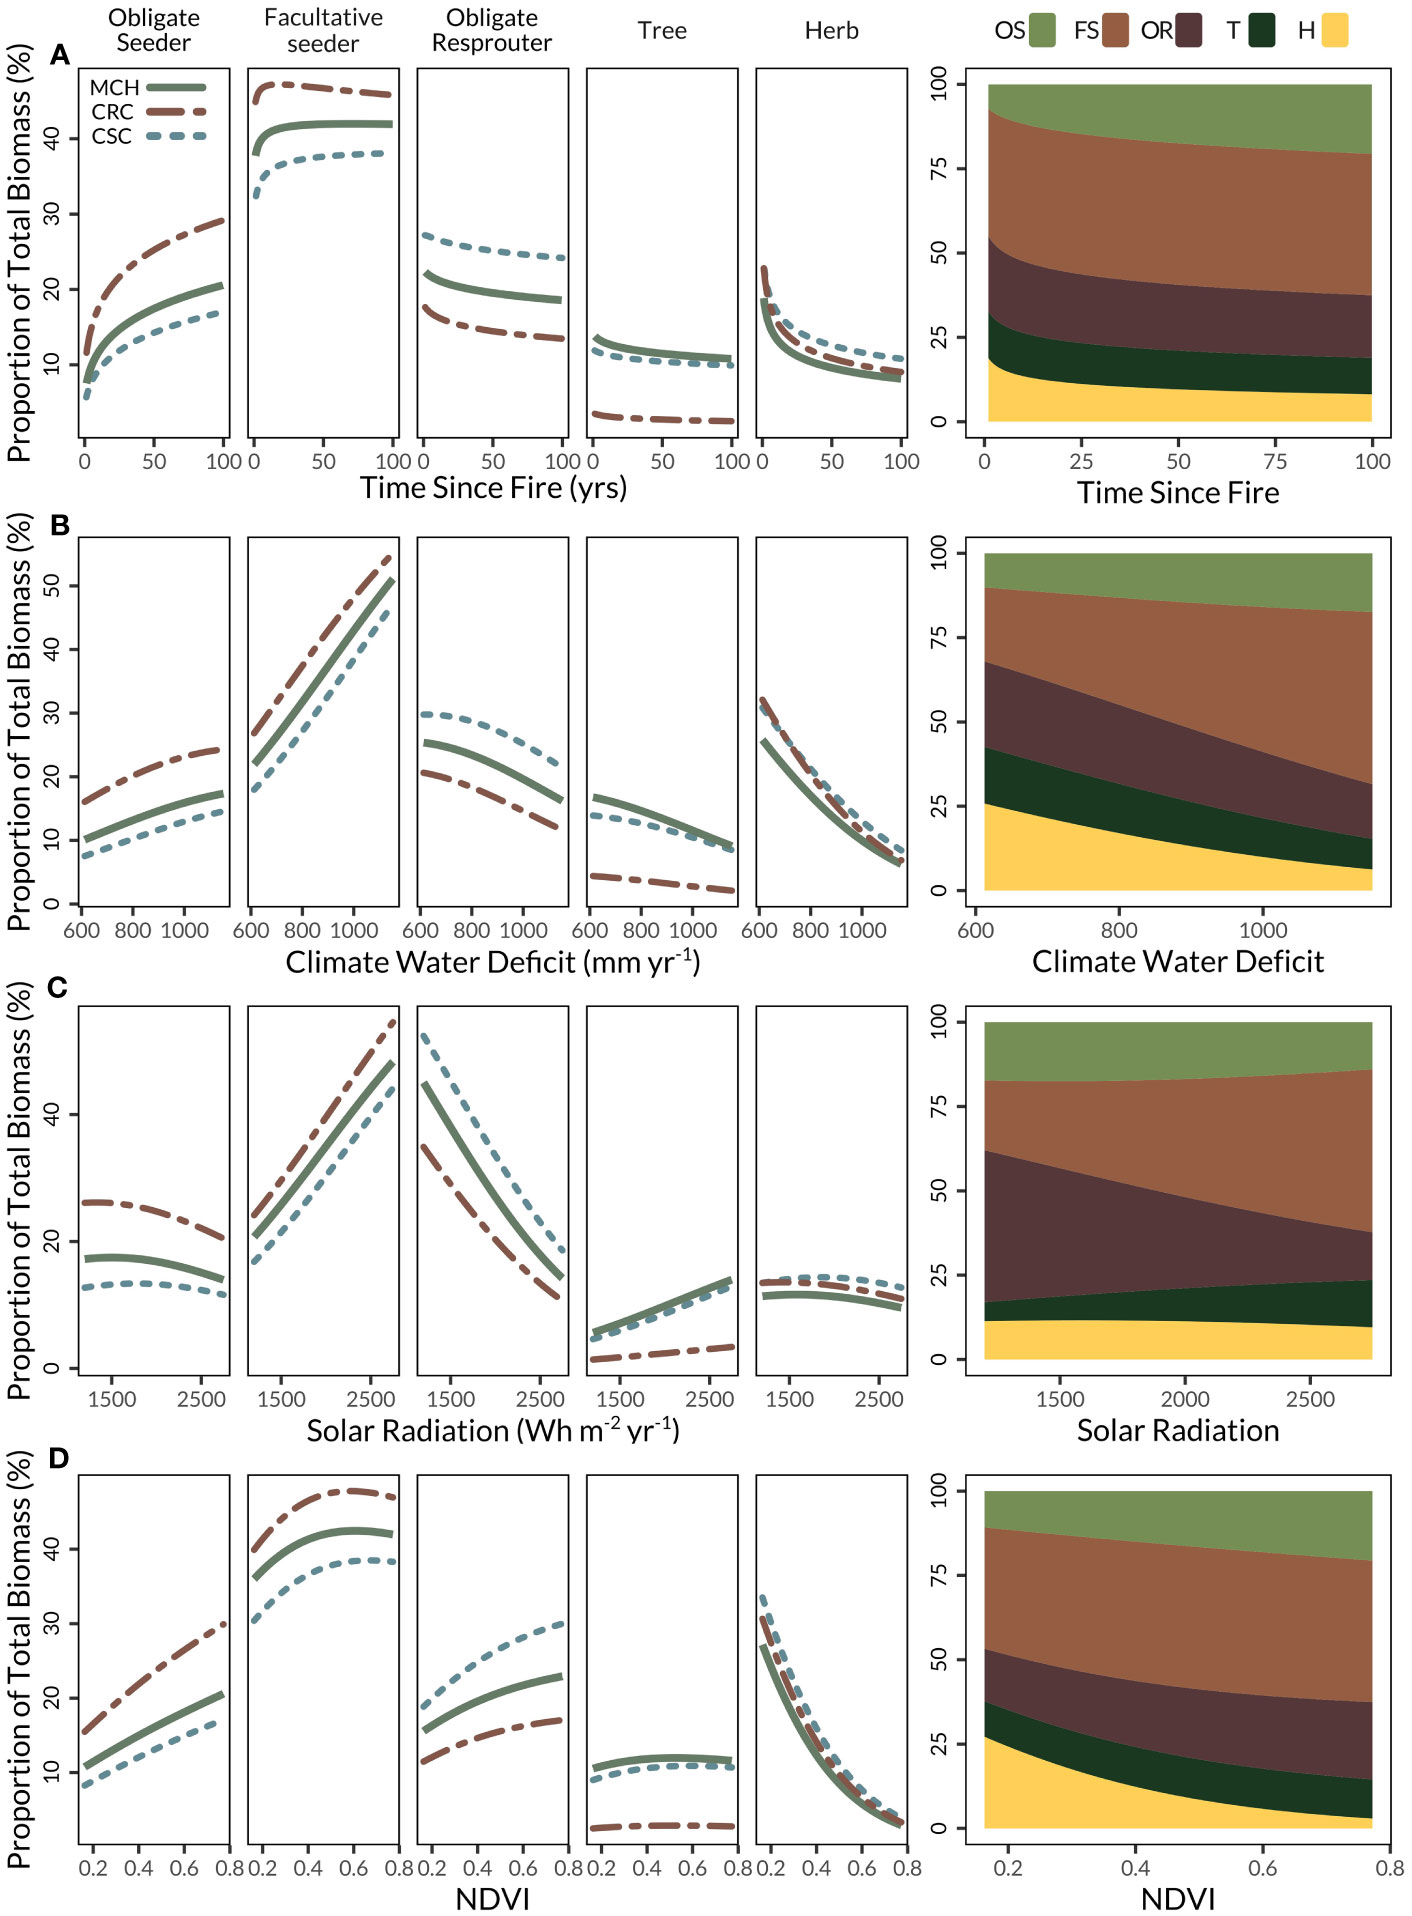
Figure 3 Proportion of biomass by life history type in response to differences in (A) time since fire, (B) climatic water deficit, (C) solar radiation, (D) normalized difference vegetation index (NDVI). Proportions are generated from marginal effects for each variable with all other variables in the model held at median values. Right panel displays the proportions of life history types from the most common vegetation type represented in FIA plots: mixed chaparral.
We found a similar response of shrub regeneration strategies to two indicators of water availability, CWD and solar radiation. As CWD increased (less available water), FS and OS accounted for an increasingly greater proportion of the total biomass (Figure 3B), with the inverse pattern in OR. Similarly, across the gradient of solar radiation values, FS increased from around 25% to 40% as solar radiation increased while OR decreased at a similar rate (Figure 3C). However, unlike with increasing CWD, an increase in solar radiation does not impact the proportion of OS biomass, which remained relatively constant at 15–18% of the total biomass. Results showed tree biomass decreased with increasing CWD as conditions became drier, but increased at higher levels of solar radiation. Herb biomass decreased slightly as both CWD and solar radiation increased.
There was a notable interaction between solar radiation and average annual precipitation, most influentially for tree biomass. At higher precipitation, the proportion of tree biomass did not differ with solar radiation. In contrast, at lower precipitation, the proportion of tree biomass strongly increased with solar radiation (Figure S1). For this reason, we focused on the effect of solar radiation in general at a median value of precipitation (Figure 3C). Across all levels of precipitation, as solar radiation increased, the proportion of OR biomass strongly declined, while the proportion of FS biomass strongly increased. Trees increased slightly with higher solar radiation, but the proportions of OS and herbs were unaffected.
The proportion of biomass contributed by OS and OR shrub species increased with productivity, as captured by NDVI, while FS biomass increased and then plateaued at higher NDVI. Herb biomass declined dramatically with increasing NDVI, from 38% to 2% (likely owing to the closing shrub canopy, Figure 3D), while trees remained relatively stable across NDVI values.
Variation in shrub regeneration strategies at the landscape scale
Analyzing the spatial rasters depicting OS-, OR- or FS- dominated pixels, we found dramatically different spatial patterns between the three shrub regeneration strategies. FS species covered the greatest spatial distribution, accounting for 3,372,125 ha (71%) of shrub dominated pixels in the study area (Figure 4): the FS group covered a range of productivity gradients and vegetation types (reflecting findings in Figure 3D), although it was notably absent from high elevation areas. In contrast, OS-dominated pixels covered the smallest spatial area (21,899 ha, 5% of shrub dominated pixels) occurring throughout the study area from coastal Big Sur and the Santa Ynez Mountains on the Los Padres National Forest to interior locations including the eastern fringes of the San Jacinto mountains (desert shrub vegetation) in the south (Figure 4, see case study in Supplementary Materials). Finally, pixels dominated by OR species covered 25,075 ha (5% of shrub dominated pixels in the study area), showing aggregations in the San Bernardino and San Gorgonio Mountains on the San Bernardino National Forest; San Gabriel Mountains on the Angeles National Forest, and throughout higher elevations on the Los Padres National Forest. OR-dominated pixels were notably absent in lower elevation areas with low water availability, as indicated in the relationship with CWD and solar radiation (Figures 3B, C).
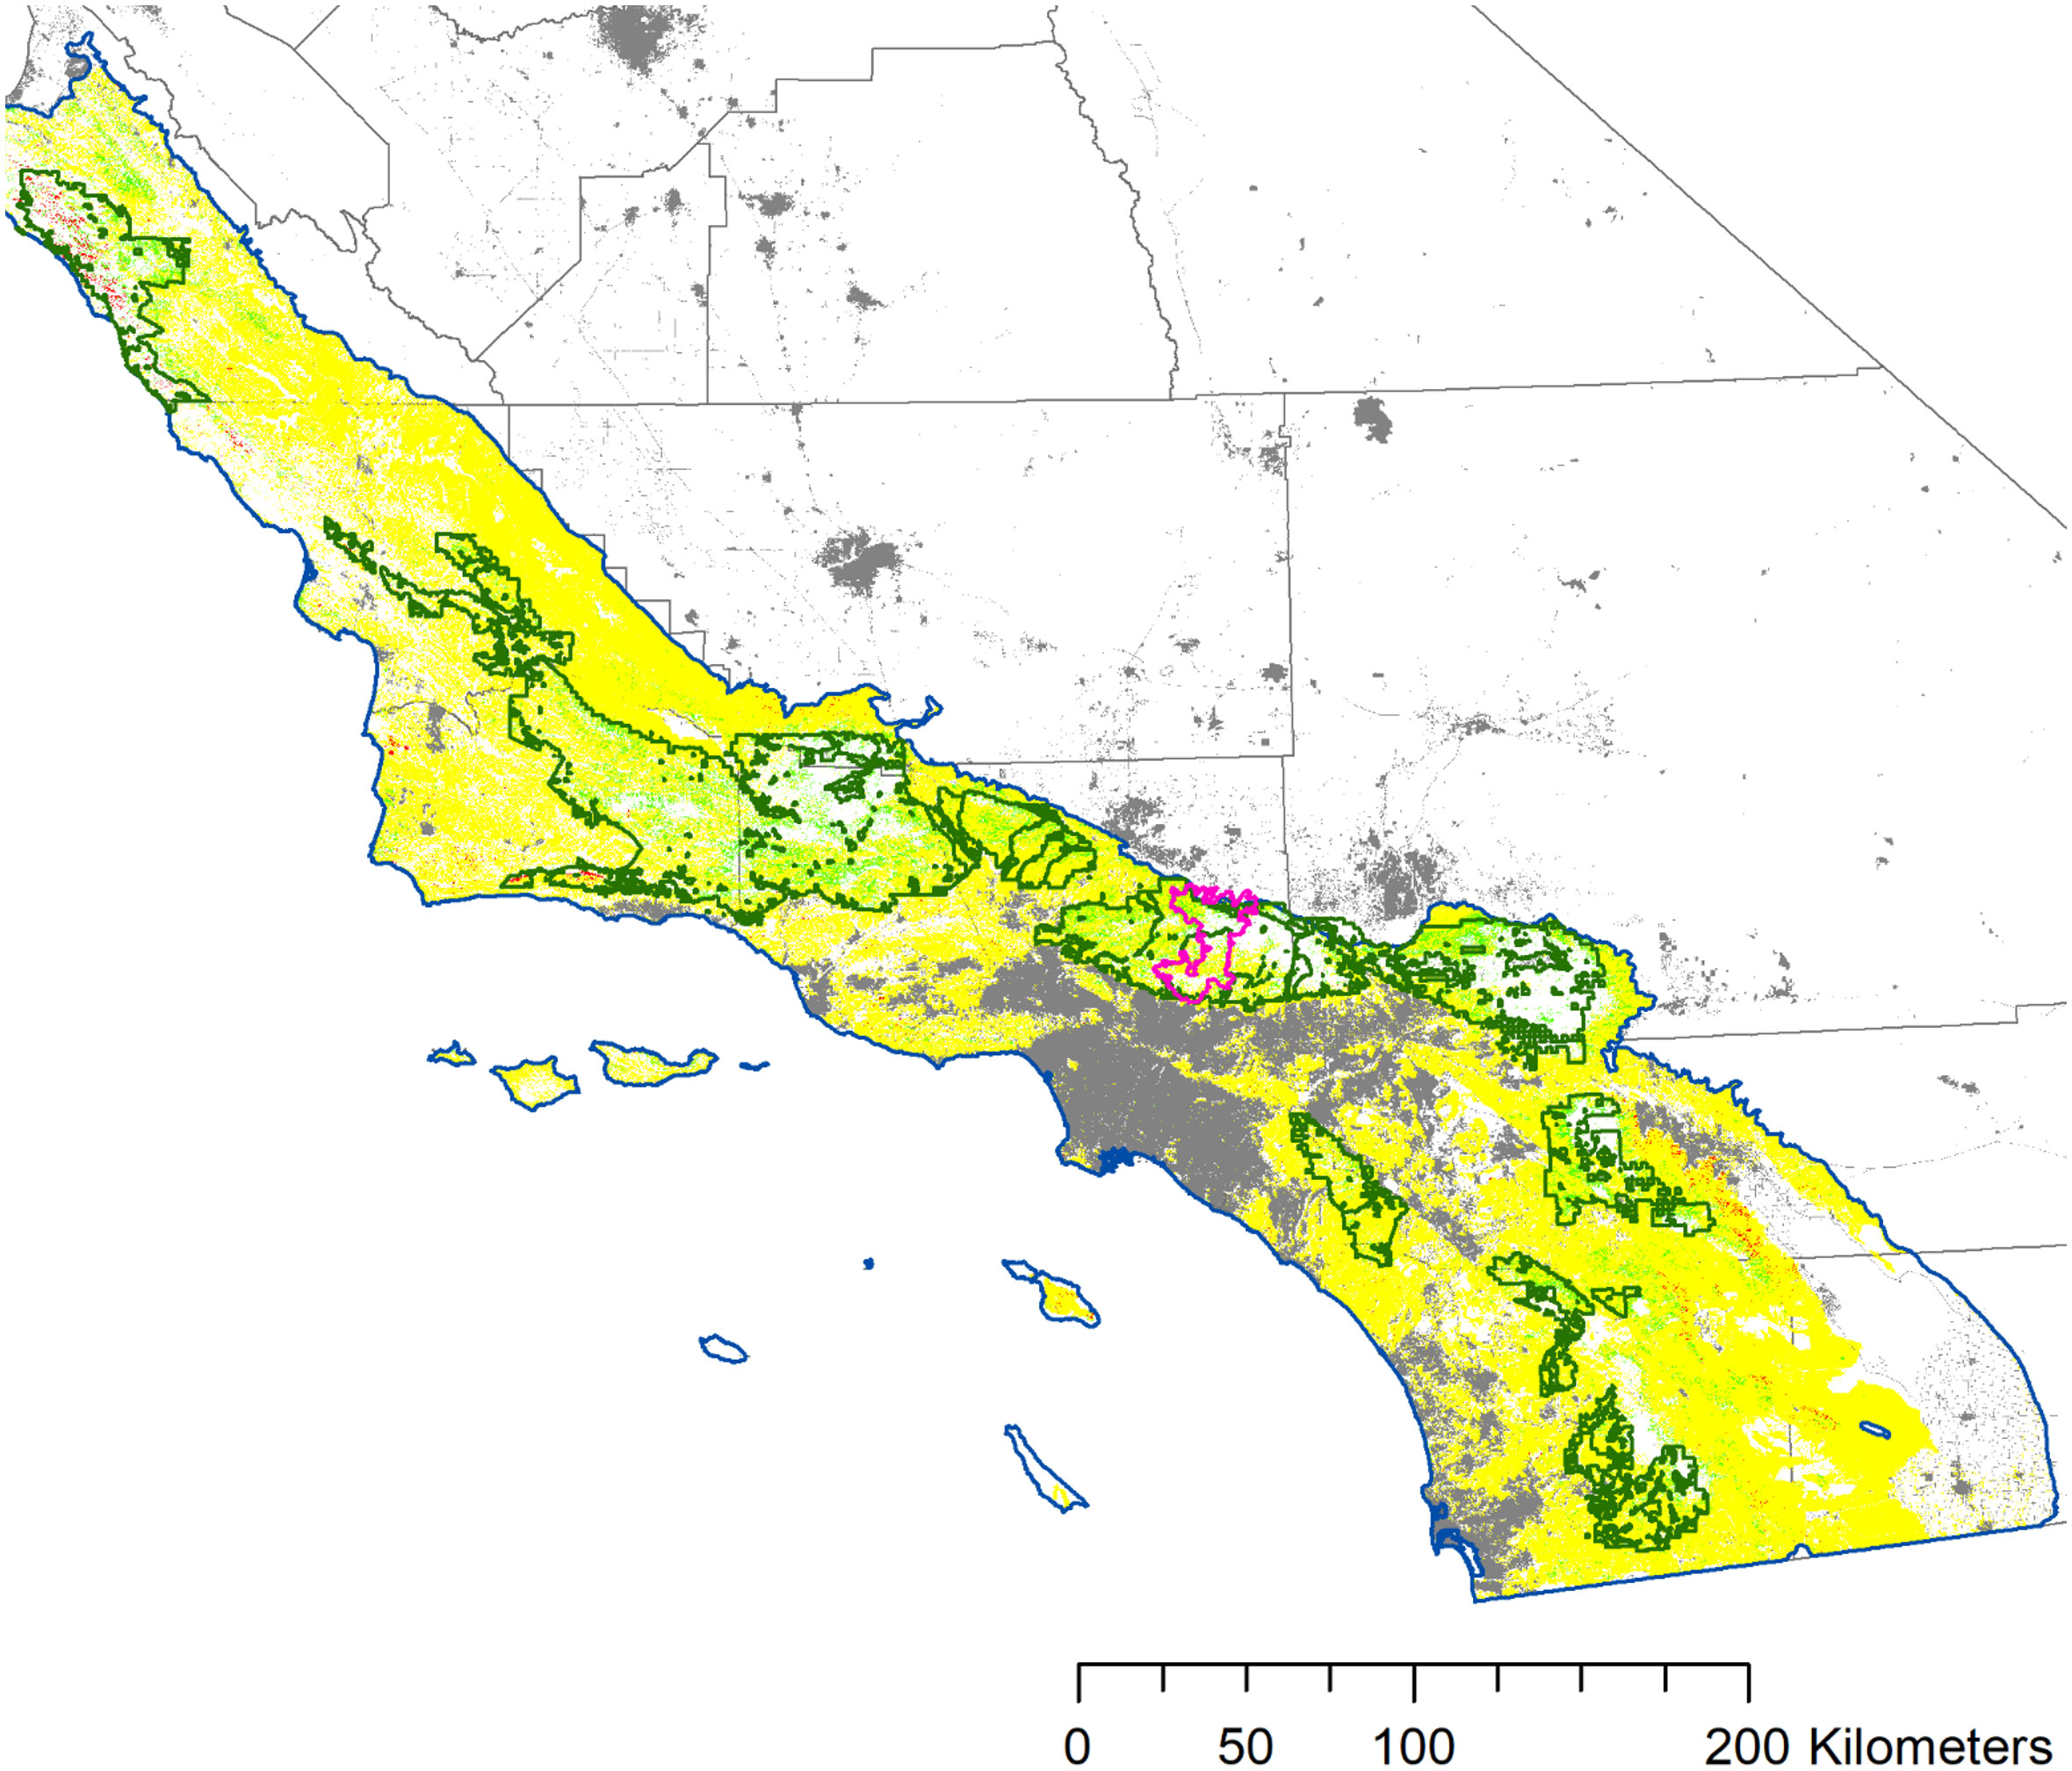
Figure 4 Maps depicting the proportion of shrub regeneration strategies: obligate seeders (OS), facultative seeders (FS), and obligate resprouters (OR). ANF = Angeles National Forest, CNF = Cleveland National Forest, LPNF = Los Padres National Forest, SBNF = San Bernardino National Forest. Inset map shows study area in the grey.
More specifically, using the mean proportion of each of the shrub groups on each of 12 topographic facets (Hollander and Underwood, 2021), we found FS showed statistically significant higher mean biomass proportions on south facing slopes, summits, and ridges and lower biomass proportions on north facing slopes, valleys and depressions across all three shrub community types (p < 0.0001, Figure 5; Tables S2, S3). In contrast, OR had a higher mean value in cooler topographic facets (i.e., north facing slopes, valleys and depressions) versus warmer facets Figure 5; Tables S2, S3).
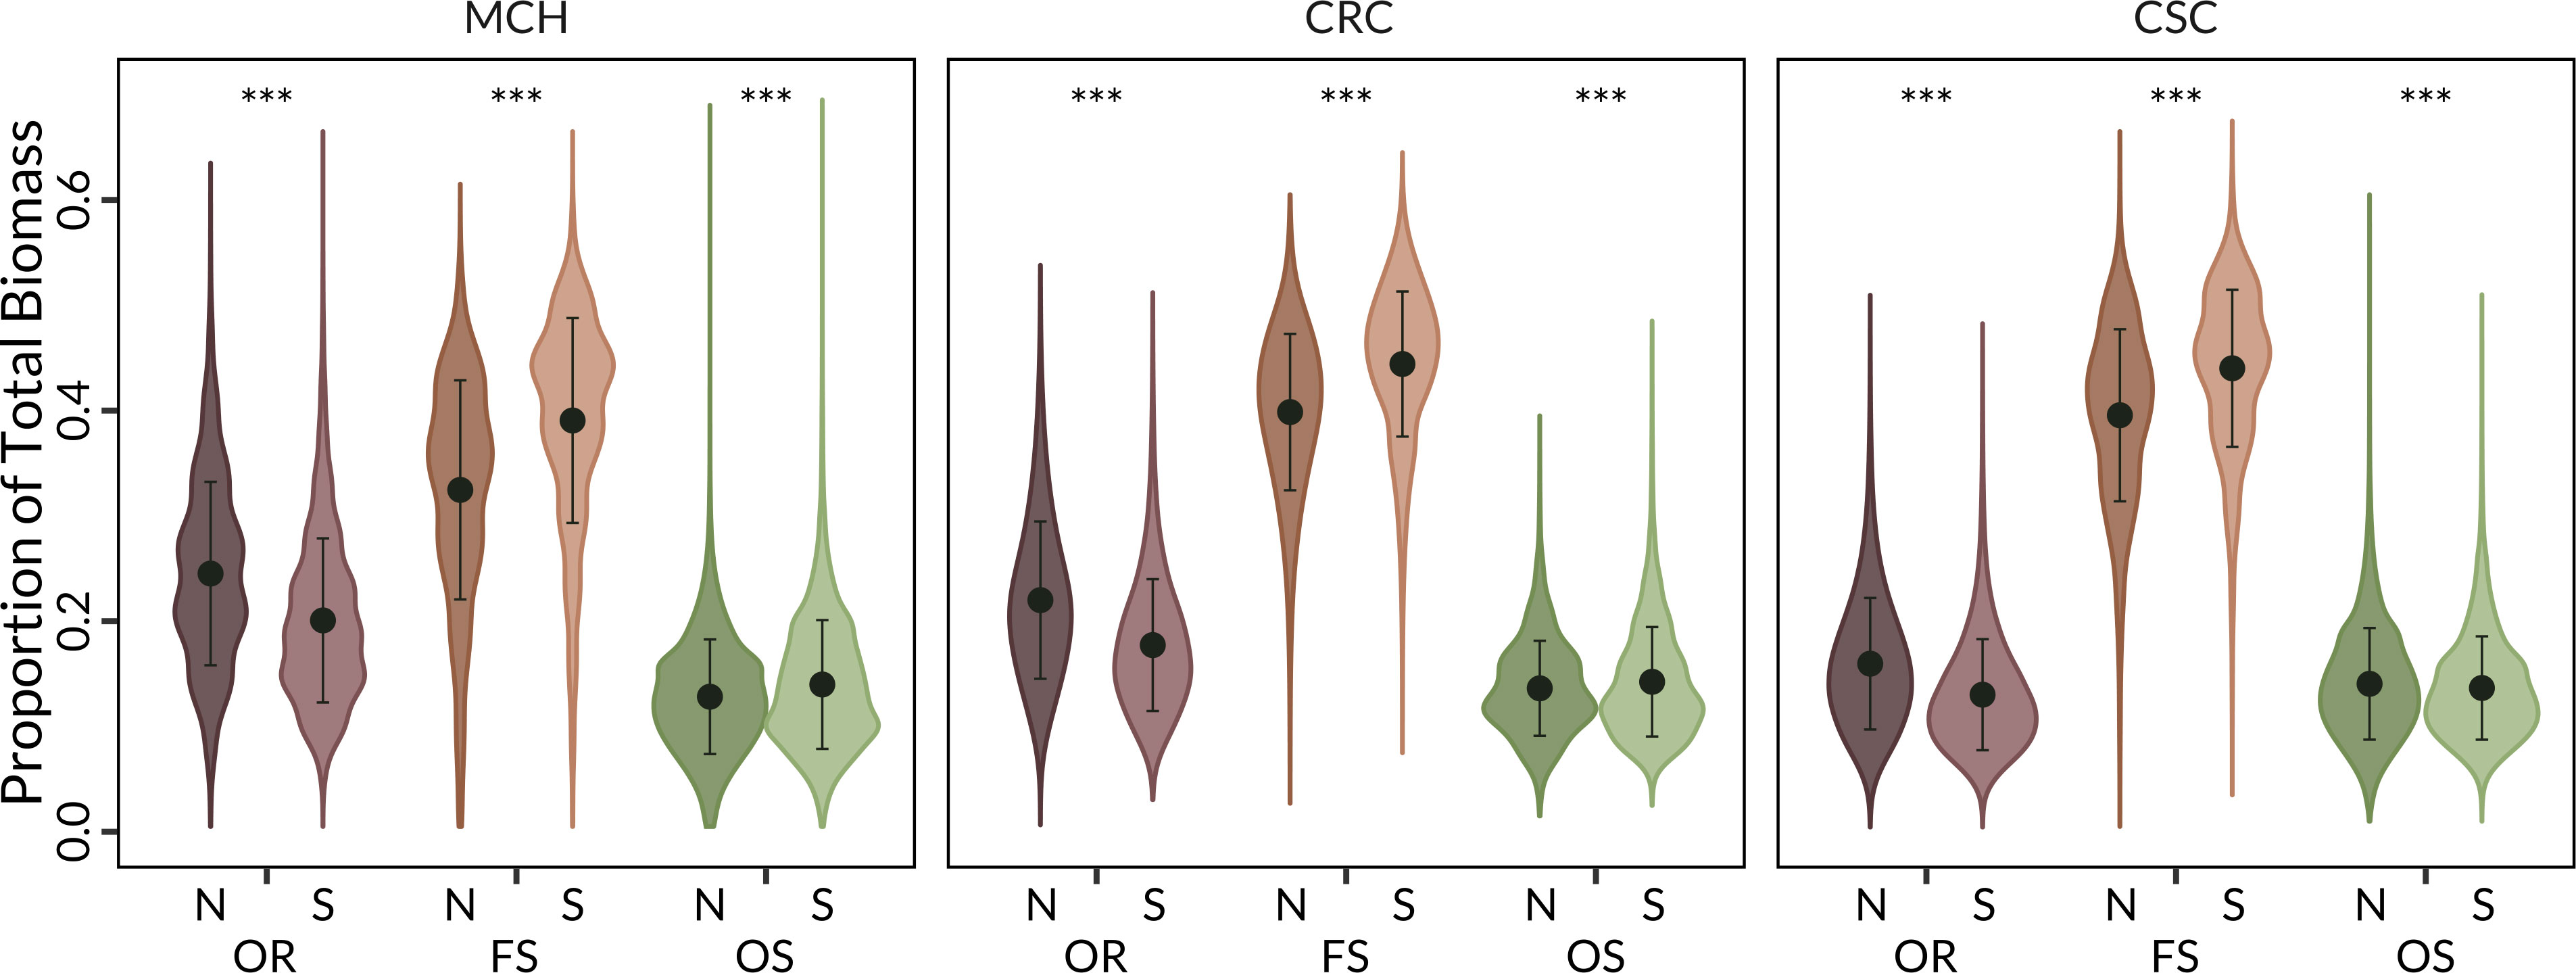
Figure 5 Mean proportion of shrub regeneration strategy in the three main shrub vegetation types: MCH = mixed chaparral; CRC= chamise redshank chaparral; CSC = coastal sage scrub, by topographic facets. N = north facing slopes, valleys and depressions and S = south facing slopes, summits and ridges. OR = Obligate Resprouters, FS = Facultative Seeders, and OS = Obligate Seeders. Error bars are +/− SD. *** Indicates statistically significant (P<0.0001).
Discussion
Using FIA plots and a variety of static and dynamic environmental variables, we modeled the distribution of five plant groups – three shrub regeneration strategies: obligate seeders (OS), facultative seeders (FS), obligate resprouters (OR); and trees and herbs – by estimating the proportion of biomass within each of the five groups. Overall, model cross-validation showed the accuracy achieved 50% of predicted value within 8 to 24 percent of the actual value, with prediction accuracy highest for herb biomass and lowest for OR. Of the three shrub regeneration strategies, OS biomass was predicted with the highest accuracy and narrowest environmental range (Table 3; Figure 1). Our results reinforced findings from Syphard and Franklin (2010) who studied a subset of our southern California ecoregion: species distribution models showed obligate seeding species were mapped with highest accuracy, potentially due to their limited seed dispersal. In contrast, both Syphard and Franklin (2010) and this study mapped OR with less accuracy (incidentally, OR have a variety of seed dispersal mechanisms including long-distance dispersal by birds [Bullock, 1978; Syphard and Franklin, 2010]). One caveat to these findings is the bias of FIA plots to sample upland interior, moister sites which contain trees, thereby possibly underrepresenting OS species in coastal and desert scrub communities. In addition, research has shown some shrub species, such as Ceanothus leucodermis, vary temporarily and spatially in their post-fire regeneration strategy, changing from OR to OS with longer fire-fire intervals (Keeley, 2023).
The results reported relating to temporal variation and time since fire on shrub regeneration strategies reflect our understanding of chaparral communities and successional pathways. Relative to OS, species with resprouting ability (FS and OR) are able to rapidly dominate post-fire sites (Figure S2). OS represented a small proportion of the initial post-fire biomass (5–7% depending on the shrub community type), however OS increased to 17–21% a century following fire (available fire history data date back 100 years). Studies indicate OS regeneration in California shrublands is largely resilient after fire when the time since last fire is long enough to support mature shrub growth and several years of seed set (Keeley, 1986). For example, in mixed chaparral communities, which have a higher proportion of OS than chamise redshank chaparral, stands >30 years old had twice the amount of live OS biomass (Bohlman et al., 2018). In comparison, the proportion of FS biomass increases immediately post-fire, reflecting the resprouting ability of this type, but then decreases slightly over time as OS species grow and become established. This pattern reflects other studies which suggest seedlings of OS are more successful post-fire than seedlings of FS (Keeley and Zedler, 1978). The proportion of herb biomass decreases dramatically in the first two decades as the shrub canopy closes.
Our findings highlight notable variation among the five plant groups with respect to their responses to water availability, as indicated in our analyses of CWD and solar radiation effects. As CWD increased, we found a trade-off in the relationship between OS, FS and OR, such that OR decreased dramatically with increasing CWD, while FS and OS increased (Figure 3B). These findings reflect the general understanding in the literature that OS have undergone greater selection for physiological and morphological tolerances to drought (and higher insolation) due to the higher frequency of sexual reproduction when compared to species with the capacity to resprout (Keeley, 1998; Meentemeyer et al., 2001). Furthermore, seedlings of OS are more tolerant of water stress and tissue dehydration, and more efficient at conducting water (Pratt et al., 2010; Vilagrosa et al., 2013). Consequently, OS (and presumably FS which harbor similar regeneration traits) can do better in xeric sites with more stressful drought conditions, while OR predominate in sites with more reliable moisture (thus lower CWD) (Meentemeyer and Moody, 2002). OR are less physiologically and morphologically able to tolerate water stress: their leaves are less sclerophyllous and they have a lower resistance to water stress-induced cavitation of their stems (Meentemeyer and Moody, 2002). We also found an increase in CWD resulted in a decrease in the proportions of herbs and trees.
As solar radiation increased, we found the same tradeoff in OR and FS as with CWD, with decreased OR biomass. The lower abundance of OR on hotter slopes and ridges with high solar exposure may be reflecting the sensitivity of OR seed viability to drought and high soil temperatures, as has been suggested in other studies in California (e.g., Meentemeyer et al., 2001). In contrast to CWD, increasing solar radiation drove a slight decrease in OS (Figure 3C), which is counter to the increase with higher insolation suggested by Keeley (1998). Also, somewhat counterintuitive, is the increase in the proportion of tree biomass at higher levels of solar radiation.
The variation found in the proportion of biomass in the five plant groups and productivity (NDVI) was intuitive. Herb biomass was influenced most strongly and drastically declined (38% to 2%) as productivity increased, while OR, OS, and tree biomass increased with productivity. The pattern for OR reflects findings in the literature: resprouting is optimal in moist and fertile environments (Pausas and Keeley, 2014). Of note is the response of FS, whose biomass is relatively stable across the range of NDVI values (Figure 3D). One reason is that FS shrubs are benefitting from both seeding traits (better able to cope in water stressed environments) and resprouting traits (e.g., deep roots and higher root to shoot ratios). Levin (1990) suggested that seeding traits make a species better suited to changing environments as seed banks are a source of genetic variation, which might explain the widespread distribution of OS over a range of productivity values.
The three shrub regeneration strategies showed notable spatial variation at the landscape scale. FS species accounted for over a third of the biomass in all three shrub communities and FS dominated pixels were much more broadly distributed than OR or OS, reflecting findings relating to the influence of productivity (NDVI) on the proportion of FS biomass (Figure 3D). OR dominated pixels occurred in loose aggregations including in higher elevation areas of the San Bernardino and Angeles National Forests. OS dominated pixels occupied the smallest spatial area and occurred in scattered pixels throughout the ecoregion. Our findings reflect suggestions that in many Mediterranean-type climate regions, there is some spatial segregation between OS and OR, where OS occupy parts of the landscape where water is more susceptible to strong oscillations, and OR occupy areas where water is more reliable (Pausas and Keeley, 2014). The analysis using topographic facets supports our understanding from the literature (e.g., Gordon and White, 1994): the mean proportion of FS and OS in mixed chaparral and chamise redshank chaparral was higher in warmer, south facing slopes, summits and ridge facets (except for OS in coastal sage scrub), while the mean proportion of OR was higher in cooler, north facing slopes, valleys and depression facets (Figure 5; Tables S2, S3).
Implications of study
Modeling the distribution of shrub regeneration strategies can support resource management in a number of ways. First, spatial data outputs lay the foundation for improved estimates of carbon storage across multiple shrub biomass pools. Existing regional data on aboveground live biomass (Schrader-Patton and Underwood, 2021) can be used in conjunction with the proportion of OS, FS, and OR to estimate belowground biomass using root to shoot ratios, standing dead biomass, and litter, which differ by species with different post-fire regeneration strategies (e.g., Green, 1970; Kummerow et al., 1977; Miller and Ng, 1977; Riggan et al., 1988; Schrader-Patton et al., 2023). In turn, for resource managers this provides a powerful dataset for carbon accounting and monitoring.
Second, information on the proportion of OS versus resprouting species can help identify areas at risk of conversion to non-native grasslands owing to high frequency fire (Syphard et al., 2013; Syphard et al., 2018), and contribute to prioritization of areas for post-fire restoration (see case study on Bobcat Fire in Supplementary Materials). Although resprouting shrubs can also decline when experiencing (very) short fire return intervals, they are much more resilient than the OS group (Zedler et al., 1983; Pausas et al., 2016).
The results we report used field data and static and dynamic variables to assess spatial and temporal variation in shrub post-fire regeneration strategies at the ecoregional scale in California. This study provides a contribution from the North American Mediterranean-Climate Region which joins studies of spatial variation in post-fire regeneration types from other MCRs including Australia (Clarke et al., 2015; Lawes et al., 2022), South Africa (Bond and Midgley, 2003; Cowling et al., 2018), and the Mediterranean Basin (Parra and Moreno, 2018).
Data availability statement
The data presented in this study are available on request from the corresponding author.
Author contributions
Project idea was conceived of by EU, HS and NM. Data processing and analyses were undertaken by QS, CS-P and EU. EU led the writing of the manuscript with contributions from QS, and all authors reviewed and edited the manuscript. All authors contributed to the article and approved the submitted version.
Funding
The work contributing to this study was funded by the California Department of Forestry and Fire Protection (CalFire), the USDA Forest Service Western Wildlands Environmental Threat Assessment Centre, and the USDA Forest Service Pacific Southwest Region.
Acknowledgments
We are grateful to Alex Syphard and Jon Keeley for valuable discussions and Kama Kennedy (USDA Forest Service Remote Sensing Lab) for contributions in applying allometric equations to the FIA plot data.
Conflict of interest
The authors declare that the research was conducted in the absence of any commercial or financial relationships that could be construed as a potential conflict of interest.
Publisher’s note
All claims expressed in this article are solely those of the authors and do not necessarily represent those of their affiliated organizations, or those of the publisher, the editors and the reviewers. Any product that may be evaluated in this article, or claim that may be made by its manufacturer, is not guaranteed or endorsed by the publisher.
Supplementary material
The Supplementary Material for this article can be found online at: https://www.frontiersin.org/articles/10.3389/fevo.2023.1158265/full#supplementary-material
References
Anderson D., Burnham K. (2004). Model selection and multi-model inference (2nd edition) (New York: NY: Springer-Verlag).
Barbour M. G., Keeler-Wolf T., Schoenherr A. A. (2007). Terrestrial vegetation of California (Berkeley, CA: University of California Press).
Bellingham P. J., Sparrow A. D. (2000). Resprouting as a life history strategy in woody plant communities. Oikos 89, 409–416. doi: 10.1034/j.16000706.2000.890224.x
Bohlman G. N., Underwood E. C., Safford H. D. (2018). Estimating biomass in California’s chaparral and coastal sage scrub shrublands. Madroño 65, 28–46. doi: 10.3120/0024-9637-65.1.28
Bond W. J., Midgley J. J. (2001). Ecology of sprouting in woody plants: the persistence niche. Trends Ecol. Evol. 16, 45–51. doi: 10.1016/S0169-5347(00)02033-4
Bond W. J., Midgley J. J. (2003). The evolutionary ecology of sprouting in woody plants. Int. J. Plant Sci. 164, S103–S114. doi: 10.1086/374191
Borchert M., Lopez A., Bauer C., Knowd T. (2004). Field guide to coastal sage scrub and chaparral alliances of Los Padres National Forest, USDA Forest Service Region 5, Ecological Field Guide.
Bullock S. H. (1978). Plant abundance and distribution in relation to types of seed dispersal in chaparral. Madroño 25, 104–105.
Burkman B. (2005). “Forest inventory and analysis sampling and plot design; FIA fact sheet series,” in USDA Forest Service forest inventory and analysis national program (Washington DC, USA: USDA Forest Service). Available at: https://www.fia.fs.usda.gov/library/fact-sheets/data-collections/Sampling%20and%20Plot%20Design.pdf.
Clarke P. J., Lawes M. J., Midgley J. J., Lamont B. B., Ojeda F., Burrows G. E., et al. (2013). Resprouting as a key functional trait: how buds, protection and resources drive persistence after fire. New Phytol. 197, 19–35. doi: 10.1111/nph.12001
Clarke P. J., Lawes M. J., Murphy B. P., Russell-Smith J., Nano C. E. M., Bradstock R., et al. (2015). A synthesis of postfire recovery traits of woody plants in Australian ecosystems. Sci. Total Environ. 534, 31–42. doi: 10.1016/j.scitotenv.2015.04.002
CNPS (California Native Plant Society). (2021). A manual of California vegetation, online edition (Sacramento, CA: California Native Plant Society). Available at: http://www.cnps.org/cnps/vegetation/.
Cowling R. M., Gallien L., Richardson D. M., Ojeda F. (2018). What predicts the richness of seeder and resprouter species in fire-prone cape fynbos: rainfall reliability or vegetation density? Austral. Ecol. 43, 614–622. doi: 10.1111/aec.12606
Cowling R. M., Rundel P. W., Lamont B. B., Arroyo M. K., Arianoutsou M. (1996). Plant diversity in Mediterranean-climate regions. Trends Ecol. Evol. 11, 362–366. doi: 10.1016/0169-5347(96)10044-6
Davis S. D., Ewers F. W., Wood J., Reeves J. J., Kolb K. J. (1999). Differential susceptibility to xylem cavitation among three pairs of Ceanothus species in the transverse mountain ranges of southern California. Ecoscience 6, 180–186. doi: 10.1080/11956860.1999.11682519
Desouza J., Silka P. A., Davis S. D. (1986). Comparative physiology of burned and unburned Rhus laurina after chaparral wildfire. Oecologia 71, 63–68. doi: 10.1007/BF00377322
Enright N. J., Marsula R., Lamont B. B., Wissel C. (1998). The ecological significance of canopy seed storage in fireprone environments: a model for nonsprouting shrubs. J. Ecol. 86, 946–959. doi: 10.1046/j.1365-2745.1998.00312.x
FEIS. (2021). (Fire effects information system). Available at: https://www.feis-crs.org/feis/.
Franklin J. (2002). Enhancing a regional vegetation map with predictive models of dominant plant species in chaparral. Appl. Veg Sci. 5, 135–146. doi: 10.1111/j.1654-109X.2002.tb00543.x
FRAP (Fire and Resource Assessment Program). (2015). Data from: Fveg15_1 vegetation data. California department of forestry and fire protection’s CALFIRE fire and resource assessment program (FRAP). Available at: http://frap.fire.ca.gov/data/frapgisdata-sw-fveg_download.
Gordon H., White T. C. (1994). Ecological guide to southern California chaparral plant series. transverse and peninsular ranges: Angeles, Cleveland, and San Bernardino national forests. report R5-ECOL-TF-005 (Albany WA: USDA Forest Service Pacific Southwest Region).
Gosper C. R., Hopley T., Byren M., Hopper S. D., Prober S. M., Yates C. J. (2019). Phylogenomics shows lignotuber state is taxonomically informative in closely related eucalypts. Mol. Phylogenet Evol. 135, 236–248. doi: 10.1016/j.ympev.2019.03.016
Gray J. T. (1982). Community structure and productivity in Ceanothus chaparral and coastal sage scrub of southern California. Ecol. Monogr. 52 (4), 415–435. doi: 10.2307/2937353
Green L. R. (1970). An experimental prescribed burn to reduce fuel hazard in chaparral. research note PSWRN-216 (Berkeley, CA: USDA Pacific Southwest Forest and Range Experimental Forest).
Hastie T., Tibshirani R., Friedman J. (2009). The elements of statistical learning: data mining, inference, and prediction. 2nd ed (New York: Springer).
Hollander A. D., Underwood E. C. (2021). Data from: shrubland vegetation topographic facets of southern California. Dryad Digital Repository. doi: 10.25338/B8JW59
Jacobson A. L., Pratt B. R., Ewers F. W., Davis S. D. (2007). Cavitation resistance among 26 chaparral species of southern California. Ecol. Monogr. 77 (1), 99–115. doi: 10.1890/05-1879
Jenerette G. D., Park I. W., Andrews H. M., Eberwein J. R. (2018). “Biogeochemical cycling of carbon and nitrogen in chaparral dominated ecosystems,” in Valuing chaparral. Eds. Underwood E. C., Safford H. D., Molinari N. A., Keeley J. E. (Cham, Switzerland: Springer International Publishing), 141–179.
Keeley J. E. (1986). “Resilience of Mediterranean shrub communities to fires,” in Resilience in Mediterranean-type ecosystems: tasks for vegetation science. Eds. Dell B., Hopkins A. J. M., Lamont B. B. (Dordrecht, Germany: Springer). doi: 10.1007/978-94-009-4822-8_7
Keeley J. E. (1991). Seed germination and life history syndromes in the California chaparral. Bot. Rev. 57, 81–116. doi: 10.1007/BF02858766
Keeley J. E. (1998). “Coupling demography, physiology and evolution in chaparral shrubs,” in Landscape degradation and biodiversity in Mediterranean-type ecosystems. Eds. Rundel G. Montenegro P. W., Jaksic F. M. (Berlin, Germany: Springer-Verlag), 237–264.
Keeley J. E. (2023). Spatial and temporal strategies of resprouting and seeding in a chaparral shrub species. Ecology 104 (4), e3984. doi: 10.1002/ecy.39844of4KEELEY
Keeley J. E., Davis F. W. (2007). “Chaparral,” in Terrestrial vegetation of California, 3rd Edition. Eds. Barbour M. G., Keeler-Wolf T., Schoenherr A. A. (Berkeley, CA: University of California Press).
Keeley J. E., Pausas J. G., Rundel P. W., Bond W. J., Bradstock R. A. (2011). Fire as an evolutionary pressure shaping plant traits. Trends Plant Sci. 16, 406–411. doi: 10.1016/j.tplants.2011.04.002
Keeley J. E., Safford H. D. (2016). “Fire as an ecosystem process,” in Ecosystems of California. Eds. Mooney H. A., Zavaleta E. (Berkeley, CA: University of California Press).
Keeley J. E., Zedler P. H. (1978). Reproduction of chaparral shrubs after fire: a comparison of sprouting and seedling strategies. Am. Midl. Nat. 99, 142–161. doi: 10.2307/2424939
Kummerow J., Krause D., Jow W. (1977). Root systems of chaparral shrubs. Oecologia 29, 163–177. doi: 10.1007/BF00345795
Langley J. A., Drake B. G., Hungate B. A. (2002). Extensive belowground carbon storage supports roots and mycorrhizae in regenerating scrub oaks. Oecologia 131, 542–548. doi: 10.1007/s00442-002-0932-6
Lawes M. J., Crisp M. D., Clarke P. J., Murphy B. P., Midgley J. J., Russell-Smith J., et al. (2022). Appraising widespread resprouting but variable levels of postfire seeding in Australian ecosystems: the effect of phylogeny, fire regime and productivity. Aus. J. Bot. 70 (2), 114–130. doi: 10.1071/BT21110
Levin D. A. (1990). The seed bank as a source of genetic novelty in plants. Amer. Nat. 135, 563–572. doi: 10.1086/285062
Lutes D., Keane R., Caratti J., Key C., Benson N., Sutherland S., et al. (2006). FIREMON: fire effects monitoring and inventory system (Fort Collins, CO: Rocky Mountain Research Station).
McGinnis T. W., Shook C. D., Keeley J. E. (2010). Estimating aboveground biomass for broadleaf woody plants and young conifers in Sierra Nevada, California, forests. West J. App. For. 25, 203–209. doi: 10.1093/wjaf/25.4.203
Meentemeyer R., Moody A. (2002). Distribution of plant life history types in California chaparral: the role of topographically-determined drought severity. J. Veg. Sci. 13, 67–78. doi: 10.1111/j.1654-1103.2002.tb02024.x
Meentemeyer R. K., Moody A., Franklin J. (2001). Landscape-scale patterns of shrub-species abundance in California chaparral. Plant Ecol. 156, 19–41. doi: 10.1023/A:1011944805738
Miller P. C., Ng R. (1977). Root:shoot biomass ratios in shrubs in southern California and central Chile. Madroño 24, 215–223.
Omernik J. M., Griffith G. E. (2014). Ecoregions of the conterminous united states: evolution of a hierarchical spatial framework. Environ. Manag. 54, 1249–1266. doi: 10.1007/s00267-014-0364-1
Parra A., Moreno J. M. (2018). Drought differentially affects the post-fire dynamics of seeders and resprouters in a Mediterranean shrubland. Sci. Total Environ. 626, 1219–1229. doi: 10.1016/j.scitotenv.2018.01.174
Pausas J. G., Bradstock R. A. (2007). Fire persistence traits of plants along a productivity and disturbance gradient in mediterranean shrublands of south-east Australia. Glob Ecol. Biogeogr. 16, 330–340. doi: 10.1111/j.1466-8238.2006.00283.x
Pausas J. G., Keeley J. E. (2014). Evolutionary ecology of resprouting and seeding in fireprone ecosystems. New Phytol. 204, 55–65. doi: 10.1111/nph.12921
Pausas J. G., Pratt R. B., Keeley J. E., Jacobsen A. L., Ramirez A. R., Vilagrosa A., et al. (2016). Towards understanding resprouting at the global scale. New Phytol. 209, 945–954. doi: 10.1111/nph.13644
Poole D. K., Miller P. C. (1975). Water relations of selected species of chaparral and coastal sage communities. Ecology 56, 1118–1128. doi: 10.2307/1936151
Pratt R. B., North G. B., Jacobsen A. L., Ewers F. W., Davis S. D. (2010). Xylem root and shoot hydraulics is linked to life history type in chaparral seedlings. Funct. Ecol. 24, 70–81. doi: 10.1111/j.1365-2435.2009.01613.x
R Core Team (2016). R: a language and environment for statistical computing (Vienna, Austria: R Foundation for Statistical Computing).
Riggan P. J., Goode S., Jacks P. M., Lockwood R. N. (1988). Interaction of fire and community development in chaparral of southern California. Ecol. Monogr. 58, 155–176. doi: 10.2307/2937023
Ripley B., Venables W. (2021). Nnet: feed-forward neural networks and multinomial log-linear models (R Package).
Rundel P. (2018). “California Chaparral and its global significance,” in Valuing chaparral. Eds. Underwood E. C., Safford H. D., Molinari N. A., Keeley J. E. (Cham, Switzerland: Springer International Publishing), 1–27.
Safford H. D., Paulson A. K., Steel Z. L., Young D. J. N., Wayman R. B. (2022). The 2020 California fire season: a year like no other, a return to the past, or a harbinger of the future? Glob Ecol. Biogeogr. 00, 1–21. doi: 10.1111/geb.13498
Safford H. D., Underwood E. C., Molinari N. A. (2018). “Managing chaparral resources on public lands,” in Valuing chaparral. Eds. Underwood E. C., Safford H. D., Molinari N. A., Keeley J. E. (Cham, Switzerland: Springer International Publishing), 411–448.
Safford H. D., Van de Water K. M. (2014). Using fire return interval departure (FRID) analysis to map spatial and temporal changes in fire frequency on national forest lands in california. research paper PSW-RP-266 (Albany, CA: USDA Forest Service, Pacific Southwest Research Station).
Schrader-Patton C. C., Underwood E. C. (2021). New biomass estimates for chaparral-dominated southern California landscapes. Remote Sens. 13 (8), 1581. doi: 10.3390/rs13081581
Schrader-Patton C. C., Underwood E. C., Sorenson Q. M. (2023). Annual biomass spatial data for southern California, (2001–2021): above- and belowground, standing dead, and litter. Ecology, e4031. doi: 10.1002/ecy.4031
Stephenson N. L. (1998). Actual evapotranspiration and deficit: biologically meaningful correlates of vegetation distribution across spatial scales. J. Biogeog. 25, 855–870. doi: 10.1046/j.1365-2699.1998.00233.x
Syphard A. D., Bar Massada A., Butsic V., Keeley J. E. (2013). Land use planning and wildfire: development policies influence future probability of housing loss. PloS One 8 (8), e71708. doi: 10.1371/journal.pone.0071708
Syphard A. D., Brennan T. J., Keeley J. E. (2018). “Chaparral landscape conversion in southern California,” in Valuing chaparral. Eds. Underwood E. C., Safford H. D., Molinari N. A., Keeley J. E. (Cham, Switzerland: Springer International Publishing), 323–336.
Syphard A., Franklin J. (2010). Species traits affect the performance of species distribution models for plants in southern California. J. Veg. Sci. 21, 177–189. doi: 10.1111/j.1654-1103.2009.01133.x
Underwood E. C., Safford H. D., Molinari N. A., Keeley J. E. (2018). Valuing chaparral: ecological, socio-economic, and management perspectives (Cham, Switzerland: Springer International Publishing).
USDA [US Department of Agriculture]. (2015). Data from: fire-return interval departure (FRID) geodatabase. Available at: http://www.fs.usda.gov/detail/r5/landmanagement/gis/?cid=STELPRDB5327836.
USFS (USDA Forest Service). (2022). Confronting the wildfire crisis: a strategy for protecting communities and improving resilience in america’s forests. report: FS-1187a. Available at: https://www.fs.usda.gov/sites/default/files/Confronting-Wildfire-Crisis.pdf.
Vilagrosa A., Hernandez E., Luis V. C., Cochard H., Pausas J. G. (2013). Physiological differences explain the co-existence of different regeneration strategies in Mediterranean ecosystems. New Phytol. 201, 1277–1288. doi: 10.1111/nph.12584
Wakimoto R. H. (1978). Responses of southern California brushland vegetation to fuel manipulation [dissertation] (Berkeley (CA: University of California).
Zedler P. H. (1995). “Fire frequency in southern California shrublands: biological effects and management options,” in Brushfires in California wildlands: ecology and resource management. Eds. Keeley J. E., Scott T. (Fairfield, Washington DC: International Association of Wildland Fire), 101–112.
Keywords: biomass, climatic water deficit, national forests, NDVI, resource management, solar radiation, time since last fire, wildfire
Citation: Underwood EC, Sorenson QM, Schrader-Patton CC, Molinari NA and Safford HD (2023) Assessing spatial and temporal variation in obligate resprouting, obligate seeding, and facultative seeding shrub species in California’s Mediterranean-type climate region. Front. Ecol. Evol. 11:1158265. doi: 10.3389/fevo.2023.1158265
Received: 03 February 2023; Accepted: 01 June 2023;
Published: 24 July 2023.
Edited by:
Karen Thorne, United States Geological Survey (USGS), United StatesReviewed by:
Carl R. Gosper, Conservation and Attractions (DBCA), AustraliaRachel Mitchell, University of Arizona, United States
Copyright © 2023 Underwood, Sorenson, Schrader-Patton, Molinari and Safford. This is an open-access article distributed under the terms of the Creative Commons Attribution License (CC BY). The use, distribution or reproduction in other forums is permitted, provided the original author(s) and the copyright owner(s) are credited and that the original publication in this journal is cited, in accordance with accepted academic practice. No use, distribution or reproduction is permitted which does not comply with these terms.
*Correspondence: Emma C. Underwood, ZXVuZGVyd29vZHJ1c3NlbGxAdWNkYXZpcy5lZHU=