 Xiao Yu
- Shandong University of Finance and Economics, Jinan, Shandong, China
Introduction: The escalation of the global economy has contributed to the emergence of several environmental challenges, such as global warming and the gradual depletion of the natural environment, which has adversely impacted people’s lives. In response, nations across the globe have embraced the carbon neutrality concept as a means to safeguard the environment and foster a green economy.
Methods: This study assesses the environmental impact of the tourism economy concerning carbon neutrality. Firstly, the quantification of carbon emission-related data in the region is executed using a hierarchical analysis method to pre-process the data for model training. Secondly, this paper utilizes the LTC-RNN (liquid time constant-recurrent neural network) model for model training. The model training is based on expert evaluation labels and cross-validation to execute comparison experiments.
Results: The evaluation results of the model with different training features are compared with the expert results, and the optimal model with 10 features is identified, achieving an accuracy of more than 85%. Finally, practical testing is conducted, and the outcomes indicate that the proposed method can accomplish the task efficiently.
Discussion: The proposed method provides technical support for the environmental evaluation of the green tourism economy in the context of carbon neutrality. It also presents novel ideas for accelerating the carbon neutrality agenda and fostering a low-carbon economy.
1. Introduction
As human society advances, the relationship between nature and humankind has undergone a gradual transformation from the original compliance with nature to the present exploitation of it. While this alteration has facilitated a swift enhancement in both life quality and the economy, it has also led to environmental degradation and global warming, resulting in a set of fresh challenges. To combat climate change and strike a balance between economic development and environmental protection, the United Nations has issued a clear-cut verdict on the global climate, urging each nation to actively promote energy conservation and emission reduction. Consequently, carbon peaking and carbon neutrality have emerged as the national strategies of most countries (Xiang et al., 2022). Carbon peaking and carbon neutrality are the two stages of carbon reduction targets, with the entire process outlined in Figure 1 (Becken et al., 2001). Carbon neutrality refers to the complete absorption and offsetting of carbon emissions. In most research studies related to carbon neutrality, the focus can be divided into the following three aspects: (1) exploring the carbon emission factors (Geidl et al., 2007; Basu et al., 2012); (2) identifying the path and methods to achieve carbon neutrality; (3) examining the challenges and opportunities for industry development in the future, including the power industry, transportation industry, construction industry, and coal industry (McKay et al., 1979; Chen et al., 2013).
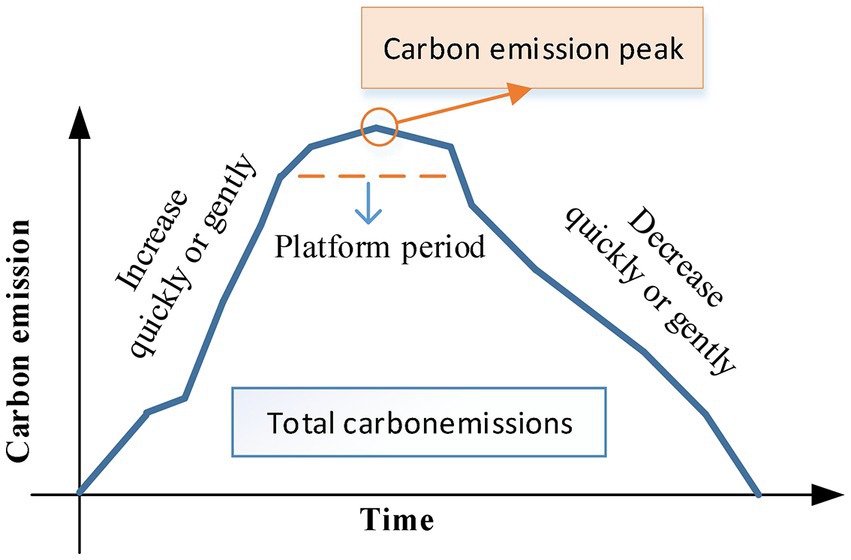
Figure 1. Process of the peak carbon dioxide emissions.
The utilization of carbon peaking and carbon neutrality in diverse industries highlights the significance of green economic development, emphasizing the necessity of accomplishing sustainable development through technology and intelligent approaches, with energy conservation and emission reduction at the core (Ma et al., 2022). As the Covid-19 pandemic approaches a stable phase and draws to a close, the tourism industry is experiencing a resurgence, but this sector also contributes significantly to global carbon emissions. The objective of tourism development is to strive for low carbon and even carbon neutrality by minimizing carbon emissions and increasing carbon absorption. This objective serves as a fundamental principle for countries around the world that aim to develop their tourism economies and seek sustainable growth in the post-Covid19 era (Li et al., 2020). Figure 2 illustrates the carbon emission-related factors and relevant interventions associated with the tourism industry. The sole approach to enhance the carbon-neutral process of the tourism industry is to adopt intelligent means to assess pertinent factors, providing practical and objective data support for relevant measures. Thus, the most crucial task to achieve carbon neutrality and environmental protection in the tourism industry is to establish an intelligent regression model based on multiple factors.

Figure 2. The carbon emissions in travelling.
As depicted in Figure 2, carbon emissions in the tourism industry are primarily categorized into four groups: transportation, accommodation, activities, and food. These categories entail several unknown factors that are difficult to assess by humans for environmental impact and carbon neutrality in the tourism economy process. Therefore, it is crucial to adopt more intelligent means to achieve assessments (Becken and Patterson, 2006). The carbon emission and environmental assessments illustrated in Figure 2 can be reduced to a multi-objective regression issue, which is an intelligent strategic decision. In the field of artificial intelligence, quantifying factors that belong to the multi-objective regression problem through environmental assessments and exploring intelligent evaluation and analysis based on multimodal and multidimensional data is gaining momentum with the continual development of machine learning and deep learning technologies (Perch-Nielsen et al., 2010). The employment of historical data to form supervised learning and complete artificial intelligence classification and assessments is vital to assess the tourism industry in the context of carbon neutrality.
The purpose of this paper is to investigate the importance of environmental assessment in achieving carbon neutrality in the regional tourism economy and to conduct regional environmental intelligent assessment based on multimodal data using deep learning technology. The goal is to provide detailed data for regional environmental monitoring and protection to accelerate carbon neutrality efficiency and offer new insights for carbon peaking and carbon neutrality demand. The paper’s contributions are as follows:
1. Quantification of data according to carbon emission types from historical data of the tourism economy in the region, providing a data basis for subsequent model training and environmental assessment.
2. Optimization of the RNN model based on the LTC method to improve the accuracy of environmental assessment.
3. Completion of practical application tests using the established model, with results showing 85% accuracy when combining historical tourism data in the region for environmental assessment prediction, which is significantly better than the traditional RNN-based method.
The paper is organized as follows: Section 2 introduces related works in green travel economy research and environmental evaluation. Section 3 explains the establishment of the evaluation model, while Section 4 presents the experiment results and analysis, including the model application test. In Section 5, the results and implications for carbon neutralization are discussed. The paper concludes with a summary in the final section.
2. Related works
2.1. Carbon neutral related research in the tourism
In the examination of carbon emissions in the tourism economy, the central emphasis lies on the current carbon source system, carbon emission estimation system, and estimation quandaries. In order to progress subsequent policy research, promote the carbon-neutral process, and establish the intelligent environmental assessment model outlined in this paper, it is essential to undertake a more meticulous appraisal of emissions. At present, carbon emission evaluation indicators are primarily separated into three levels, which are the national level and regional level. The exact emission indicators are illustrated in Table 1.
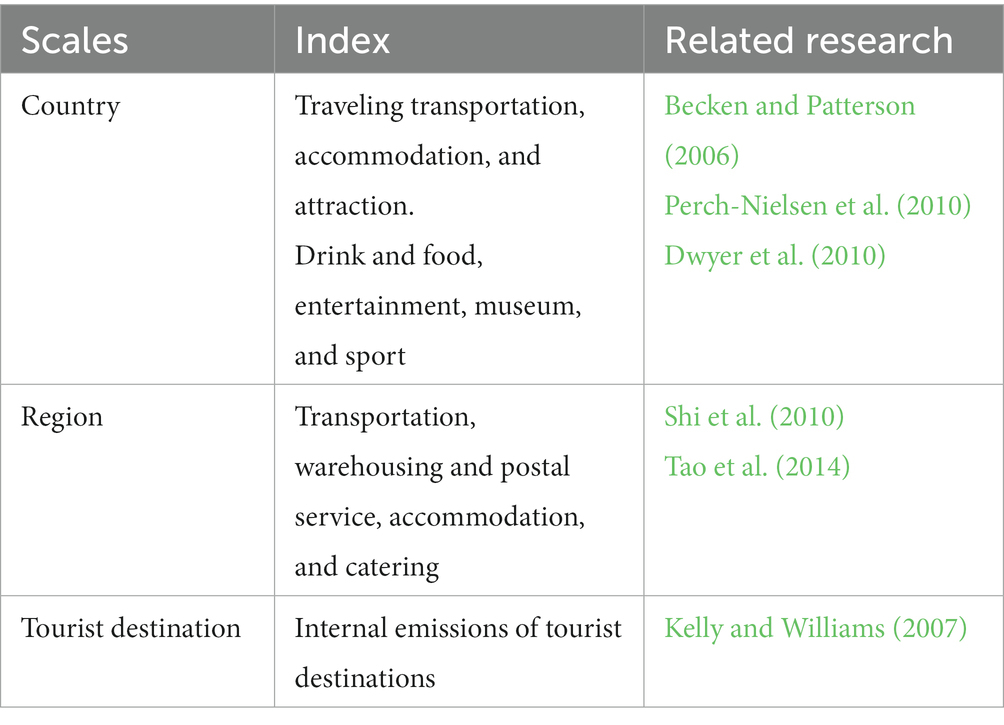
Table 1. Index for the carbon emissions in different scales.
In the development of a nationwide carbon emission framework, Becken and Patterson (2006) categorized the tourism industry into three distinct domains: transportation, accommodation, and activities. Further subdivisions were made within each of the aforementioned sectors, culminating in the establishment of a comprehensive tourism energy carbon consumption system in New Zealand. Conversely, Perch-Nielsen et al. (2010) formulated a carbon emission standard for tourism in Switzerland by leveraging the country’s tourism satellite accounts. In contrast, Dwyer et al. (2010) estimated carbon emissions and consumption by segregating the tourism industry into characteristic and related industries. Kelly and Williams (2007) investigated energy consumption systems in Canadian ski tourism regions and devised a framework to calculate carbon emissions in tourism destinations. Meanwhile, Shi et al. (2010) and Tao et al. (2014) scrutinized related industries within the tourism industry, such as catering and accommodation services, in their respective regions. Their detailed research on the construction of the carbon emission model of the tourism economy provides a theoretical basis for the creation of an intelligent evaluation model.
2.2. A multi-objective evaluation based on deep learning
The evaluation of the natural environment has traditionally been performed using GIS and other data. Remote sensing images are utilized to comprehensively analyze natural factors such as climate, land use, and cover (Quan and Bansal, 2021). Brezillon et al. (2006) contend that GIS visualization spatial information can be combined with other elements to evaluate natural resources and explicate ecological resource quality. However, in the context of a carbon-neutral tourism economy, it is challenging to employ GIS information directly for environmental assessment. Therefore, quantifying the carbon emissions related to the tourism industry based on the aforementioned sections to achieve multi-objective regression is the solution to this predicament. In recent years, with the proliferation of computer computing power, deep learning has gained widespread attention. Besides the conventional BP neural network, the radial basis function neural network, a widely used simple neural network, has been successfully applied in several research domains (Liu et al., 2019; Shi et al., 2022). Furthermore, when dataset dimensionality and breadth are sufficiently intricate, simple neural network models encounter various challenges, such as random initial weights resulting in the model falling into local solutions. Moreover, data sample size and dimensionality disparity lead to model overfitting. As a result, neural network optimization algorithms have emerged to address these issues, and they have become one of the research mainstreams (Huang and Lin, 2019; Li et al., 2019). In the study of multi-objective regression, RNN, LSTM, and related recurrent neural networks have been extensively investigated for power prediction (Kumar et al., 2022), traffic risk prediction (Guo et al., 2021), and financial investment risk assessment (Qu et al., 2019). Deep learning models, especially RNN network models, have demonstrated superior performance in prediction and evaluation problems after training with historical data. The diverse range of applications and data sources further highlight the generalization capability of deep neural network models.
Leveraging deep neural network models to process multi-objective and multi-source data, combined with numerical quantification methods, represents a crucial avenue toward achieving carbon neutrality. This approach facilitates the assessment of human carbon emissions in the tourism economy and enables the creation of a comprehensive index for environmental assessment. The RNN method, which possesses a certain degree of memory due to the weighting of previous output, is critical for environmental assessment of time-series data. Hence, in this paper, we select the RNN method and improve it for environmental assessment in the tourism economy.
3. Evaluation model establishment using improved RNN
3.1. RNN model
A simple RNN is shown in the left part of Figure 3. Compared with the traditional BP NN, the hidden layer has an extra recurrent part, and S in the hidden layer is determined by the input X and the last S. The W in the recurrent layer is the input weight, and by expanding it on the timeline, we can understand more clearly the input–output relationship at each time. The right part of Figure 3 shows that after the network receives the information xt at time t, the specific process for the information transmission can be abstracted as Eqs. (1) and (2).
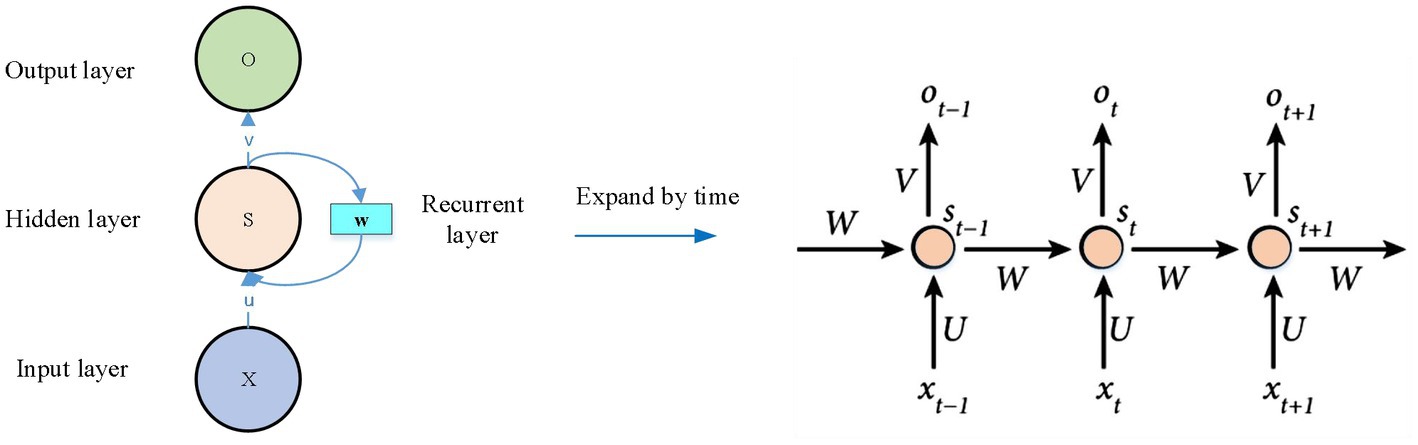
Figure 3. The structure of RNN.
RNN and its enhanced models have the capacity for variable topology and full node weight sharing, and can effectively learn the intrinsic laws of nonlinear time series, thus enabling better prediction and regression analysis of future data. However, RNN exhibits slow convergence speed when dealing with large samples. To overcome this limitation, LSTM models have been proposed to enhance the memory capacity of RNN. However, LSTM has limited correction capability and may fall into the misconception of conditional extrema. To address these issues, Hasani et al. (2021) proposed an improved state equation for the hidden layer neurons in RNN, based on a numerical study of neural dynamics, and developed a liquid time constant neuron with a liquid time constant-recurrent neural network (LTC-RNN). The LTC-RNN has strong self-correction capability and the ability to find the global optimal solution.
3.2. LTC-RNN model
The neuronal membrane integrator is an important model for describing the membrane potential of neurons in the nervous system. The state of a postsynaptic neuron can be described by Eq.(3):
Where: Cm,i, is the cell membrane capacitance i is the cell membrane capacitance; described by the sigmoid nonlinear function, i.e.
In Eq. (4): and are the parameters of the sigmoid function; is the state of the presynaptic neuron; represents the state of the postsynaptic neuron; denotes the state of the connecting neuron and neuron of the connected neuron and the neuron’s weight. . This determines the sign of the synapse is used to indicate whether the synapse is an excitatory or an inhibitory synapse. Substituting Eq. (4) into Eq. (3) yields the neuron . The equation of state of the neuron is
where is the sigmoid function on the sigmoid function, i.e.
On this basis, the state equation of the hidden layer neurons can be obtained as shown in Eq. (7).
3.3. Training for LTC-RNN
The information necessitates quantification prior to training the LTC-RNN network. This paper achieves data quantification in accordance with the four constituent types featured in Figure 1, and the AHP method, combined with expert scoring, is employed in the quantification process. This method thoroughly considers the quantification and analysis process of the pertinent database.1 To refine the training performance post-quantification and scoring, the data normalization method is utilized in this paper to execute the model training, and the normalization process is explicated in Equation (8).
Where x all denote the quantized values, and the markers therein denote the mean, the maximum and minimum value. After completing the data processing for model training, the specific process is shown in Figure 4.
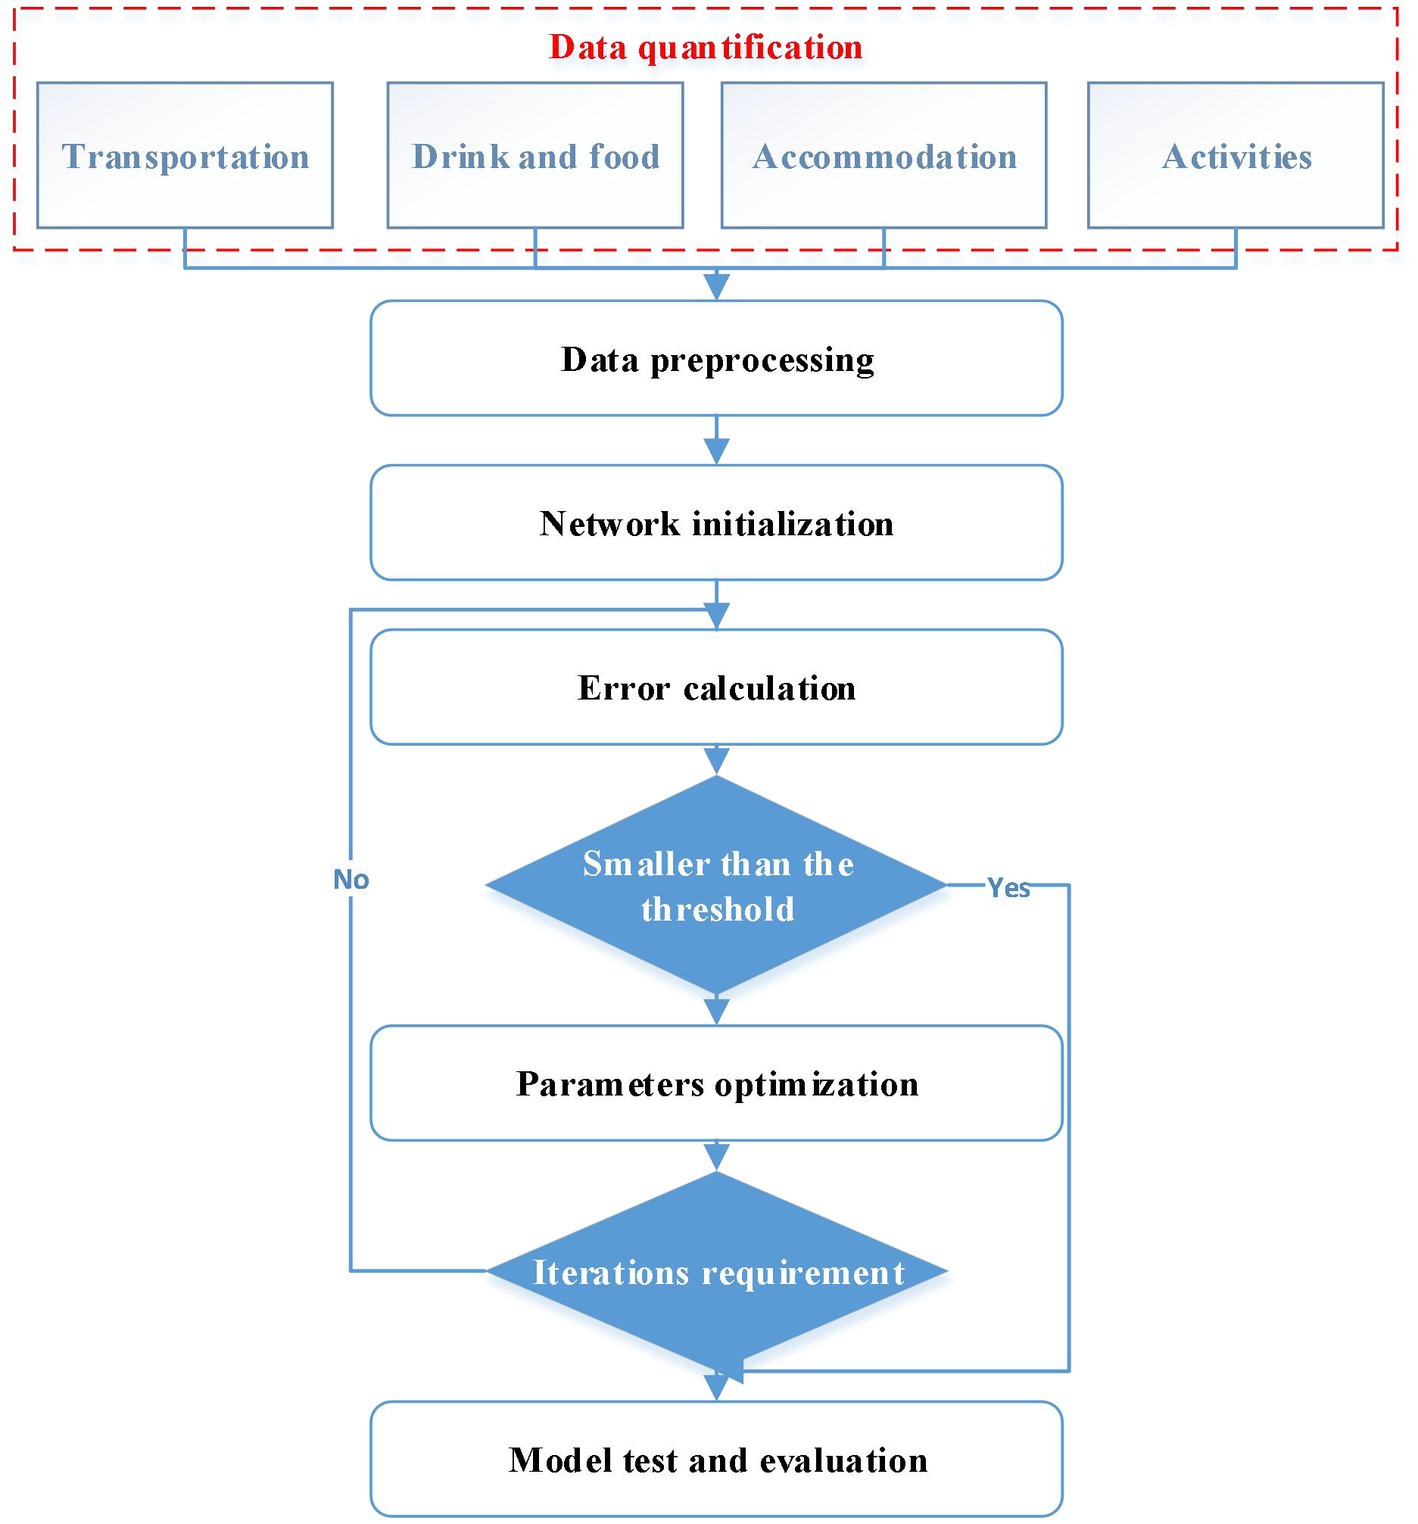
Figure 4. The framework for the LTC-RNN in the environment model training.
To evaluate the accuracy, this paper forms model accuracy evaluation indexes based on the expert scoring prediction assessment results and the actual results whose calculation process is shown in Eq. (9)
4. Experiment result and analysis
4.1. The result for the environment evaluation
This paper emulates the data quantification and management methods utilized in the existing relevant environmental assessment (see Footnote 1) and risk assessment2 studies, along with their respective databases, to finalize the data pre-processing. By quantifying four factors in the carbon emission process, a total of 15-dimensional quantitative data was acquired based on the recommendations of local experts. The model was then trained using ten-fold cross-validation, and the resulting credential recognition rate is depicted in Figure 5.
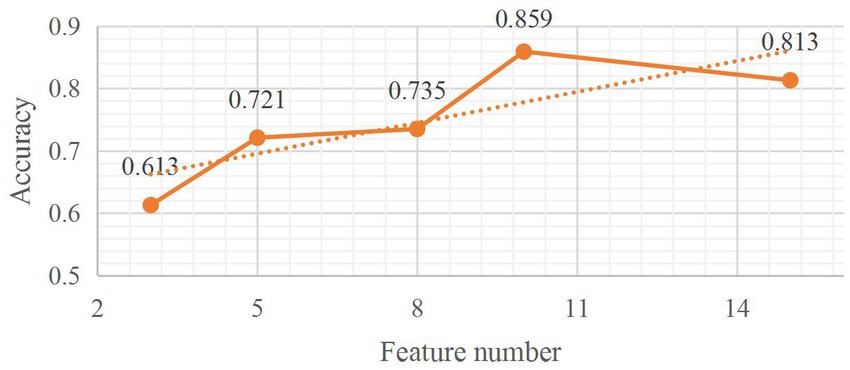
Figure 5. The result of the environment evaluation model using different features.
In Figure 5, the solid line is the accuracy distribution and dashed line represents the trend. It has been observed that the performance of the LTC-RNN model employed in this study is subject to significant variability when utilizing different features. Furthermore, the recognition accuracy of the model, which is indicative of its evaluative capability, displays an upward trend with increasing dimensionality of the data features, and reaches an optimal evaluation effect when the feature dimension is set to 10. To assess the performance of the LTC-RNN model, a 10-fold cross-validation model was chosen as the final model and subsequently compared to alternative models.
4.2. The comparison results of different methods
To assess the performance and underscore the superiority of the model, various relevant techniques have been compared in this study, including traditional RNN, LSTM, and PSO-RNN. Among the RNN category methods, the more popular LSTM approach was selected for comparison, which possesses a certain degree of memory but exhibits limited self-regulation capabilities. This issue is elaborated upon in the corresponding research section, specifically Section 2.2. PSO was employed to optimize the RNN, as it is advantageous and widely used in preventing the model from becoming trapped in initial extremes. Therefore, the model was chosen for comparison purposes to ensure its validation.
The evaluation results obtained through various methods are depicted in Figure 6, from which we observe that the traditional RNN method exhibits subpar evaluation outcomes. Although there is some improvement achieved via optimization through the PSO method, the improvement is not substantial. In contrast, LSTM evaluation yields better results, which may be attributed to the higher historical correlation of the data involved in this study, ultimately leading to enhanced performance. In contrast, the LTC-RNN method delivers the most optimal evaluation results, thanks to its superior adaptability. Subsequent to the evaluation, we conducted an in-depth data analysis and computed the contribution rates of different types of features, as illustrated in Figure 7.
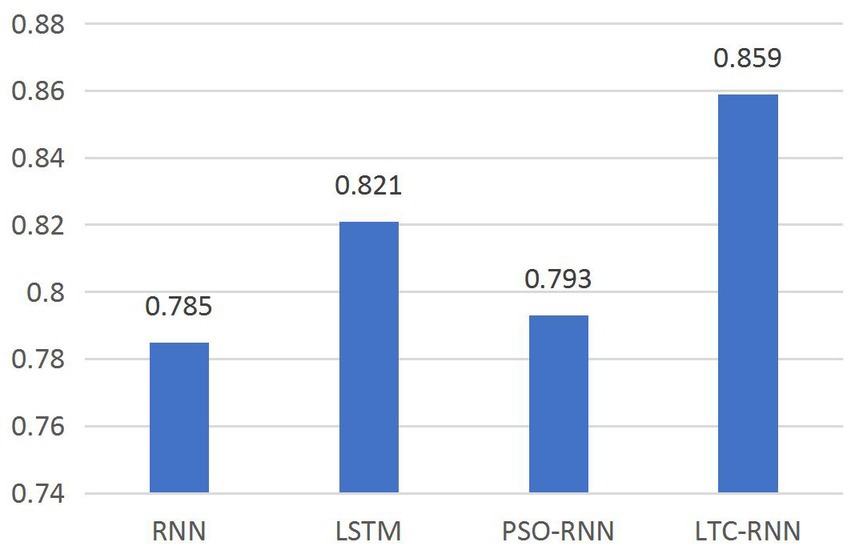
Figure 6. The accuracy result among different evaluation methods.
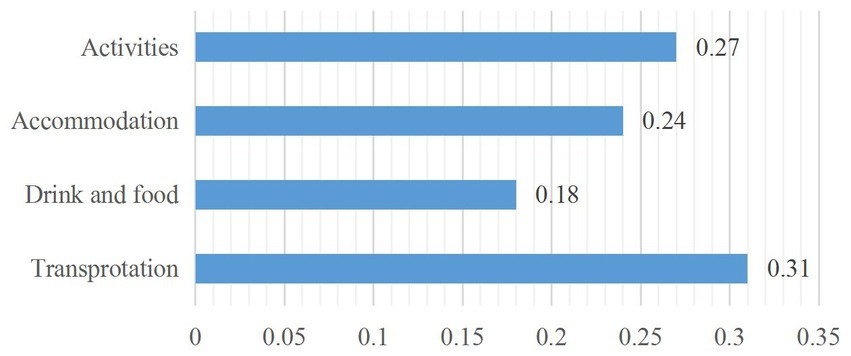
Figure 7. The contribution distribution of emission related factors.
The aforementioned chart highlights that, among numerous carbon emission factors, the most impactful is the transportation factor, followed by various activities during the travel process, which can be attributed to the noticeable carbon emissions produced during transportation. These associated activities are often instrumental in attracting tourists and demand considerable material and human resources. The high energy consumption required to host events in a brief time frame leads to elevated carbon emissions, resulting in its top-ranked status in the characteristic ranking. This information represents a crucial reference for future carbon-neutral research, emphasizing the need to prioritize strategies for holding events that ensure their low-carbon nature.
4.3. The model application in practice
To test the effectiveness of the framework proposed, practical tests were conducted to actually validate quantified data, and the specific validation is shown in Figure 8.
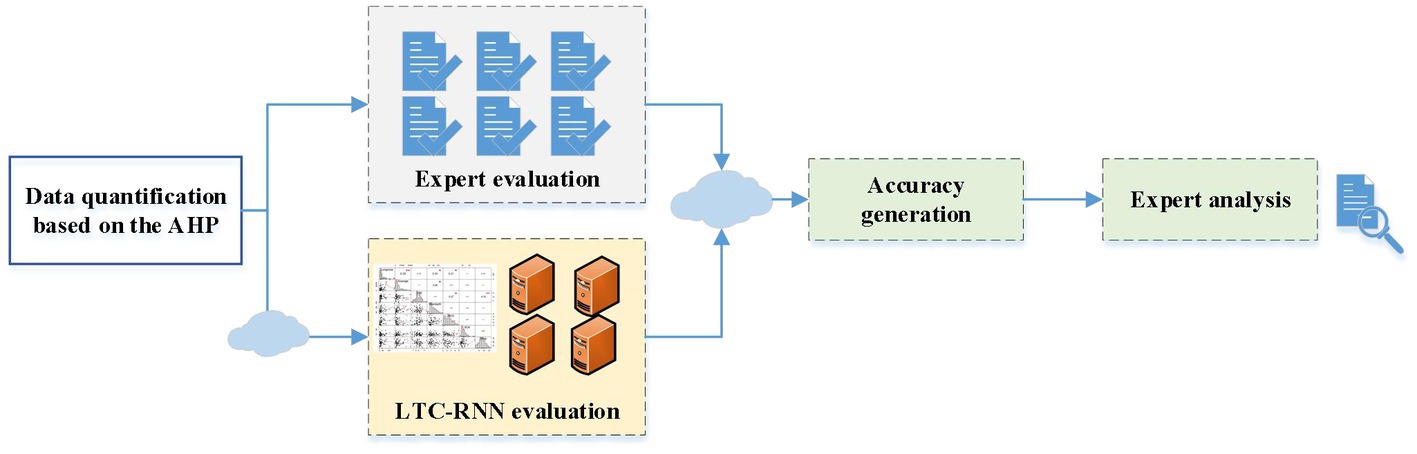
Figure 8. The framework for the test in practice.
During the validation process, we utilized cloud technology to transmit pertinent data to the server for calculations. Simultaneously, for the project itself, the content was disseminated to relevant experts for anonymous review, enabling them to perform the requisite evaluation and comparison work. Following the comparison and validation of the model’s accuracy, the remaining experts conducted additional analyses and comparisons. The accuracy of models employing distinct methods with differing characteristics is depicted in Figure 9.

Figure 9. Model test using different methods.
According to Figure 9, it can be found that under the low-dimensional features, each method does not perform well in the actual test, while with the increase of the feature dimension, its assessment accuracy shows an increasing trend. When the feature exceeds 10, there is a little decrease for the model. It can also be found that the model proposed has a high accuracy, which can best meet the environmental assessment in the context of carbon neutrality in the tourism field.
5. Discussion
The LTC-RNN used in this paper improves the state equation of RNN neurons with the membrane integrator as a reference and uses the historical state of neurons to calculate hidden states, which enhances the self-correction capability of the model. The analysis of practical cases in this paper confirms that LTC-RNN can reach the optimal parameters quickly and stably with high computational efficiency. Also, LTC-RNN methods usually utilize a semi-implicit Euler solver to compute the hidden neuron states, which allows the global optimal solution to be sought directly without relying on other optimization methods (Shahparasti et al., 2017). Meanwhile, in this paper, the model fully considers multiple factors in travel to analyze and explore the internal link between each component to achieve a more accurate environmental assessment. Compared with traditional regression-based and machine learning methods, deep learning methods have become a hot research topic in multi-objective regression analysis due to their advantages in processing nonlinear data (Dong et al., 2019). RNN methods, on the other hand, have advantages in time-related data processing due to their excellent temporal memory, so this paper uses LTC-RNN to improve its own limitations to achieve better results in practical tests.
Global warming is a very serious environmental problem facing human society, and the large amount of carbon dioxide produced by the economic activities of human society since the industrial revolution is considered to be the most important cause of climate warming. Climate change has already brought many negative impacts to the production and life of human society, so people must respond positively to reduce carbon emissions from human activities and slow down the warming trend. The path to achieve the goal of carbon neutrality can be summarized in four aspects: first, we should promote and strengthen the strength and depth of energy transformation and promote the digital transformation; second, we should develop a circular economy and promote resource use efficiency; third, we should improve the comprehensive carbon dioxide absorption system and seek carbon-neutral solutions based on natural ecology; fourth, we should accelerate the replacement of traditional fossil energy with renewable energy. Fourth, accelerating the replacement of traditional fossil energy by renewable energy (Masanet et al., 2020). The tourism economy, as a cleaner type of economy in the economic cycle, urgently needs to restore economic order by reviving such an economy in the post-Covid19 era to promote the process of carbon neutrality while developing the economy. To achieve low-carbon or even zero-carbon development of the tourism industry., we use the environmental intelligence evaluation model to assess carbon emissions, so that the tourism economic development strategy can be formulated to achieve a win-win situation for both economic and carbon neutral goals.
6. Conclusion
This paper investigates the environmental impact assessment of the regional tourism economy in the context of carbon neutrality and proposes an environment assessment framework based on LTC-RNN model. The model is firstly based on the historical tourism carbon emission data of the region for model training and expert assessment results, and its assessment accuracy is 85.9%, which is higher than the traditional RNN as well as LSTM and PSO-RNN methods. In the process of model optimization, it was found that the highest accuracy of the model evaluation was achieved when ten-dimensional features were used, and the model was tested in practical applications. The framework proposed also outperforms the traditional assessment methods in the practice test, which provides new ideas for future environmental impact assessment of tourism economic development in various regions. The intelligent assessment of the environment to achieve timely adjustment of tourism economic strategies and enhance the development wisdom to accelerate the process of carbon neutrality is a necessary way for economic development in the new era. In future research, improving the type of numerical quantitative indicators, enhancing the accuracy of model assessment, and testing in more regions and fields are the focus of future research. Meanwhile, completing relevant policy formulation and forming a paradigm of environmental assessment of tourism in the context of carbon neutrality are also future research directions.
Data availability statement
The original contributions presented in the study are included in the article/supplementary material, further inquiries can be directed to the corresponding author.
Ethics statement
This study was reviewed and approved by Shandong University of Finance and Economics. The participants provided their written informed consent to participate in the study.
Author contributions
The author confirms being the sole contributor of this work and has approved it for publication.
Funding
This research was supported by the Social Science Planning Project in Shandong Province (Grant No. 22BLYJ08).
Acknowledgments
The author would like to thank the anonymous reviewers whose comments and suggestions helped to improve the manuscript.
Conflict of interest
The author declares that the research was conducted in the absence of any commercial or financial relationships that could be construed as a potential conflict of interest.
Publisher’s note
All claims expressed in this article are solely those of the authors and do not necessarily represent those of their affiliated organizations, or those of the publisher, the editors and the reviewers. Any product that may be evaluated in this article, or claim that may be made by its manufacturer, is not guaranteed or endorsed by the publisher.
Footnotes
References
Basu, A. K., Bhattacharya, A., Chowdhury, S., and Chowdhury, S. P. (2012). Planned scheduling for economic power sharing in a CHP-based micro-grid. IEEE Trans. Power Syst. 27, 30–38. doi: 10.1109/TPWRS.2011.2162754
Becken, S., Frampton, C., and Simmons, D. (2001). Energy consumption patterns in the accommodation sector—the New Zealand case. Ecol. Econ. 39, 371–386. doi: 10.1016/s0921-8009(01)00229-4
Becken, S., and Patterson, M. (2006). Measuring National Carbon Dioxide Emissions from tourism as a key step towards achieving sustainable tourism. J. Sustain. Tour. 14, 323–338. doi: 10.2167/jost547.0
Brezillon, J., Brodersen, O., Dwight, R., Ronzheimer, A., and Wild, J. (2006). Development and application of a flexible and efficient environment for aerodynamic shape optimisation// ODAS 2006 (ONERA DLR aerospace symposium). DLR
Chen, Y., Wen, J., and Cheng, S. (2013). Probabilistic load flow method based on Nataf transformation and Latin hypercube sampling. IEEE Trans. Sustain. Energy 4, 294–301. doi: 10.1109/TSTE.2012.2222680
Dong, Y., Wen, R., Li, Z., Zhang, K., and Zhang, L., "Clu-RNN: a new RNN based approach to diabetic blood glucose prediction," 2019 IEEE 7th International Conference on Bioinformatics and Computational Biology (ICBCB), (2019), pp. 50–55.
Dwyer, L., Forsyth, P., Spurr, R., and Hoque, S. (2010). Estimating the carbon footprint of Australian tourism[J]. J. Sustain. Tour. 18, 355–376. doi: 10.1080/09669580903513061
Geidl, M., Koeppel, G., Favre-Perrod, P., Klockl, B., Andersson, G., and Frohlich, K. (2007). Energy hubs for future. IEEE Power and Energy Magazine 5, 24–30. doi: 10.1109/MPAE.2007.264850
Guo, M., Zhao, X., Yao, Y., Yan, P., Su, Y., Bi, C., et al. (2021). A study of freeway crash risk prediction and interpretation based on risky driving behavior and traffic flow data. Accid. Anal. Prev. 160:106328. doi: 10.1016/j.aap.2021.106328
Hasani, R., Lechner, M., Amini, A., Rus, D., and Grosu, R. (2021). “Liquid time-constant networks,’’ in Proceedings of the AAAI Conference on Artificial Intelligence Vol. 35.
Huang, H. C., and Lin, S. K. (2019). A hybrid metaheuristic embedded system for intelligent vehicles using hyper-mutated firefly algorithm optimized radial basis functions neural network. IEEE Trans. Indus. Inform. 15, 1062–1069. doi: 10.1109/TII.2018.2796556
Kelly, J., and Williams, P. W. (2007). Modelling tourism destination energy consumption and greenhouse gas emissions: whistler, British Columbia, Canada. J. Sustain. Tour. 15, 67–90. doi: 10.2167/jost609.0
Kumar, P. M., Saravanakumar, R., Karthick, A., and Mohanavel, V. (2022). Artificial neural network-based output power prediction of grid-connected semitransparent photovoltaic system. Environ. Sci. Pollut. Res. 29, 1–10. doi: 10.1007/s11356-021-16398-6
Li, L. C., Qin, L. Q., Qu, X., Zhang, J., Wang, Y. G., and Ran, B. (2019). Day-ahead traffic flow forecasting based on a deep belief network optimized by the multi-objective particle swarm algorithm. Knowl.-Based Syst. 172, 1–14. doi: 10.1016/j.knosys.2019.01.015
Li, Z., Wang, K., Yu, F., and Xu, L. (2020). Study on the spatial and temporal differentiation of the coupled carbon emission-tourism economy-ecological environment coordination of Chinese tourism industry. Geogr. Inf. Sci. 110–118. doi: 10.3969/j.issn.1672-0504.2022.06.015
Liu, X. M., Ge, S. S., and Goh, C. H. (2019). Neural-network-based switching formation tracking control of multi-agents with uncertainties in constrained space. IEEE Trans Syst Man Cybern, Syst 49, 1006–1015. doi: 10.1109/TSMC.2017.2732679
Ma, M., Feng, W., Huo, J., and Xiang, X. (2022). Operational carbon transition in the megalopolises’ commercial buildings. Build. Environ. 226:109705. doi: 10.1016/j.buildenv.2022.109705
Masanet, E., Shehabi, A., Lei, N., Smith, S., and Koomey, J. (2020). Recalibrating global data center energy-use estimates. Science 367:3758. doi: 10.1126/science.aba3758
Mckay, M. D., Beckman, R. J., and Conover, W. J. (1979). A comparision of three methods for selecting values of input variables in the analysis of output from a computer code[J]. Technometrics 21, 239–245. doi: 10.1080/00401706.1979.10489755
Perch-Nielsen, S., Sesartic, A., and Stucki, M. (2010). The greenhouse gas intensity of the tourism sector: the case of Switzerland. Environ. Sci. Pol. 13, 131–140. doi: 10.1016/j.envsci.2009.12.002
Qu, Y. Y., Gong, L. Y., and He, W. (2019). An RNN-DBN approach to online shopping risk assessment. J. Harbin Univ. Technol. 24, 105–109.
Quan, S. J., and Bansal, P. (2021). A systematic review of GIS-based local climate zone mapping studies[J]. Build. Environ. 196:107791. doi: 10.1016/j.buildenv.2021.107791
Shahparasti, M., Mohamadian, M., Baboli, P. T., and Yazdianp, A. (2017). Toward power quality Management in Hybrid AC–DC microgrid using LTC-L utility interactive inverter: load voltage–grid current tradeoff. IEEE Trans. Smart Grid 8, 857–867. doi: 10.1109/tsg.2015.2480717
Shi, X., Wang, Z., Zhao, H., Qiu, S., Liu, R., Lin, F., et al. (2022). Threshold-free phase segmentation and zero velocity detection for gait analysis using foot-mounted inertial sensors. IEEE Trans. Hum. Machine Sys. 53, 176–186. doi: 10.1109/THMS.2022.3228515
Shi, P., Wu, P., Feng, L., et al. (2010). Research on the design of policy framework and strategic measures for emission reduction in China's tourism industry. J. Tourism 6, 123–144. doi: 10.1080/19388160.2010.481600
Tao, Y., Huang, Z., Wu, L., Yu, F., and Wang, K. (2014). Regional tourism, Ik carbon emission measurement and its factor decomposition in Jiangsu Province. J. Geogr. 69, 1438–1448. doi: 10.11821/dlxb201410004
Keywords: carbon neutrality, travelling economy, environmental evaluation, RNN, green development
Citation: Yu X (2023) The influence of regional tourism economy development on carbon neutrality for environmental protection using improved recurrent neural network. Front. Ecol. Evol. 11:1146887. doi: 10.3389/fevo.2023.1146887
Edited by:
Rita Yi Man Li, Hong Kong Shue Yan University, Hong Kong SAR, ChinaCopyright © 2023 Yu. This is an open-access article distributed under the terms of the Creative Commons Attribution License (CC BY). The use, distribution or reproduction in other forums is permitted, provided the original author(s) and the copyright owner(s) are credited and that the original publication in this journal is cited, in accordance with accepted academic practice. No use, distribution or reproduction is permitted which does not comply with these terms.
*Correspondence: Xiao Yu, MjAxNjU4NzZAc2R1ZmUuZWR1LmNu