 Qingxia Ma1,2
 Fengping Li1,2Jiawen Zheng1,2
 Chunsheng Liu1,2,3
 Aimin Wang1
 Yi Yang1,2,3*
 Zhifeng Gu1,2,3*
- 1State Key Laboratory of Marine Resource Utilization in South China Sea, Hainan University, Haikou, China
- 2College of Marine Science, Hainan University, Haikou, China
- 3Sanya Nanfan Research Institute, Hainan University, Haikou, China
Cowries (Family Cypraeidae) are widely distributed in tropical and subtropical seas, with the highest diversity of cowries in the Indo-Pacific region. However, the classification of Cypraeidae, especially at the lower taxonomic levels, is still controversial. In the present study, we determined the complete mitochondrial genomes of 10 cowries. All the newly sequenced mtDNA encode 13 protein-coding genes (PCGs), 22 transfer RNA (tRNA) genes, two ribosomal RNA (rRNA) genes, and several non-coding regions. The reconstructed mitogenomic phylogeny of Cypraeidae recognized two monophyletic clades, with the first clade comprised of Erroneinae, Cypraeinae and Luriinae and the second clade formed by the single subfamily Erosarinae. The congeneric genetic distance values fall within 0.118–0.144, lower than those above genus level ranging from 0.163 to 0.271, consistent with the current division of genera within Cypraeidae. The divergence time estimated here indicated that the ancestor of Indo-Pacific cowries diversified during the Paleocene, and the closure of the Tethys Seaway might lead to the speciation events of several Indo-Pacific species. This study suggests that the complete mtDNA is a promising tool to improve the phylogenetic resolution of Cypraeidae, and mtDNA could also provide important information for future species delimitation especially within the cowries that possess different morphological phenotypes.
Introduction
Belonging to family Cypraeidae (Rafinesque, 1815), cowries are widely distributed in tropical and subtropical seas, although some species have been adapted to temperate water environment. The highest diversity of cowries was found in the Indo-Pacific region, especially along the boundary between East Indian and West Pacific Ocean (Paulay and Meyer, 2006; Passamonti, 2015). This region is also the richest species area of reef-building corals (Malay and Paulay, 2010), and considered as a center of maximum marine biodiversity (Hoeksema, 2007). Cowries are usually characteristic with a brilliant and shiny shell, since the retractable mantle that could cover the entire shell helps clean up the shell attachment. The presence of a beautiful shell also imparts some cowry species high collection values among shell markets.
Traditional taxonomy of Cypraeidae was mainly based on shell and anatomical characteristics (Schilder and Schilder, 1938; Kay, 1957; Schilder, 1966; Burgess, 1985). Although the division within Cypraeidae, especially at generic or subgeneric level, were controversial, most of the previously identified subfamilies and genera have also been recognized by molecular phylogenies (Meyer, 2003, 2004). The current classification of Cypraeidae is divided into nine subfamilies and 55 genera (MolluscaBase, 2022). Different from the stable taxonomies at higher levels, those at species level and below are quite subjective. The major reason was due to the absence of molecular data, which could help determine the validity of their taxonomic status. On the other hand, the increased species number of cowries has been triggered by economic factors in shell market, leading to unnecessary proliferation of taxonomic names (Passamonti, 2015).
The typical metazoan mitochondrial (mt) genome is a covalently circular molecule, encoding 37 genes including 13 protein-coding genes (PCGs), two ribosomal RNA (rRNA) genes and 22 transfer RNA (tRNA) genes (Boore, 1999), although some exceptions have been reported (Lavrov et al., 2013; Lavrov and Pett, 2016). Compared with single gene fragments, mitochondrial genome could provide considerable amount of variant information which has been used in species identification (Abalde et al., 2017a,b) and phylogenetic construction (Uribe and Zardoya, 2017; Uribe et al., 2019) within Mollusca. In the present study, the complete mtDNA of 10 cowries representing four subfamilies were sequenced and compared together with those of other cowries published before. The reconstructed phylogenetic relationships as well as the pairwise genetic distance values in the present study could provide important information for future species delimitation especially within the cowries that possess different morphological phenotypes.
Materials and methods
Samples and DNA extraction
All the specimens of cowries were collected in Sanya and Lingshui, Hainan Province, China (Table 1). Samples were then deposited in 95% ethanol at 4°C.

Table 1. Mitochondrial (mt) genomes analysed in this study.
Genomic DNA was isolated from small pieces of foot tissue (less than 30 mg) using Tiangen Marine Animals DNA Kit (Tiangen Biotech, Beijing, China) following manufacturer’s instructions.
PCR amplification, de novo sequencing, and mitogenome assembly
The complete mitochondrial genome was amplified by using universal primers in a total volume of 20 μl using 10 μl of 2 × Taq PCR Master Mix (with Taq DNA polymerase, dNTP mixture, MgCl2, and PCR buffer), 0.5 μl of forward and reverse primers (10 μM), 3 μl of DNA and 6 μl of water. PCR conditions were set as follows: initial denaturation step was maintained at 94°C for 3 min, 40 denaturation cycles at 94°C for 30 s, annealing time at 46°C for 30 s, extension to 72°C for 1 min, and a final extension step at 72°C for 5 min. PCR products were sequenced at BGI (China).
Genomic DNA was sent to Novogene Company (Beijing, China) for library construction and high-throughput sequencing. A total of 10 libraries with insert sizes of approximately 300 bp were prepared and then sequenced as 150 bp paired-end runs on the Illumina NovaSeq 6000 platform. Finally, about 8 Gb of raw data were generated for each library. The clean reads were generated using Trimmomatic v.0.39 (Bolger et al., 2014), and imported into Geneious Prime 2021.0.1 (Kearse et al., 2012) for assembly following Irwin et al. (2021).
Gene annotation and sequence analysis
The newly obtained mitochondrial genomes of cowries were annotated with Geneious Prime (Kearse et al., 2012). The 13 PCGs were defined by setting their similarity values to 75–80% as previously published mitochondrial genomes of cowries and modified manually. The tRNA secondary structures were determined by ARWEN (Laslett and Canbäck, 2008). The boundaries of rRNA genes were identified by comparison with those of other cowries. Codon usage and pairwise genetic distances of 13 PCGs, and the nucleotide composition of the whole mitogenome, PCGS, tRNA and rRNA genes were calculated using MEGA X (Kumar et al., 2018). The base skew values were calculated as AT skew = (A − T)/(A + T) and GC skew = (G − C)/(G + C) (Perna and Kocher, 1995). The mitochondrial genome map was drawn by CGView (Grant and Stothard, 2008). The average pairwise ratio of nonsynonymous (Ka) to synonymous (Ks) between sequences for each gene was calculated using BUSTED analysis (Murrell et al., 2015) implemented on the Datamonkey server.1
Phylogenetic analysis
The phylogenetic analysis was conducted based on the concatenated nucleotide sequences of 13 PCGs and two rRNA genes. The PCGs were aligned with ClustalW implemented in MEGA X, while the rRNA alignment was conducted separately by MAFFT v7 (Katoh and Standley, 2013) with default parameters. Ambiguously aligned positions of rRNA alignments were removed using Gblocks v.0.91b (Castresana, 2000) with default parameters. Different gene alignments were concatenated together using Geneious Prime 2021.0.1. Sequences were converted into NEXUS and PHYLIP formats for further phylogenetic analyses using DAMBE5 (Xia, 2013).
Phylogenetic analyses were carried out using maximum likelihood (ML; Felsenstein, 1981) and Bayesian inference (BI; Huelsenbeck and Ronquist, 2001). ML analyses were carried out using IQtree 1.6.10 (Nguyen et al., 2015), allowing partitions to have different evolutionary rates (-spp option) and with 10,000 ultrafast bootstrap pseudoreplications (-bb option). BI was conducted using MrBayes v.3.1.2 (Ronquist and Huelsenbeck, 2003), running four Monte Carlo Markov chains (MCMC) simultaneously for 10,000,000 generations, sampling every 1,000 generations and discarding the first 25% generations as burn-in. Two independent runs were carried out to increase the chance of adequate mixing of the Markov chains and to increase the chance of detecting failure to converge, as determined using Tracer v1.6. The effective sample size (ESS) of all parameters was higher than 200, and the phylogenetic trees were visualized using FigTree v1.4.2.
The best partition schemes and best-fit substitution models were determined by PartitionFinder 2 (Lanfear et al., 2017) under the Bayesian Information Criterion (BIC; Schwarz, 1978). For the 13 PCGs, the partitions tested were all genes combined; all genes separated (except atp6-atp8 and nad4-nad4L); and genes grouped by subunits (atp, cob, cox, and nad). Additionally, these three partition schemes were tested considering separately the three codon positions. The two rRNA genes were analysed with two different schemes (genes grouped or separated).
Divergence time estimation
Divergence times of Cypraeidae were estimated based on the same data set used for phylogenetic reconstruction. An uncorrelated relaxed molecular clock model was employed using BEAST v.1.10.4 (Drummond and Rambaut, 2007). For tree prior, the Yule Process was chosen. The Markov chains were run twice for 100 million generations, sampled every 10,000 generations, and the first 10% of the samples were discarded as burn-in. The effective sample size of all the parameters was higher than 200, and the convergence of the chains was checked based on Tracer v1.6. Finally, the tree was generated by TreeAnnotator and visualized using FigTree v1.4.2.
The posterior distribution of the estimated divergence times was obtained by specifying two calibration points from the fossil data as priors for the divergence times of the corresponding splits. The first calibration point was set for the origin of Cypraea. A lognormal distribution was applied, with a minimum of 28.4 Mya and a 95% upper limit of 33.9 Mya (offset, 28.4; mean, 1.5; SD, 1.5) based on the fossil record of Cypraea sindiensis (Iqbal, 1980). The second calibration point was set at the divergence of Monetaria and Naria, with a minimum of 28.1 Mya and a 95% upper limit of 33.9 Mya (offset, 28.1; mean, 1.6; SD, 1.6) based on the fossil record of Monetaria found in Rupelian France (Cahuzac and Janssen, 2010).
Results and discussion
Genome structure, organization, and composition
Compared with other previously reported Cypraeidae mt genomes (Fukumori et al., 2019; Pu et al., 2019), all newly sequenced mt genomes in this study share very similar patterns in terms of genome size, nucleotide composition and AT content. The size of the 10 Cypraeidae mtDNA ranges from 15,648 (N. helvola) to 16,269 bp (Lyncina vitellus; Table 2). These Cypraeidae mt genomes are all composed of 13 PCGs, 22 tRNA genes and two rRNA genes, and the differences between these genomes are mainly in the non-coding regions. All the 13 PCGs, 14 tRNA genes (trnD, trnV, trnL1, trnL2, trnP, trnS1, trnS2, trnH, trnF, trnK, trnA, trnR, trnN, and trnI) and two rRNA genes (rrnL and rrnS) are encoded on the major strand, while the other eight tRNA genes are encoded on the minus strand (Figure 1).
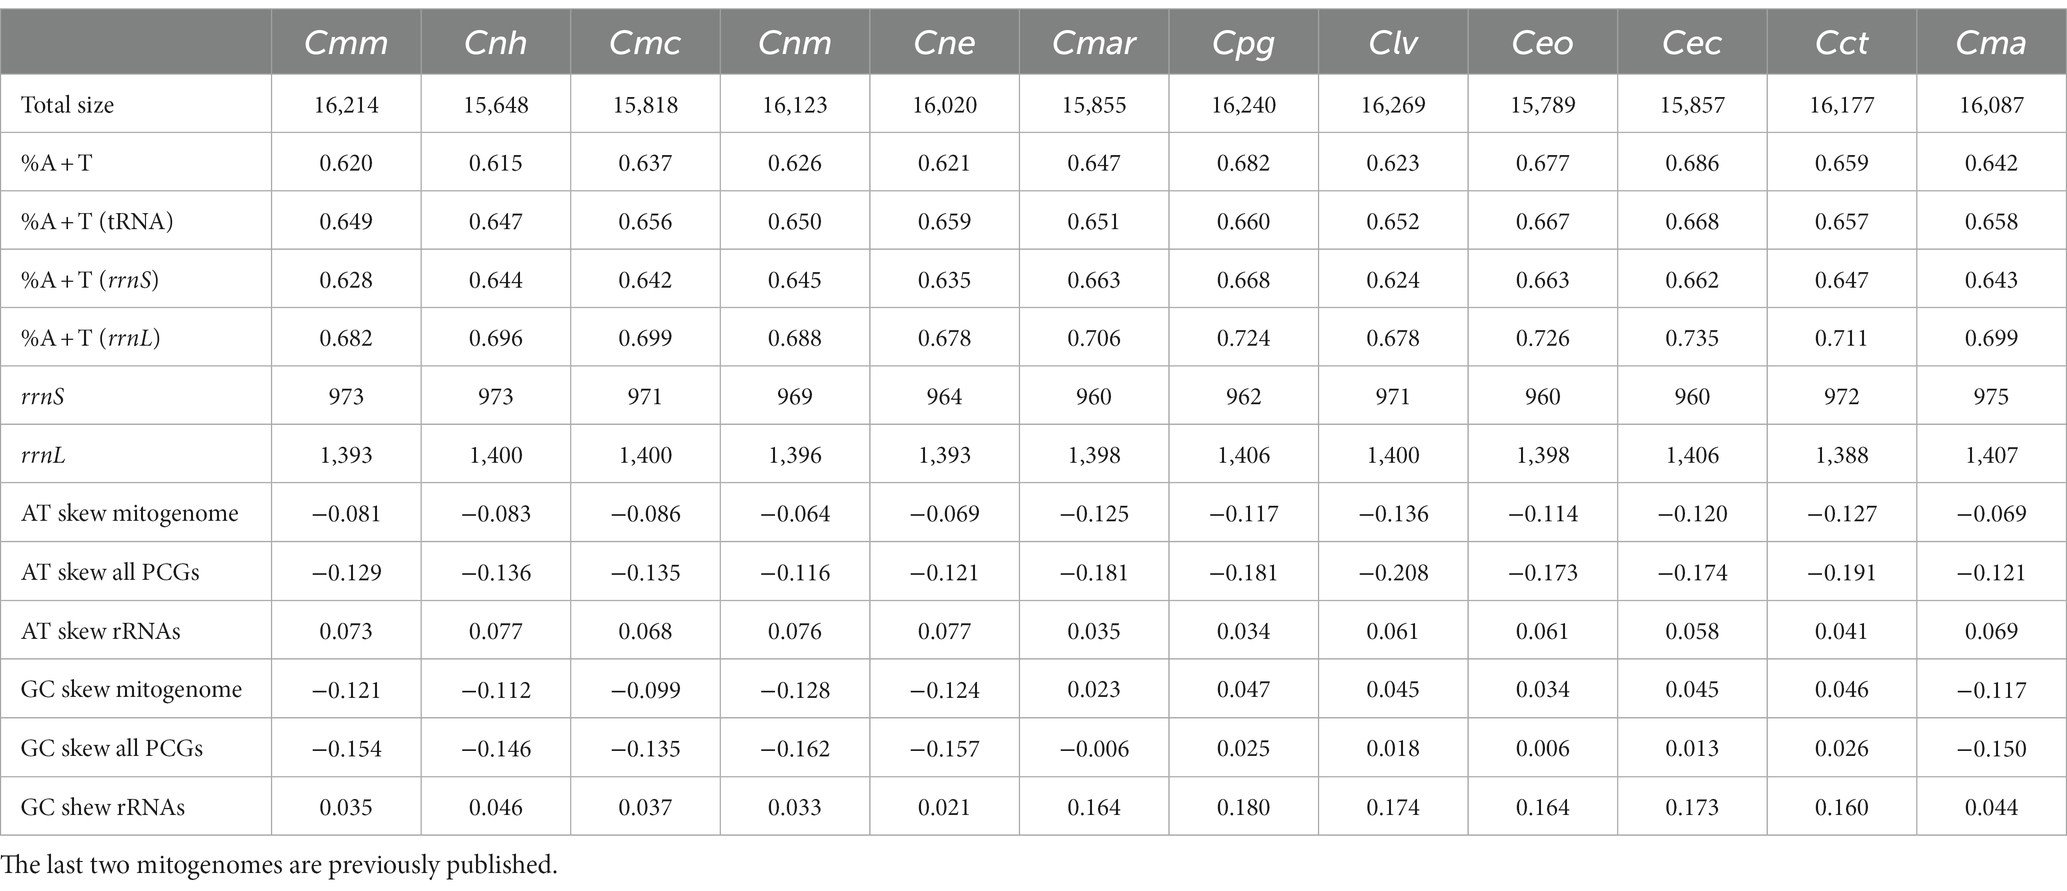
Table 2. List of total size, AT content, AT skew and GC skew, for mitochondrial genomes of Monetaria moneta (Cmm), Naria helvola (Cnh), Mauritia arabica (Cmar), Naria miliaris (Cnm), Naria erosa (Cne), Monetaria caputserpentis (Cmc), Purpuradusta gracilis (Cpg), Lyncina vitellus (Clv), Erronea onyx (Ceo), Erronea caurica (Cec), Cypraea tigris (Cct), and Monetaria annulus (Cma).
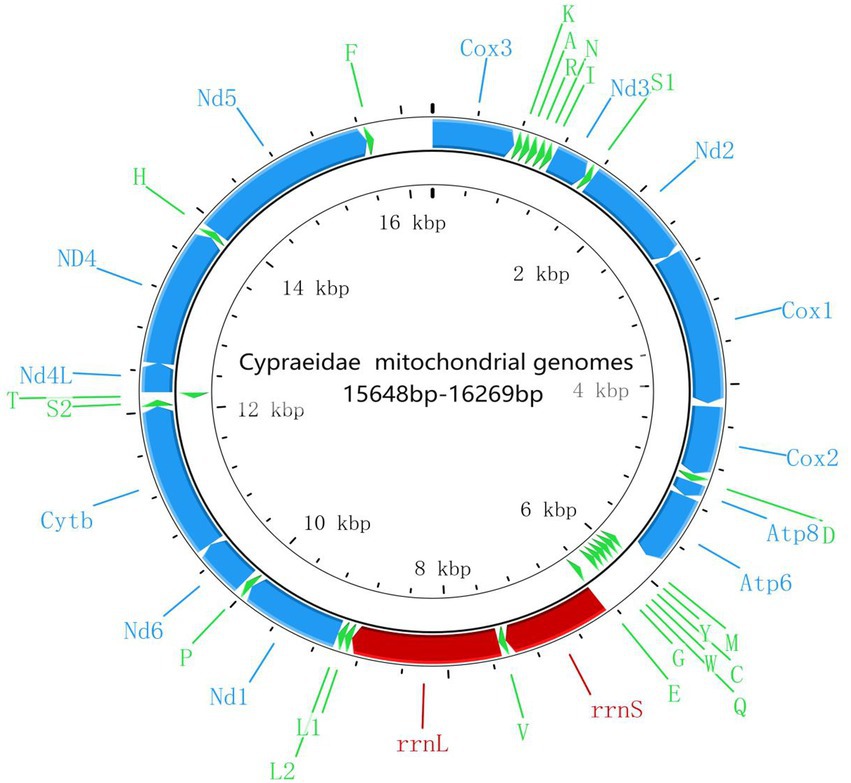
Figure 1. Gene map of the mt genomes of cowries.
The AT content, AT skew and GC skew of the 10 Cypraeidae mtDNA are shown in Table 2. The AT content of the 10 species ranges from 61.5 to 68.6%, similar to that reported for other molluscan taxa (Grande et al., 2008; Xu et al., 2012). All mitochondrial genomes show an A bias toward T (AT skew from −0.136 to −0.064), which is also seen in Vetigastropoda (Williams et al., 2014) and Neritimorpha (Arquez et al., 2014). Among the 10 mitogenomes, those of M. moneta, N. helvola, N. miliaris, N. erosa, and M. caputserpentis show a bias from G to C (GC skew from −0.128 to −0.099), with the same composition as M. annulus. The other five, including those of P. gracilis, M. arabica, L. vitellus, E. onyx, and E. caurica all show a bias from C to G (GC skew from 0.023 to 0.047) and similar to that of C. tigris. Both positive and negative GC skews have been reported within Metazoa (Saccone et al., 1999).
Protein-coding genes, transfer RNA, and ribosomal RNA genes
For the PCGs, 10 mitogenomes show negative AT skew, while GC skew was both positive and negative. All PCGs of the 10 newly sequenced Cypraeidae mt genomes started with the typical codons ATG and ATA except for the nad1, nad2, and nad6 genes of P. gracilis, and nad4 genes of M. arabica and N. miliaris, which used the alternative start codons GTG and ATT, respectively (Table 3). The latter alternative start codons ATT and GTG have also been reported in other gastropods (White et al., 2011; Osca et al., 2015; Uribe et al., 2016).

Table 3. The length, start and stop codons for mitochondrial genes of M. moneta (Cmm), N. helvola (Cnh), P. gracilis (Cpg), M. arabica (Cmar), N. miliaris (Cnm), L. vitellus (Clv), N. erosa (Cne), E. onyx (Ceo), E. caurica (Cec), and M. caputserpentis (Cmc).
All PCGs of the sequenced mitochondrial genomes terminate with complete stop codons TAA and TAG, except for the nad1 genes of M. moneta, N. erosa, and M. caputserpentis, which terminate with an incomplete stop codon TA. Incomplete stop codons may be modified to the TAA codon by polyadenylation of the transcribed messenger RNA (Ojala et al., 1981). The use of incomplete TA has also been reported in other gastropod species, such as Pyramidella dolabrata and Siphonaria pectinata (Grande et al., 2008).
The numbers of PCG codons for the 10 Cypraeidae mt genomes are from 3,745 (M. arabica) to 3,759 (N. helvola; including termination codons). The most encoded amino acid is leucine and the least encoded is cysteine (Table 4 and Supplementary Table S1, Figure 2 and Supplementary Figure S1). The most frequently used codon for E. onyx and P. gracilis is UUA (Leu). UUU (Phe) is the most frequently used codon for L. vitellus, M. caputserpentis, E. caurica, and M. arabica. While the most frequently used codon in E. erosa, M. moneta, N. helvola, and N. miliaris is AUU (Ile). The least frequently used codon in most mitogenomes is CGC (Arg), which is also reported in other invertebrates (Palomares-Rius et al., 2017). The least frequently used codons UCG(Ser), ACG(Thr), CGU(Arg), and GCG (Ala) are found in that of E. caurica, E. erosa, N. helvola, and N. miliaris, respectively. These frequently used codons, such as UUA (Leu), AUU (Ile), and UUU (Phe), all end in A or U and thus have a strong A + T bias at the third codon position, which results in an increased A + T content in the mitochondrial genome. These commonly used codons have also been observed in other invertebrates, such as Maldanidae and Siboglinidae in Annelida (Jennings and Halanych, 2005), and Longidoridae in Nematoda (Palomares-Rius et al., 2017).
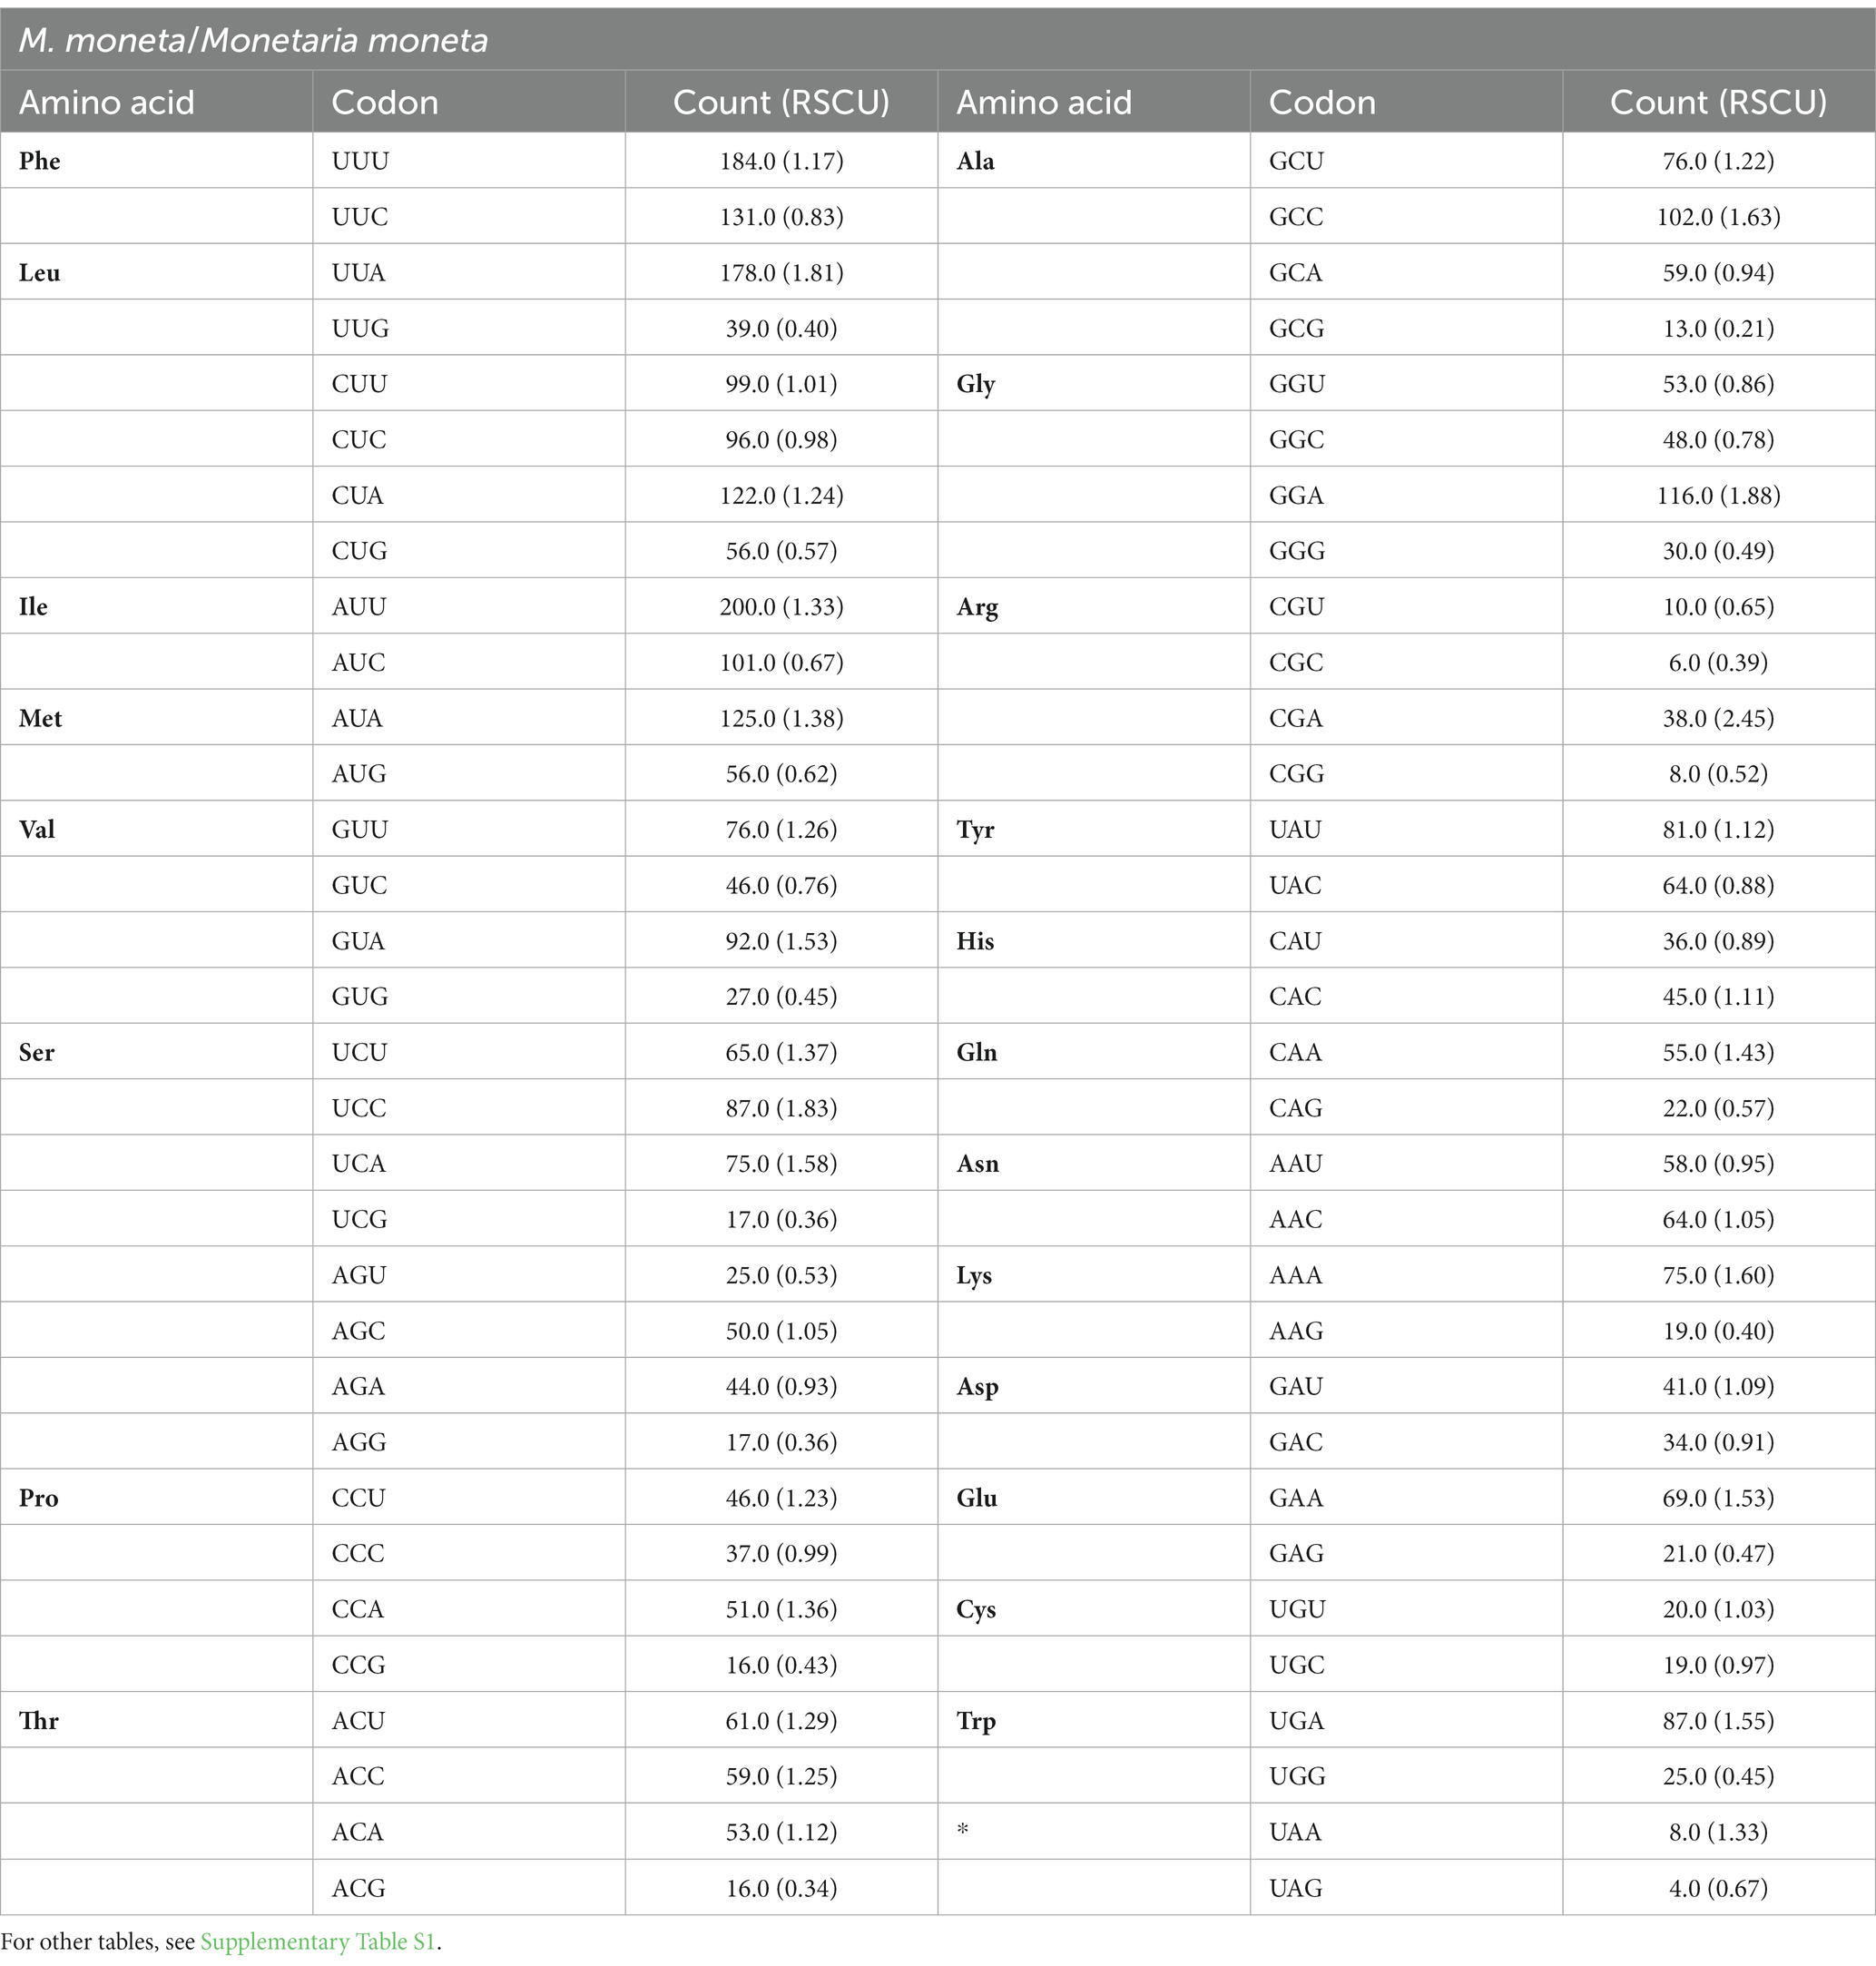
Table 4. Codon and relative synonymous codon usage (RSCU) of 13 PCGs in the mt genomes of M. monetab (Cmm), N. helvola (Cnh), P. gracilis (Cpg), M. arabica (Cmar), N. miliaris (Cnm), L. vitellus (Clv), N. erosa (Cne), E. onyx (Ceo), E. caurica (Cec), and M. caputserpentis (Cmc).
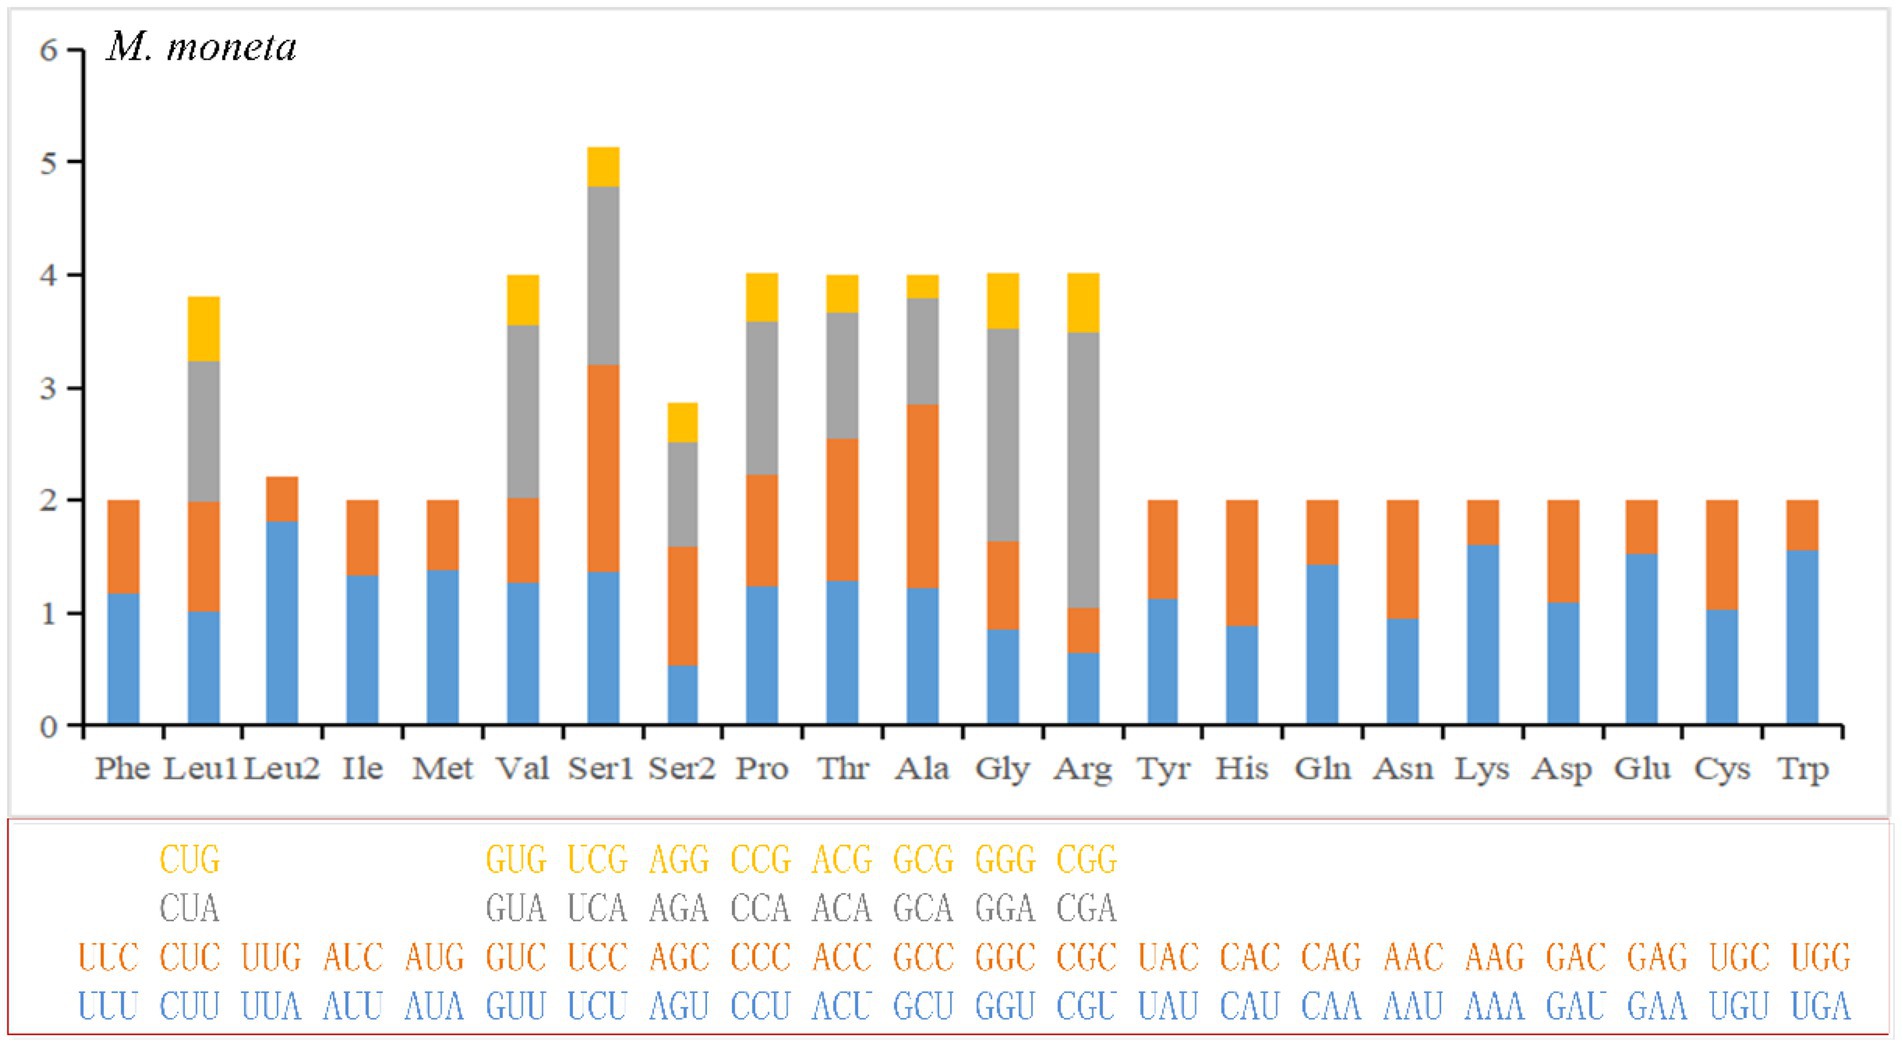
Figure 2. Relative Synonymoud Codon Usage (RSCU) of mitochondrial genomes for E. moneta. For other species, see Supplementary Figure S1.
The Ka/Ks ratios for each gene were all under 1.0, indicating the evidence of purifying selection (Figure 3). The highest average pairwise Ka/Ks ratio was found in atp8 gene with Ka/Ks = 0.054, followed by nad2, nad6 and nad3 genes with values ranging from 0.034 to 0.025. Whereas the lowest Ka/Ks ratio was found in cox1 with Ka/Ks = 0.002, followed by cox2, cox3, and atp6 genes (with values between 0.004 and 0.009; Figure 3). This result reveals that the NADH complex genes of cowries are suffering a more relaxed purifying selection compared with the COX genes which appear more conservative. Similar trends have also been detected in other gastropod taxa (Yang et al., 2018).
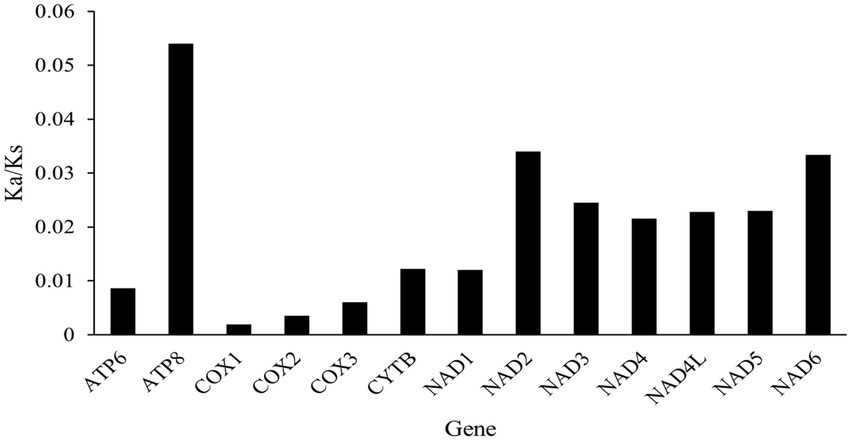
Figure 3. The Ka/Ks ratios of the 13 different mitochondrial genes in Cypraeidae species.
Most metazoan mitochondrial genomes contain 22 tRNAs, including two serines and two leucines (Podsiadlowski et al., 2008). The 10 Cypraeidae mt genomes also contain 22 tRNAs. The average AT content of tRNAs ranges from 64.7% (N. helvola) to 66.8% (E. caurica; Table 2). The tRNAs of these 10 Cypraeidae mt genomes are essentially the same length, ranging from 62 bp to 75 bp (Table 5 and Supplementary Table S2). And most of them can form a clover-like secondary structure, but the DHU arms of trnS-AGN are missing (Figure 4). The absence of the DHU arms of trnS-AGN are also common in metazoan mitogenomes (Garey and Wolstenholme, 1989), such as in those of Mytilus edulis (Hoffmann et al., 1992), Acanthocardia tuberculata and Hiatella arctica (Dreyer and Steiner, 2006).
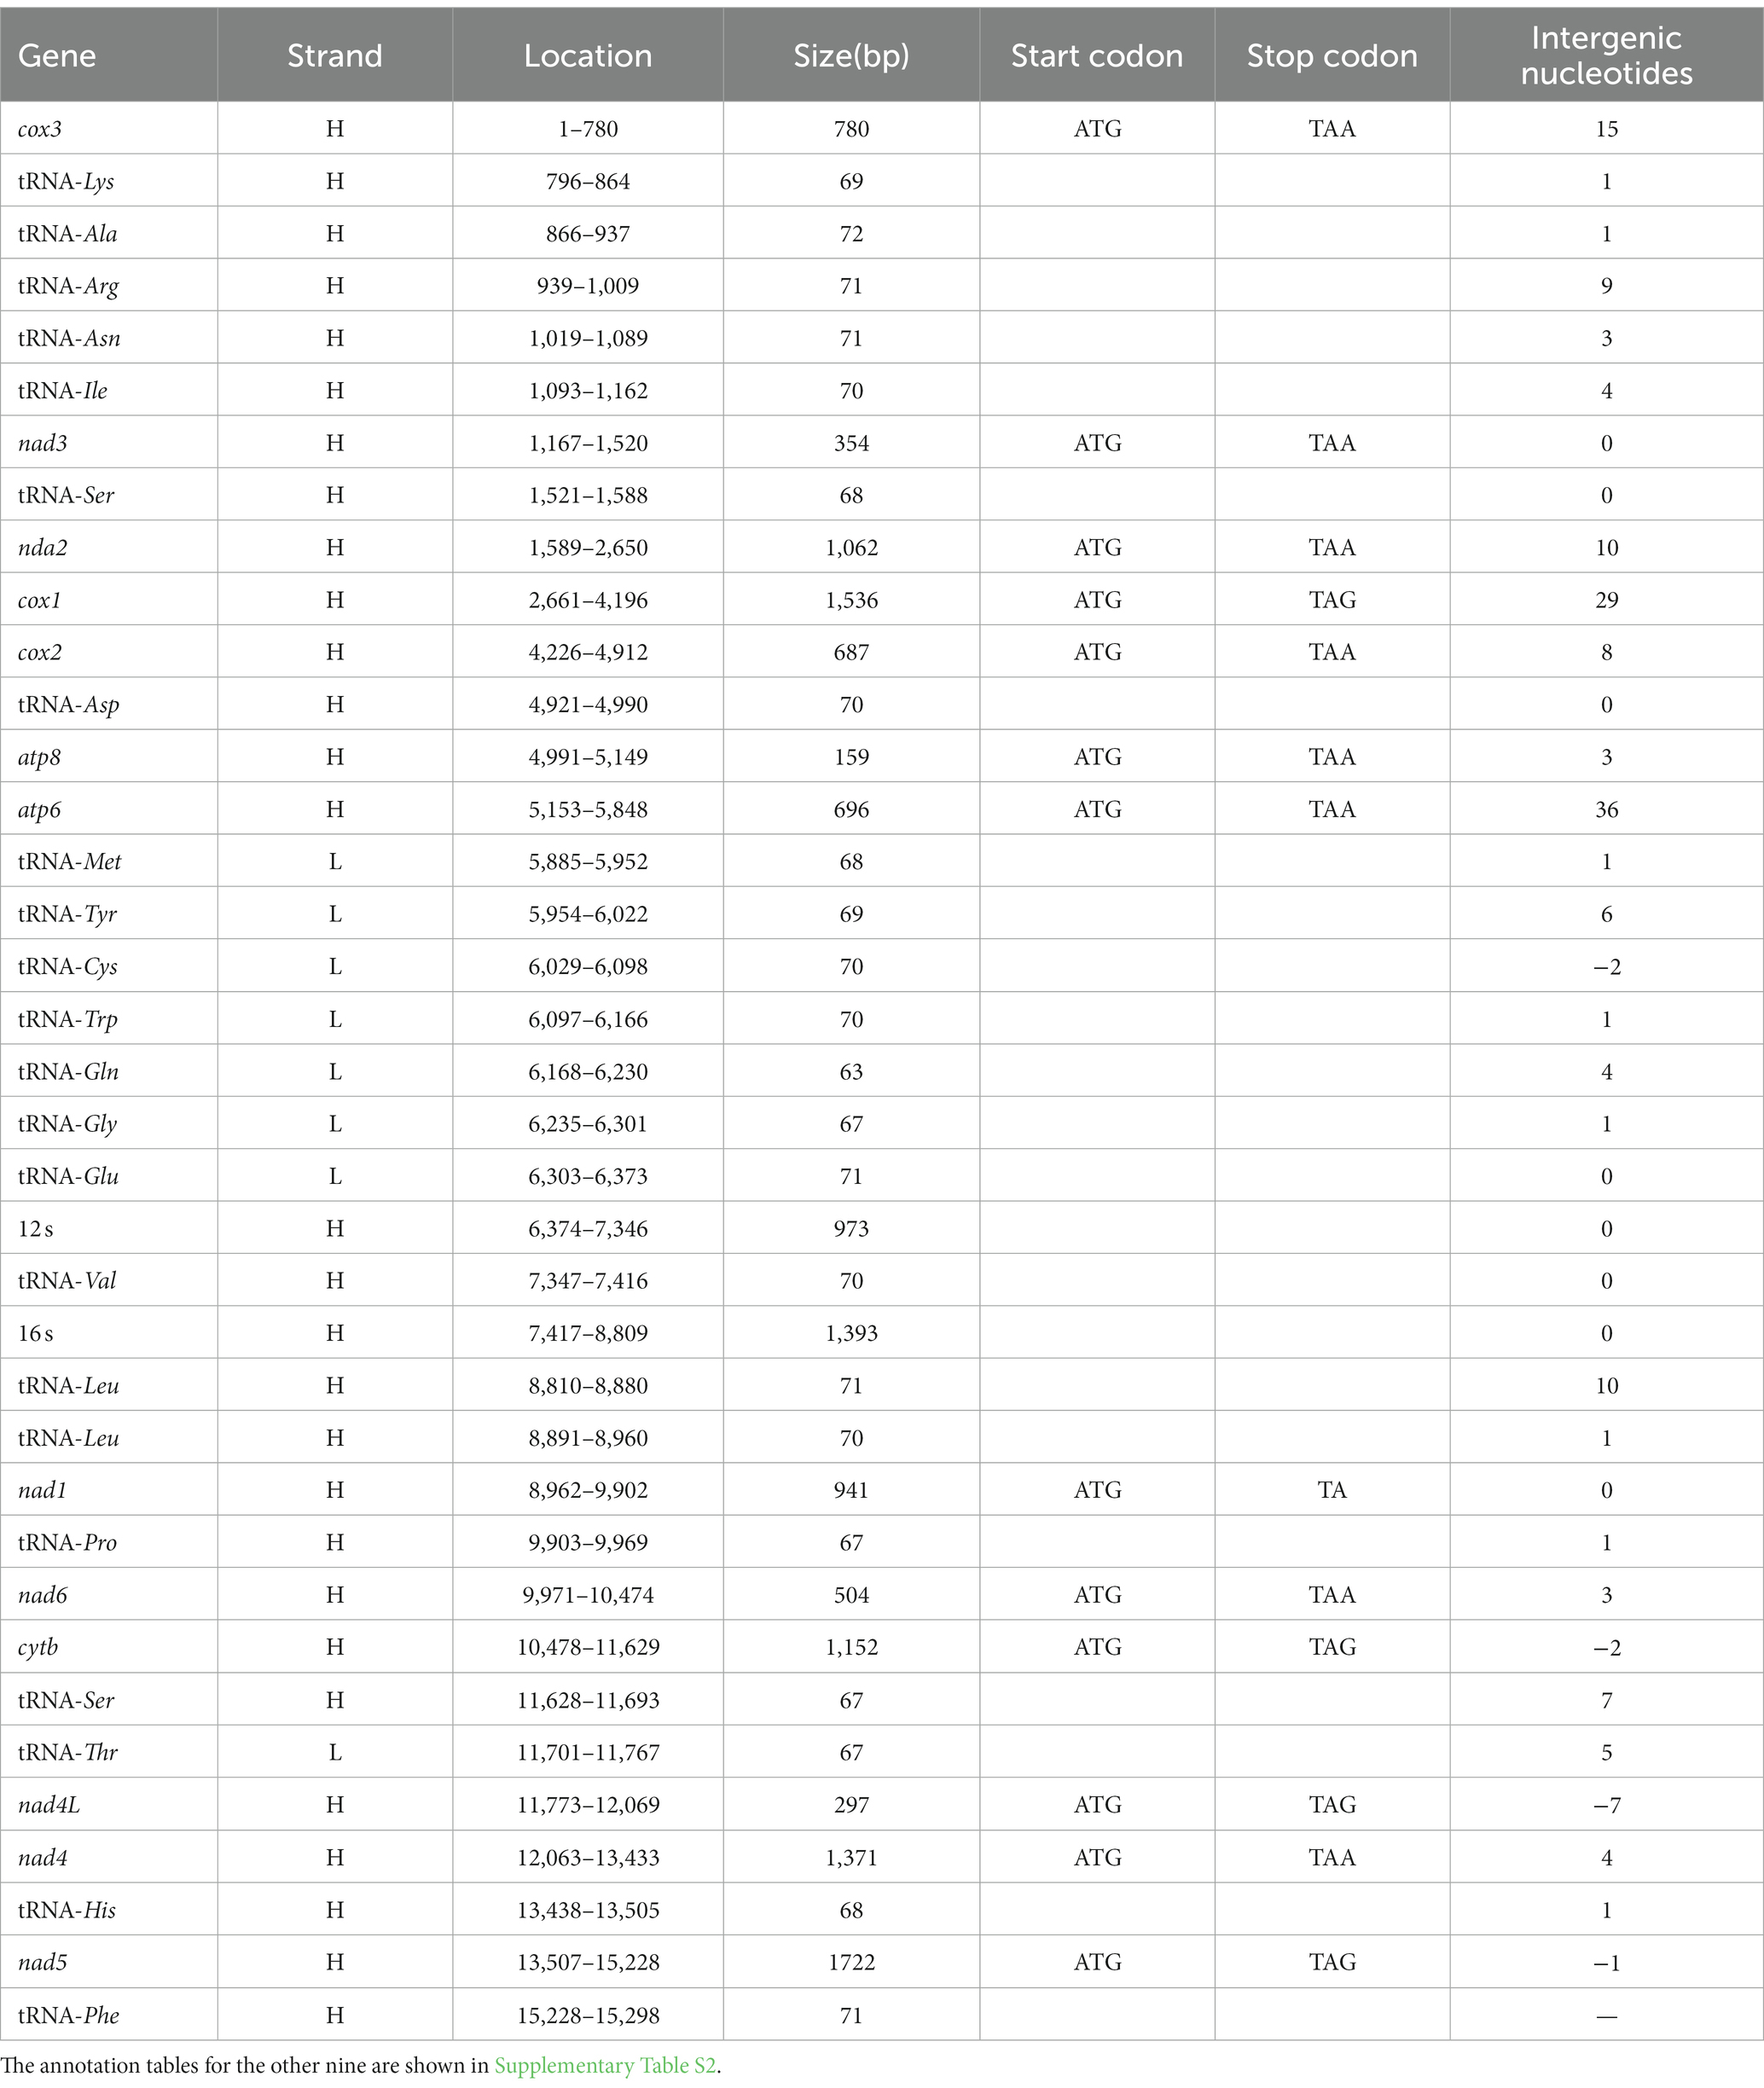
Table 5. Gene annotation of the complete mt genome of M. moneta.
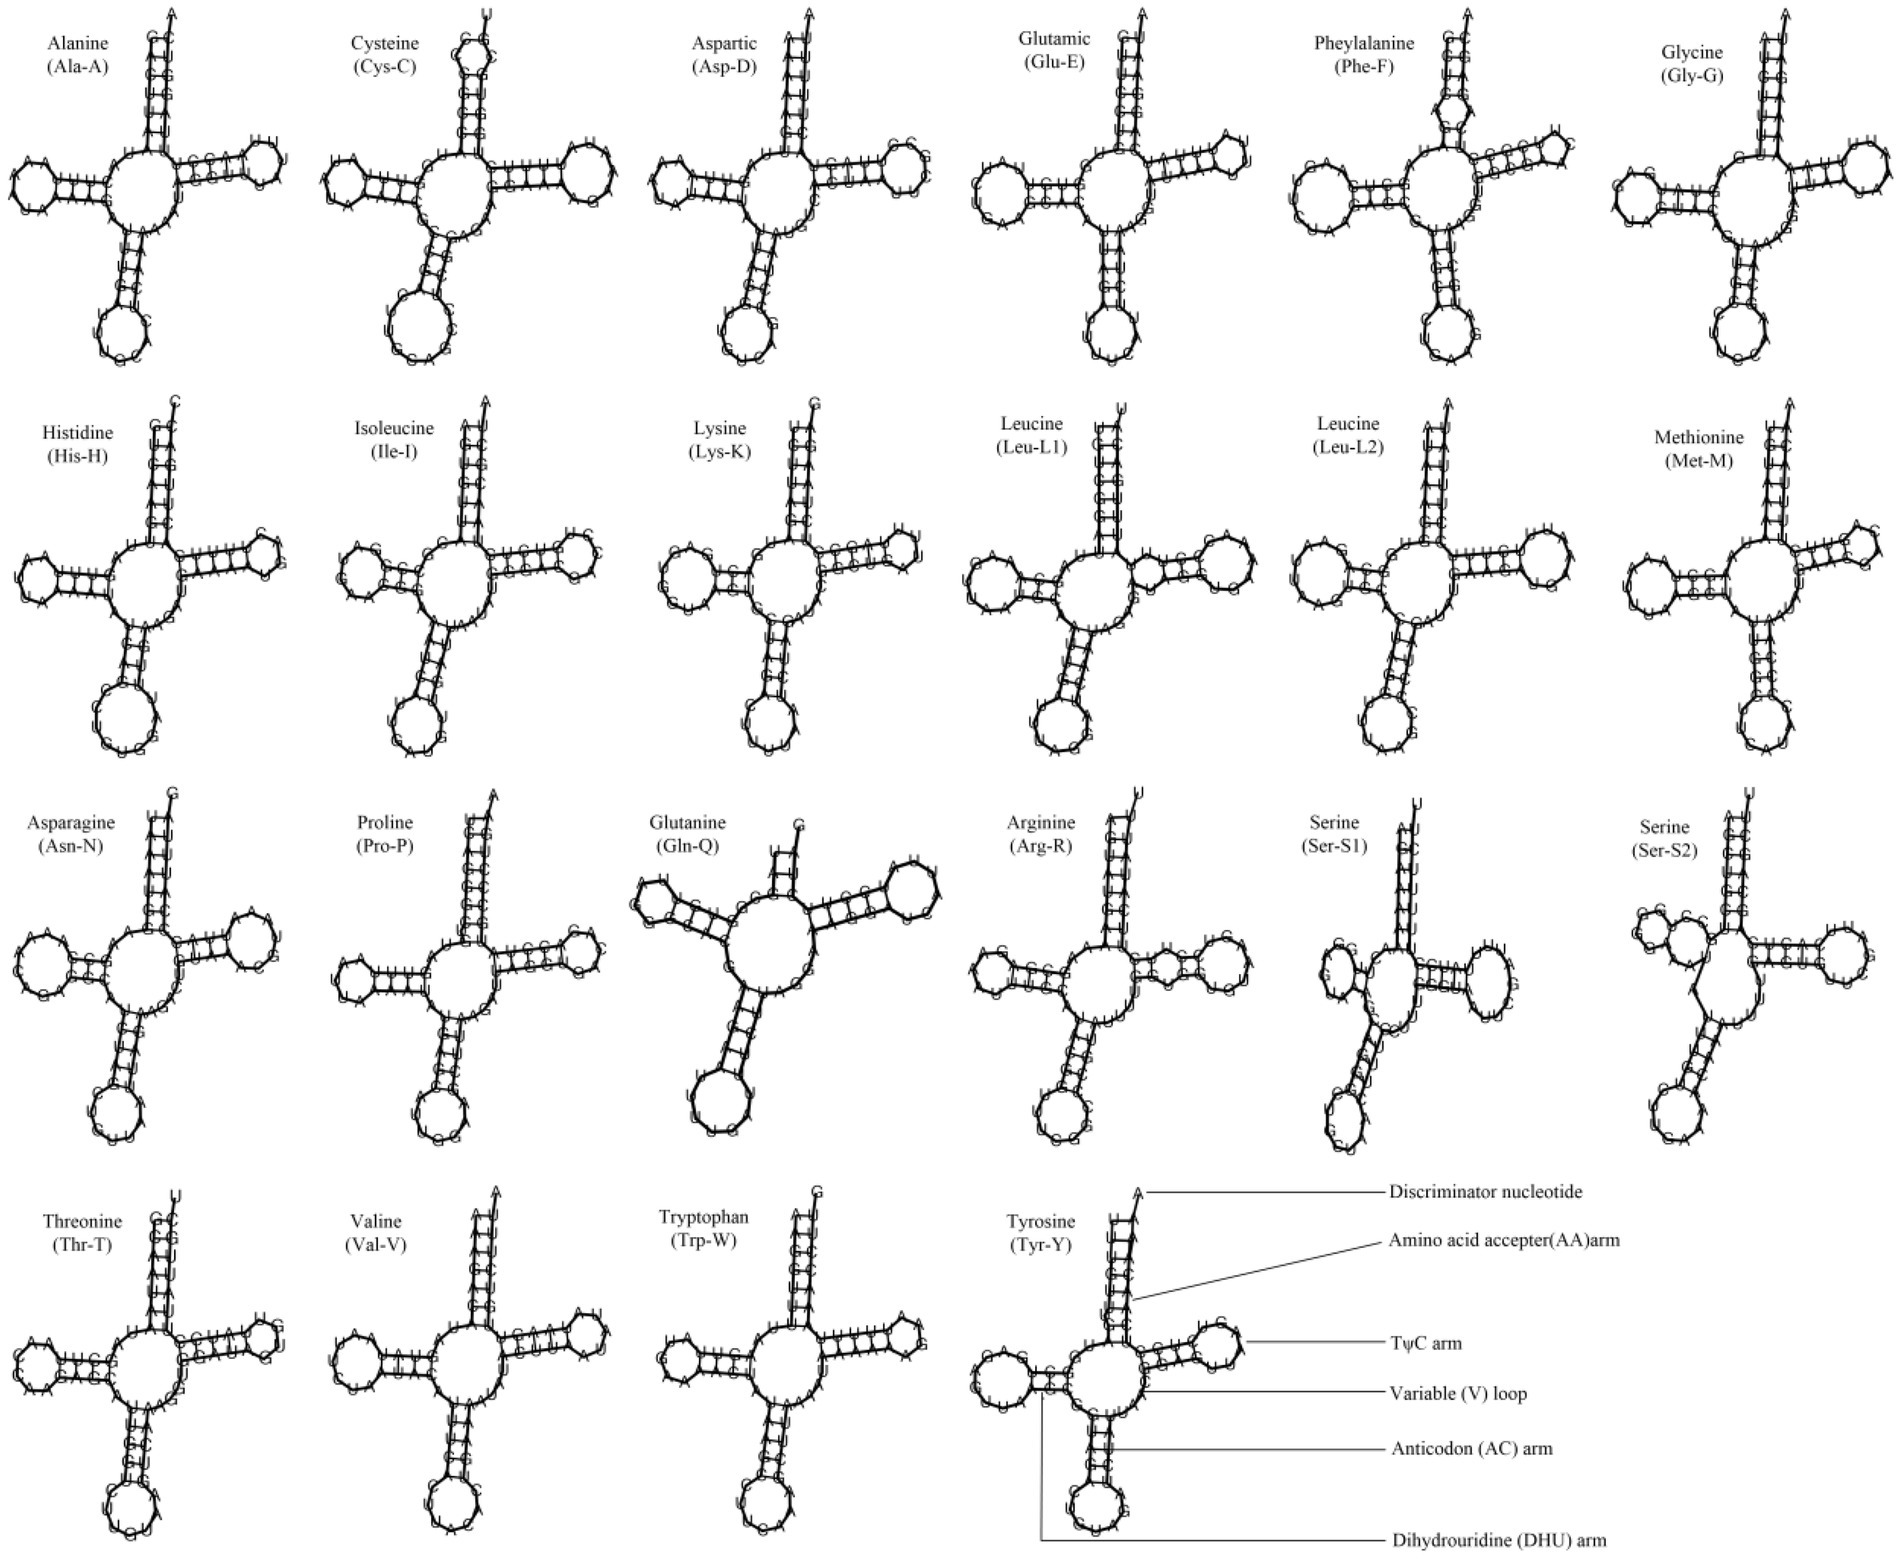
Figure 4. Inferred secondary structures of 22 tRNAs from Lyncina vitellus.
The rrnL genes of these 10 Cypraeidae mt genomes are from 1,393 bp (M. moneta and N. erosa) to 1,406 bp (P. gracilis) in length, with AT content ranging from 67.8 to 73.5%. The length of rrnS genes are from 960 bp (M. arabica, E. onyx, and E. caurica) to 973 bp (M. moneta and N. helvola), with AT content from 62.4 to 66.8%. The rrnL gene is surrounded by trnL and trnV, and the rrnS gene is located between trnV and trnE. The AT skew of rRNAs for the 10 species is from 0.034 to 0.077, all showing an A skew towards T. And the GC skew of rRNAs ranges from 0.021 to 0.180, all showing a C skew toward G (Table 2).
Phylogenetic relationship
Phylogenetic relationships of Cypraeidae were reconstructed based on the nucleotide sequences of the concatenated 13 PCGs and two rRNA genes using probabilistic methods. The final matrix was 13,323 bp in length. According to the BIC, the best partition scheme for the PCGs was the one combining genes by subunits but analysing each codon position separately (Supplementary Table S3). For the rRNA genes, the best partition scheme was the one combining together rrnL and rrnS genes. Both ML (−lnL = 133,593.77) and BI (−lnL = 133,905.39 for run 1; −lnL = 133,908.66 for run 2) analyses arrived at identical topologies (Figure 5).
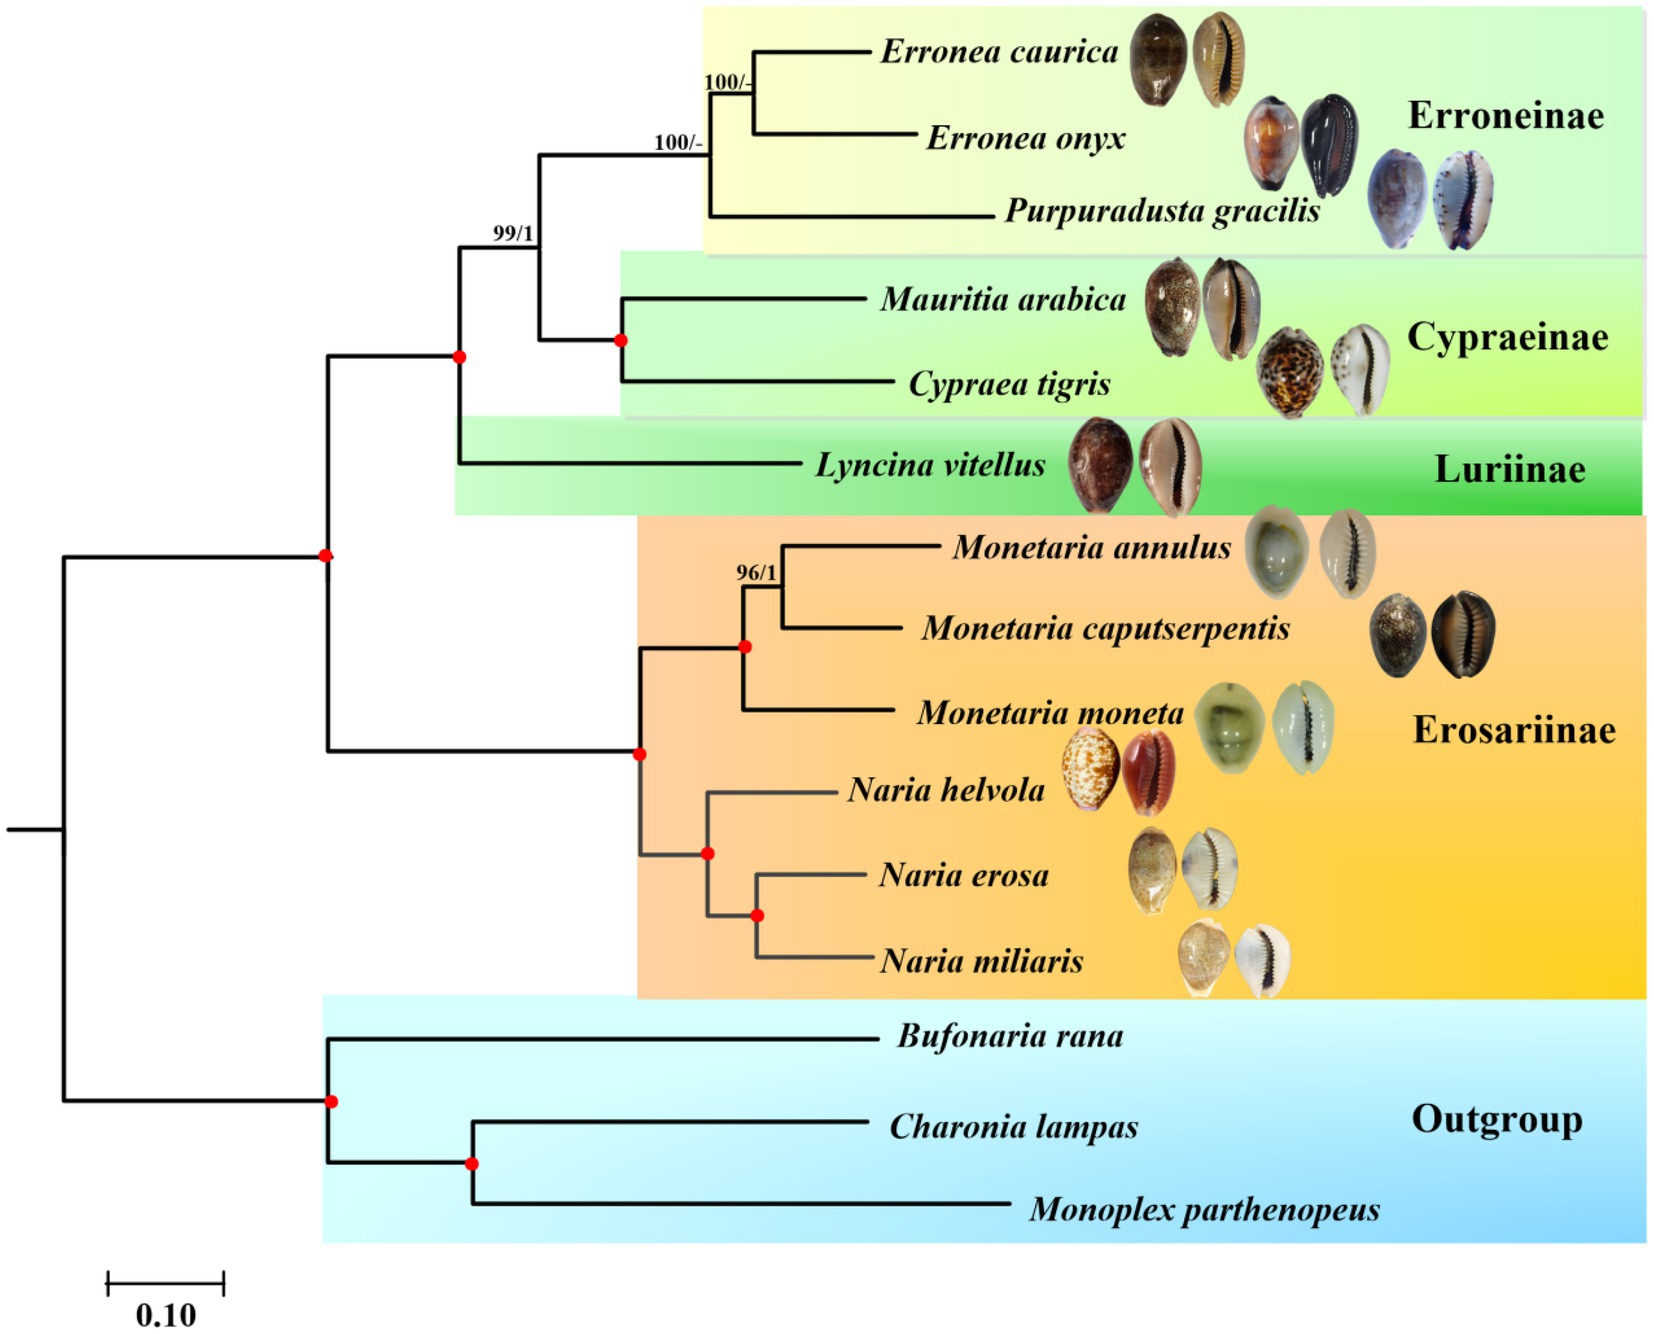
Figure 5. Phylogenetic relationships of Cypraeidae based on the nucleotide sequences of 13 mitochondrial protein-coding genes (PCGs) and 2 ribosomal RNA (rRNA) genes, with Bufonaria rana, Charonia lampas, and Monoplex parthenopeus as outgroups. The first number on each node is the bootstrap proportion (BP) of the maximum likelihood (ML) analysis. The second number is the Bayesian posterior probability (PP). Nodes with maximum statistical support (BP = 100; PP = 1) are marked with red solid circles.
According to the reconstructed phylogeny, a total of two clades are recognized and fully supported. The first clade (Clade I) is comprised of three monophyletic subfamilies including Erroneinae, Cypraeinae and Luriinae. The second clade (Clade II) is formed by the single subfamily Erosarinae. Within Clade I, Luriinae represented by the single species L. vitellus, is sister to Erroneinae + Cypraeinae. The radular morphology of a reduced shaft on all teeth is typical of the Luriinae. A previous study supported three lineages within Lyncina, with L. vitellus as sister to another Indo-West Pacific species L. lynx (Meyer, 2003). However, it also indicated that the internal phylogenetic relationships within Luriinae (especially between some genera, e.g., Chelycypraea, Austrocypraea, Miolyncina, Arestoides, Callistocypraea, and Lyncina) remained uncertain. Future mitogenomic phylogenies with a higher coverage of Luriinae are necessary to resolve the phylogenetic swarm. A second lineage of Clade I formed by Cypraea tigris and Mauritia arabica comprise Cypraeinae. Both two species are widely distributed in the Indo-West Pacific and contain several endemic subspecies (Meyer, 2003; Meyer and Tweedt, 2017; Cossignani and Allary, 2022), whose taxonomic ranges still need to be checked molecularly. In addition to Cypraea and Mauritia, Cypraeinae also includes another Indo-Pacific group Leporicypraea as well as the east Pacific clade including Muracypraea and Macrocypraea (MolluscaBase, 2022). And their phylogenetic relationships have been better resolved (Meyer, 2003). The last lineage of Clade I formed by Erronea and Purpuradusta correspond to Erroneinae. Both E. caurica and E. onyx include geographical subspecies that are not included in the present study.
Clade II is grouped by Monetaria and Naria, which all belong to subfamily Erosarinae. Within the former genus that is usually mentioned as money cowries, the Indo-West Pacific distributed M. annulus was divided into five geographical subspecies based on the morphological characteristics (Schilder and Schilder, 1938; Iredale, 1939). It has been revealed that the geographical variation of shell morphology (especially the callus thickness) was significantly related to seawater temperature instead of genetic differentiation (Irie, 2006). Although similar trends have also been detected in M. caputserpentis (Irie, 1997; Irie and Iwasa, 2003), this species contained two evolutionarily significant units (ESUs) that corresponded to Hawaii and the remaining Indo-Pacific region, respectively. On the contrary, no ESUs were discovered within the widely distributed M. moneta (Meyer, 2003). The latter genus Naria is comprised of N. helvola + (N. miliaris + N. erosa). This topology is consistent with that of Meyer (2003), in which N. miliaris was relatively more related to N. erosa. Furthermore, in another COI-based phylogenetic analysis N. helvola was recovered as sister to N. erosa (Hao, 2007), contradicting either Meyer (2003) or the present study. It has been indicated that different datasets or methods might result in different topologies (Irwin et al., 2021). Compared with previous single gene-based phylogenies, the phylogenetic relationship within Naria derived from complete mitochondrial genomes here is fully supported and considered better resolved. Among the three members of Naria, only N. erosa and N. helvola possessed ESUs (Meyer, 2003).
The pairwise genetic distance values within Cypraeidae are shown in Figure 6. The genetic distance is 0.119–0.236. The congeneric genetic distance values fall within0.119–0.149, lower than those above genus level which are mostly higher than 0.150 (Supplementary Table S4). This result is consistent with the current division of genera within Cypraeidae. At species level, the pairwise genetic distance analysis has been proved to be useful in species identification, especially among the cases of phenotypic convergence or phenotypic plasticity (Abalde et al., 2017a,b; Yang et al., 2018). It is necessary to include those previously identified species which were triggered by economic factors and determine their validity since many species were named subjectively.

Figure 6. Heatmap of pairwise genetic distance of 13 PCGs of Monetaria moneta (Cmm), Naria helvola (Cnh), Mauritia arabica (Cmar), Naria miliaris (Cnm), Naria erosa (Cne), Monetaria caputserpentis (Cmc), Purpuradusta gracilis (Cpg), Lyncina vitellus (Clv), Erronea onyx (Ceo), Erronea caurica (Cec), Cypraea tigris (Cct), and Monetaria annulus (Cma).
Divergence times
The speciation events within Cypraeidae were dated from about 62.4–11.6 Mya (Figure 7), with most diversifications falling after 30 Mya. In the present study, the primitive divergence of Cypraeidae was dated to 62.4 Mya, consistent with the fossil record of earlist Indo-Pacific coweries that was dated to the Paleocene (Kay, 1990). The ancestors of Indo-Pacific cowries diversified in the ancient Tethys which connected the Mediterranean Sea and Indo-Pacific. Most speciation events derived in this study happened during this epoch. The continental drift happened about 19 Mya led to the collision of Laurasia and Gondwana and the final closure of the Eastern Tethys Seaway around 14 Mya (Okay et al., 2010). After that the faunas of the Mediterranean and the Indo-Pacific evolved separately. The major diversifications within Naria and Monetaria estimated here (18.6–11.6 Mya, Figure 7) were likely correlated with this paleogeological change, and fossil records suggested the diversifications of these species were restricted to the Indo-Pacific (Kay, 1990).
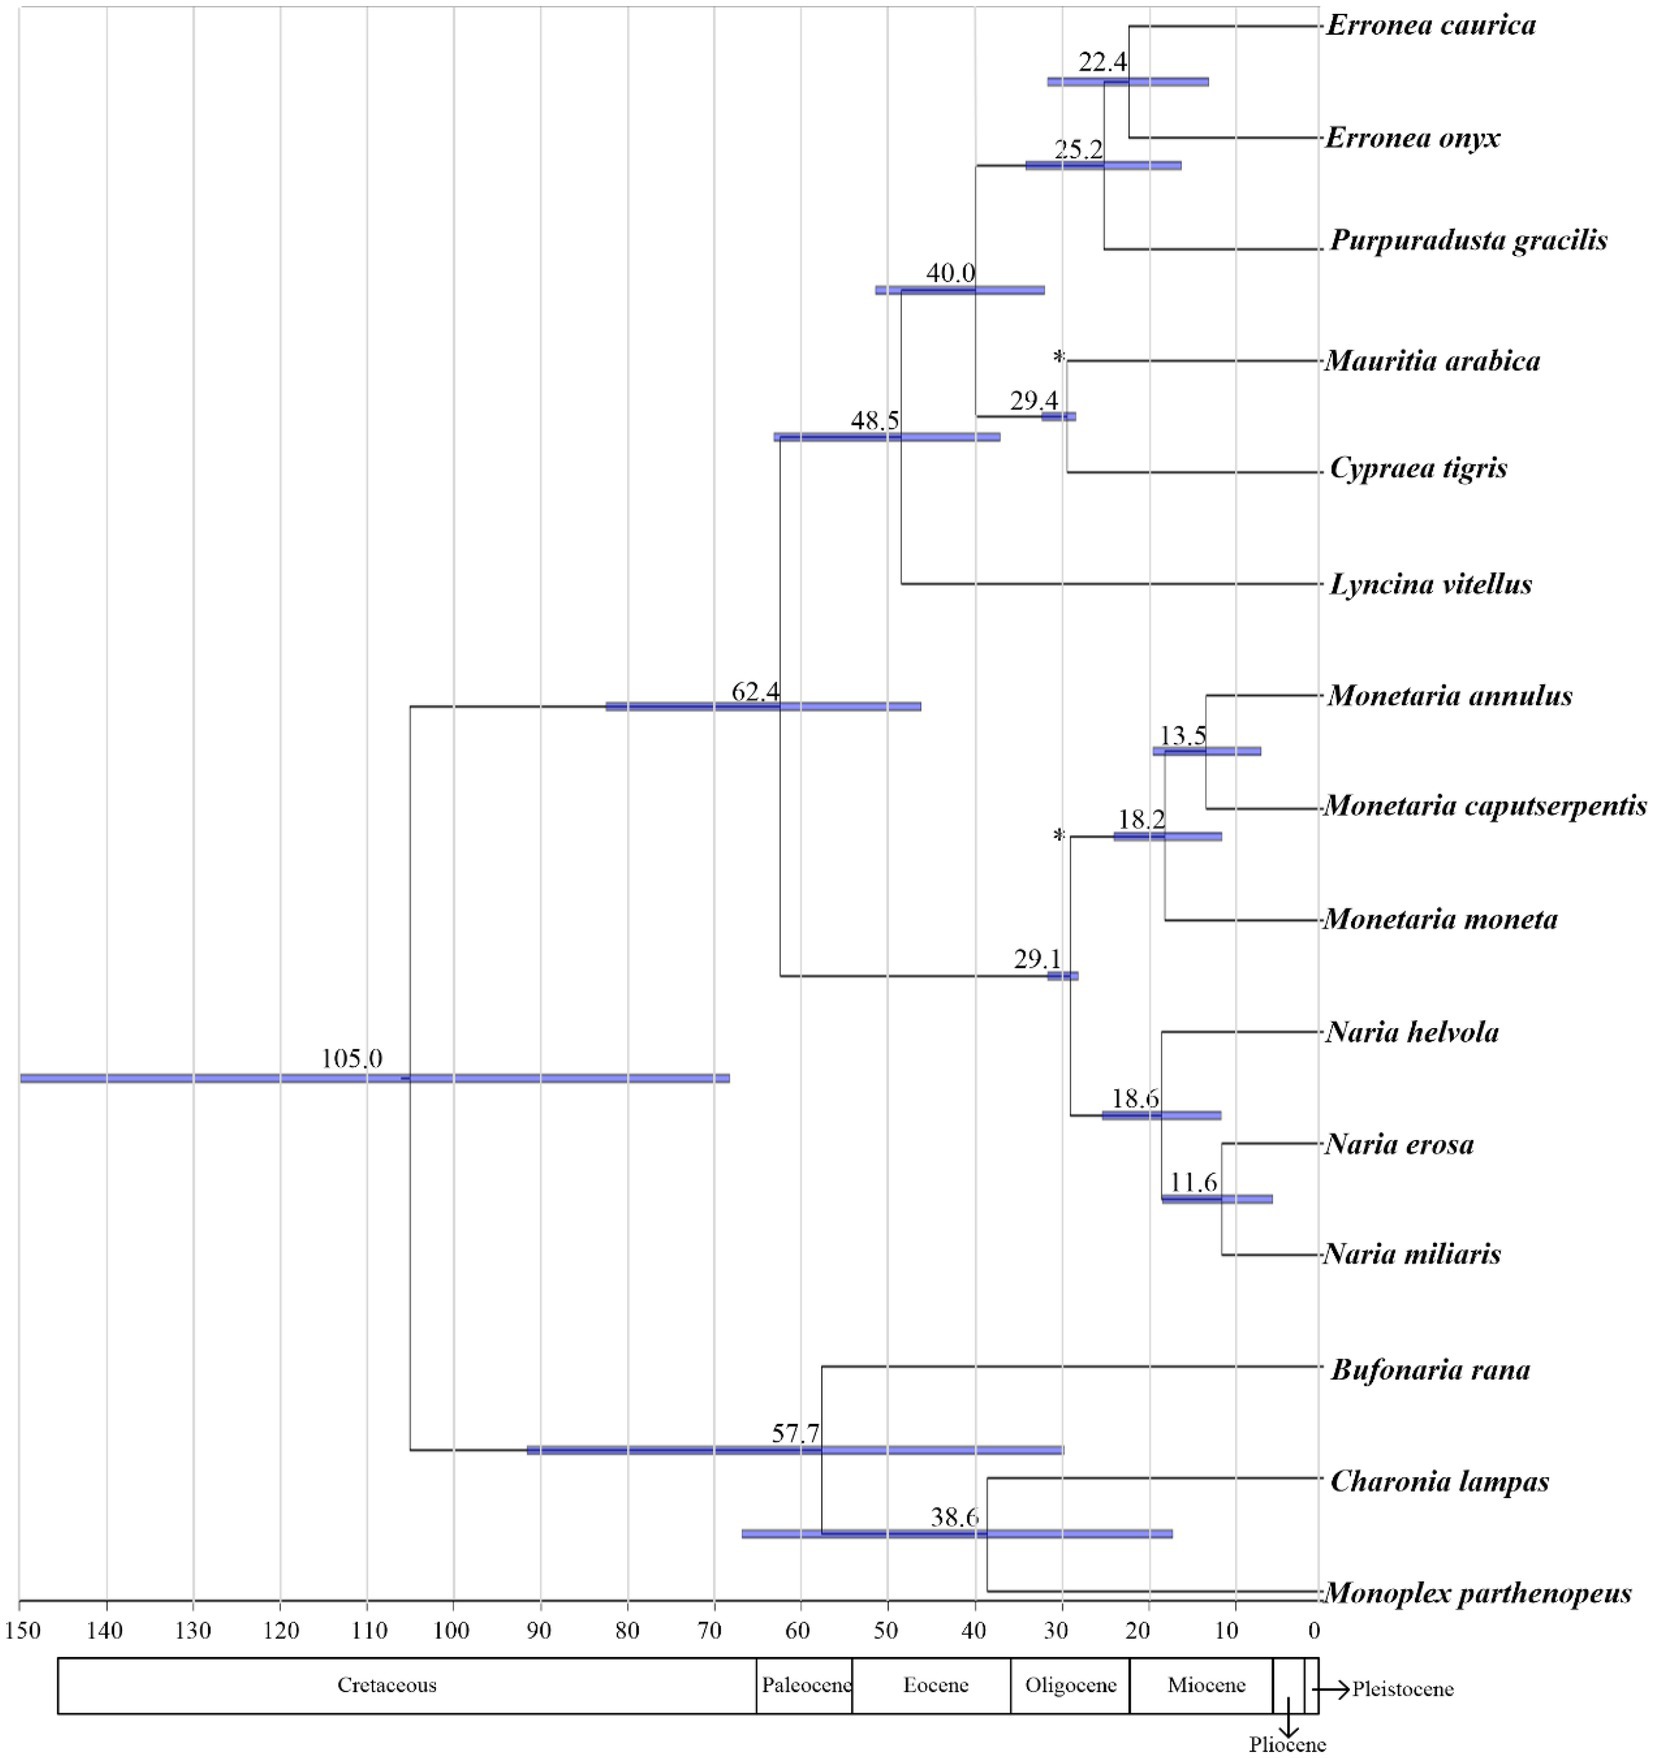
Figure 7. Divergences time estimations for the Cypraeidae using Bayesian relaxed dating methods (BEAST). Dates (and credibility intervals) are in millions of years, and horizontal bars represent 95% credibility intervals of relevant nodes.
Conclusion
In this study, we present the comparative mitogenomic analysis of family Cypraeidae. All the newly sequenced mtDNA together with those published before show similar patterns in terms of genome size, nucleotide composition and gene order. The pairwise genetic distance and phylogenetic analyses indicate the validity of current classification. The present study also calls for the inclusion of complete mtDNA of cowries with morphological phenotypes, whose taxonomic status are not determined. The divergence time estimated here suggest the ancestor of Indo-Pacific cowries diversified during the Paleocene, and the closure of the Tethys Seaway might lead to the speciation events of several Indo-Pacific species.
Data availability statement
The datasets presented in this study can be found in online repositories. The names of the repository/repositories and accession number(s) can be found at: https://www.ncbi.nlm.nih.gov/genbank/, OP729418; https://www.ncbi.nlm.nih.gov/genbank/, OP734446; https://www.ncbi.nlm.nih.gov/genbank/, OP714184; https://www.ncbi.nlm.nih.gov/genbank/, OP747190; https://www.ncbi.nlm.nih.gov/genbank/, OP738004; https://www.ncbi.nlm.nih.gov/genbank/, OP723877; https://www.ncbi.nlm.nih.gov/genbank/, OP714183; https://www.ncbi.nlm.nih.gov/genbank/, OP714185; https://www.ncbi.nlm.nih.gov/genbank/, OP714186; https://www.ncbi.nlm.nih.gov/genbank/, OP738519.
Author contributions
QM: data curation, formal analysis, investigation, and writing—original draft preparation. FL: data curation, investigation, and writing—review and editing. JZ: data curation and investigation. CL: software and supervision. AW: supervision and funding acquisition. YY: data curation, formal analysis, methodology, funding acquisition, supervision, and writing—review and editing. ZG: supervision and funding acquisition. All authors contributed to the article and approved the submitted version.
Funding
This research was funded by the National Key Research and Development Program of China (2019YFD0901301), the Hainan Provincial Natural Science Foundation of China (322QN260), and Key Research and Development Project of Hainan Province (ZDYF2021SHFZ269).
Conflict of interest
The authors declare that the research was conducted in the absence of any commercial or financial relationships that could be construed as a potential conflict of interest.
Publisher’s note
All claims expressed in this article are solely those of the authors and do not necessarily represent those of their affiliated organizations, or those of the publisher, the editors and the reviewers. Any product that may be evaluated in this article, or claim that may be made by its manufacturer, is not guaranteed or endorsed by the publisher.
Supplementary material
The Supplementary material for this article can be found online at: https://www.frontiersin.org/articles/10.3389/fevo.2023.1138297/full#supplementary-material
Footnotes
References
Abalde, S., Tenorio, M. J., Afonso, C. M., Uribe, J. E., Echeverry, A. M., and Zardoya, R. (2017a). Phylogenetic relationships of cone snails endemic to Cabo Verde based on mitochondrial genomes. BMC Evol. Biol. 17:231. doi: 10.1186/s12862-017-1069-x
Abalde, S., Tenorio, M. J., Afonso, C. M., and Zardoya, R. (2017b). Mitogenomic phylogeny of cone snails endemic to Senegal. Mol. Phylogenet. Evol. 112, 79–87. doi: 10.1016/j.ympev.2017.04.020
Arquez, M., Colgan, D., and Castro, L. R. (2014). Sequence and comparison of mitochondrial genomes in the genus nerita (gastropoda: neritimorpha: neritidae) and phylogenetic considerations among gastropods. Mar. Genomics 15, 45–54. doi: 10.1016/j.margen.2014.04.007
Ashlin, H. T., Quentin, K., David, J. C., and Christina, I. S. (2020). Early development of Monoplex pilearis and Monoplex parthenopeus (Gastropoda: Cymatiidae): biology and morphology. Org. Divers. Evol. 20, 51–62. doi: 10.1007/s13127-020-00432-5
Bolger, A. M., Lohse, M., and Usadel, B. (2014). Trimmomatic: a flexible trimmer for Illumina sequence data. Bioinformatics 30, 2114–2120. doi: 10.1093/bioinformatics/btu17
Boore, J. L. (1999). Animal mitochondrial genomes. Nucleic Acids Res. 27, 1767–1780. doi: 10.1093/nar/27.8.1767
Burgess, C. M. (1985). Cowries of the World. Cape Town, S. Africa: Gordon Verhoef, Seacomber Publications. 1–288.
Cahuzac, B., and Janssen, A. W. (2010). Eocene to Miocene holoplanktonic Mollusca (Gastropoda) of the Aquitaine Basin, Southwest France. Scripta Geol. 141, 1–193.
Castresana, J. (2000). Selection of conserved blocks from multiple alignments for their use in phylogenetic analysis. Mol. Biol. Evol. 17, 540–552. doi: 10.1093/oxfordjournals.molbev.a026334
Choi, E. H., and Hwang, U. W. (2021). The complete mitochondrial genome of an endangered triton snail Charonia lampas (Littorinimorpha: Charoniidae) from South Korea. Mitochondrial DNA B Resour. 6, 956–958. doi: 10.1080/23802359.2021.1889416
Cossignani, T., and Allary, A. (2022). Cypraea tigris peterstimpsoni nuova sottospecie dall’Indonesia. Malacologia Mostra Mondiale 115, 35–36.
Dreyer, H., and Steiner, G. (2006). The complete sequences and gene organisation of the mitochondrial genomes of the heterodont bivalves Acanthocardia tuberculata and Hiatella arctica – and the first record for a putative Atpase subunit 8 gene in marine bivalves. Front. Zool. 3:13. doi: 10.1186/1742-9994-3-13
Drummond, A., and Rambaut, A. (2007). BEAST: Bayesian evolutionary analysis by sampling trees. BMC Evol. Biol. 7:214. doi: 10.1186/1471-2148-7-214
Felsenstein, J. (1981). Evolutionary trees from DNA sequences: a max-imum likelihood approach. J. Mol. Evol. 17, 368–376. doi: 10.1007/BF01734359
Fukumori, H., Itoh, H., and Irie, T. (2019). The mitochondrial genome of the gold-ringed cowry Monetaria annulus (Mollusca: Gastropoda: Cypraeidae) determined by whole-genome sequencing. Mitochondrial DNA B Resour. 4, 2305–2307. doi: 10.1080/23802359.2019.1627946
Garey, J. R., and Wolstenholme, D. R. (1989). Platyhelminth mitochondrial DNA: evidence for early evolutionary origin of a tRNAserAGN that contains a dihydrouridine arm replacement loop, and of serine-specifying AGA and AGG codons. J. Mol. Evol. 28, 374–387. doi: 10.1007/BF02603072
Grande, C., Templado, J., and Zardoya, R. (2008). Evolution of gastropod mitochondrial genome arrangements. BMC Evol. Biol. 8:61. doi: 10.1186/1471-2148-8-61
Grant, J. R., and Stothard, P. (2008). The CGView server: a comparative genomics tool for circular genomes. Nucleic Acids Res. 36, W181–W184. doi: 10.1093/nar/gkn179
Hao, J. (2007). Phylogenetic relationships of Cypaeidae gastropods (Mollusca) based on mitochondrial COI gene sequences. Acta Pharmacol. Sin. 14, 123–128. doi: 10.1016/S1005-8885(07)60162-9
Hoeksema, B. W. (2007). “Delineation of the indo-Malayan Centre of maximum marine biodiversity: the coral triangle” in Biogeography, Time, and Place: Distributions, Barriers, and Islands (Dordrecht: Springer), 117–178.
Hoffmann, R. J., Boore, J. L., and Brown, W. M. (1992). A novel mitochondrial genome organization for the blue mussel, Mytilus edulis. Genetics 131, 397–412. doi: 10.1093/genetics/131.2.397
Huelsenbeck, J. P., and Ronquist, F. (2001). MRBAYES: bayesian inference of phylogenetic trees. Bioinformatics 17, 754–755. doi: 10.1098/rstb.1996.0082
Iqbal, M. W. A. (1980). Oligo. -Miocene Bivalves & Gastropods from Kirthar Province, lower Indus Basin, Pakistan (Vol. 51). Geological Survey of Pakistan.
Irie, T. (1997). Relationship between geographic variation of shell structure and water temperature in Cypraea caputserpentis (Gastropoda: Cypraeidae). Yuriyagai 5, 17–29.
Irie, T. (2006). Geographical variation of shell morphology in Cypraea annulus (Gastropoda: Cypraeidae). J. Mollus. Stud. 72, 31–38. doi: 10.1093/mollus/eyi043
Irie, T., and Iwasa, Y. (2003). Optimal growth model for the latitudinal cline of shell morphology in cowries (genus Cypraea). Evol. Ecol. Res. 5, 1133–1149.
Irwin, A. R., Strong, E. E., Kano, Y., Harper, E. M., and Williams, S. T. (2021). Eight new Mitogenomes clarify the phylogenetic relationships of Stromboidea within the Caenogastropod phylogenetic framework. Mol. Phylogenet. Evol. 158:107081. doi: 10.1016/j.ympev.2021.107081
Jennings, R. M., and Halanych, K. M. (2005). Mitochondrial genomes of Clymenella torquata (Maldanidae) and Riftia pachyptila (Siboglinidae): evidence for conserved gene order in Annelida. Mol. Biol. Evol. 22, 210–222. doi: 10.1093/molbev/msi008
Katoh, K., and Standley, D. M. (2013). MAFFT multiple sequence alignment software version 7: improvements in performance and usability. Mol. Biol. Evol. 30, 772–780. doi: 10.1093/molbev/mst010
Kay, A. E. (1990). Cypraeidae of the indo-Pacific: Cenozoic fossil history and biogeography. Bull. Mar. Sci. 47, 23–34.
Kearse, M., Moir, R., Wilson, A., Stones-Havas, S., Cheung, M., Sturrock, S., et al. (2012). Geneious basic: an integrated and extendable desktop software platform for the organization and analysis of sequence data. Bioinformatics 28, 1647–1649. doi: 10.1093/bioinformatics/bts199
Kumar, S., Stecher, G., Li, M., Knyaz, C., and Tamura, K. (2018). MEGA X: molecular evolutionary genetics analysis across computing platforms. Mol. Biol. Evol. 35, 1547–1549. doi: 10.1093/molbev/msy096
Lanfear, R., Frandsen, P. B., Wright, A. M., Senfeld, T., and Calcott, B. (2017). PartitionFinder 2: new methods for selecting partitioned models of evolution for molecular and morphological phylogenetic analyses. Mol. Biol. Evol. 34:msw260. doi: 10.1093/molbev/msw260
Laslett, D., and Canbäck, B. (2008). ARWEN: a program to detect tRNA genes in metazoan mitochondrial nucleotide sequences. Bioinformatics 24, 172–175. doi: 10.1093/bioinformatics/btm573
Lavrov, D. V., and Pett, W. (2016). Animal mitochondrial DNA as we do not know it: mt-genome organization and evolution in nonbilaterian lineages. Genome Biol. Evol. 8, 2896–2913. doi: 10.1093/gbe/evw195
Lavrov, D. V., Pett, W., Voigt, O., Wörheide, G., Forget, L., Lang, B. F., et al. (2013). Mitochondrial DNA of Clathrina clathrus (Calcarea, Calcinea): six linear chromosomes, fragmented rRNAs, tRNA editing, and a novel genetic code. Mol. Biol. Evol. 30, 865–880. doi: 10.1093/molbev/mss274
Malay, M. C., and Paulay, G. (2010). Peripatric speciation drives diversification and distributional pattern of reef hermit crabs (Decapoda: Diogenidae: Calcinus). Evolution 64, 634–662. doi: 10.1111/j.1558-5646.2009.00848.x
Meyer, C. P. (2003). Molecular systematics of cowries (Gastropoda: Cypraeidae) and diversification patterns in the tropics. Biol. J. Linn. Soc. Lond. 79, 401–459. doi: 10.1046/j.1095-8312.2003.00197.x
Meyer, C. P. (2004). Towards comprensiveness: increased molecular sampling with Cypraeidae and its phylogenetic implications. Malacologia 46, 127–156.
Meyer, C. P., and Tweedt, S. M. (2017). A new subspecies of Cypraea tigris Linnaeus 1758 (Gastropoda: Cypraeidae). Acta Conchyliorum 16, 59–68.
MolluscaBase (2022). “Cypraeidae Rafinesque, 1815.” in: World Register of Marine Species. Available at: https://www.marinespecies.org/aphia.php?p=taxdetails&id=23022 (Accessed October 20, 2022).
Murrell, B., Weaver, S., Smith, M. D., Wertheim, J. O., Murrell, S., Aylward, A., et al. (2015). Gene-wide identification of episodic selection. Mol. Biol. Evol. 32, 1365–1371. doi: 10.1093/molbev/msv035
Nguyen, L. T., Schmidt, H. A., Von Haeseler, A., and Minh, B. Q. (2015). IQ-TREE: a fast and effective stochastic algorithm for estimating maximum-likelihood phylogenies. Mol. Biol. Evol. 32, 268–274. doi: 10.1093/molbev/msu300
Ojala, D., Montoya, J., and Attardi, G. (1981). tRNA punctuation model of RNA processing in human mitochondria. Nature 290, 470–474. doi: 10.1038/290470a0
Okay, A. I., Zattin, M., and Cavazza, W. (2010). Apatite fission-track data for the Miocene Arabia-Eurasia collision. Geology 38, 35–38. doi: 10.1130/G30234.1
Osca, D., Templado, J., and Zardoya, R. (2015). Caenogastropod mitogenomics. Mol. Phylogenet. Evol. 93, 118–128. doi: 10.1016/j.ympev.2015.07.011
Palomares-Rius, J. E., Cantalapiedra-Navarrete, C., Archidona-Yuste, A., Blok, V. C., and Castillo, P. (2017). Mitochondrial genome diversity in dagger and needle nematodes (nematoda: longidoridae). Sci. Rep. 7:41813. doi: 10.1038/srep41813
Passamonti, M. (2015). The family Cypraeidae (Gastropoda Cypraeoidea) an unexpected case of neglected animals. Biodivers. J. 6, 449–466.
Paulay, G., and Meyer, C. (2006). Dispersal and divergence across the greatest ocean region: do larvae matter? Integr. Comp. Biol. 46, 269–281. doi: 10.1093/icb/icj027
Perna, N. T., and Kocher, T. D. (1995). Patterns of nucleotide composition at fourfold degenerate sites of animal mitochondrial genomes. J. Mol. Evol. 41, 353–358. doi: 10.1007/BF00186547
Podsiadlowski, L., Braband, A., and Mayer, G. (2008). The complete mitochondrial genome of the onychophoran Epiperipatus biolleyi reveals a unique transfer RNA set and provides further support for the ecdysozoa hypothesis. Mol. Biol. Evol. 25, 42–51. doi: 10.1093/molbev/msm223
Pu, L., Liu, H., Yang, M., Li, B., Xia, G., Shen, M., et al. (2019). Complete mitochondrial genome of tiger cowrie Cypraea tigris (Linnaeus, 1758). Mitochondrial DNA B Resour. 4, 2755–2756. doi: 10.1080/23802359.2019.1627933
Ronquist, F., and Huelsenbeck, J. P. (2003). MrBayes 3: Bayesian phylogenetic inference under mixed models. Bioinformatics 19, 1572–1574. doi: 10.1093/bioinformatics/btg180
Saccone, C., De Giorgi, C., Gissi, C., Pesole, G., and Reyes, A. (1999). Evolutionary genomics in Metazoa: the mitochondrial DNA as a model system. Gene 238, 195–209. doi: 10.1016/S0378-1119(99)00270-X
Schilder, F. A., and Schilder, M. (1938). Prodrome of a monograph on living Cypraeidae. J. Mollus. Stud. 23, 119–180. doi: 10.1093/oxfordjournals.mollus.a064355
Schwarz, G. (1978). Estimating the dimension of a model. Ann. Stat. 6, 461–464. doi: 10.1214/aos/1176344136
Uribe, J. E., Irisarri, I., Templado, J., and Zardoya, R. (2019). New patellogastropod mitogenomes help counteracting long-branch attraction in the deep phylogeny of gastropod mollusks. Mol. Phylogenet. Evol. 133, 12–23. doi: 10.1016/j.ympev.2018.12.019
Uribe, J. E., Kano, Y., Templado, J., and Zardoya, R. (2016). Mitogenomics of Vetigastropoda: insights into the evolution of pallial symmetry. Zool. Scr. 45, 145–159. doi: 10.1111/zsc.12146
Uribe, J. E., and Zardoya, R. (2017). Revisiting the phylogeny of Cephalopoda using complete mitochondrial genomes. J. Molluscan Stud. 83, 133–144. doi: 10.1093/mollus/eyw052
White, T. R., Conrad, M. M., Tseng, R., Balayan, S., Golding, R., De Frias Martins, A., et al. (2011). Ten new complete mitochondrial genomes of pulmonates (Mollusca: Gastropoda) and their impact on phylogenetic relationships. BMC Evol. Biol. 11:295. doi: 10.1186/1471-2148-11-295
Williams, S. T., Foster, P. G., and Littlewood, D. T. J. (2014). The complete mitochondrial genome of a turbinid vetigastropod from MiSeq Illumina sequencing of genomic DNA and steps towards a resolved gastropod phylogeny. Gene 533, 38–47. doi: 10.1016/j.gene.2013.10.005
Xia, X. (2013). DAMBE5: a comprehensive software package for data analysis in molecular biology and evolution. Mol. Biol. Evol. 30, 1720–1728. doi: 10.1093/molbev/mst064
Xu, X., Wu, X., and Yu, Z. (2012). Comparative studies of the complete mitochondrial genomes of four Paphia clams and reconsideration of subgenus Neotapes (Bivalvia: Veneridae). Gene 494, 17–23. doi: 10.1016/j.gene.2011.12.002
Yang, Y., Li, Q., Kong, L., and Yu, H. (2018). Comparative mitogenomic analysis reveals cryptic species in Reticunassa festiva (Neogastropoda: Nassariidae). Gene 662, 88–96. doi: 10.1016/j.gene.2018.04.001
Keywords: cowries, mitochondrial genome, phylogenetic analysis, genetic distance, divergence times
Citation: Ma Q, Li F, Zheng J, Liu C, Wang A, Yang Y and Gu Z (2023) Mitogenomic phylogeny of Cypraeidae (Gastropoda: Mesogastropoda). Front. Ecol. Evol. 11:1138297. doi: 10.3389/fevo.2023.1138297
Edited by:
Zheng Wang, Yale University, United StatesReviewed by:
Marco Passamonti, University of Bologna, ItalyDmitry Yurievich Sherbakov, Limnological Institute (RAS), Russia
Copyright © 2023 Ma, Li, Zheng, Liu, Wang, Yang and Gu. This is an open-access article distributed under the terms of the Creative Commons Attribution License (CC BY). The use, distribution or reproduction in other forums is permitted, provided the original author(s) and the copyright owner(s) are credited and that the original publication in this journal is cited, in accordance with accepted academic practice. No use, distribution or reproduction is permitted which does not comply with these terms.
*Correspondence: Yi Yang, ✉ eWl5YW5nb3VjQG91dGxvb2suY29t; Zhifeng Gu, ✉ aG51Z3VAMTYzLmNvbQ==