- 1Linze Inland River Basin Research Station, Key Laboratory of Inland River Basin Science, Northwest Institute of Eco-Environment and Resource, Chinese Academy of Sciences, Lanzhou, China
- 2University of Chinese Academy of Sciences, Beijing, China
An increase in extreme temperature events could have a significant impact on terrestrial ecosystems. Reanalysis temperature data are an important data set for extreme temperature estimation in mountainous areas with few meteorological stations. The ability of ERA5-Land reanalysis data to capture the extreme temperature index published by the Expert Team on Climate Change Detection and Indices (ETCCDI) was evaluated by using the observational data from 17 meteorological stations in the Qilian Mountains (QLM) during 1979–2017. The results show that the ERA5-Land reanalysis temperature data can capture well for the daily maximum temperature, two warm extremes (TXx and TX90p) and one cold extreme (FD0) in the QLM. ERA5-Land’s ability to capture temperature extremes is best in summer and worst in spring and winter. In addition, ERA5-Land can capture trends in all extreme temperature indices except the daily temperature range (DTR). The main bias of ERA5-Land is due to the difference in elevation between the ground observation station and the ERA5-Land grid point. The simulation accuracy of ERA5-Land increases with the decrease of elevation difference. The results can provide a reference for the study of local extreme temperature by using reanalysis data.
1. Introduction
Between 2011 and 2020, the average temperature of the global surface was 1.1°C warmer than it was at the end of the 19th century (before the Industrial Revolution) (IPCC, 2021). Since the 1950s, all inhabited regions have seen more frequent and more intense heat waves, while extreme cold temperatures have become fewer and milder, which affects people’s lives and property safety (Shtober-Zisu and Wittenberg, 2021). Global warming has also led to the spread of extreme events to places where they have not been common before. The extent of warming projected by models after the 2050s is associated with taking action against climate change. If carbon dioxide emissions are drastically and rapidly reduced from now on and throughout the 21st century, warming will stop around the middle of the century, and warming will be around 1.5°C or 2°C by the end of the century. With global warming, heat waves, heavy rainfall and droughts will continue to become more severe and frequent (Ruml et al., 2017; Sun et al., 2017; Supari et al., 2017).
Generally, previous research on extreme temperatures utilized observational data (Lin et al., 2017; Ruml et al., 2017; Sun et al., 2017; Supari et al., 2017). However, in mountainous areas with complex climatic conditions and terrain, there are few meteorological stations, limiting the availability of data. Reanalysis data such as ERA-Interim, ERA5, and NCEP have been extensively applied because of their higher resolution and longer time series (Zhao P. et al., 2020; Virman et al., 2021; Araujo et al., 2022; Zhao and He, 2022b; Zou et al., 2022). However, biases between observations and reanalysis data may exist, suggesting that it is necessary to compare reanalysis error with observations (Liu L. et al., 2020; Huai et al., 2021; Rakhmatova et al., 2021; Wu et al., 2021a,b; Xin et al., 2021; Li et al., 2022). European Centre for Medium-Range Weather Forecasts (ECMWF) implements the Copernicus Climate Change Service (C3S) on behalf of the European Union. As part of the Copernicus project, ECMWF has provided ERA5-Land, a state-of-the-art reanalysis data set for land applications, which is available for free in the Copernicus Climate Data Store (Joaquín et al., 2021). ERA5-Land reanalysis data have finer resolution (0.1° × 0.1°) than ERA5 and ERA-Interim reanalysis data (Alexander and Gregor, 2020; Cao et al., 2020; Jiang et al., 2020; Liu J. et al., 2020; Luis and Johannes, 2020; Pelosi et al., 2020; Konstantinos et al., 2021; Pelosi and Chirico, 2021). Several studies evaluated ERA5-Land data (Cao et al., 2020; Pelosi et al., 2020; Zandler et al., 2020; Jiao et al., 2021; Rakhmatova et al., 2021; Ruqing et al., 2021; Wu et al., 2021b; Jintao et al., 2022). For example, Zou et al. (2022) found that ERA5-Land underestimated the observed temperature of coastal urban agglomerations in southeast China with a mean bias of 0.90°C. Araujo et al. (2022) found that the ERA5-Land reanalysis temperature was reliable for Pernambuco, Brazil. Hong et al. (2021) found that the performance of ERA5 precipitation products in Jiangxi Province, China was worse than that of ERA5-Land in 2019.
The Qilian Mountains are an important ecological protection barrier in northwest China and an important water source for Hexi Corridor (Deng et al., 2013; Yang et al., 2021). Due to the complex terrain and climatic conditions of the QLM, meteorological stations are rare, especially above 3,500 m (Lin et al., 2017; Wang L. et al., 2019; Wang X. et al., 2019; Zhou et al., 2019), necessitating the use of reanalysis data. Zhao and He (2022a) assessed ERA5-Land reanalysis monthly average temperature for the QLM and found that the observed temperature variation was captured very well. Li et al. (2022) found that ERA5-Land was more suitable than China Meteorological Forcing Dataset for analyzing temperature trends in the QLM. However, previous studies which evaluated reanalysis data for the QLM were primarily focused on monthly averages but rarely examined extreme temperature events. The Qilian Mountains and Hexi Corridor are affected by different circulation systems, and the local climate changes are more complicated, with frequent meteorological disasters such as drought, flood, sandstorm, dry hot air, low temperature freezing damage and snow disaster. Therefore, evaluating the reliability of ERA5-Land data is necessary in understanding extreme temperature events in the QLM.
Here, we used temperature data for the years 1979 to 2017 from 17 meteorological stations in the QLM to evaluate the ability of ERA5-Land reanalysis data to capture extreme temperature events. Evaluation of the extremes of temperature with reanalysis datasets provides a reference for the research on climate change in the QLM.
2. Data and methods
2.1. ERA5-Land temperature data (Te)
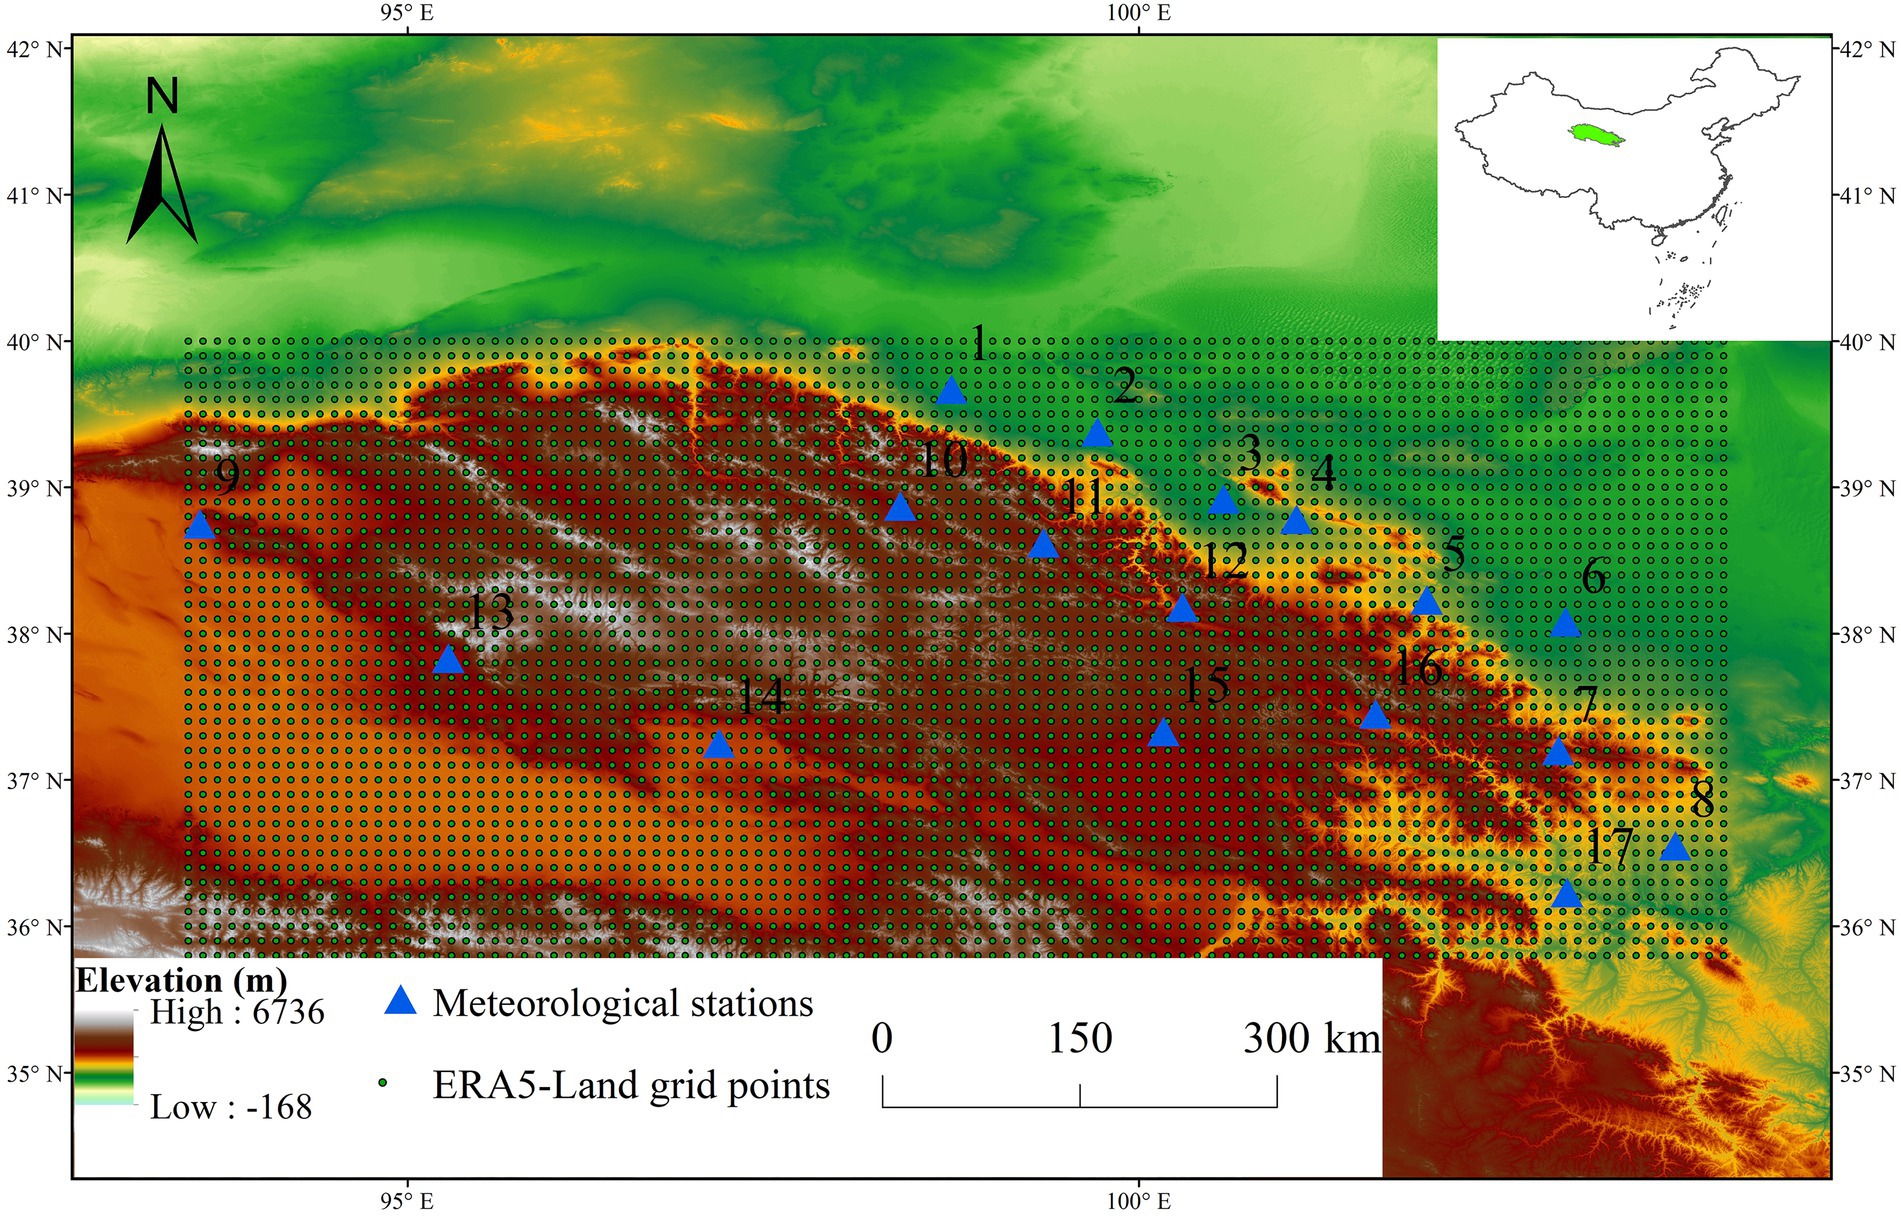
ERA5-Land hourly data were downloaded from the website of ECMWF (link:1). We used ERA5-Land hourly 2 m temperature data for years 1979 to 2017 in this study. The location of cell grid points ranged from 35.8 to 40°N and from 93.5 to 104°E, which covered the entire QLM region (Figure 1). According to the latitude and longitude coordinates of the 17 stations, the ERA5-Land cell closest to each station is selected to avoid spatial interpolation (Zhao and He, 2022a). ERA5-Land hourly reanalysis data is given for UTC time, with an 8-h difference from Beijing time in China; we matched the times of observation and ERA5-Land reanalysis with a time-difference conversion method (Zhao P. et al., 2020; Xu et al., 2022). ERA5-Land grid elevation is extracted from the Digital Elevation Model (DEM) of Geospatial data cloud,2 with the information of ASTER GDEM 30 m. The spatial range of DEM used in this study is 33.94–45.29°N, 88.81–107.24°E, which can cover the entire the Qilian Mountains (Table 1; Figure 1).
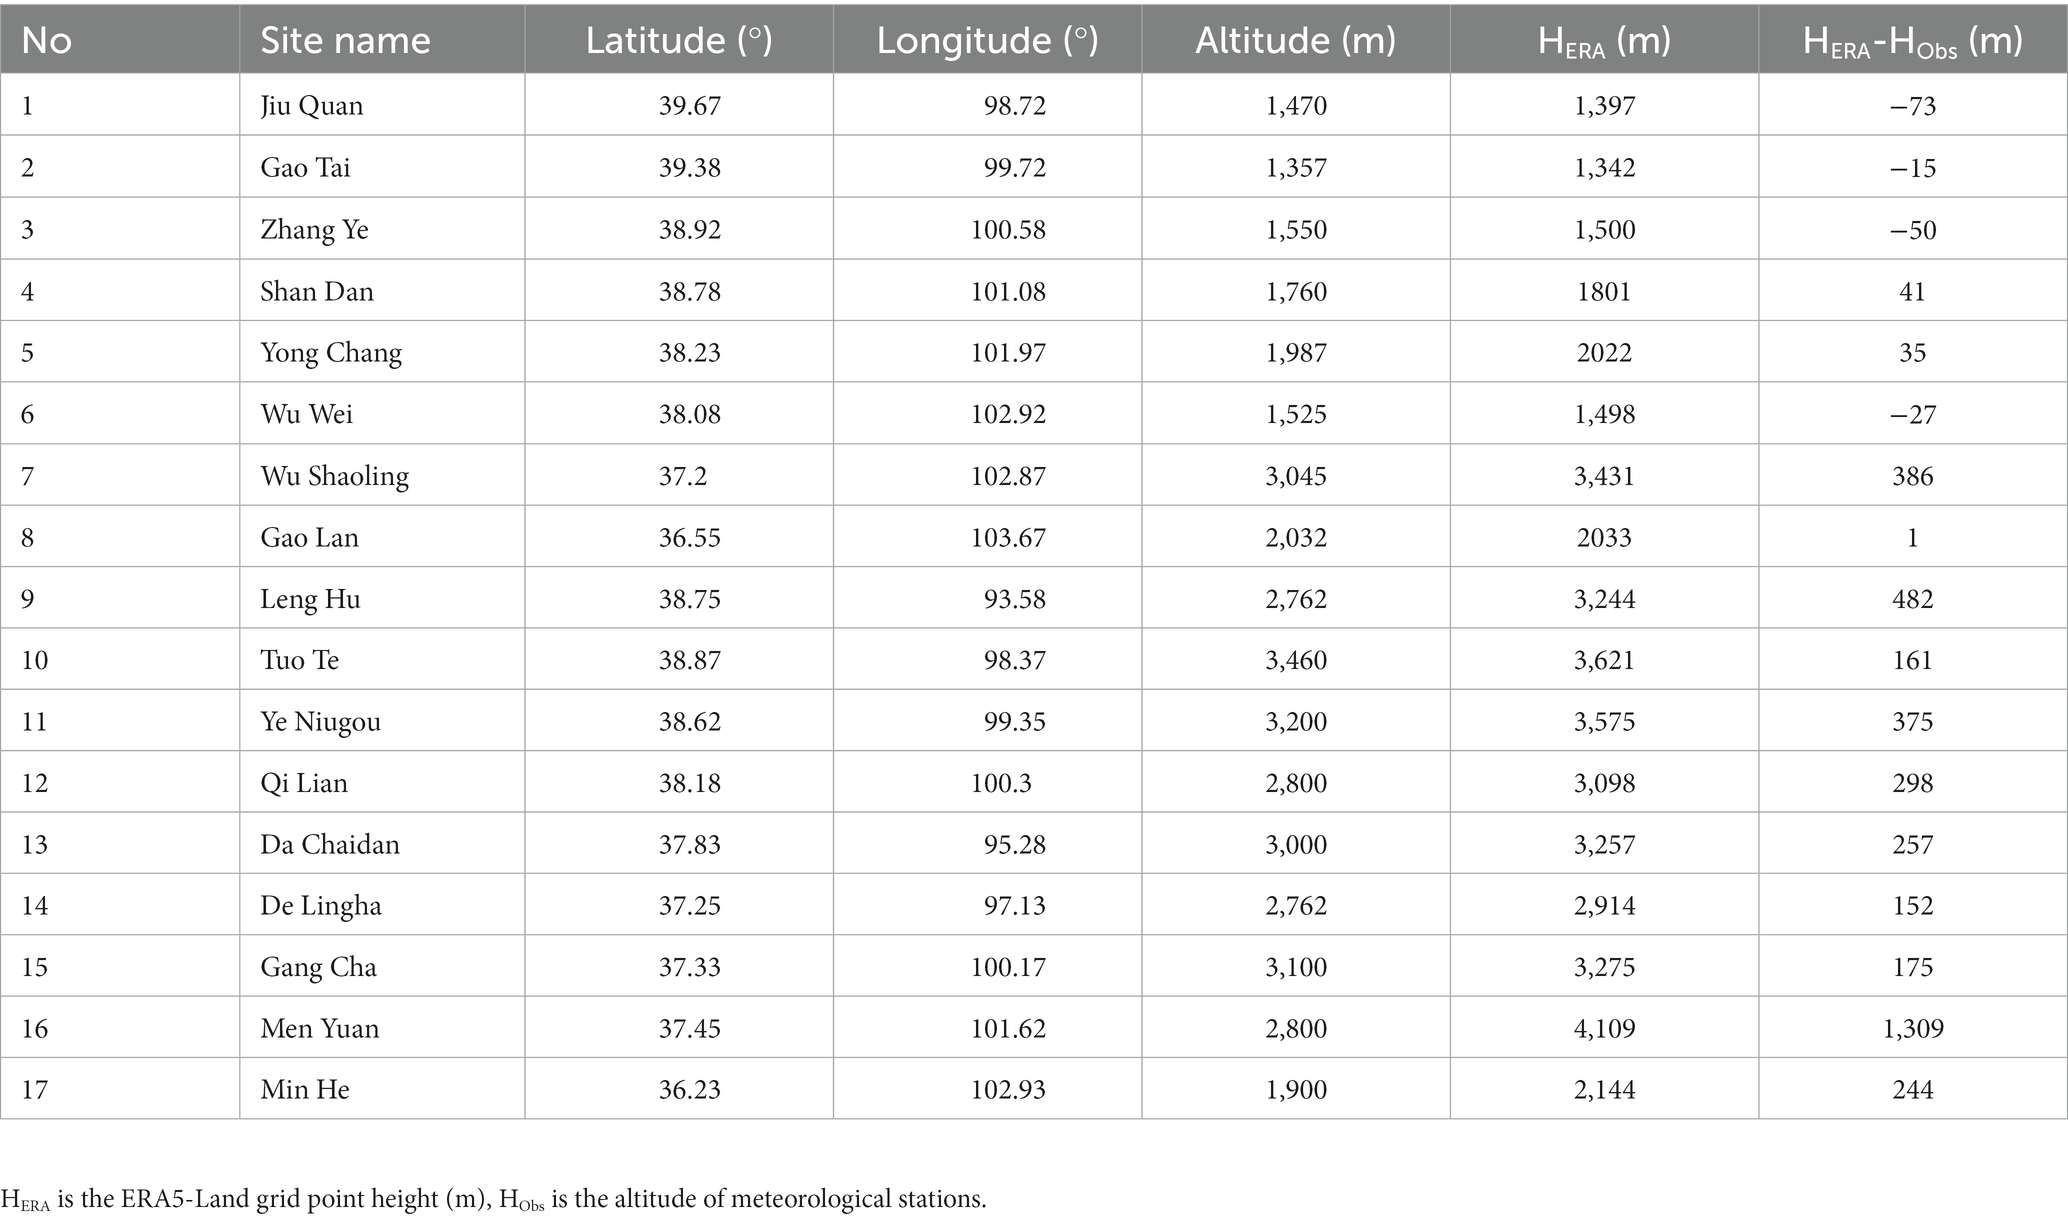
Table 1. Geographical information about meteorological stations used in this study (Zhao and He, 2022a).
2.2. Observations (To)
In this study, observational daily temperature data including daily mean temperature (T_mean), daily maximum temperature (T_max) and daily minimum temperature (T_min) at 17 meteorological stations in the QLM were obtained from China Meteorological Data Sharing Service of National Meteorological Information Center.3 These data can be directly used in scientific research after strict quality control by provider from five aspects: climate limit value and allowable value checking, extreme value checking, internal consistency checking between timing value, daily average, and daily extreme value, time consistency checking, and space consistency checking (Zhao C. et al., 2020; Zhao P. et al., 2020; Zhao and He, 2022a). Spatial distribution and specific information on the meteorological stations can be found in Figure 1 and Table 1, respectively.
2.3. Extreme temperature indices
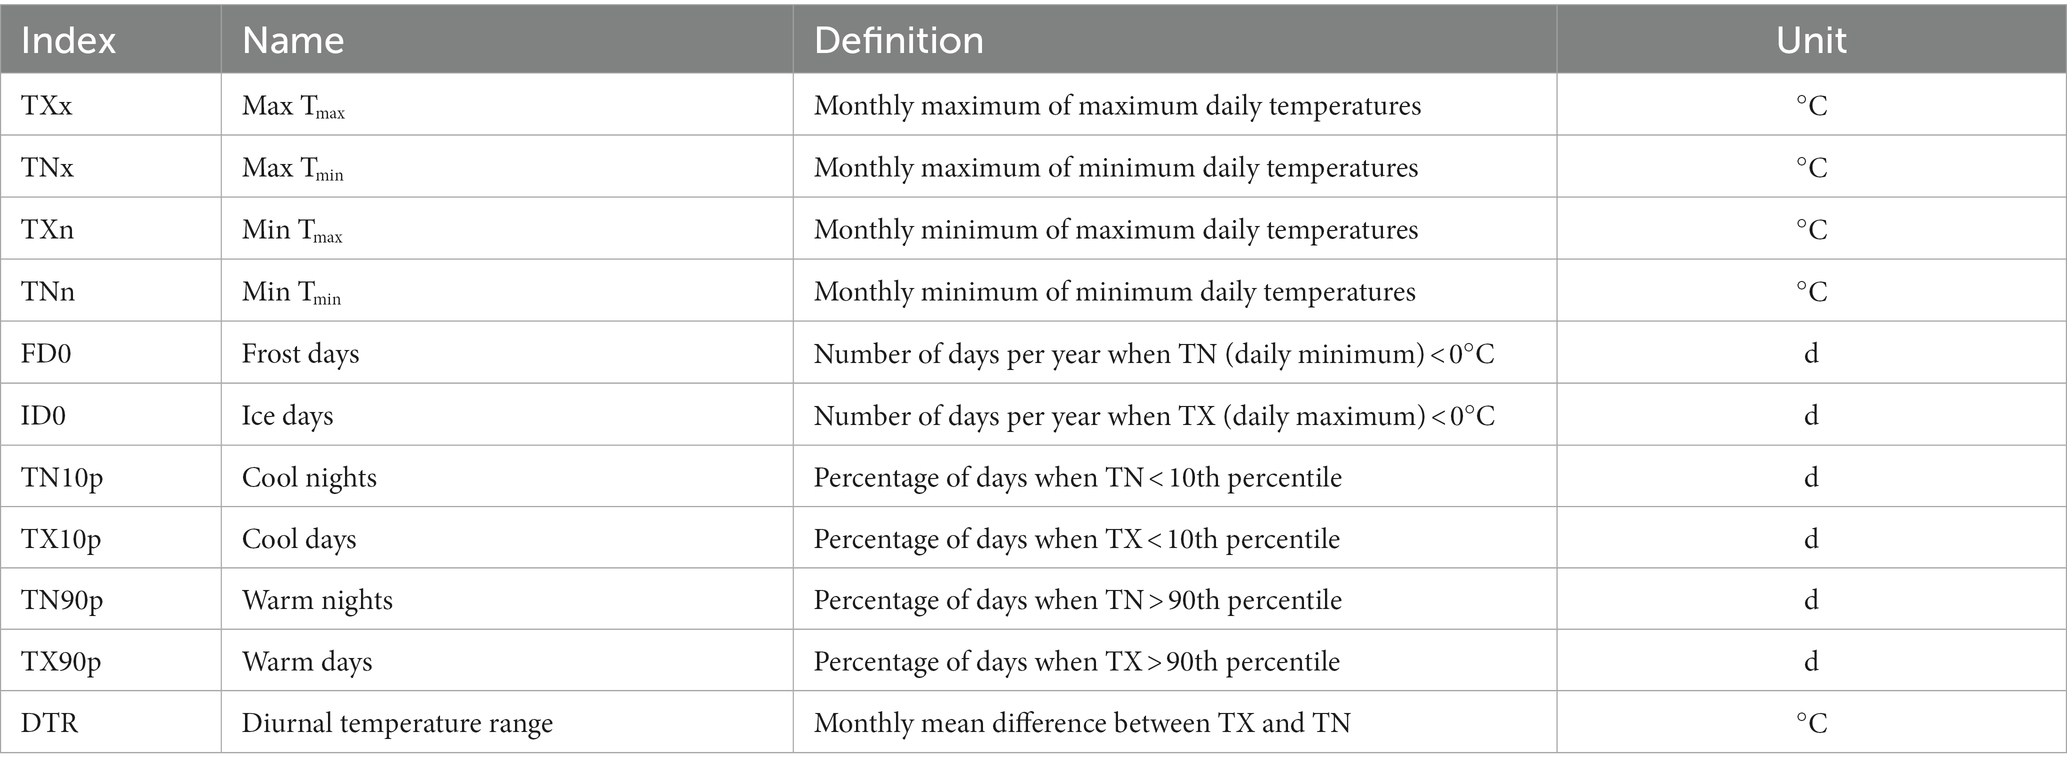
Eleven extreme temperature indices were selected from ETCCDI (Yin and Sun, 2017) based on their application in climatology research in the region (Hu et al., 2017; Yin and Sun, 2017; Yu et al., 2020; Xu et al., 2022). These indices were grouped into four types: (1) absolute indices (TNx, TNn, TXn, and TXx), (2) threshold indices (ID0 and FD0), (3) percentile-based indices (TN10p, TX10p, TN90p, and TX90p), and (4) other indices (DTR) (Table 2).
2.4. Evaluation methods
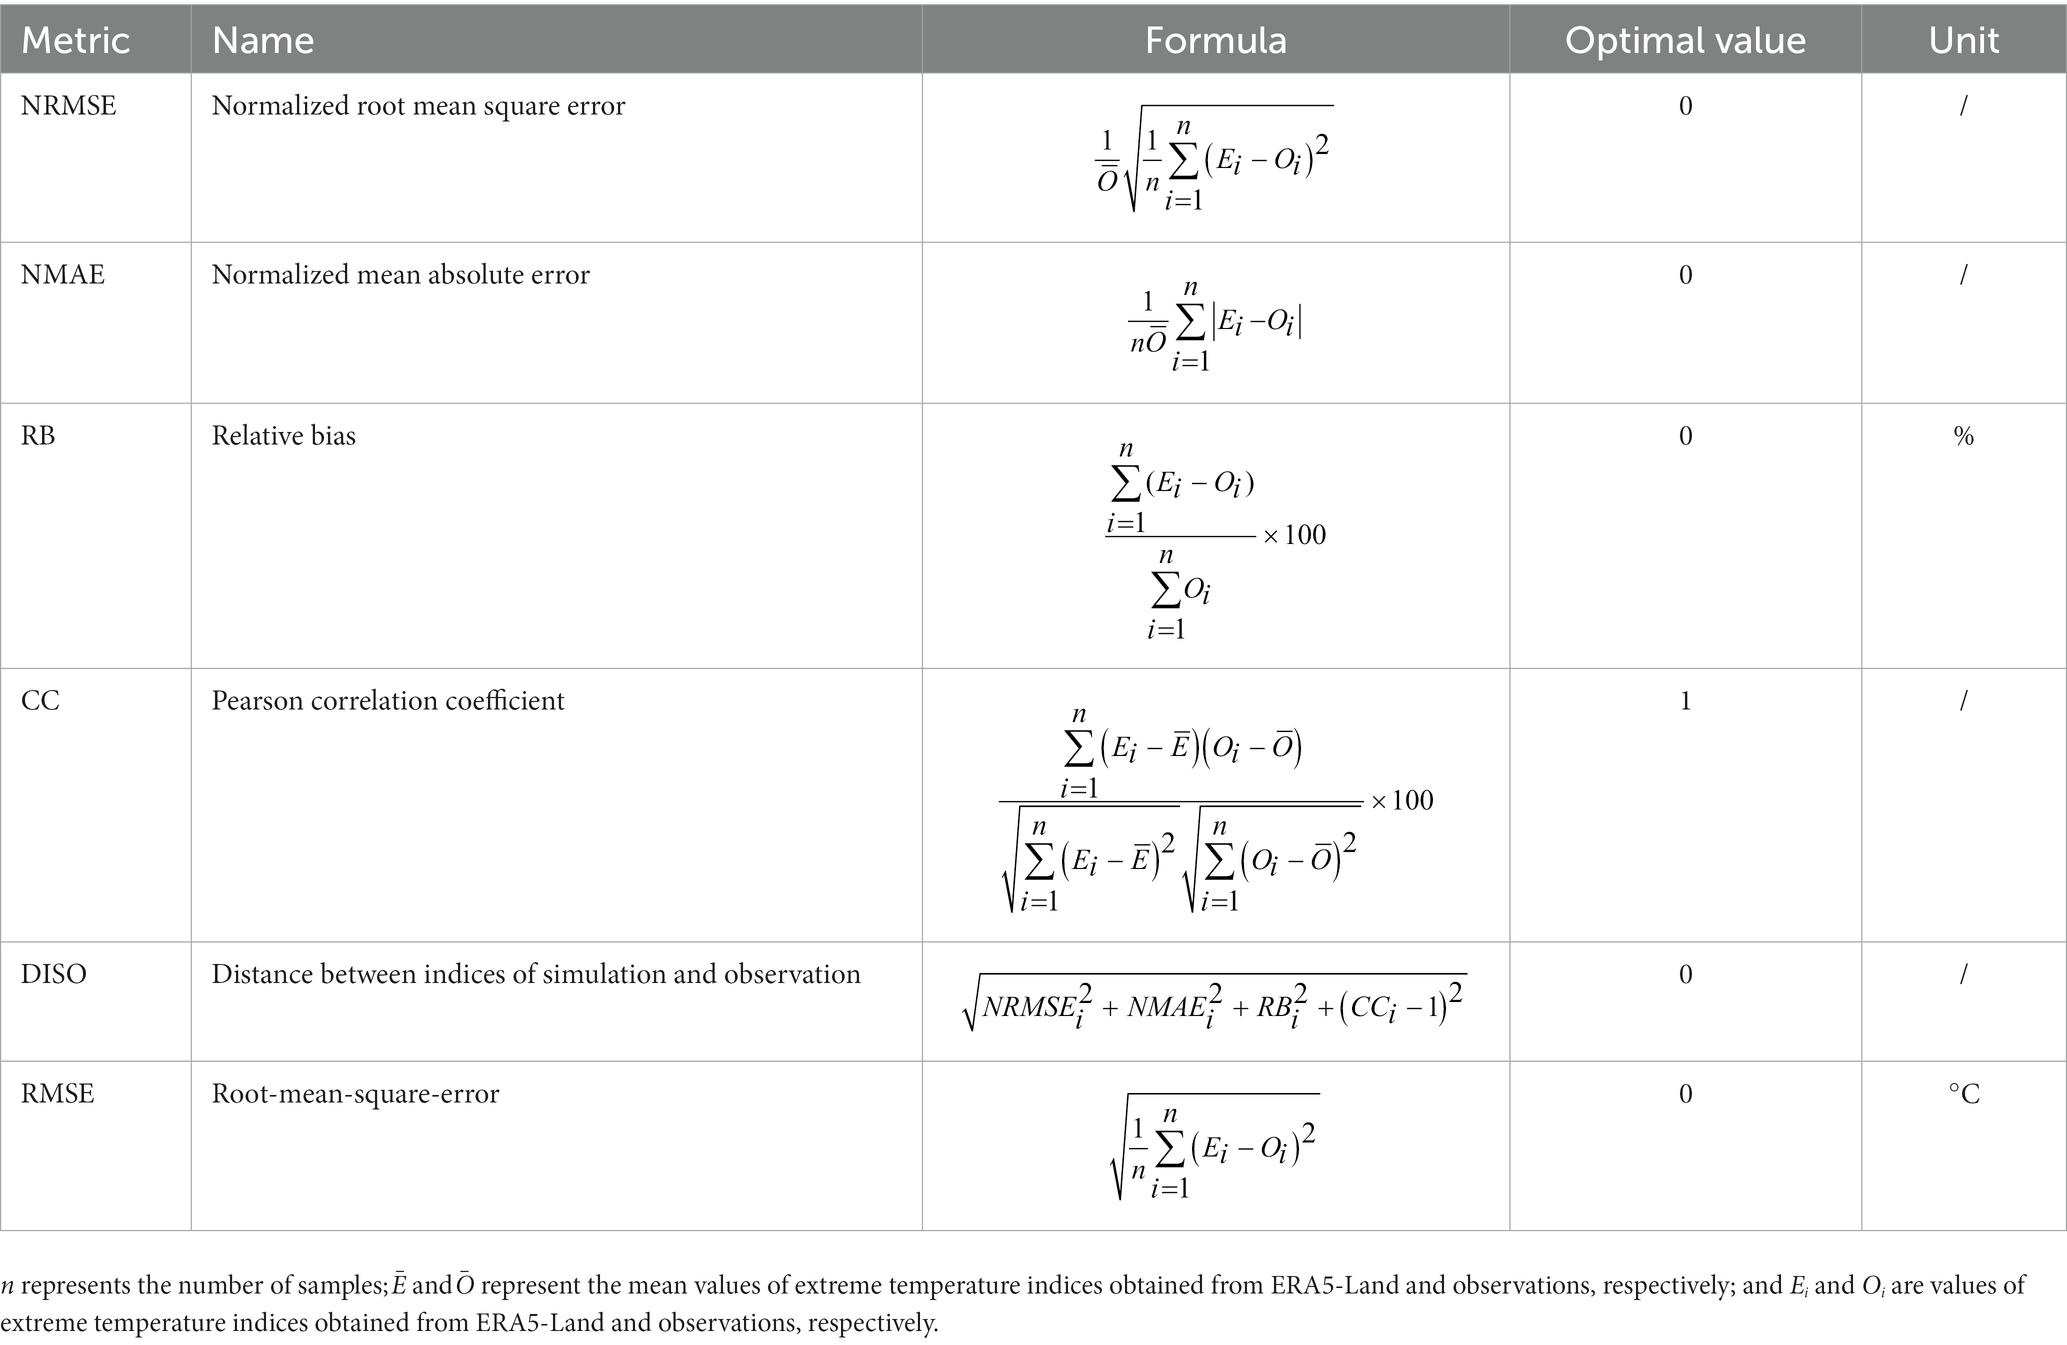
In this study, we used DISO (the distance between indices of simulation and observation) indicator combined with correlation coefficient (r) and mean absolute error (MAE) to assess the reliability of ERA5-Land in capturing daily temperature data and 11 extreme temperature indices in the QLM (Hu et al., 2019; Zhou et al., 2021; Hu et al., 2022; Xu et al., 2022). The equation of DISO is shown in Table 3. DISO is more flexible in expressing the quality of data than other indices (Zhou et al., 2021). The results of DISO value can be divided into two categories in this study: above 0.5 and 0.0–0.5 to analyze the reliability of ERA5-Land in capturing extreme temperature events in the QLM (Hu et al., 2019). It is suggested that ERA5-Land can capture extreme temperature events well when DISO is less than 0.5 (Hu et al., 2019). DISO greater than 0.5 indicates a poor simulation (worst if greater than 1.0), and less than 0.5 indicates a good simulation (best if close to 0.0). In addition, RB was divided into two groups: below 0.0 and above 0.0. The RB below 0.0 or above 0.0 was considered to indicate that ERA5-Land relatively underestimates or overestimates the observational data, respectively. NRMSE shows the mean error of ERA5-Land. NMAE can eliminate the effect of positive and negative offsetting of ERA5-Land errors. The CC is a important indicator of the correlation between ERA5-Land and Observations (Lei et al., 2022).
3. Results and discussion
3.1. Comparisons of daily temperatures
The correlation coefficient (r) between ERA5-Land and observed T_mean, T_max, and T_min was all larger than 0.9 (Table 4), the determination coefficient (R2) between ERA5-Land and observed T_mean, T_max, and T_min was 0.99, 0.99, and 0.98, respectively (Figure 2), indicating excellent agreement between ERA5-Land daily temperature and observational daily temperature. The average MAE of T_mean, T_max, and T_min at all stations was 2.24, 3.52 and 2.69, respectively (Table 4). Station No.16 has the smallest r value and the largest MAE, which may be due to the larger altitude difference (1,309 m) between Te and To at Station No.16 (Table 1). The DISO value for T_mean and T_max was <0.5 for 47 and 53% of the stations, respectively (Table 5). The DISO value of T_min at all stations is greater than 0.5. The average DISO at all stations of T_mean, T_max, and T_min was 2.44, 0.62, and 2.19, respectively. The spatial distribution of DISO value for T_mean and T_max is shown in Figure 3. In general, the DISO value was higher within the QLM than in the Hexi Corridor, indicating that the ability of ERA5-Land to capture T_mean and T_max in this mountainous area was worse than that in the oasis area. In general, reliability of ERA5-Land to capture T_max is best in the QLM.
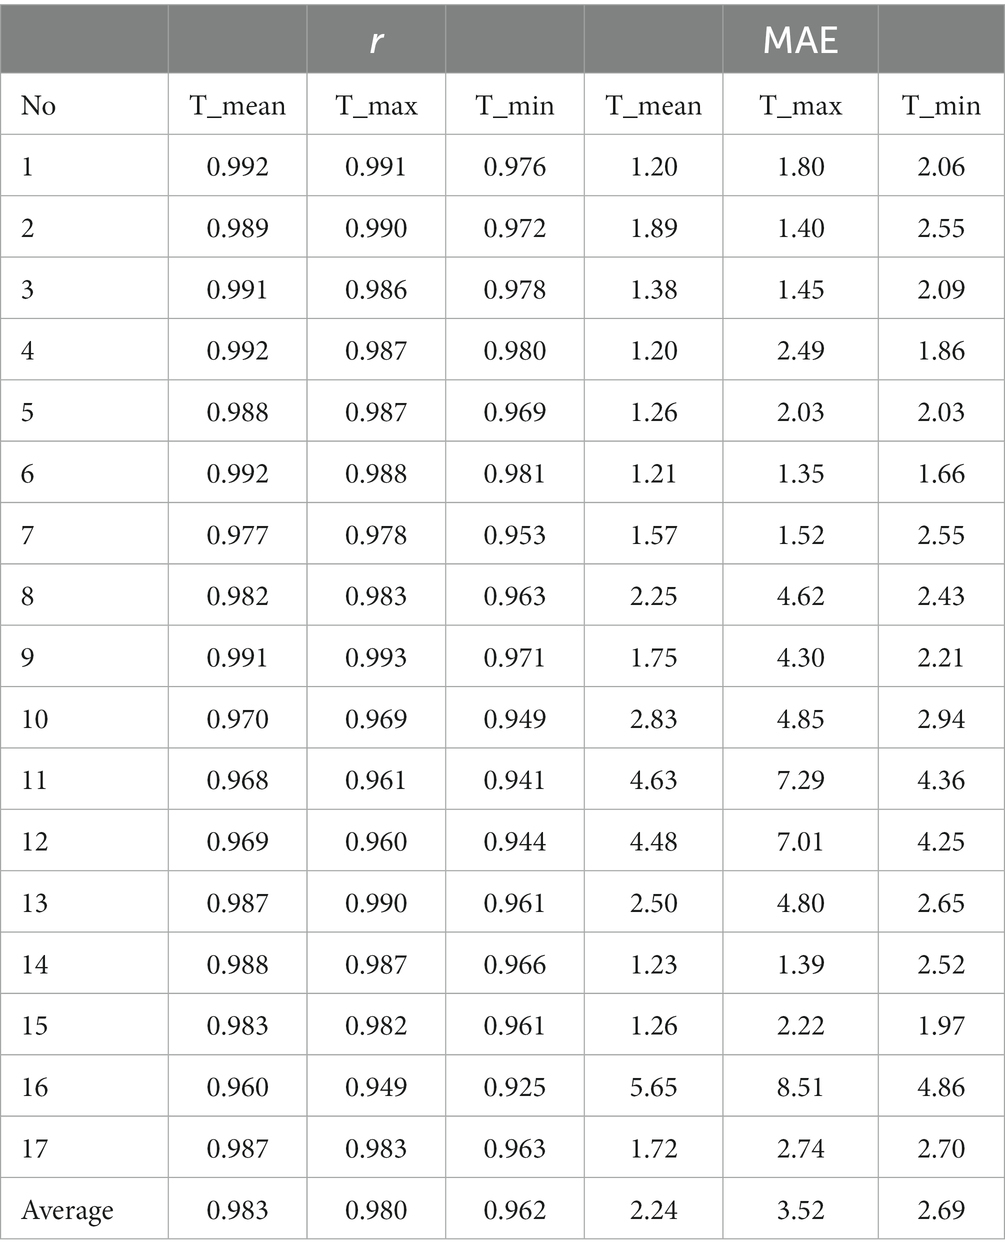
Table 4. Correlation coefficient (r) and mean absolute error (MAE) between observational daily temperature and ERA5-Land daily temperature at 17 stations in the QLM from 1979 to 2017.
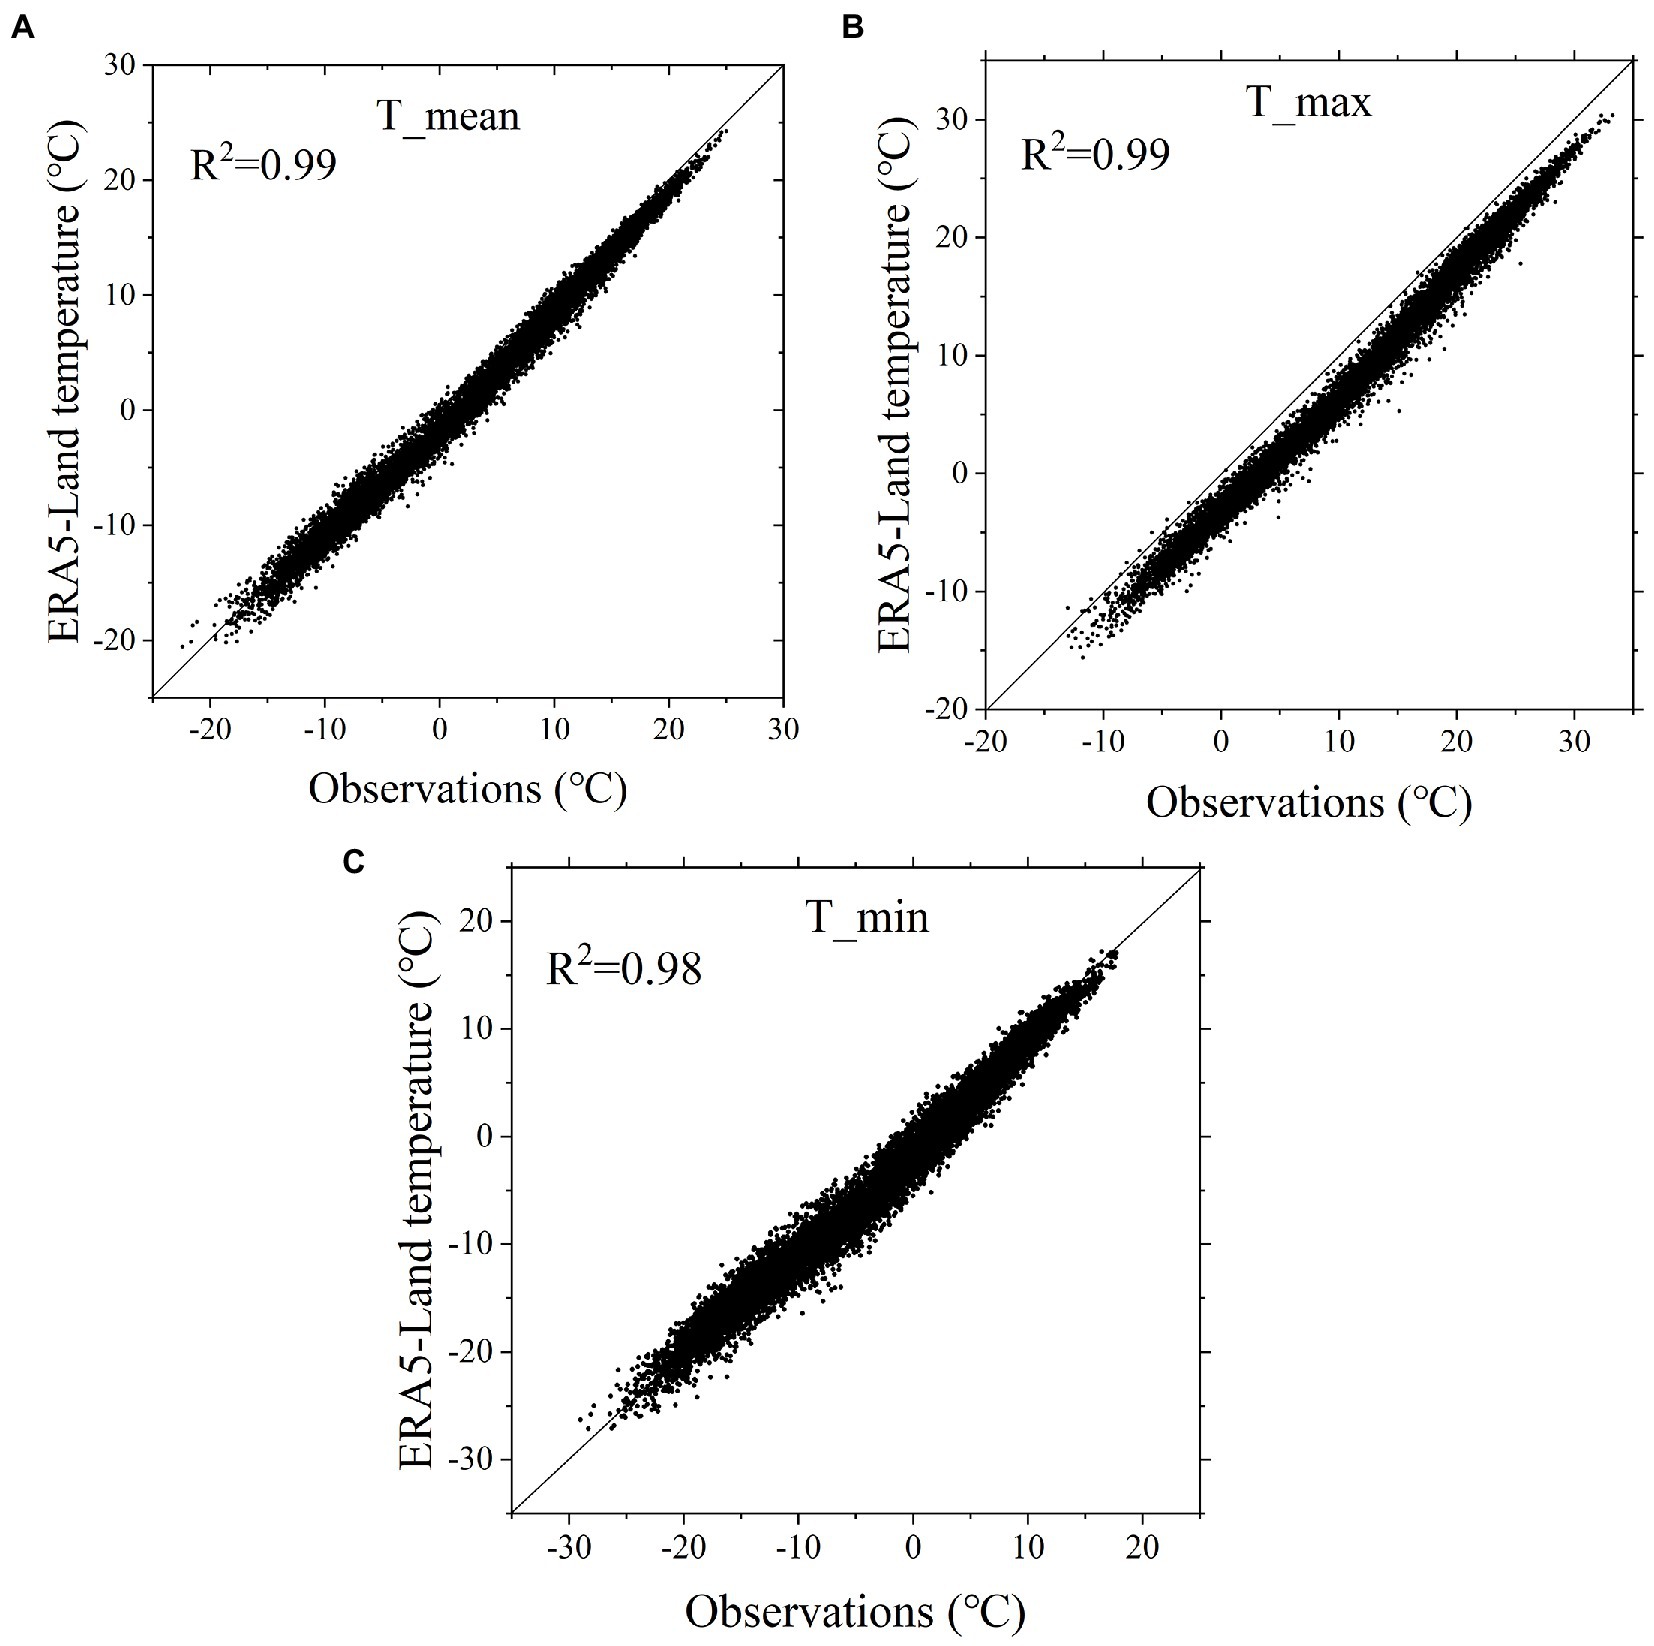
Figure 2. Scatter plots of ERA5-Land daily temperature and observed values of T_mean (A), T_max (B), and T_min (C). The solid line is 1 :1 line.

Table 5. Statistics of DISO for ERA5-Land daily temperature at 17 stations in the QLM from 1979 to 2017.
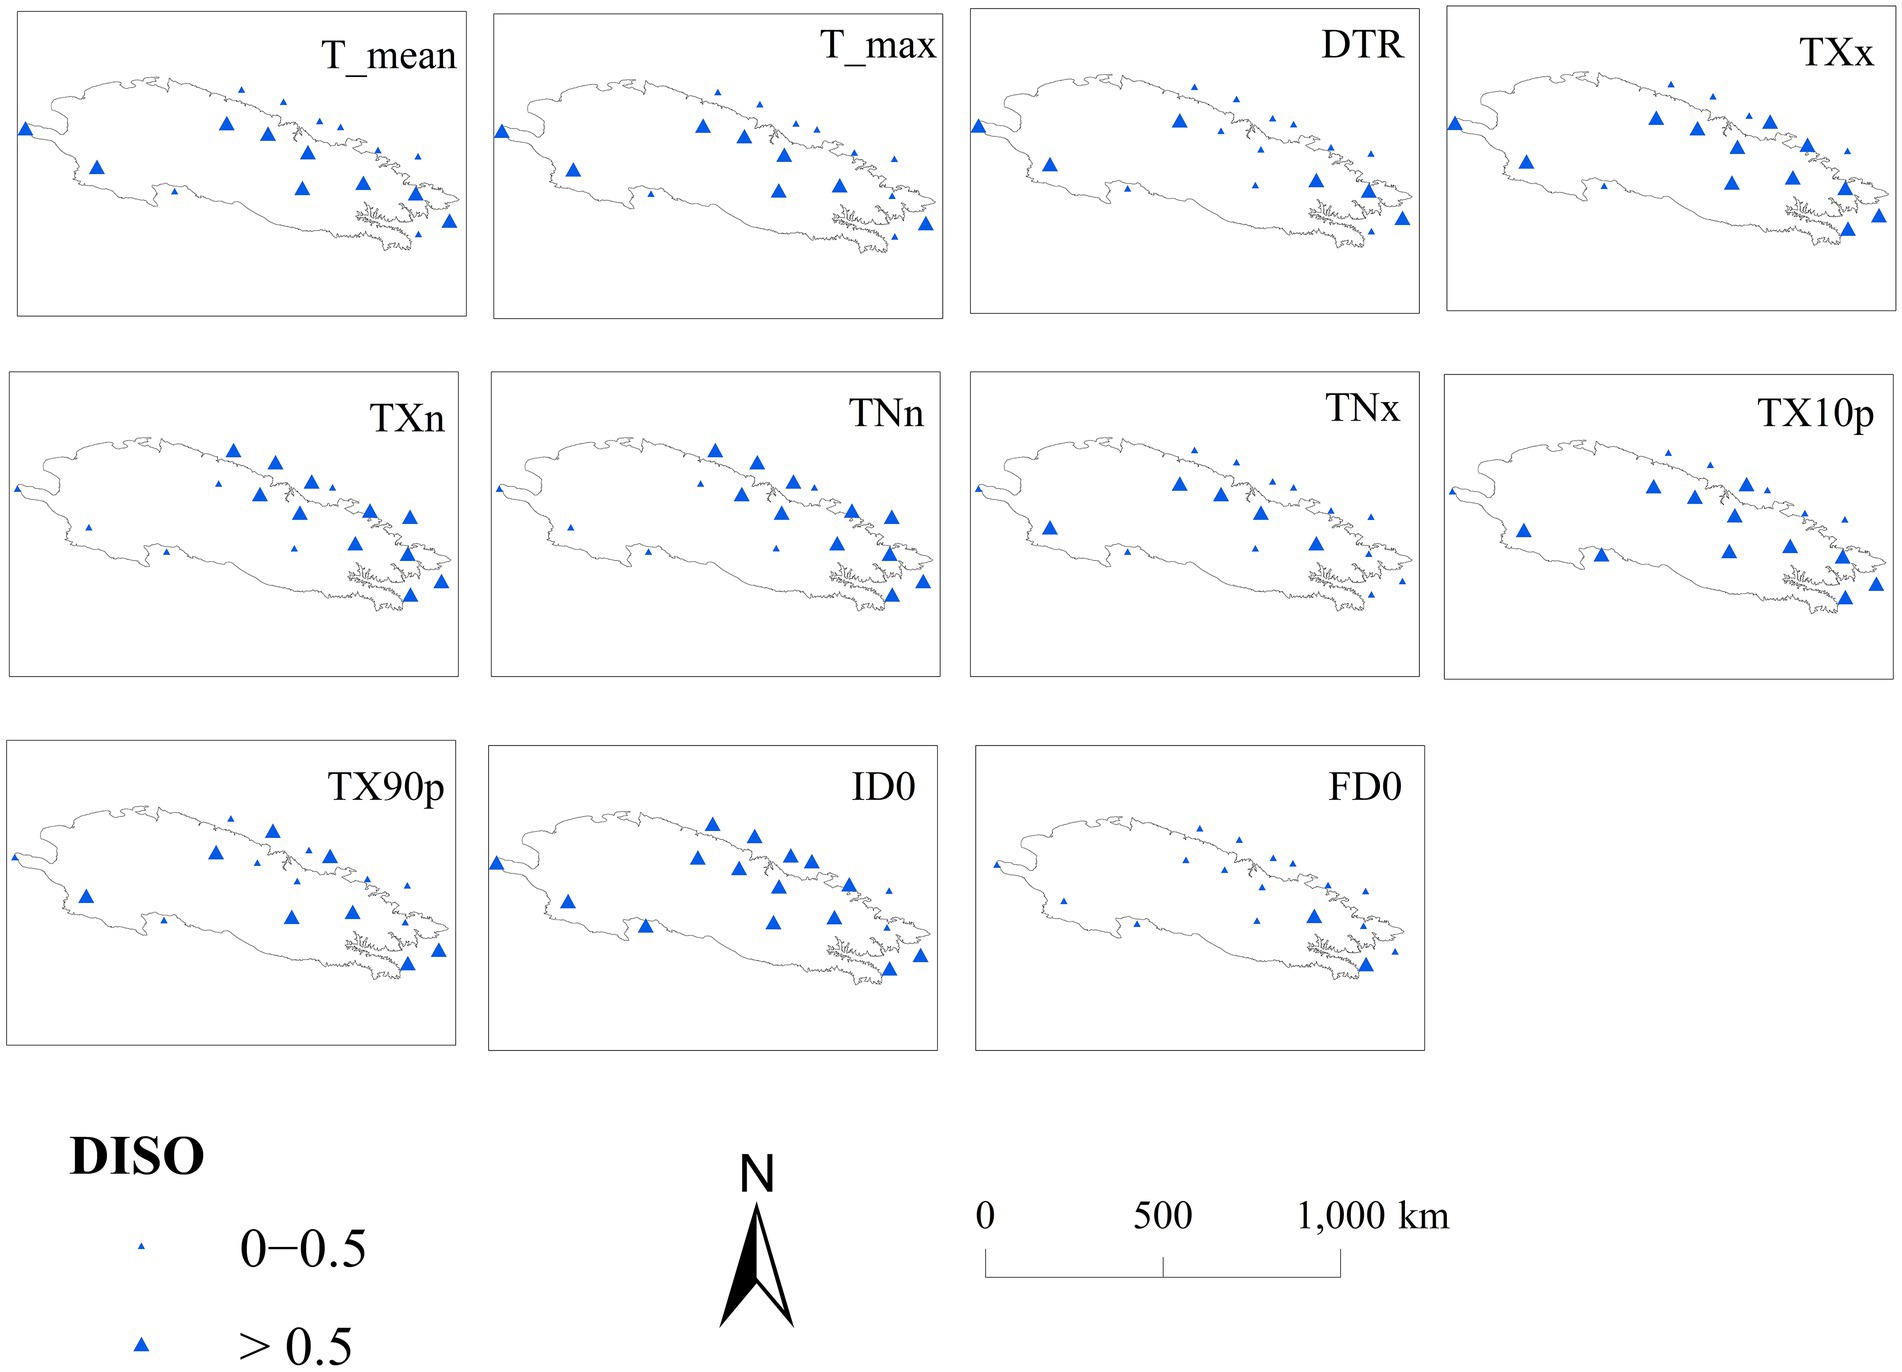
Figure 3. Distribution of DISO for T_mean,T_max and extreme temperature indices of 17 meteorological stations in the QLM.
3.2. Comparisons of extreme temperatures
High correlation coefficient (r) of 11 extreme temperature indices between Te and To indicates that ERA5-Land can capture the extreme temperature indices well (Table 6). Only the average r at all stations of DTR is less than 0.8, and the average r at all stations of other extreme temperature indexes is above 0.85. After comparing the MAE of 11 extreme temperature indices between Te and To, we can learn that TX90p have MAE smaller than 1 at all stations (Table 7). DISO of DTR at individual stations ranged from 0.28 to 0.69 with an average across the stations of 0.46, indicating that ERA5-Land simulates DTR in the QLM well (Table 8). ERA5-Land captured FD0 very accurately, with DISO <0.5 for 15 meteorological stations and an average of 0.27. ERA5-Land reanalysis performed better for TXx than for TXn, TNn, and TNx. DISO for TXx was <0.5 at 12 stations accounting for approximately 71% of all stations. TX90p performed better than TN90p, TX10p and TN10p. DISO for TX90p was <0.5 at 9 stations accounting for approximately 53% of all stations. Zhu et al. (2016) found that ERA-Interim and 20CR reanalysis can capture intensity indices better than frequency indices over China, in agreement with this study. The mean DISO values of the warmest days (TXx) in spring, summer, autumn and winter were 0.31, 0.16, 0.32, and 0.93, respectively (Table 9). The spring DISO values of TXn, TNn and TNx were the largest. Overall, ERA5-Land reanalysis performed well in summer and poorly in spring and winter, similar to previous studies (Zhao P. et al., 2020; Xu et al., 2022). Figure 3 shows the spatial distribution of DISO values of extreme temperature index. In general, FD0 has the best performance within the Qilian Mountains region.
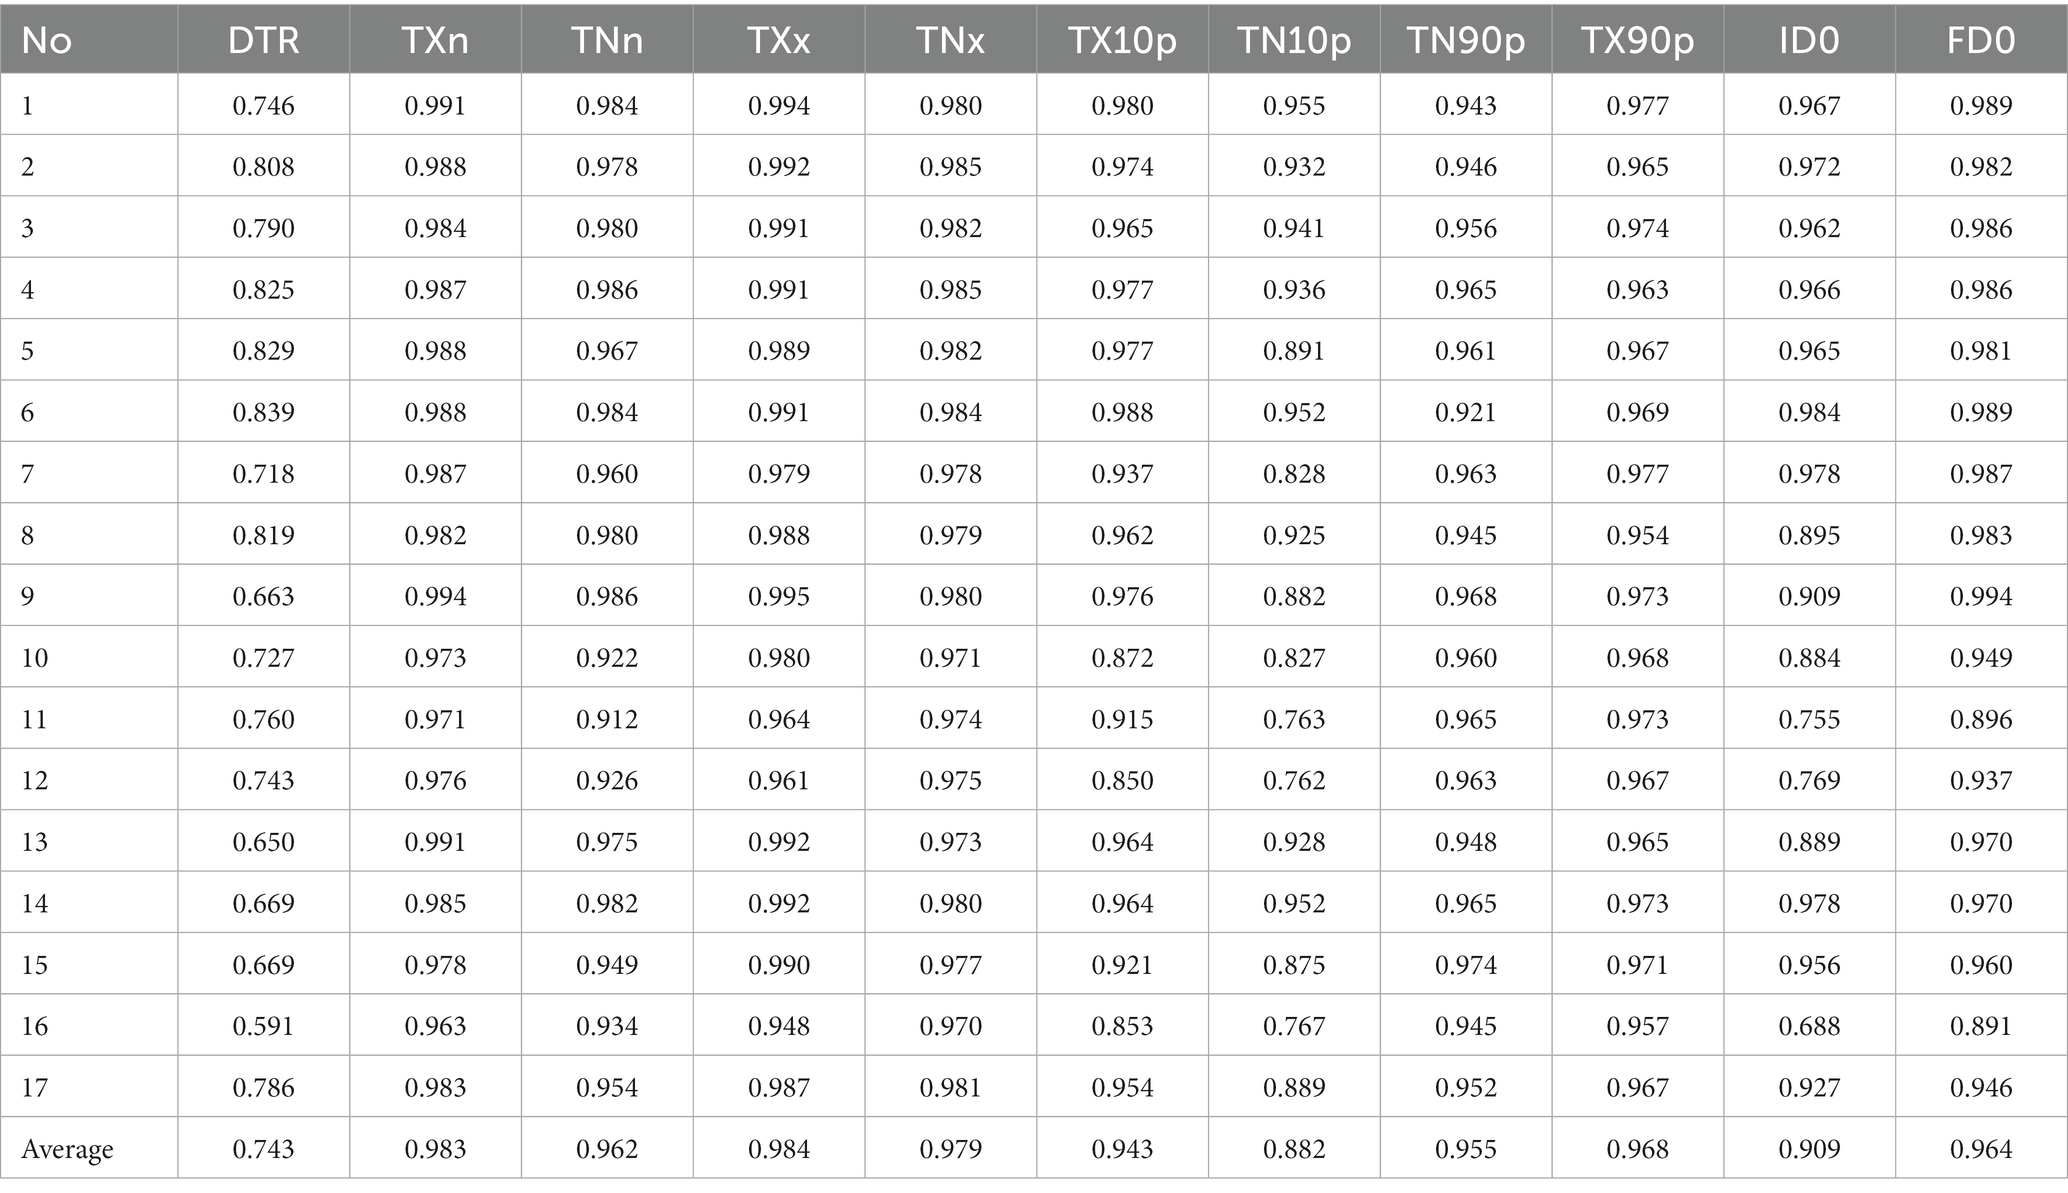
Table 6. Correlation coefficient (r) between observational extreme temperature indices and ERA5-Land extreme temperature indices at 17 stations in the QLM from 1979 to 2017.
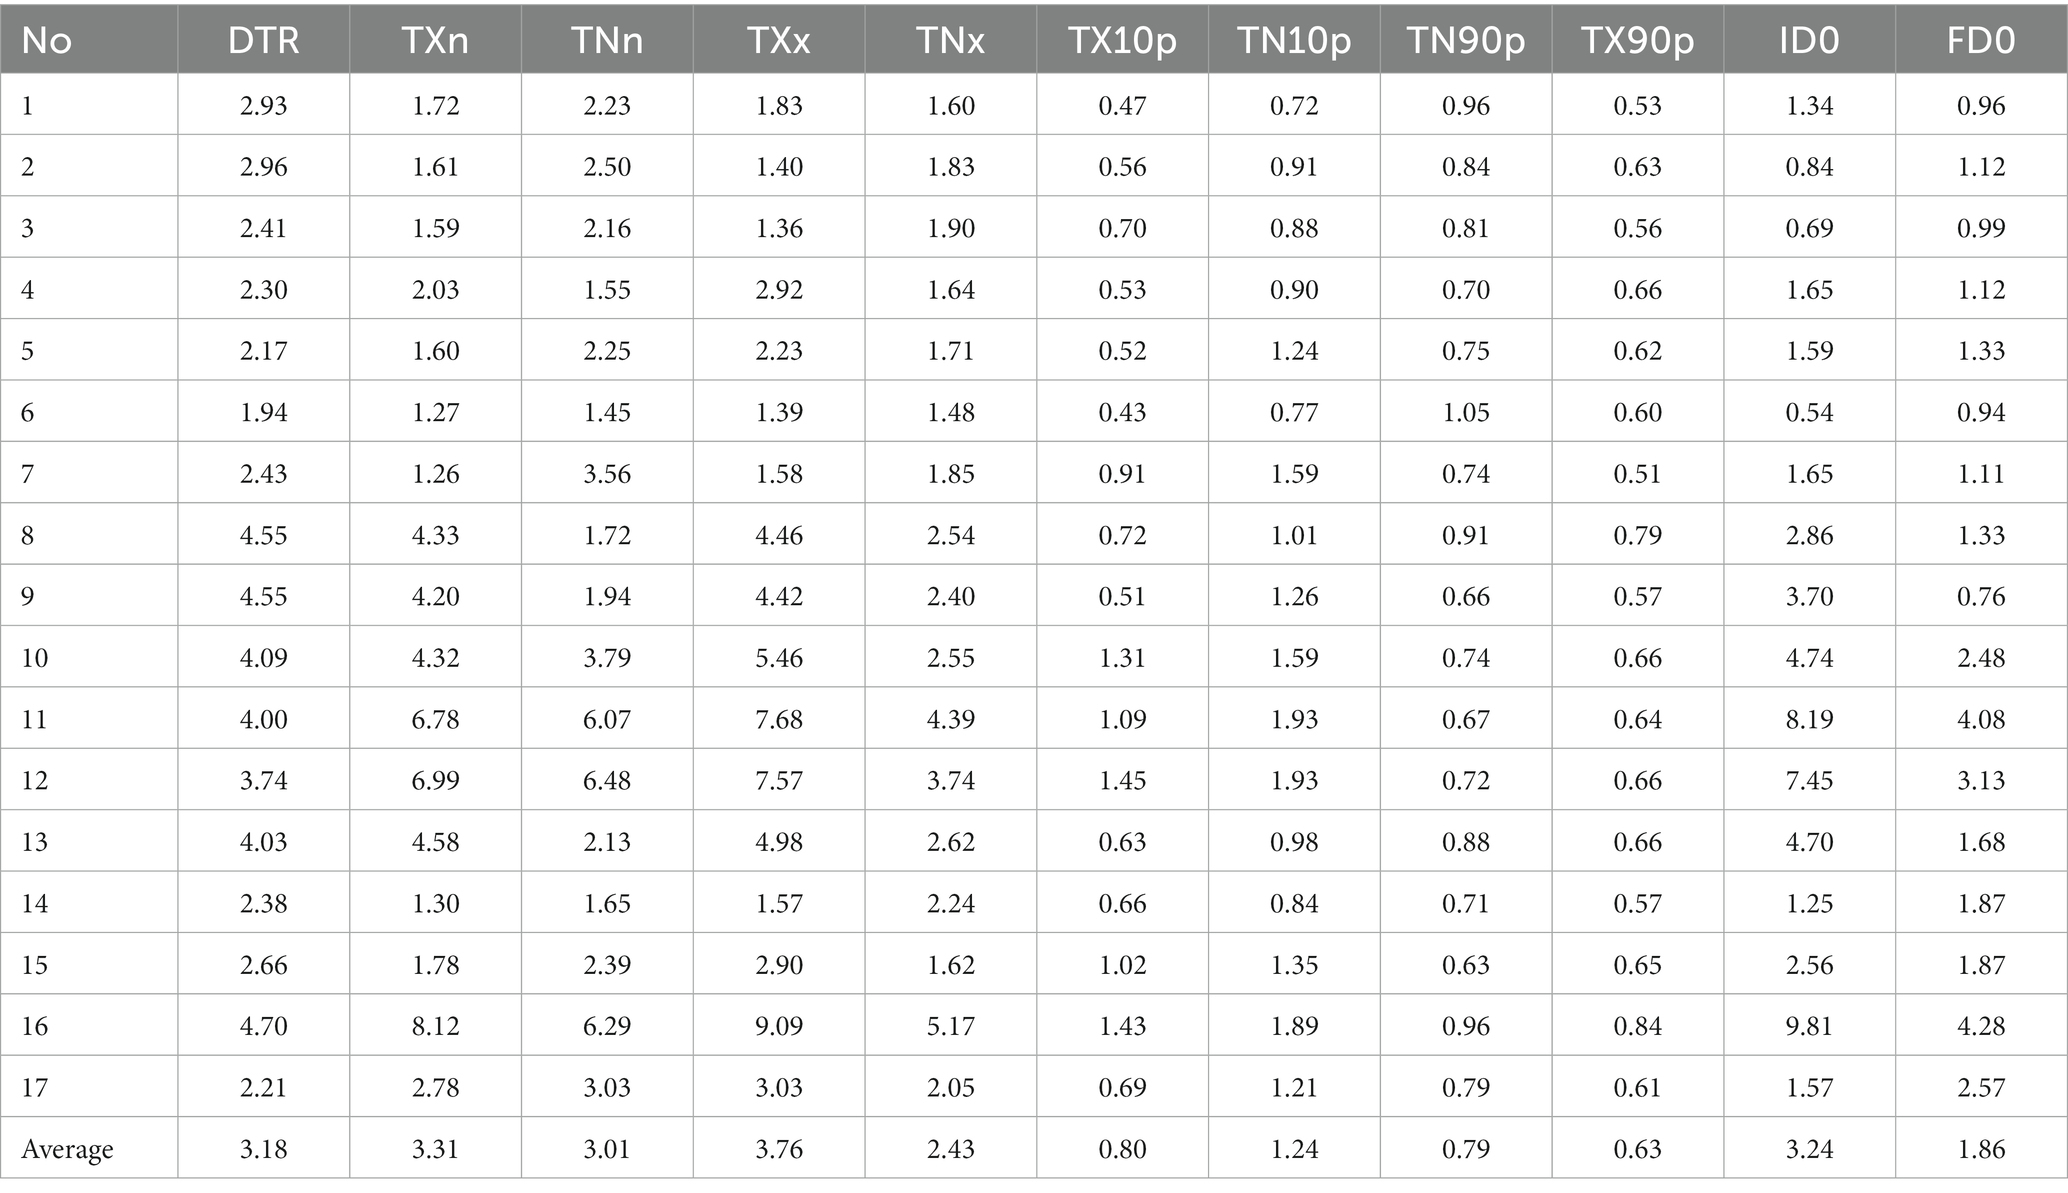
Table 7. Mean absolute error (MAE) between observational extreme temperature indices and ERA5-Land extreme temperature indices at 17 stations in the QLM from 1979 to 2017.

Table 8. Statistics of DISO for ERA5-Land extreme temperature indices at 17 stations in the QLM from 1979 to 2017.
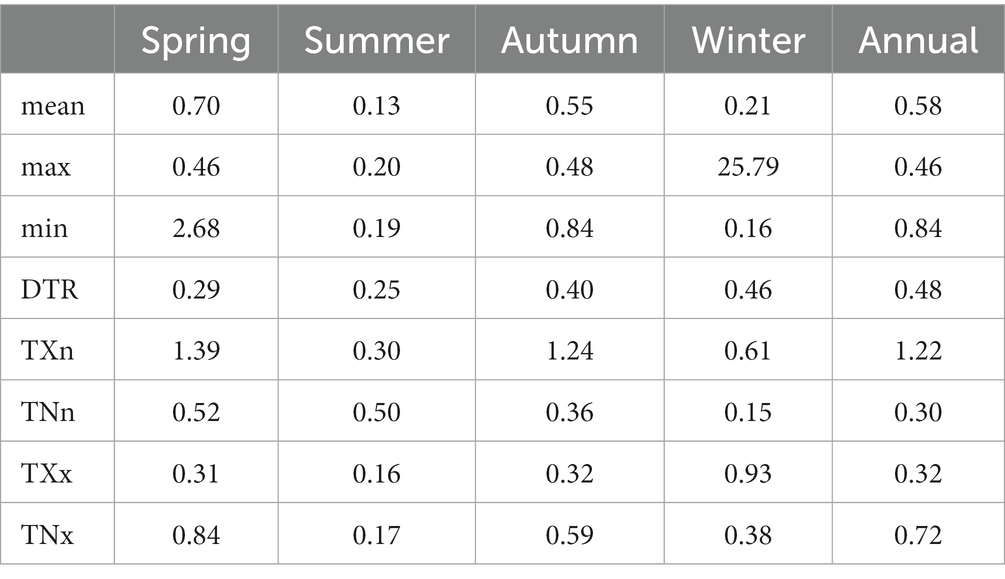
Table 9. DISO for ERA5-Land daily temperature and extreme temperature indices at seasonal scales from 1979 to 2017.
3.3. Trends in daily and extreme temperatures
Figures 4–7 shows trends in daily temperature and extreme temperature indices based on ERA5-Land and observations during 1979–2017 in the QLM. Daily temperature data obtained from ERA5-Land reanalysis and observation datasets showed significant positive trends from 1979 to 2017. This indicated that the warming trend in observed data at daily scale was captured accurately by the ERA5-Land reanalysis temperature. TXx (warmest day), TNx (warmest night), TX90p (warm days), and TN90p (warm nights) exhibited a significant positive trend. With global warming, extreme heat events are increasing in intensity and frequency (Xu et al., 2022). Also, extreme high-temperature indices were captured by ERA5-Land well. In addition, TX10p (cool days), TN10p (cool nights), ID0 (ice days), and FD0 (frost days) based on observations and ERA5-Land exhibited negative trends. Both TNn (coldest night) and TXn (coldest day) calculated from Te and To showed a positive trend, showing that the intensity of extreme low temperature events in the QLM increases with global warming. Zhou et al. (2016) analyzed the variation in extreme temperature indices over China using high-resolution gridding data (CN05), and found that the coldest day (TXn) had less variability than the coldest night (TNn), and the warmest day (TXx) had less variability than the warmest night (TNx), similar to the results of this study. Our conclusion is that the trend in extreme low-temperature indices can be captured by ERA5-Land well. The observational DTR showed a large decreasing trend (−0.162°C/decade), while DTR of ERA5-Land showed only a slightly decreasing trend (−0.009°C/decade), indicating that ERA5-Land did not capture the trend in DTR well (Table 10). Generally, all tendencies in extreme temperature events except DTR were captured well by ERA5-Land in the QLM.
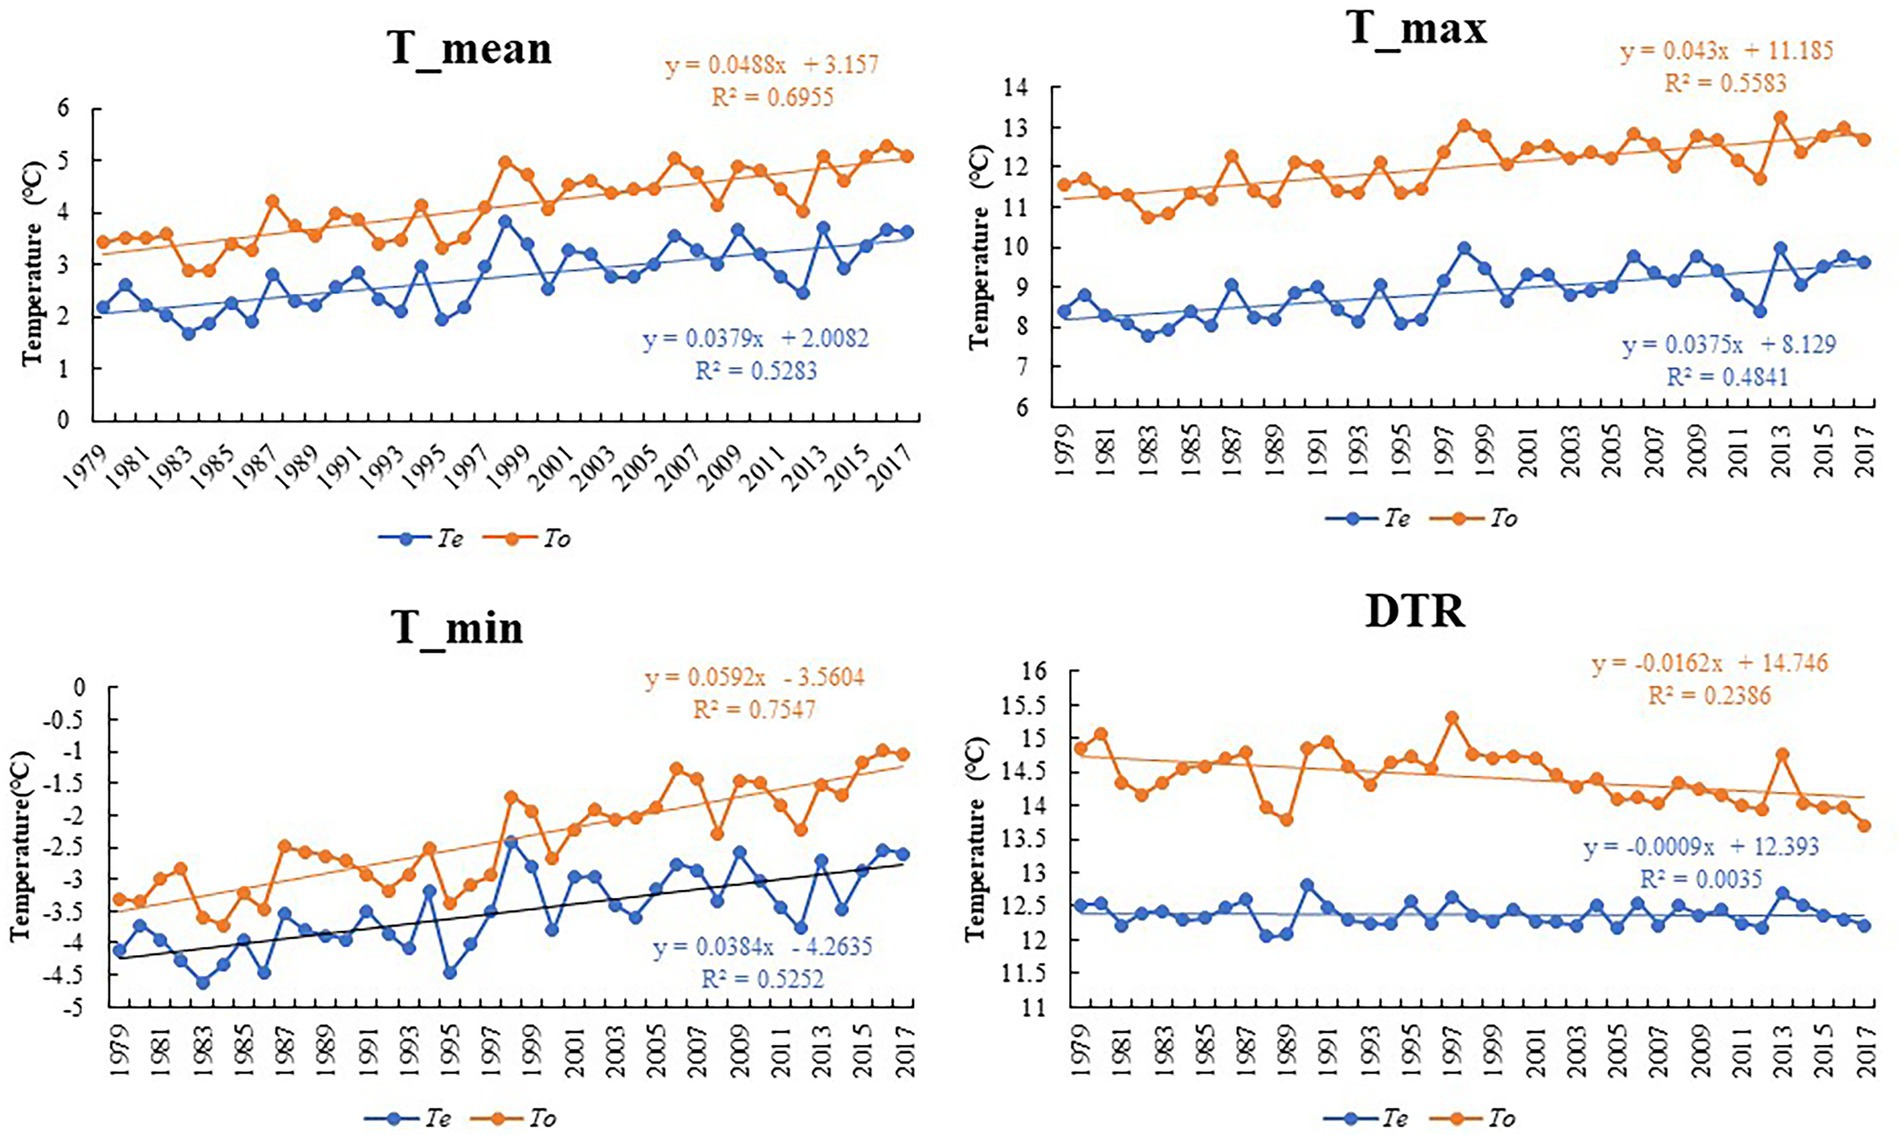
Figure 4. Trends in daily temperature and DTR in observation and ERA5-Land datasets from 1979 to 2017 in the QLM.
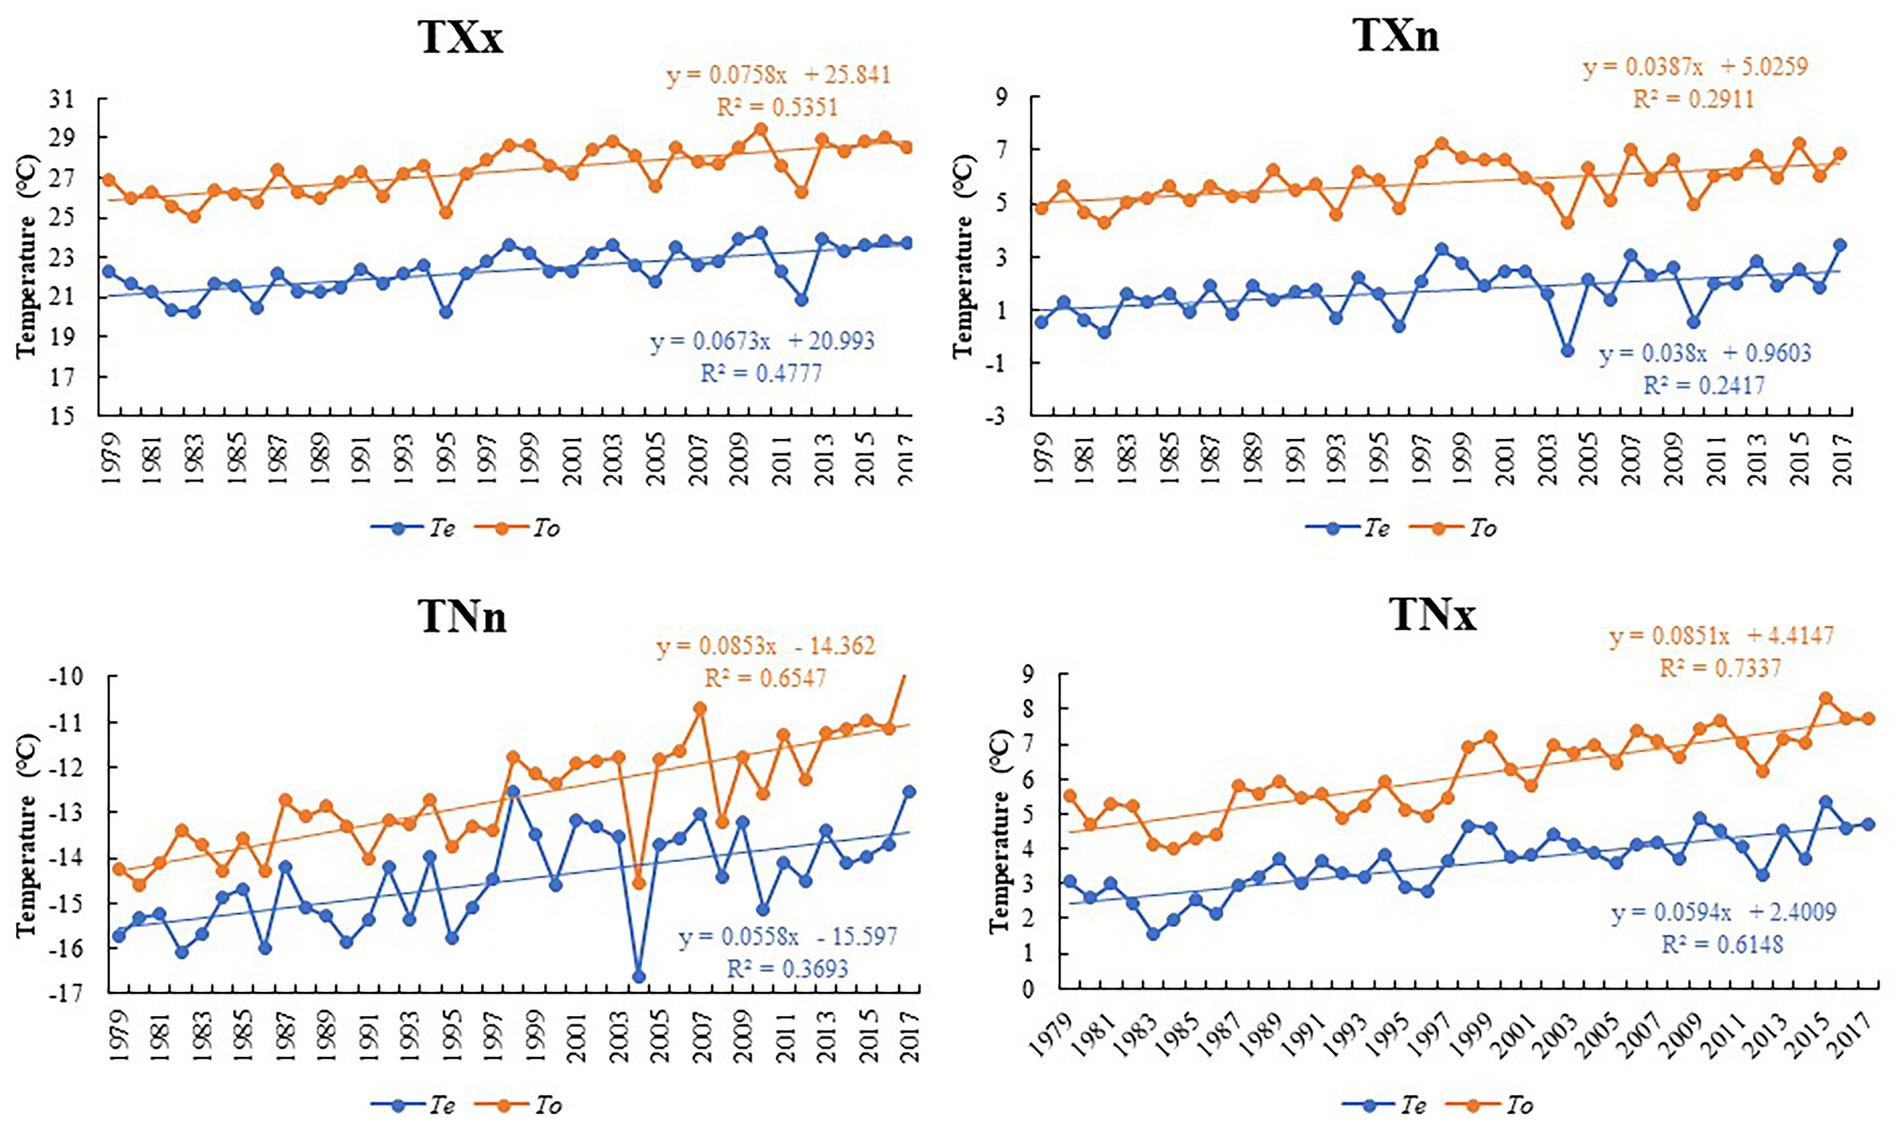
Figure 5. Trends in absolute indices of extreme temperature in observation and ERA5-Land datasets from 1979 to 2017 in the QLM.
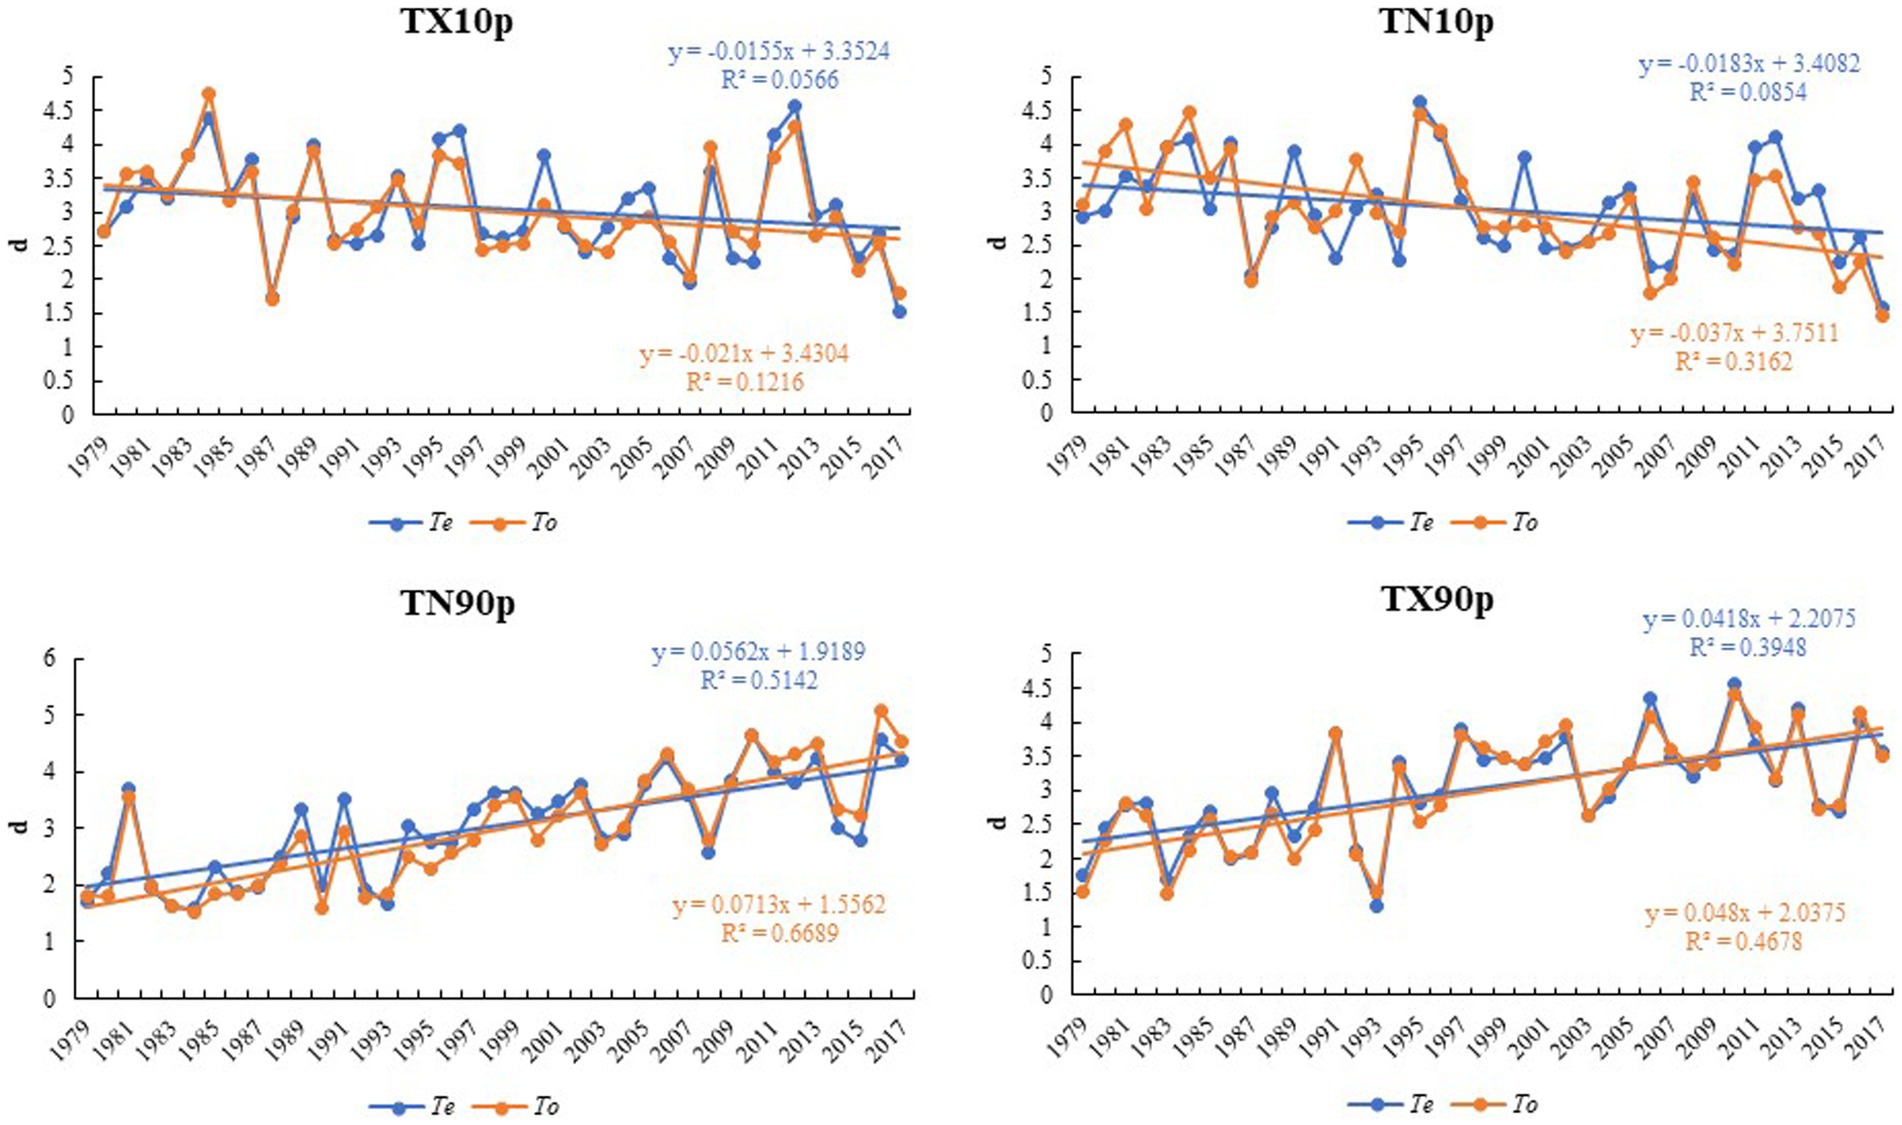
Figure 6. Trends in percentile-based indices of extreme temperature in observation and ERA5-Land datasets from 1979 to 2017 in the QLM.

Figure 7. Trends in threshold indices of extreme temperature in observation and ERA5-Land datasets from 1979 to 2017 in the QLM.

Table 10. Trends in daily temperature and extreme temperature indices in ERA5-Land and observation datasets in the QLM from 1979 to 2017 (The units of T_mean, T_max, T_min, TXn, TNn, TXx, TNx, and DTR are°C/decade; the units of TX10p, TN10p, TX90p, TN90p, ID0, and FD0 are day/decade).
3.4. Possible bias analysis
Observational data in the QLM were underestimated by ERA5-Land for daily temperature, DTR, and absolute indices of extreme temperature (Figures 4, 5). Our results are similar to previous studies. (Zhao P. et al., 2020; Huai et al., 2021; Zou et al., 2022; Zhao and He, 2022a). Many studies indicated that the main reason for bias in reanalysis temperature data is the elevation difference between Te and To (Gao et al., 2014, 2018; Xu et al., 2022). The linear relationship between Te and To bias and elevation difference is shown in Figure 8, the R2 values of T_mean, T_max and T_min were 0.541, 0.454, and 0.469, respectively. The daily biases were related to the elevation difference between Te and To, especially for T_mean. The simulation reliability of ERA5-Land increased with a decrease in the elevation difference (Zhao and He, 2022a). Therefore, it is possible to correct ERA5-Land reanalysis temperature through a temperature lapse-rate model to further reduce the error and improve the precision of temperature reanalysis (Dee and Uppala, 2009; Gao et al., 2012; Di Giuseppe et al., 2013; Gao et al., 2017). The number of meteorological stations used in this study is small, especially above 3,500 m. However, many studies have shown that the limited number of meteorological stations is sufficient to effectively and accurately evaluate the applicability of reanalysis data (Huai et al., 2021; Jiao et al., 2021). We believe that the bias is mainly caused by the elevation difference between Te and To. Other factors, such as the interpolation method, terrain complexity, and glaciers, are also potential sources of bias (Huang et al., 2022; Zhao and He, 2022a). The DISO values of T_mean, T_max and T_min were 2.44, 0.62 and 2.19, respectively. Due to the high altitude of the Qilian Mountain, complex terrain and few meteorological observation points, the accuracy of simulation is influenced (Xu et al., 2022). Large DISO values have been found at those stations located within the QLM. Therefore, the bias between the observed values and the reanalysis values within the QLM is higher than that in the surrounding areas such as Hexi Corridor. This may be due to the complicated terrain inside the Qilian Mountains (Zhao and He, 2022a).
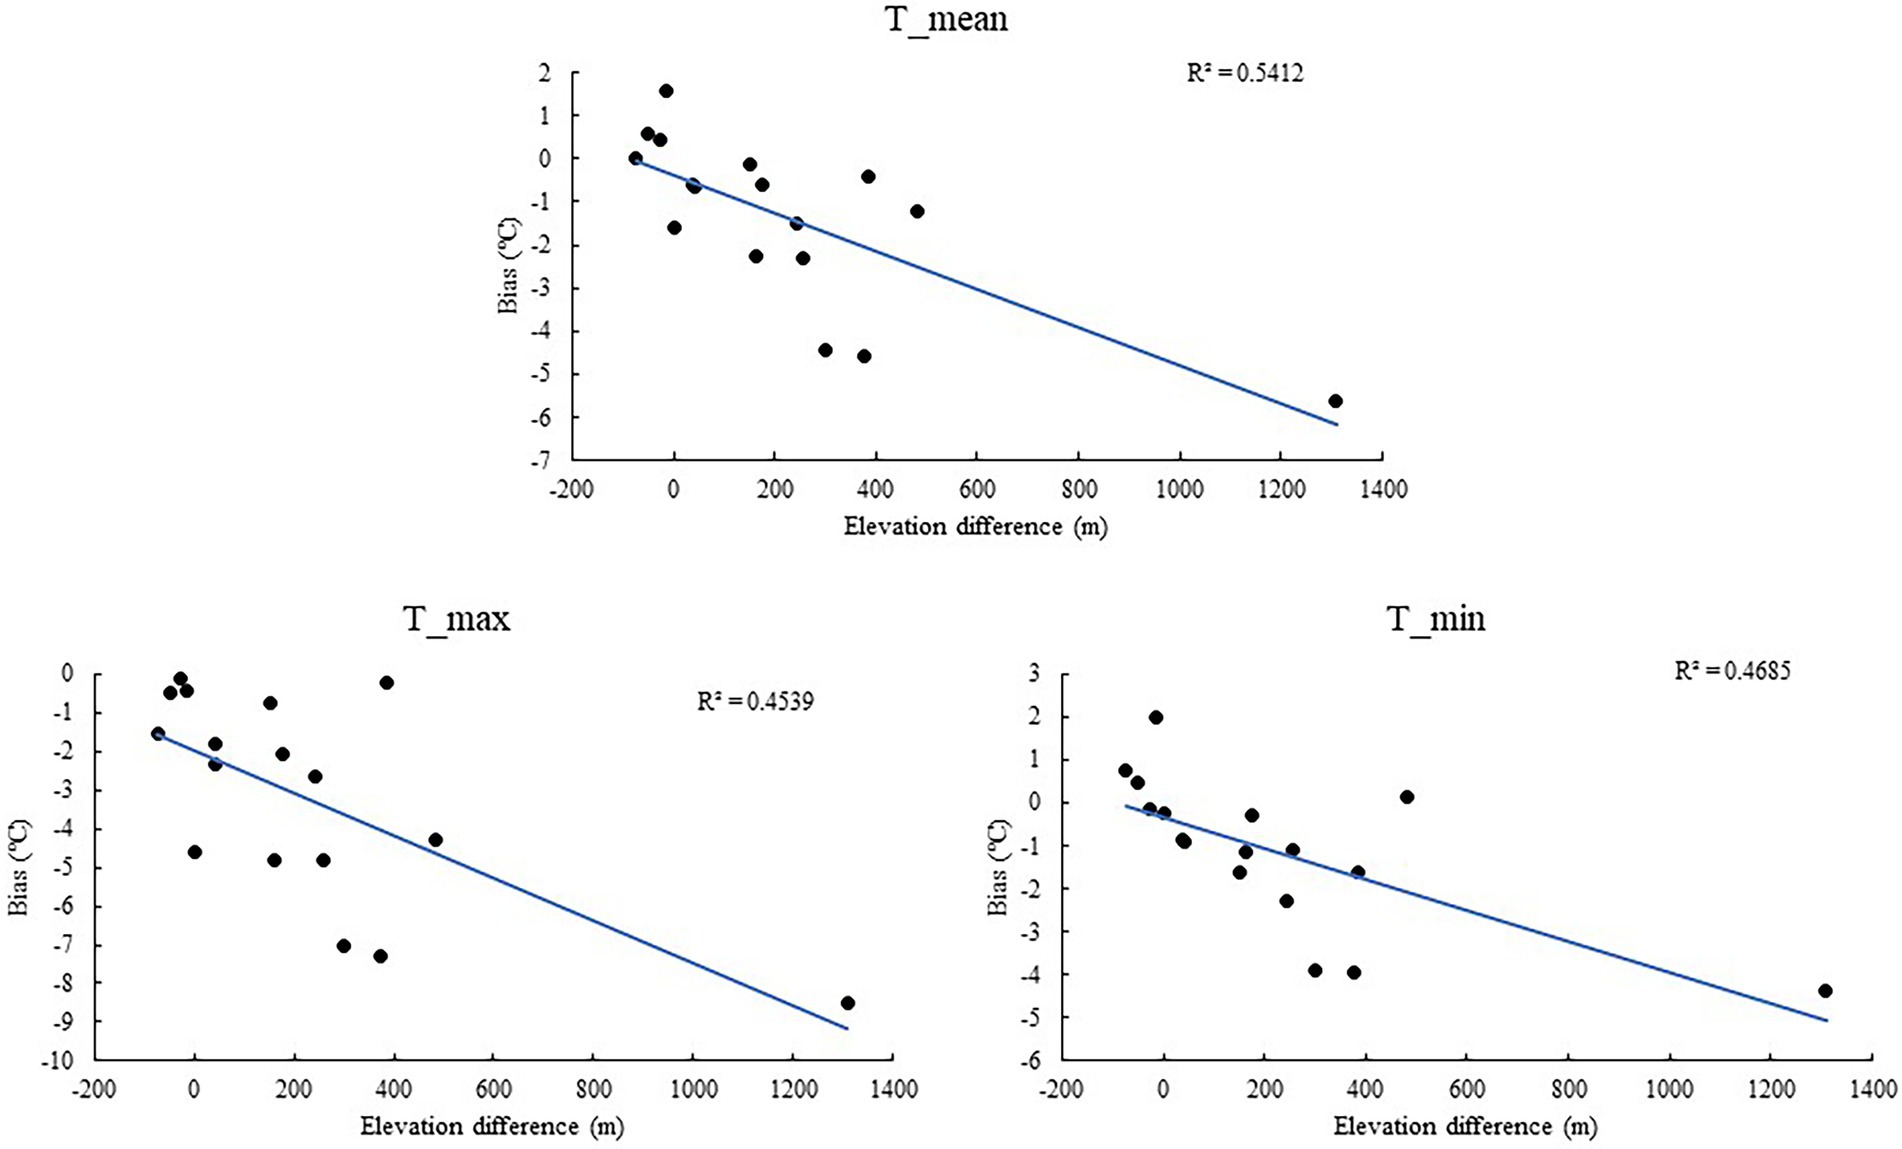
Figure 8. Relationship of bias and elevation differences between ERA5-Land daily temperature and daily observations in the QLM during the period of 1979–2017.
4. Conclusions
In this study, we evaluated the ability of ERA5-Land reanalysis to capture extreme temperatures in the Qilian Mountains. The R2 between ERA5-Land and observed T_mean, T_max, and T_min was 0.99, 0.99, and 0.98, respectively, which indicates that ERA5-Land can capture observational daily temperature data well. However, an average DISO at all stations of T_mean, T_max, and T_min was 2.44, 0.62, and 2.19, respectively, indicating that the reliability of capturing the T_max of ERA5-Land reanalysis temperature data is better than that of the T_mean and T_min in the QLM. ERA5-Land performed well in capturing extreme temperature indices TXx, TX90p and FD0. DISO for TXx was <0.5 at 12 stations accounting for approximately 71% of all stations. DISO for TX90p was <0.5 at 9 stations accounting for approximately 53% of all stations. ERA5-Land captured FD0 very well, with DISO <0.5 for 15 meteorological stations and an average of 0.27. The mean DISO values of the warmest days (TXx) in spring, summer, autumn and winter were 0.31, 0.16, 0.32 and 0.93, 131 respectively, showing that evaluation results of the extreme temperature index on the seasonal scale show that the capture results of ERA5-Land on the extreme temperature index are best in summer. Furthermore, our results show that ERA5-Land is able to capture trends in all extreme temperature indices except DTR, for the observational DTR showed a large decreasing trend (−0.162°C/decade), while DTR of ERA5-Land showed only a slightly decreasing trend (−0.009°C/decade). The R2 values between temperature bias and elevation difference of T_mean, T_max, and T_min were 0.541, 0.454 and 0.469, respectively, showing that the elevation difference between ERA5-Land reanalysis temperature data and observation data may be the main cause of temperature bias. Generally, ERA5-Land reanalysis temperature data were reliable in simulating temperature data and identifying extreme temperature events; we conclude that ERA5-Land can be applied in the QLM for climate change research.
Data availability statement
The datasets presented in this study can be found in online repositories. The names of the repository/repositories and accession number (s) can be found below: https://cds.Climate.copernicus.eu/cdsapp#!/dataset/reanalysis-era5-land?tab=form.
Author contributions
PZ: designed study, collected meteorological data, and write article. DM and WW: final edit. ZH: provide fund support. All authors contributed to the article and approved the submitted version.
Funding
This study was supported by the National Natural Science Foundation of China, No. 41621001, and the Strategic Priority Research Program of the Chinese Academy of Sciences, No. XDA23060301.
Conflict of interest
The authors declare that the research was conducted in the absence of any commercial or financial relationships that could be construed as a potential conflict of interest.
Publisher’s note
All claims expressed in this article are solely those of the authors and do not necessarily represent those of their affiliated organizations, or those of the publisher, the editors and the reviewers. Any product that may be evaluated in this article, or claim that may be made by its manufacturer, is not guaranteed or endorsed by the publisher.
Footnotes
References
Alexander, M., and Gregor, B. (2020). Demystifying the use of ERA5-land and machine learning for wind power forecasting. IET Renew. Power Gen. 14, 4159–4168. doi: 10.1049/iet-rpg.2020.0576
Araujo, C. S. P., Silva, I., Ippolito, M., and Almeida, C. (2022). Evaluation of air temperature estimated by ERA5-land reanalysis using surface data in Pernambuco. Brazil Environ. Monit. Assess. 194:381. doi: 10.1007/s10661-022-10047-2
Cao, B., Gruber, S., Zheng, D., and Li, X. (2020). The ERA5-land soil temperature bias in permafrost regions. Cryosphere 14, 2581–2595. doi: 10.5194/tc-14-2581-2020
Dee, D. P., and Uppala, S. (2009). Variational bias correction of satellite radiance data in the ERA-interim reanalysis. Q. J. R. Meteorol. Soc. 135, 1830–1841. doi: 10.1002/qj.493
Deng, S.-F., Yang, T.-B., Zeng, B., Zhu, X.-F., and Xu, H.-J. (2013). Vegetation cover variation in the Qilian Mountains and its response to climate change in 2000–2011. J. Mt. Sci. 10, 1050–1062. doi: 10.1007/s11629-013-2558-z
Di Giuseppe, F., Molteni, F., and Dutra, E. (2013). Real-time correction of ERA-interim monthly rainfall. Geophys. Res. Lett. 40, 3750–3755. doi: 10.1002/grl.50670
Gao, L., Bernhardt, M., and Schulz, K. (2012). Elevation correction of ERA-interim temperature data in complex terrain. Hydrol. Earth Syst. Sci. 16, 4661–4673. doi: 10.5194/hess-16-4661-2012
Gao, L., Bernhardt, M., Schulz, K., and Chen, X. (2017). Elevation correction of ERA-interim temperature data in the Tibetan plateau. Int. J. Climatol. 37, 3540–3552. doi: 10.1002/joc.4935
Gao, L., Hao, L., and Chen, X.-W. (2014). Evaluation of ERA-interim monthly temperature data over the Tibetan plateau. J. Mt. Sci. 11, 1154–1168. doi: 10.1007/s11629-014-3013-5
Gao, L., Wei, J., Wang, L., Bernhardt, M., Schulz, K., and Chen, X. (2018). A high-resolution air temperature data set for the Chinese Tian Shan in 1979–2016. Earth Syst. Sci. Data 10, 2097–2114. doi: 10.5194/essd-10-2097-2018
Hong, T., Li, H., and Chen, M. (2021). Comprehensive evaluations on the error characteristics of the state-of-the-art gridded precipitation products over Jiangxi Province in 2019. Earth Space Sci. 8. doi: 10.1029/2021EA001787
Hu, Z., Chen, D., and Chen, X. (2022). CCHZ-DISO: a timely new assessment system for data quality or model performance from Da Dao Zhi Jian. Geophys. Res. Lett. 49:e2022GL100681. doi: 10.1029/2022GL100681
Hu, Z., Chen, X., Zhou, Q., Chen, D., and Li, J. (2019). DISO: a rethink of Taylor diagram. Int. J. Climatol. 39, 2825–2832. doi: 10.1002/joc.5972
Hu, L., Huang, G., and Hu, K. (2017). The performance of multiple datasets in characterizing the changes of extreme air temperature over China during 1979. Theor. Appl. Climatol. 133, 619–632. doi: 10.1007/s00704-017-2215-5
Huai, B., Wang, J., Sun, W., Wang, Y., and Zhang, W. (2021). Evaluation of the near-surface climate of the recent global atmospheric reanalysis for Qilian Mountains, Qinghai-Tibet plateau. Atmos. Res. 250:105401. doi: 10.1016/j.atmosres.2020.105401
Huang, X., Han, S., and Shi, C. (2022). Evaluation of three air temperature reanalysis datasets in the alpine region of the Qinghai–Tibet plateau. Remote Sens. 14, 1–24. doi: 10.3390/rs14184447
IPCC (2021). Climate Change 2021: The Physical Science Basis. V. Masson-Delmotte, et al. ed. Contribution of Working Group I to the Sixth assessment report of the intergovernmental panel on climate change Cambridge, United Kingdom: Cambridge University Press.
Jiang, L., Tawia, H. D. F., and Yi, L. (2020). Global land surface temperature change (2003–2017) and its relationship with climate drivers: AIRS, MODIS, and ERA5-land based analysis. Remote Sens. 13, 1–20. doi: 10.3390/rs13010044
Jiao, D., Xu, N., Yang, F., and Xu, K. (2021). Evaluation of spatial-temporal variation performance of ERA5 precipitation data in China. Sci. Rep. 11:17956. doi: 10.1038/s41598-021-97432-y
Jintao, X., Ziqiang, M., Songkun, Y., and Jie, P. (2022). Do ERA5 and ERA5-land precipitation estimates outperform satellite-based precipitation products? A comprehensive comparison between state-of-the-art model-based and satellite-based precipitation products over mainland China. J. Hydrol. 605, 1–16. doi: 10.1016/j.jhydrol.2021.127353
Joaquín, M. S., Emanuel, D., Anna, A. P., Clément, A., Gabriele, A., Gianpaolo, B., et al. (2021). ERA5-land: a state-of-the-art global reanalysis dataset for land applications. Earth Syst. Sci. Data 13, 4349–4383. doi: 10.5194/essd-13-4349-2021
Konstantinos, S., George, V., Aikaterini, V., Anastasios, P., and Elias, D. (2021). Delineating the relative contribution of climate related variables to chlorophyll-a and phytoplankton biomass in lakes using the ERA5-land climate reanalysis data. Water Res. 196, 1–16. doi: 10.1016/j.watres.2021.117053
Lei, X., Xu, W., Chen, S., Yu, T., Hu, Z., Zhang, M., et al. (2022). How well does the ERA5 reanalysis capture the extreme climate events over China? Part I: extreme precipitation. Front. Environ. Sci. 10:921658. doi: 10.3389/fenvs.2022.921658
Li, Y., Qin, X., Liu, Y., Jin, Z., Liu, J., Wang, L., et al. (2022). Evaluation of long-term and high-resolution gridded precipitation and temperature products in the Qilian Mountains, Qinghai–Tibet plateau. Front. Environ. Sci. 10:906821. doi: 10.3389/fenvs.2022.906821
Lin, P., He, Z., du, J., Chen, L., Zhu, X., and Li, J. (2017). Recent changes in daily climate extremes in an arid mountain region, a case study in northwestern China's Qilian Mountains. Sci. Rep. 7:2245. doi: 10.1038/s41598-017-02345-4
Liu, L., Gu, H., Xie, J., and Xu, Y. P. (2020). How well do the ERA-interim, ERA-5, GLDAS-2.1 and NCEP-R2 reanalysis datasets represent daily air temperature over the Tibetan plateau? Int. J. Climatol. 41, 1484–1505. doi: 10.1002/joc.6867
Liu, J., Hagan, D. F. T., and Liu, Y. (2020). Global land surface temperature change (2003–2017) and its relationship with climate drivers: AIRS, MODIS, and ERA5-land based analysis. Remote Sens. 13, 1–20. doi: 10.3390/rs13010044
Luis, R. C., and Johannes, S. (2020). Simulation of multi-annual time series of solar photovoltaic power: is the ERA5-land reanalysis the next big step? Sustain. Energy Technol. Assess. 42, 1–12. doi: 10.1016/j.seta.2020.100829
Pelosi, A., and Chirico, G. B. (2021). Regional assessment of daily reference evapotranspiration: can ground observations be replaced by blending ERA5-land meteorological reanalysis and CM-SAF satellite-based radiation data? Agric. Water Manag. 258:107169. doi: 10.1016/j.agwat.2021.107169
Pelosi, A., Terribile, F., D’Urso, G., and Chirico, G. B. (2020). Comparison of ERA5-land and UERRA MESCAN-SURFEX reanalysis data with spatially interpolated weather observations for the regional assessment of reference evapotranspiration. Water 12, 1–22. doi: 10.3390/w12061669
Rakhmatova, N., Arushanov, M., Shardakova, L., Nishonov, B., Taryannikova, R., Rakhmatova, V., et al. (2021). Evaluation of the perspective of ERA-interim and ERA5 Reanalyses for calculation of drought indicators for Uzbekistan. Atmos. 12, 1–14. doi: 10.3390/atmos12050527
Ruml, M., Gregorić, E., Vujadinović, M., Radovanović, S., Matović, G., Vuković, A., et al. (2017). Observed changes of temperature extremes in Serbia over the period 1961-2010. Atmos. Res. 183, 26–41. doi: 10.1016/j.atmosres.2016.08.013
Ruqing, Z., Li, L., Zhang, Y., Huang, F. N., Li, J. D., Liu, W., et al. (2021). Assessment of agricultural drought using soil water deficit index based on ERA5-land soil moisture data in four southern provinces of China. Agriculture 11, 1–19. doi: 10.3390/agriculture11050411
Shtober-Zisu, N., and Wittenberg, L. (2021). Long-term effects of wildfire on rock weathering and soil stoniness in the Mediterranean landscapes. Sci. Total Environ. 762:143125. doi: 10.1016/j.scitotenv.2020.143125
Sun, X.-B., Ren, G. Y., Shrestha, A. B., Ren, Y. Y., You, Q. L., Zhan, Y. J., et al. (2017). Changes in extreme temperature events over the Hindu Kush Himalaya during 1961–2015. Adv. Clim. Chang. Res. 8, 157–165. doi: 10.1016/j.accre.2017.07.001
Supari, T. F., Juneng, L., and Aldrian, E. (2017). Observed changes in extreme temperature and precipitation over Indonesia. Int. J. Climatol. 37, 1979–1997. doi: doi: 10.1002/joc.4829
Virman, M., Bister, M., Räisänen, J., Sinclair, V. A., and Järvinen, H. (2021). Radiosonde comparison of ERA5 and ERA-interim reanalysis datasets over tropical oceans. Dynam. Meteorol. Oceanogr. 73, 1–7. doi: 10.1080/16000870.2021.1929752
Wang, L., Chen, R., Han, C., Wang, X., Liu, G., Song, Y., et al. (2019). Change characteristics of precipitation and temperature in the Qilian Mountains and Hexi oasis, northwestern China. Environ. Earth Sci. 78, 1–13. doi: 10.1007/s12665-019-8289-x
Wang, X., Chen, R., Han, C., Yang, Y., Liu, J., Liu, Z., et al. (2019). Response of frozen ground under climate change in the Qilian Mountains, China. Quat. Int. 523, 10–15. doi: 10.1016/j.quaint.2019.06.006
Wu, Z., Feng, H., He, H., Zhou, J., and Zhang, Y. (2021a). Evaluation of soil moisture climatology and anomaly components derived from ERA5-land and GLDAS-2.1 in China. Water Resour. Manag. 35, 629–643. doi: 10.1007/s11269-020-02743-w
Wu, Z., Feng, H., He, H., Zhou, J., and Zhang, Y. (2021b). Evaluation of soil moisture climatology and anomaly components derived from ERA5-land and GLDAS-2.1 in China. Water Resour. Manag. 35, 629–643. doi: 10.1007/s11269-020-02743-w
Xin, Y., Lu, N., Jiang, H., Liu, Y., and Yao, L. (2021). Performance of ERA5 reanalysis precipitation products in the Guangdong-Hong Kong-Macao greater Bay Area, China. J. Hydrol. 602:126791. doi: 10.1016/j.jhydrol.2021.126791
Xu, W., Lei, X. Y., Chen, S. T., Yu, T. T., Hu, Z. Y., Zhang, M., et al. (2022). How well does the ERA5 reanalysis capture the extreme climate events over China? Part II: extreme temperature. Front. Environ. Sci. 10, 1–15. doi: 10.3389/fenvs.2022.921659
Yang, L., Feng, Q., Adamowski, J. F., Alizadeh, M. R., Yin, Z., Wen, X., et al. (2021). The role of climate change and vegetation greening on the variation of terrestrial evapotranspiration in Northwest China's Qilian Mountains. Sci. Total Environ. 759:143532. doi: 10.1016/j.scitotenv.2020.143532
Yin, H., and Sun, Y. (2017). Characteristics of extreme temperature and precipitation in China in based on ETCCDI indices. Adv. Clim. Chang. Res. 9, 218–226. doi: 10.1016/j.accre.2019.01.001
Yu, X., Ren, G., Zhang, P., Hu, J., Liu, N., Li, J., et al. (2020). Extreme temperature change of the last 110 years in Changchun Northeast China. Adv. Atmos. Sci. 37, 347–358. doi: 10.1007/s00376-020-9165-z
Zandler, H., Senftl, T., and Vanselow, K. A. (2020). Reanalysis datasets outperform other gridded climate products in vegetation change analysis in peripheral conservation areas of Central Asia. Sci. Rep. 10:22446. doi: 10.1038/s41598-020-79480-y
Zhao, P., Gao, L., Wei, J., Ma, M., Deng, H., Gao, J., et al. (2020). Evaluation of ERA-interim air temperature data over the Qilian Mountains of China. Adv. Meteorol. 2020, 1–11. doi: 10.1155/2020/7353482
Zhao, C., Gong, J., Wang, H., Wei, S., Song, Q., et al. (2020). Changes of temperature and precipitation extremes in a typical arid and semiarid zone: observations and multi-model ensemble projections. Int. J. Climatol. 40, 5128–5153. doi: 10.1002/joc.6510
Zhao, P., and He, Z. (2022a). A first evaluation of ERA5-land reanalysis temperature product over the Chinese Qilian Mountains. Front. Earth Sci. 10. doi: 10.3389/feart.2022.907730
Zhao, P., and He, Z. (2022b). Temperature change characteristics in Gansu Province of China. Atmos. 13, 1–13. doi: 10.3390/atmos13050728
Zhou, Q., Chen, D., Hu, Z., and Chen, X. (2021). Decompositions of Taylor diagram and DISO performance criteria. Int. J. Climatol. 41, 5726–5732. doi: 10.1002/joc.7149
Zhou, J., Li, Q., Wang, L., Lei, L., Huang, M., Xiang, J., et al. (2019). Impact of climate change and land-use on the propagation from meteorological drought to hydrological drought in the eastern Qilian Mountains. Water 11, 1–19. doi: 10.3390/w11081602
Zhou, B., Xu, Y., Wu, J., Dong, S., and Shi, Y. (2016). Changes in temperature and precipitation extreme indices over China: analysis of a high-resolution grid dataset. Int. J. Climatol. 36, 1051–1066. doi: 10.1002/joc.4400
Zhu, J., Huang, D.-Q., Yan, P.-W., Huang, Y., and Kuang, X.-Y. (2016). Can reanalysis datasets describe the persistent temperature and precipitation extremes over China? Theor. Appl. Climatol. 130, 655–671. doi: 10.1007/s00704-016-1912-9
Keywords: reanalysis, extreme temperature, ERA5-Land, Qilian Mountains, climate change
Citation: Zhao P, He Z, Ma D and Wang W (2023) Evaluation of ERA5-Land reanalysis datasets for extreme temperatures in the Qilian Mountains of China. Front. Ecol. Evol. 11:1135895. doi: 10.3389/fevo.2023.1135895
Edited by:
Wei Zhao, Institute of Geographic Sciences and Natural Resources Research (CAS), ChinaReviewed by:
Zengyun Hu, Xinjiang Institute of Ecology and Geography (CAS), ChinaSergio Noce, Foundation Euro-Mediterranean Center on Climate Change (CMCC), Italy
Copyright © 2023 Zhao, He, Ma and Wang. This is an open-access article distributed under the terms of the Creative Commons Attribution License (CC BY). The use, distribution or reproduction in other forums is permitted, provided the original author(s) and the copyright owner(s) are credited and that the original publication in this journal is cited, in accordance with accepted academic practice. No use, distribution or reproduction is permitted which does not comply with these terms.
*Correspondence: Zhibin He, ✉ aHpibWFpbEBsemIuYWMuY24=
 Peng Zhao
 Zhibin He
 Dengke Ma1
,2
