 Ben Stelling
 Edward Phlips
 Susan Badylak
95% of researchers rate our articles as excellent or good
Learn more about the work of our research integrity team to safeguard the quality of each article we publish.
Find out more
ORIGINAL RESEARCH article
Front. Ecol. Evol. , 01 March 2023
Sec. Biogeography and Macroecology
Volume 11 - 2023 | https://doi.org/10.3389/fevo.2023.1134069
This article is part of the Research Topic Environmental Threats to the State of Florida—Climate Change and Beyond, volume II View all 10 articles
Seasonal patterns of phytoplankton biomass and composition in the inner continental shelf off Cape Canaveral on the east coast of Florida were examined for a 6-year period (2013–2019). In situ water samples were collected and analyzed for chlorophyll a, phytoplankton biomass and composition, along with water quality parameters. Regional satellite data on chlorophyll a, and temperature was also obtained from NASA. Average chlorophyll a values over the study period ranged from 0.63 ± 0.03 μg L−1 in the summer to 2.55 ± 0.10 μg L−1 in the fall. Phytoplankton community composition also showed seasonal differences, with persistent dominance by picoplanktonic cyanobacteria in the summer, but mixed dominance by picocyanobacteria and dinoflagellates in the fall. Seasonal differences were attributed to a shift in predominant seasonal wind directions, which drive water along the coast from the north in the fall and winter, but from the south in the spring and summer, including eddies and upwelling from the Gulf Stream. Water masses moving along the Florida coast from the north are influenced by nutrient and phytoplankton-enriched inputs from estuaries along the north coast of Florida, explaining the higher phytoplankton biomass levels on the Cape Canaveral shelf in the fall and winter. Seasonal patterns observed in this study demonstrate the importance of allochthonous influences on phytoplankton biomass and composition, and highlight the potential sensitivity of phytoplankton communities to continuing cultural eutrophication and future climate changes, including the frequency and intensity of tropical storms, and alterations in discharges from land.
Coastal shelf habitats are among the most productive regions in the marine environment (Harris et al., 2014). High productivity is in part driven by the proximity to nutrient inputs from land for both planktonic and benthic primary producer communities (Falkowski et al., 1998, Herrmann et al., 2015, Cloern et al., 2014). The shallow nature of shelf environments also accentuates light availability for photosynthesis and access to nutrients in benthic sediments (Harris et al., 2014). Coastal waters of Florida in the southeastern United States have extensive continental shelf habitats on both the Atlantic Ocean and Gulf of Mexico sides of the peninsula. The shelf on the Gulf side is subject to inputs from several major rivers, including the Mississippi, Apalachicola, Suwannee, and Caloosahatchee Rivers. The Gulf shelf is also subject to frequent and intense toxic red tides (Steidinger, 2009; Vargo, 2009; Heil et al., 2014), which can be disruptive for the health of marine fauna and humans (Hoagland et al., 2014; Grattan et al., 2016). Due in part to the high frequency of red tides, the Gulf of Mexico has been the subject of extensive research on phytoplankton ecology (Heil et al., 2014). By contrast, phytoplankton communities on the Atlantic shelf of Florida have received less attention (Atkinson et al., 1978, 1984; Yoder, 1985; Yoder et al., 1985; Barnard et al., 1997), despite the important fishery and recreational resources located along the entire east coast of the state (Iafrate et al., 2019).
The Atlantic shelf of Florida is subject to inputs from a major river (St. Johns River) and inlets connected to restricted lagoons within the barrier islands spanning the east coast of the state. Rapid human development along the eastern seaboard of Florida since the 1940s has led to accelerated eutrophication of coastal environments (Tillman et al., 2004; Winkler and Ceric, 2004; Badruzzaman et al., 2012; Lapointe et al., 2015; Longley et al., 2019, Herren et al., 2021). The limited understanding of phytoplankton communities on the eastern continental shelf of Florida is reflective of the relative scarcity of extensive studies on sub-tropical and tropical phytoplankton compared to temperate ecosystems (Cloern and Jassby, 2008; Winder and Cloern, 2010; Zingone et al., 2010; Carstensen et al., 2015; Estrada et al., 2016; Liu et al., 2022). However, rapid human development in sub-tropical and tropical regions around the world has increased rates of cultural eutrophication, highlighting the need to better understand the factors that drive phytoplankton composition and dynamics in these coastal regions, especially with the possible exacerbating impacts of climate change (Nixon, 1995; Paerl et al., 2006; Heisler et al., 2008; Glibert and Burkholder, 2020; Griffith and Gobler, 2020; Anderson et al., 2021).
This study focused on the inner shelf environment off the coast of Cape Canaveral, located in the central east coast of Florida (Figure 1), which is part of the southern extent of the South Atlantic Bight (Miles and He, 2010). Studies on phytoplankton biomass on the shelf of the South Atlantic Bight have mainly involved satellite-based investigations of chlorophyll distribution, or short-term transect studies of phytoplankton biomass (Verity et al., 1998; Bontempi and Yoder, 2004; Martins and Pelegrí, 2006; Signorini and McClain, 2007; Miles and He, 2010). To date, there have been no extended in situ time-series studies of phytoplankton biomass and composition off the coast of east-central Florida.
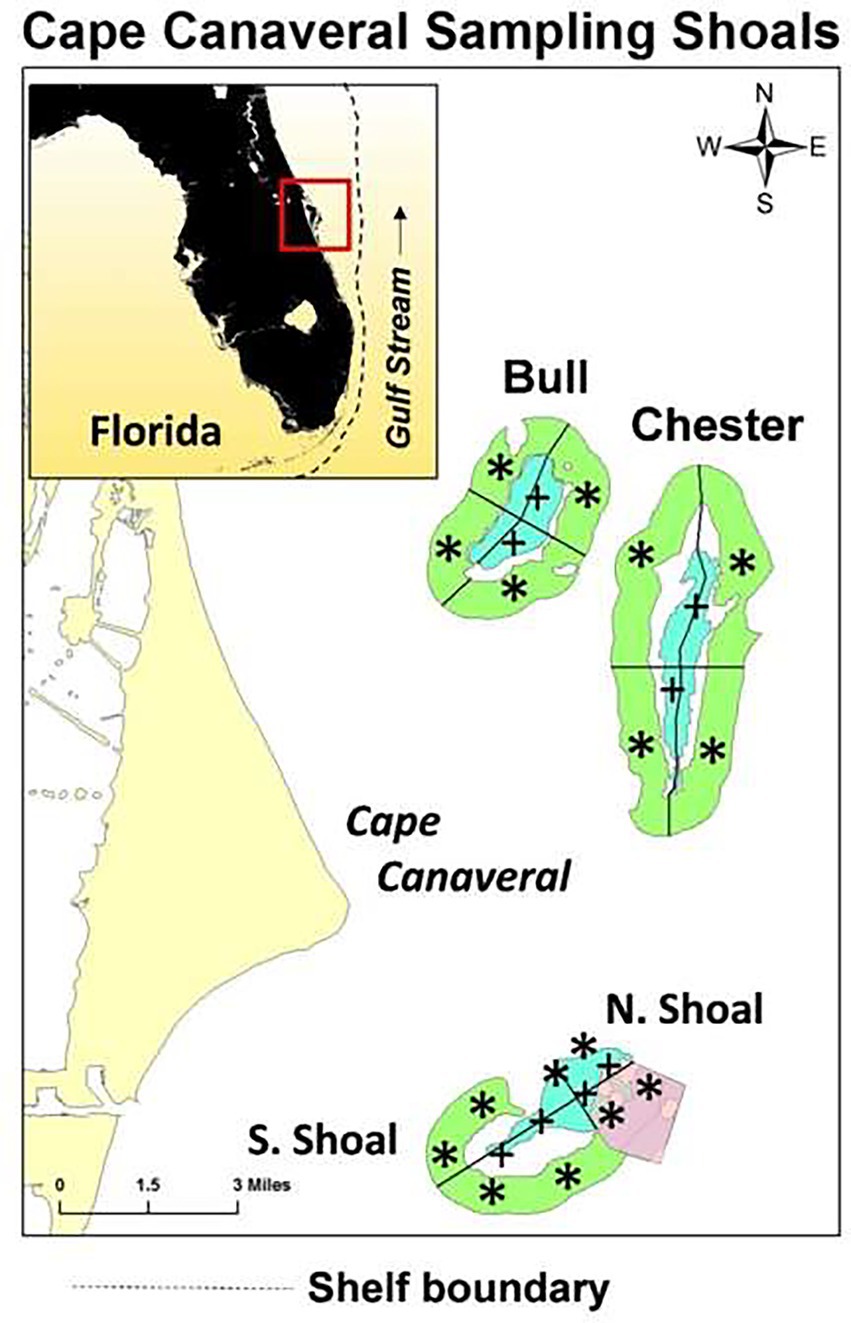
Figure 1. East coast of Florida showing the location of the Cape Canaveral Shelf (CCS) sampling region. Four sub-regions include Bull Shoal, Chester Shoal, North Shoal, and South Shoal. Ridge areas are shown in blue and swale areas in green. Sampling locations in each region are marked as “+” for ridge sites and “*” for swale sites. The pink area in North Shoal was the site of dredging activity for beach re-nourishment in the early winter of 2013.The inset shows the location of the study region and the dotted line shows the boundary of the shelf. SJR is outlet of the St. Johns River, SAI is the St. Augustine Inlet, MI is the Matanzas Inlet, and PI is the Ponce de Leon Inlet.
The Cape Canaveral shelf (CCS) is bordered on the eastern side by the Gulf Stream, which impacts the region via eddies that propagate from the western side of the stream and upwelling of deep Gulf Stream water, particularly during the summer (Atkinson, 1977; Atkinson et al., 1978; Iafrate et al., 2019). The shelf region is also impacted by wind-driven longshore currents along the east coast of Florida (Lee et al., 1985; AlYousif et al., 2021). Longshore currents from the north flow toward the CCS and are subject to influxes of nutrient- and phytoplankton-rich water from rivers and inlets linked to estuaries within the system of barrier islands spanning the east coast of Florida. While currents from the south, including the Florida Current (Gulf Stream), bring in phytoplankton communities of more tropical origin to the CCS.
The goal of this study was to describe temporal trends of phytoplankton biomass and composition using the results of a 6-year in situ examination of chlorophyll a, phytoplankton composition & biomass, and selected water quality parameters for the CCS. The results were compared to chlorophyll a values obtained from NASA’s MODIS-Aqua satellite (Justice et al., 1998; Miles and He, 2010; Gorelick et al., 2017). Together, the results provide a view of seasonal shifts in phytoplankton communities, and the environmental conditions associated with the shifts. The bases for the seasonal patterns are discussed within the context of the climatic conditions, hydrodynamic characteristics, and land influences on the continental shelf environment of the east coast of Florida.
Water samples were collected seasonally, from the fall of 2013 through the summer of 2019. One date from the winter, spring, summer and fall of each year for a total of 23 separate sampling dates. The sampling area was located ~5 miles off the coast of Cape Canaveral, FL and 24 sampling sites were divided evenly among four regions: Chester, Bull, North Shoal, and South Shoal (Figure 1). The North and South shoal were part of the same shoal, and Chester and Bull sites represented other shoals north. Sites were split between shallower ridge and deeper swale sites (Figure 1). This was done to ensure that sampling sites occurred inside the ridge and swale portions of the Cape Canaveral shoals.
Surface water column samples and associated field data were collected at all 24 sites using a 3-m water-column, integrating pole sampler. The pole sampler was used to help avoid misrepresentation of surface water phytoplankton abundances due to surface scums or discrete depth chlorophyll maxima. At each site, a minimum of five poles of water taken to yield at least five liters of water, mixed and sub-samples were immediately withdrawn for subsequent analyses of chlorophyll a concentrations, phytoplankton composition and biomass, total phosphorus (TP) and total nitrogen (TN) concentrations.
At each sampling site, water temperatures and salinity were recorded using a YSI multi-parameter field probe ~0.5 m from the surface, aliquots of whole water were tested for turbidity using a LaMotte meter (APHA, 2005), and Secchi disk depths were determined to provide data on light attenuation.
Sub-samples of water were frozen immediately after collection, then TN and TP concentrations were determined by the Soil and Water Science Department Wetland Biogeochemistry Laboratory at the University of Florida according to NELAP certification guidelines (1692 McCarty Drive, Room 2181, Building A, Gainesville, FL 32611).
Precipitation and wind data were gathered from the National Oceanic and Atmospheric Administration (NOAA) National Centers for Environmental Information.1 Monthly precipitation data for weather stations in the Brevard County area were averaged and used to create a precipitation time series to approximate the rainfall and storm conditions that may have affected the study region.
The wind velocities were obtained from the NOAA National Data Buoy Center2 for the station 41,009 off coast from Cape Canaveral, FL. The wind velocity data had a directional component in degrees. The north–south (vertical) component was extracted to analyze the seasonal shift in north–south wind direction to estimate its effect on surface currents in the study region. The vertical velocity component (north and south) was obtained using the equation below (Equation 1). The wind data were in degree-vector form and the convention where positive wind velocity was in the northern direction was used. refers to the vertical component of the wind velocity, refers to the speed, and is the wind direction in degrees where 360 degrees refers to true north, 180 degrees is true south, east is 90°, and west is 270°.
In duplicate, 700-mL of sampled water was filtered through a 0.3-μm Whatman glass fiber filter and stored in a light-protected container at −20°C. Chlorophyll a was solvent extracted (Sartory and Grobbelaar, 1984) and measured spectrophotometrically according to Standard Methods (APHA, 2005). Chlorophyll a values used for analysis were not pheophytin corrected because pheophytin-corrected chlorophyll a values measured spectrophotometrically have shown inconsistent results when compared with HPLC chlorophyll determinations (Stich and Brinker, 2005).
Surface chlorophyll concentrations were acquired using the Google Earth Engine (Gorelick et al., 2017) platform and extracting the Ocean Color SMI: Standard Mapped Image from NASA’s Moderate Resolution Imaging Spectroradiometer (MODIS; Justice et al., 1998; Gorelick et al., 2017). Images were filtered for those with low cloud cover, and a polygon was drawn to enclose the study region. Chlorophyll values used represent the average of all pixels inside the polygon for each day; then, a mean of all daily chlorophyll values for each month was used for analysis.
For satellite chlorophyll maps, MODIS-Aqua 8-day composite images were obtained from the NOAA/ERDAPP data server version 2.16 (Simons, 2011) to illustrate chlorophyll spatial patterns during a pair of fall and summer sampling dates.
When the satellite chlorophyll values were compared to the seasonal samples collected in situ at 24 sites within the same geographic region. The satellite chlorophyll values are a mean of the entire sampling region, and compared to the 24 discrete samples that were averaged together from the same region.
Samples for general phytoplankton composition analysis were collected in 125 mL amber glass bottles and preserved with Lugol’s during the field collections. Analyses were based on the Utermöhl method (Utermöhl, 1958). Samples were settled in 19-mm diameter cylindrical chambers. Phytoplankton cells were identified and counted at 400× and 100× with a Leica phase contrast inverted microscope. At 400×, a minimum of 100 cells of a single taxon and 30 grids were counted. If 100 cells of a single taxon were not counted by 30 grids, grids were counted until 100 cells of a single taxon were reached up to a maximum of 100 grids. At 100×, a total bottom count was completed for taxa >30 μm in size.
Samples for picoplankton analyses were collected in 22 mL glass scintillation vials and preserved with buffered glutaraldehyde solution in the field. Fluorescence microscopy was used to enumerate picoplanktonic cyanobacteria (e.g., Synechococcus spp., spherical picocyanobacteria spp.) at 1,000× magnification. Subsamples of waterwere filtered onto 0.2 μm Nucleopore filters and mounted between a microscope slide and cover slip with immersion oil (Phlips et al., 1999).
Cell biovolumes (i.e., μm−3 mL−1) were estimated by assigning combinations of geometric shapes to fit the characteristics of individual taxa (Smayda, 1978; Sun and Liu, 2003). Specific phytoplankton dimensions were measured for at least 30 randomly selected cells. Species which vary substantially in size, such as many diatom species, were placed into size categories. Phytoplankton biomass as carbon values (i.e., μg carbon mL−1), were estimated by using conversion factors for different taxonomic groups applied to biovolume, as prescribed by Menden-Deuer and Lessard (2000), with adjustments to biovolumes for the effects of Lugol’s preservative (Strathmann, 1967; Ahlgren, 1983; Sicko-Goad et al., 1984; Verity et al., 1992; Work et al., 2005).
Comparison of seasonal differences in chlorophyll a, phytoplankton biomass, and physical/chemical parameters was done by comparison of means using the Games-Howell pairwise comparison (Games and Howell, 1976) using the posthocTGH function in the Rosetta package in R (Peters, 2018). This comparison was chosen because it does not require the assumptions of homogeneity of variance to be met. When correlation was compared (including pairwise), the Pearson correlation coefficient was used and the significance of this relationship was tested using the t-statistic.
Mean surface water temperatures for the in situ sampling events ranged from 17.7 ± 0.1°C in the winter of 2015/16 to 29.1 ± 0.2°C in the summer of 2019 (Figure 2). More temporally intensive surface water temperature data from MODIS-Aqua satellite showed a similar range of values (Figure 3).
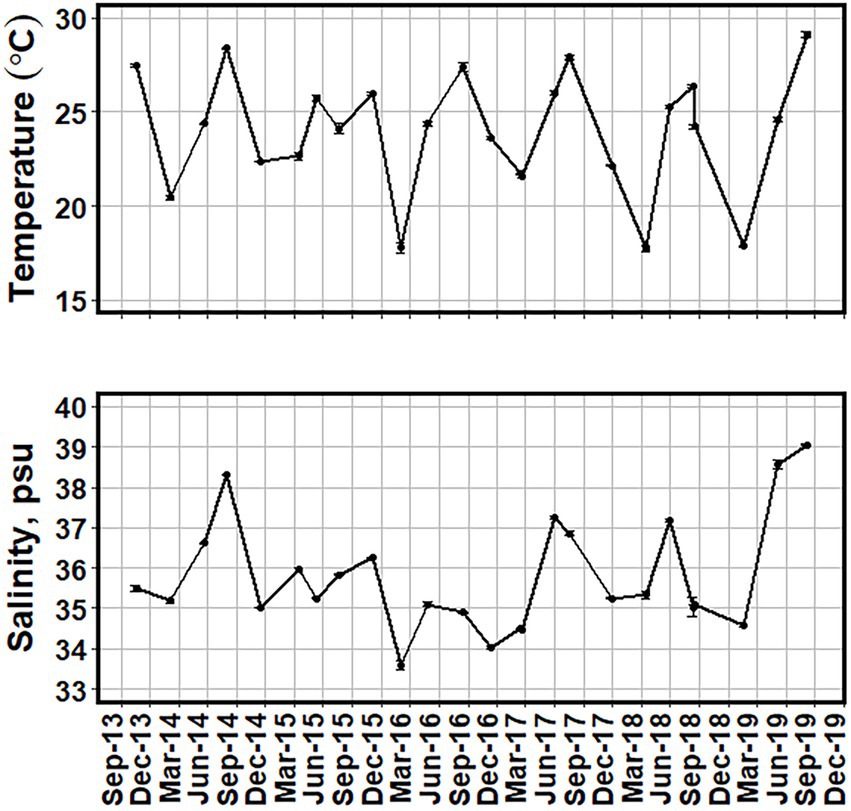
Figure 2. Mean surface water temperature (°C) and salinity (psu) from all sites between October 2013 and August 2019. Error bars of one standard error are added to show the variance of the values.
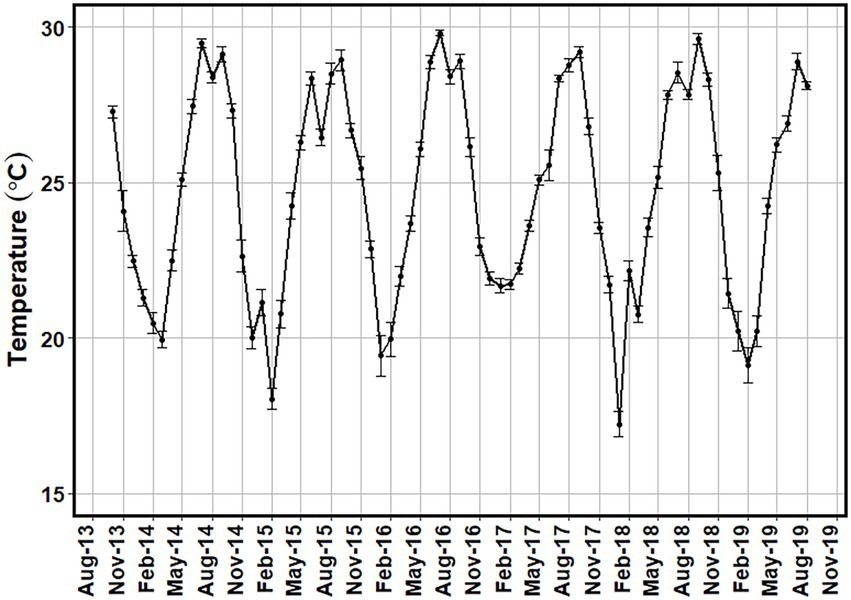
Figure 3. Monthly average surface temperature (°C) for the study region from MODIS-Aqua satellite from October 2013 to August 2019.
Mean surface salinities ranged from 33.58 ± 0.10 psu in the winter of 2015/16 to 39.06 ± 0.03 psu in the summer of 2019 (Figure 2). Fall and winter sampling periods had lower salinity than spring and summer (p < 0.05; Table 1).
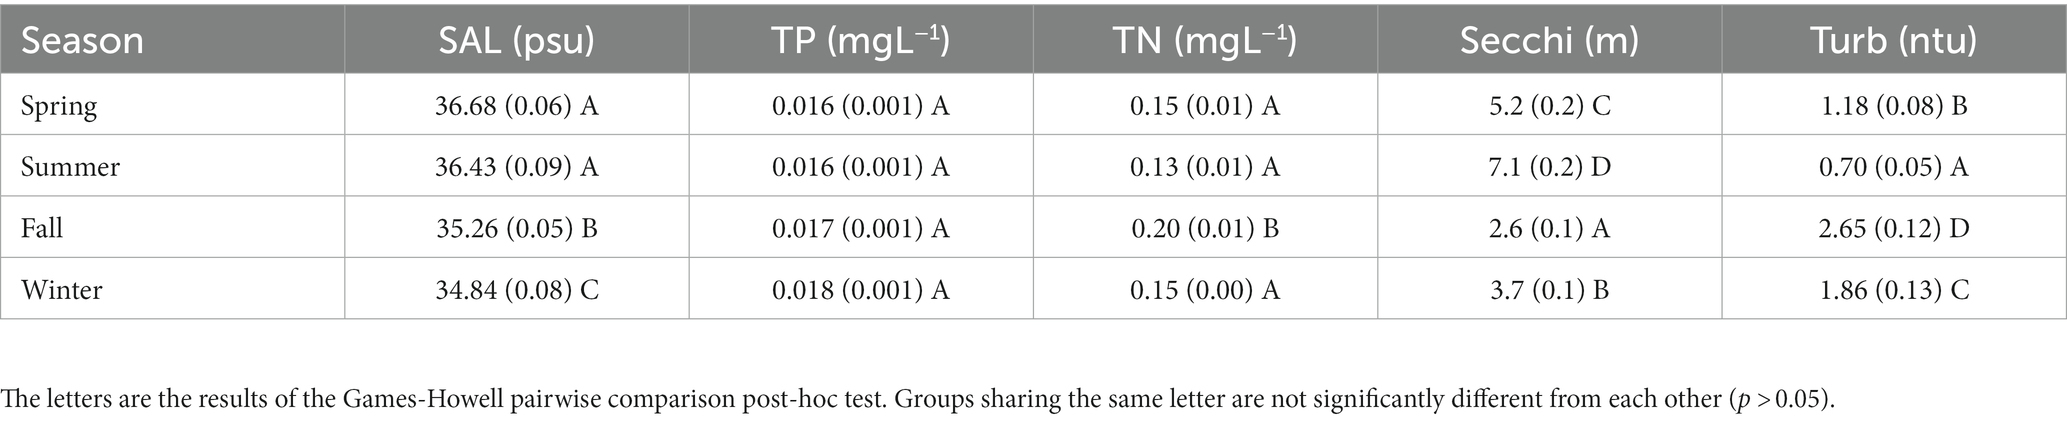
Table 1. Mean seasonal values for physical and chemical variables for different seasons with the standard error in paratheses.
Mean Secchi depths ranged from 1.9 m in the winter of 2017/18 to 8.1 m in the summer of 2015 Mean turbidites ranged from 0.7 ntu in the summer of 2018 to 9.0 ntu in the winter of 2018/19 winter season (Figure 4). Turbidity and Secchi disk depths showed similar trends, with higher Secchi depths and lower turbidity in the summer, and higher turbidity and lower Secchi depths in the winter and fall seasons (Figure 4, Table 1).
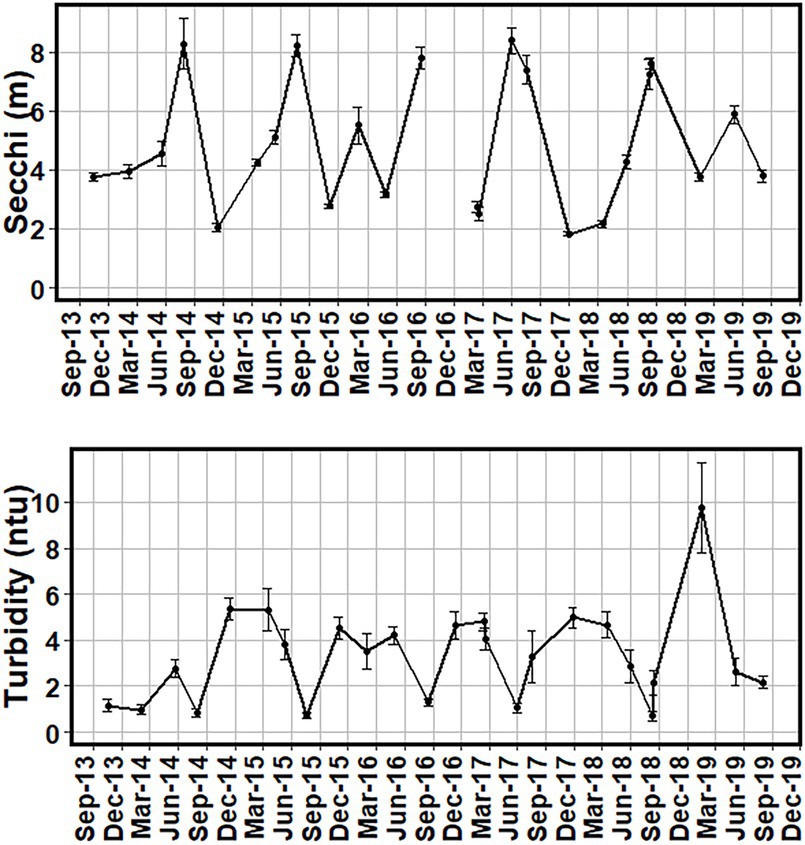
Figure 4. Mean Secchi disk depths in meters (m) and turbidity (ntu) from all sites between October 2013 and August 2019. The missing point is from November 2016 for the Secchi figure. Error bars of one standard error are added to show the variance of the values.
Mean monthly rainfall totals in Brevard County ranged from 8.0 ± 0.7 mm in February of 2018 to 343.3 ± 26.4 mm in September of 2017 (Figure 5). Precipitation patterns reflect a warm rainy season (May–October), followed by a cooler, dry season (November–April), which is characteristic of the sub-tropical environment of central Florida (Irizarry-Ortiz et al., 2013). The region was also directly affected by three tropical systems in August of 2016 and September of 2016–2017 (Figure 5). The lowest monthly rainfall was in February of 2018 where 8 mm of rain was collected. The spring and summer seasons were characterized by heavier rain with the maximum monthly rainfall of 343 mm occurring in September of 2017, coinciding with Hurricane Irma (Figure 5).
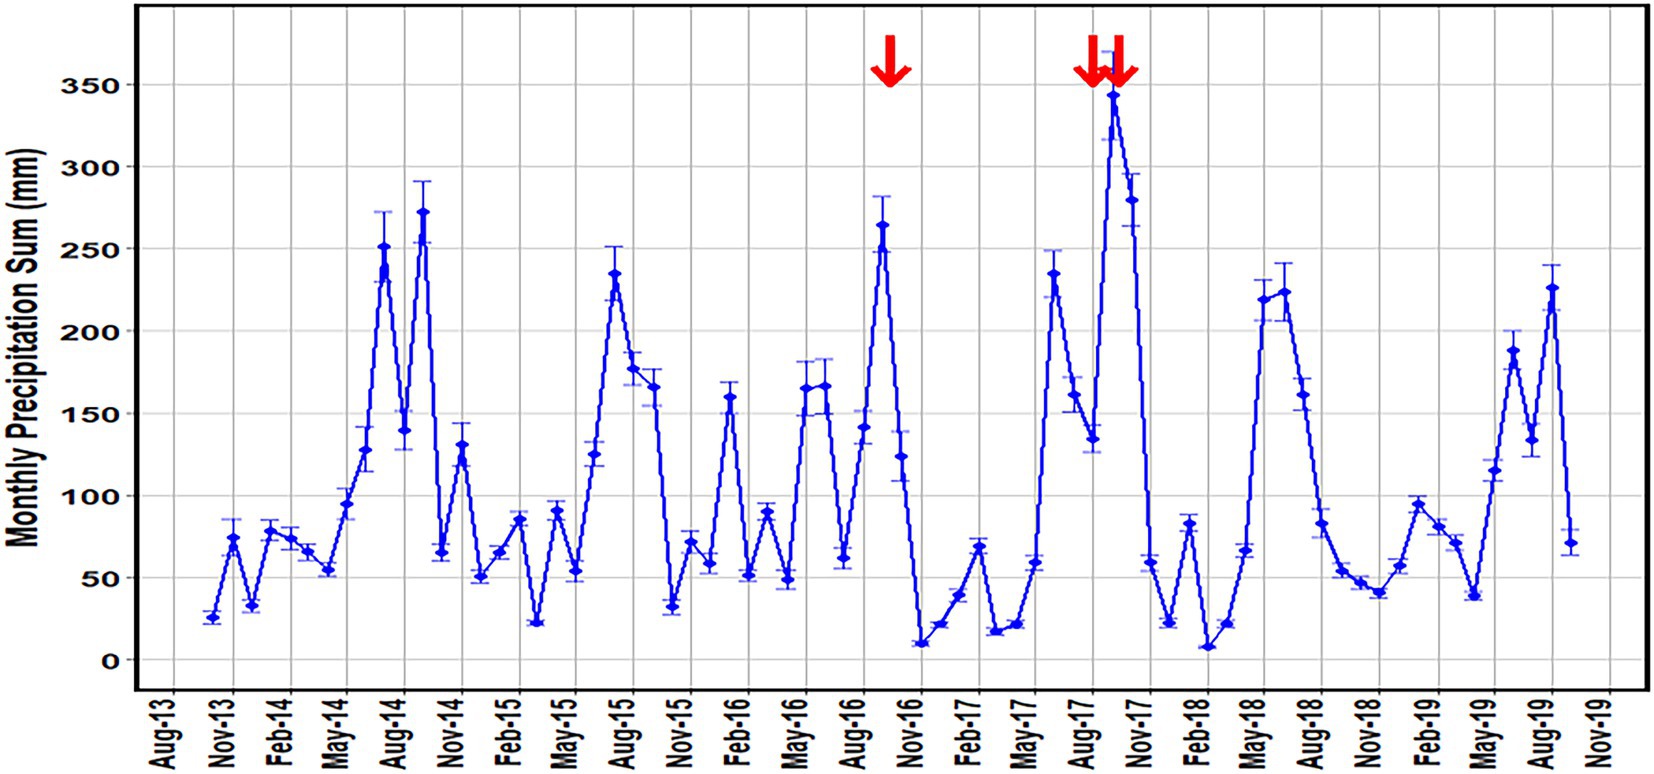
Figure 5. Mean monthly precipitation sum (mm) for land stations in Brevard County, Florida (NOAA). Error bars of one standard error are added to show the variance of the values. Red arrows indicate tropical systems that passed over or near the sampling sites during the sampling period.
The north/south component of wind velocities were taken for each season to examine changes between seasons in the origin of water effecting the sampling region. The first three sampling dates for the spring showed little prevailing north/south wind direction, while the last three dates showed consistent northward wind velocities for just over 70% of days. This southerly wind trend was much stronger in the summer with over 80% of days leading up to the summer sampling dates had a net northern component with velocities ranging from 2.0 m/s to 3.6 m/s (Figure 6). The fall season shows a reversal in wind direction showing a northerly prevailing wind direction for over 74% of days leading up to each sampling date and had a net southern component with velocities ranging from −1.4 m/s to −3.1 m/s. The winter sampling dates did not show a consistent wind direction with only the winter of 2016 having 68% of days showing a northerly wind direction for that sampling date (Figure 6). Consistent wind directions were seen in the fall and summer, while the winter and spring had less consistent directionality.
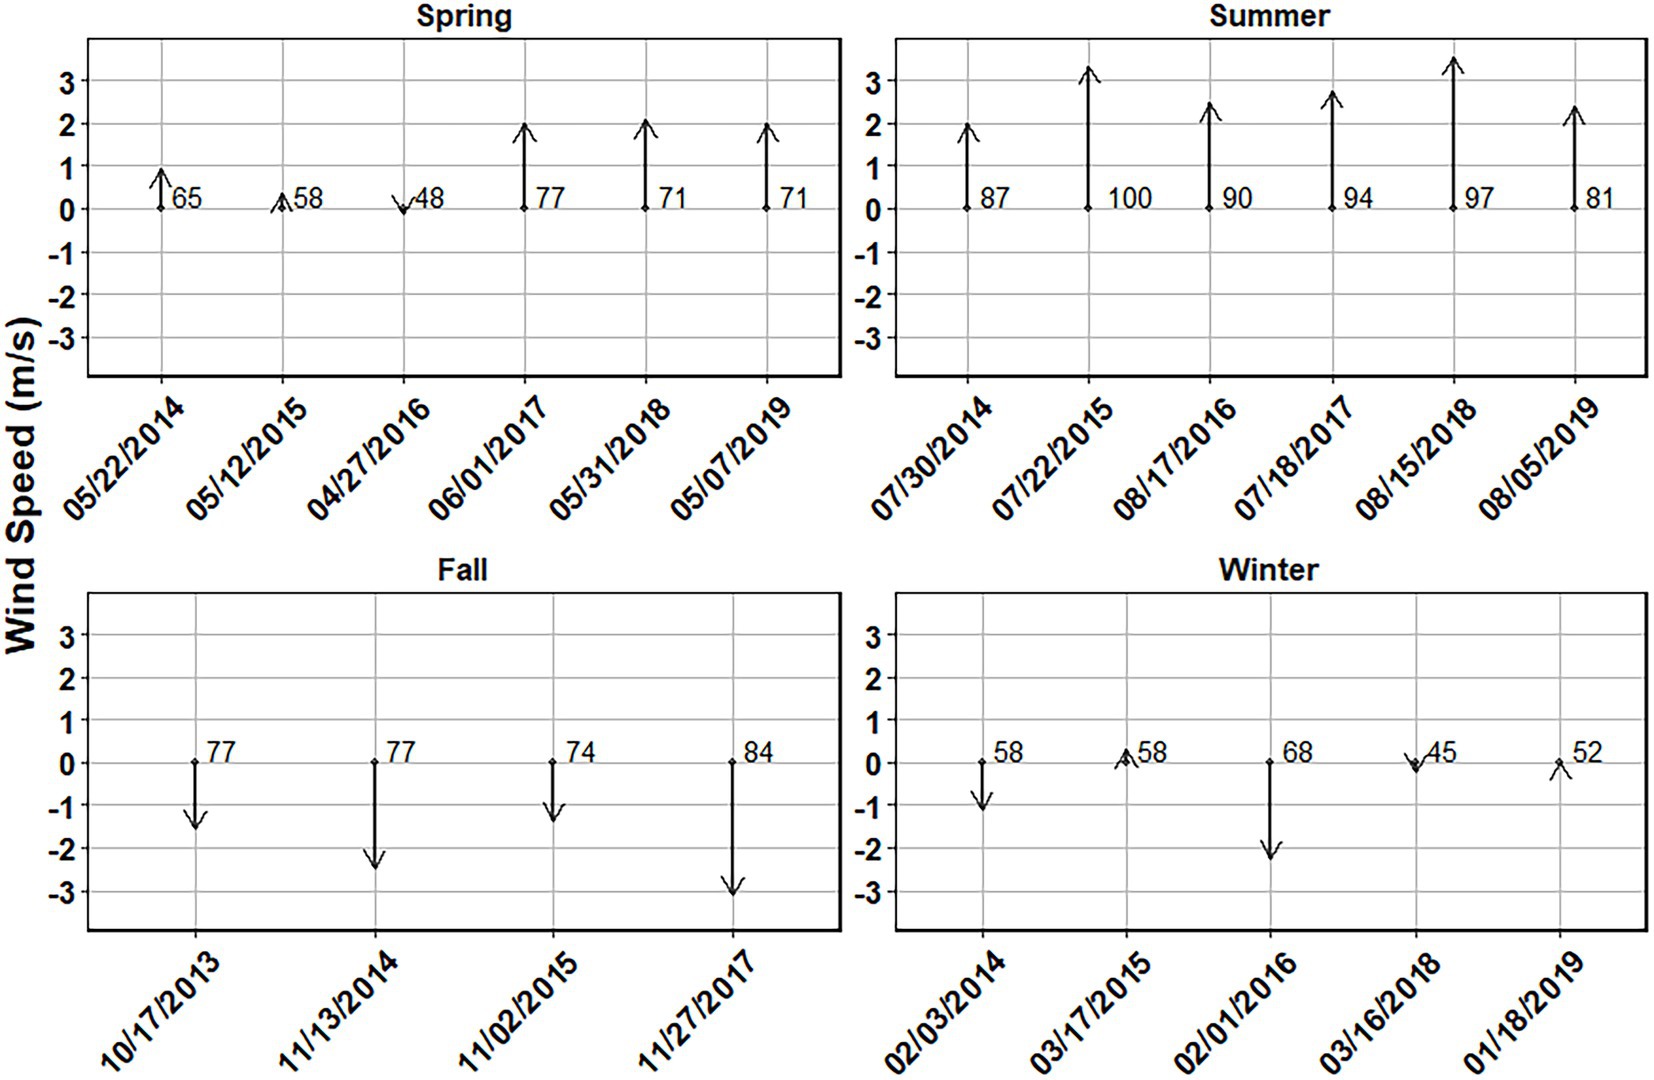
Figure 6. Average vertical wind speed (m/s) over a 30-day period prior to the sampling date for each season. Positive values represent wind traveling from south to north. Numbers to the right of the vector arrows represent the percentage of days where the average wind was traveling in the direction of the arrow.
Mean TN concentrations of the study ranged from >0.04 ± 0.01 mg L−1 in the summer of 2014 to 0.35 ± 0.05 mg L−1 in the fall of 2013 (Figure 7). Mean TN levels often remained between 0.1–0.25 mg L−1. Notably, the high levels of TN in the fall of 2013 coincided with a bloom of the nitrogen-fixing cyanobacterium Trichodesmium erythraeum (Tate et al., 2020).

Figure 7. Mean surface total nitrogen and total phosphorus concentration (mg L−1) for all sites from October 2013 to August 2019. Error bars of one standard error are added to show the variance of the values.
Mean total phosphorus concentrations ranged from 0.007 ± 0.001 mg L−1 to 0.033 ± 0.004 mg L−1 in summer 2018 and in spring 2015, respectively, (Figure 7). Besides the maximum in 2015, TP never exceeded 0.03 mg L−1 during the sampling period. No significant correlation was seen between TP and TN values.
Mean TN was highest in the fall at 0.20 ± 0.01 mg L−1, significantly higher than TN during the other three seasons (p < 0.01; Table 1). The fall season also coincided with the highest mean chlorophyll (Table 2) and turbidity (Table 1) values and the lowest Secchi depths (p < 0.01; Table 1). Mean TP values showed no significant difference among seasons (Table 1). Secchi depth/turbidity showed a significant difference (p < 0.01) among all seasons, with the summer showing the lowest surface turbidity and deepest Secchi depth (Table 1).
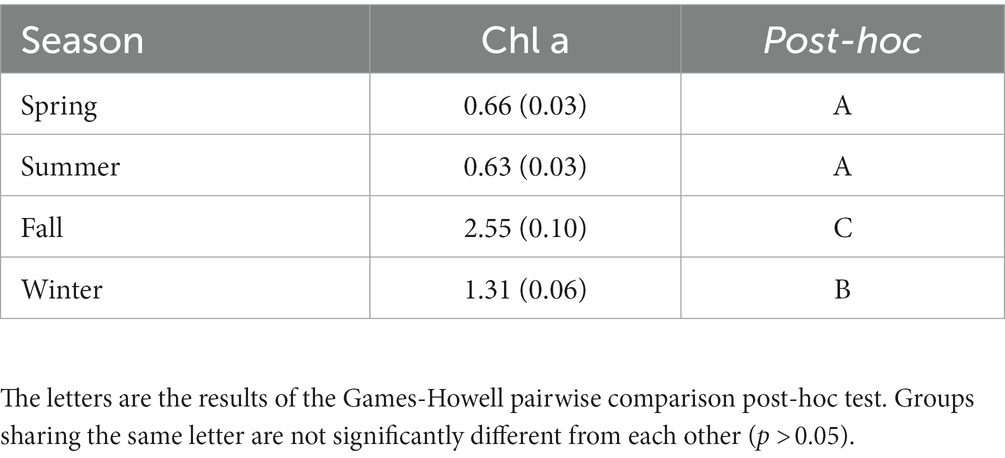
Table 2. Mean chlorophyll concentrations (μg L−1) at different seasons, site topographies, and depths with the standard error in paratheses.
Variability in chlorophyll a concentrations were examined using medians and interquartile ranges for each sampling date to compare the interannual variability (Figure 8). Spring chlorophyll a median values ranged from 0.16 μg L−1 in 2017 to 1.11 μg L−1 in 2016 (Figure 8). Summer chlorophyll a median concentrations ranged from 0.27 μg L−1 in 2016 and 2017 to 1.35 μg L−1 for 2019. Fall had the highest median chlorophyll a concentrations among the four seasons and had a higher associated variance. Fall median chlorophyll a values ranged from 1.35 μg L−1 in 2015 to 3.66 μg L−1 for 2017. Winter chlorophyll a median values ranged from 0.49 μg L−1 in 2015 to 2.03 μg L−1 for 2017 (Figure 8). While the winter season did have a higher median chlorophyll a concentration than the spring or summer seasons, there were periods early in the investigation (2014–2015) when chlorophyll a values were comparable to the spring and summer (Figure 8). Separating the sampling dates by month, November had the highest median chlorophyll a 2.73 μg L−1 and June had the lowest median chlorophyll a 0.19 μg L−1 for the in situ sampling (Figure 9).
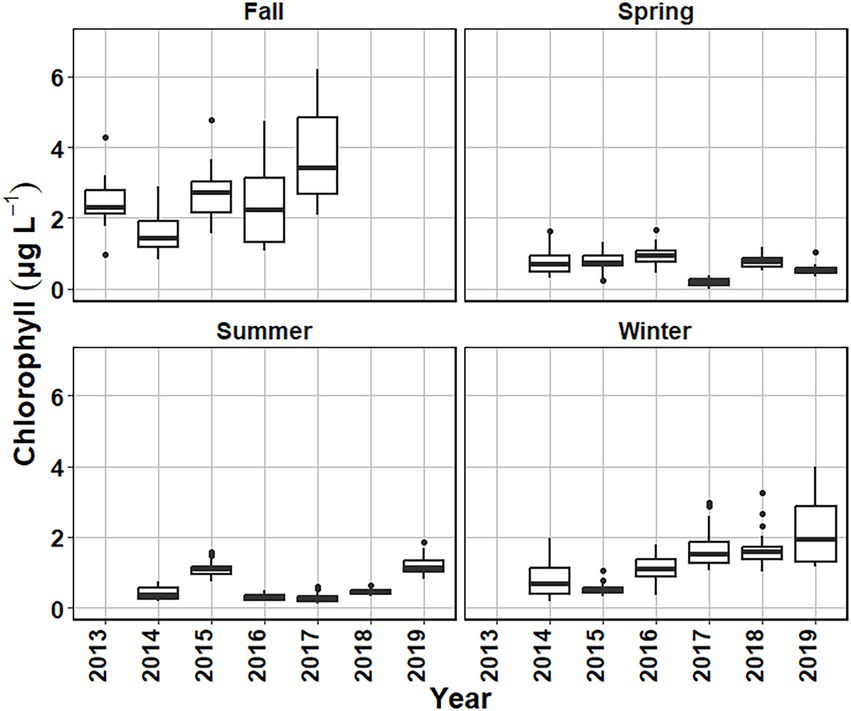
Figure 8. Surface chlorophyll (μg L−1) boxplots for each sampling date arranged by season and year from October 2013 to August 2019.
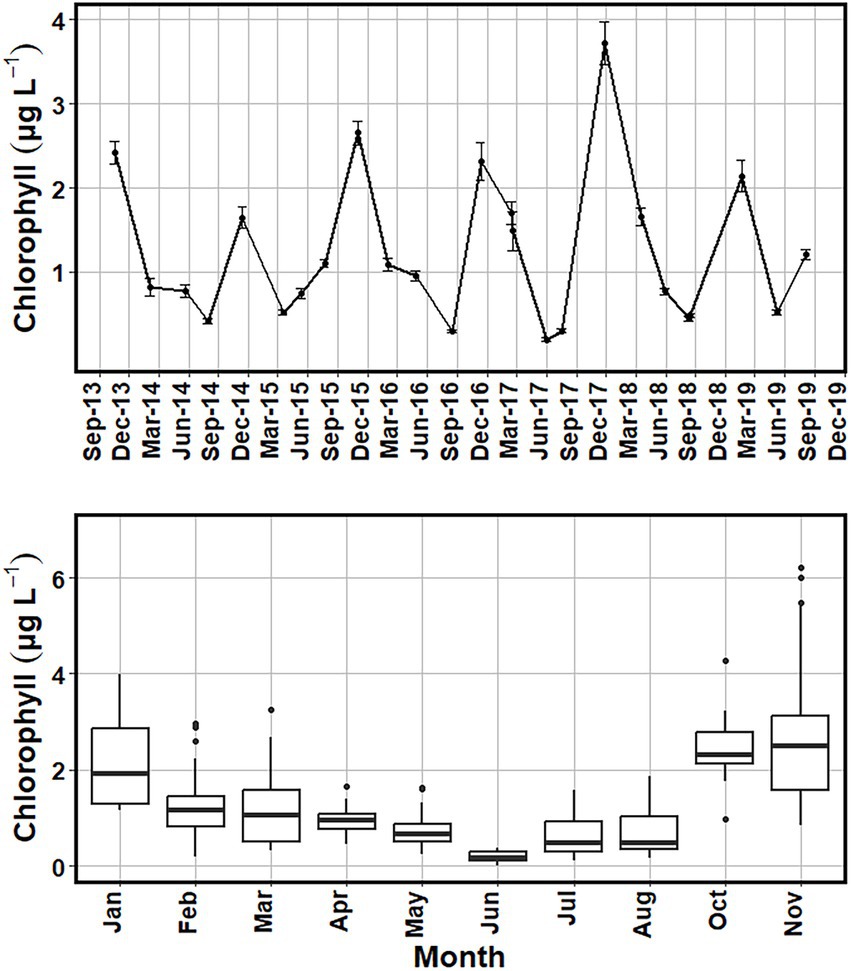
Figure 9. Average surface chlorophyll (μg L−1) (top) with error bars of one standard error added to show the variance of the values. Boxplots of surface chlorophyll (μg L−1) (bottom) showing the range of chlorophyll values obtained for sampling dates within each month from October 2013 to August 2019.
Summer and spring in situ mean chlorophyll a concentrations for the study period did not differ significantly, with means of 0.63 and 0.66 μg L−1 (Table 2). Winter chlorophyll a mean concentration was 1.31 ± 0.06 μg L−1, which differed significantly (p < 0.001) from all other seasonal means. Fall mean chlorophyll a concentration was 2.55 ± 0.10 μg L−1, significantly higher than all other seasonal means (Table 2).
Surface chlorophyll a concentrations from both satellite and in situ collections showed a similar seasonal pattern, with higher levels in the fall and winter months (Figures 8–10). When comparing the two methods, the satellite data revealed higher concentrations of chlorophyll a, with values exceeding 6 μg L−1 in December of 2017 and March of 2019 (Figures 6, 8). In situ collected chlorophyll a concentrations also peaked during these periods, but monthly mean chlorophyll a concentrations did not exceed 4 μg L−1 (Figure 9). Also, while the satellite data showed similar chlorophyll seasonality to in situ data, the chlorophyll maxima for the satellite imagery alternated between fall and winter dates, while the in situ data consistently showed peak chlorophyll values during the fall in October and November (Figure 9). Investigating some of the satellite imagery, there is a distinct enhancement of chlorophyll on the Atlantic shelf during the fall season compared to the summer season (Figure 11).
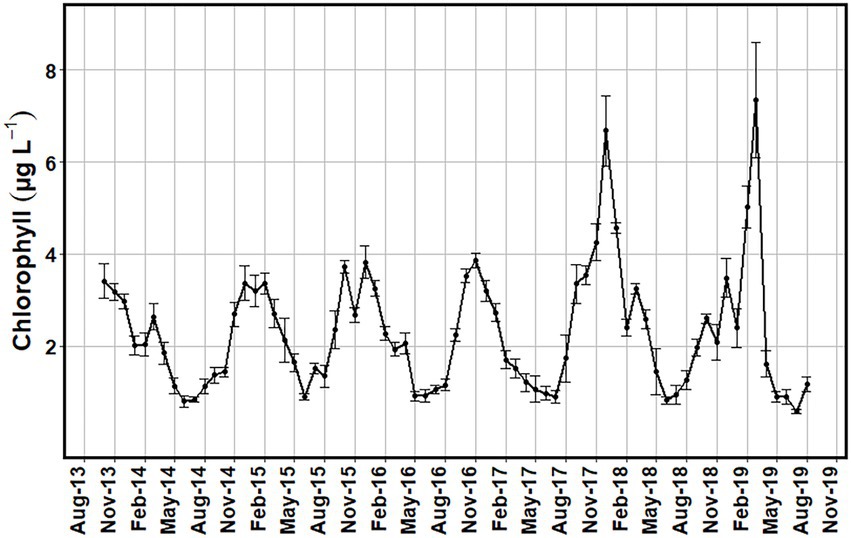
Figure 10. Monthly average surface chlorophyll (μg L−1) values for the study region obtained from MODIS-Aqua satellite images with low cloud cover from October 2013 to August 2019. Error bars of one standard error were added to show the variance of the values.
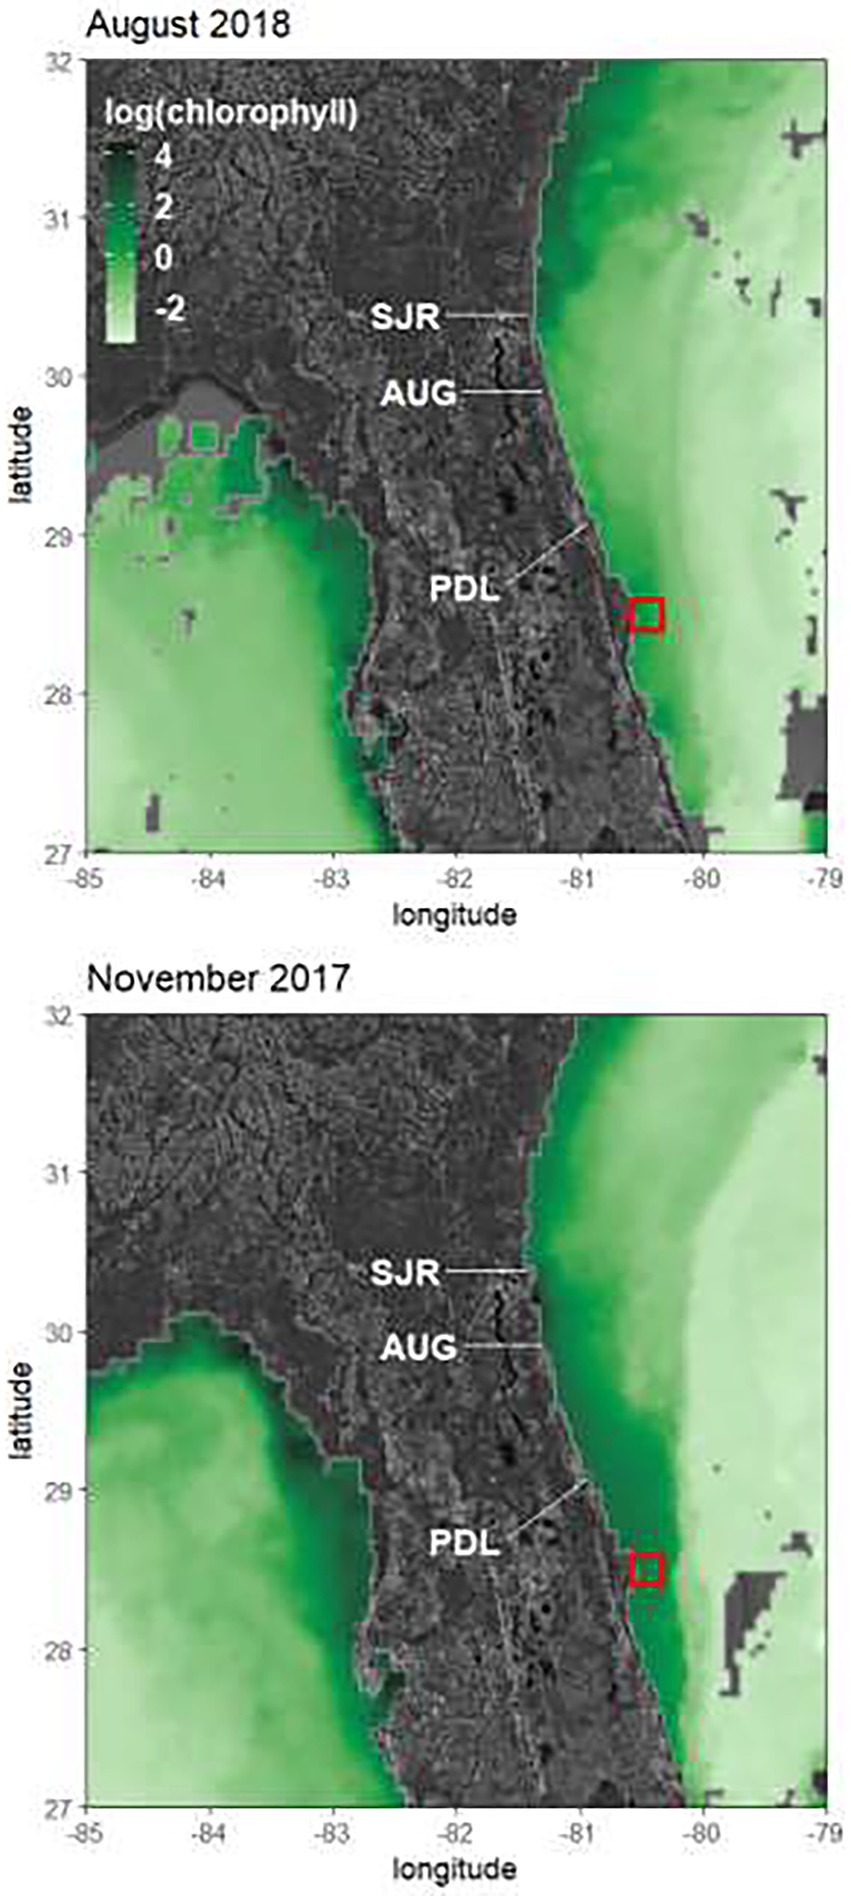
Figure 11. Natural log of chlorophyll concentrations (mg m−3) measured by MODIS-Aqua satellite for an 8-day composite for November 2017 and August 2018. The red square denotes the sampling region. SJR, St. John’s River Estuary; AUG, St. Augustine Inlet; PDL, Ponce de Leon Inlet.
In situ chlorophyll values and satellite chlorophyll values were compared on dates where both satellite and in situ data were available. Overall, the values showed a linear relationship but deviated from the 1:1 line with satellite chlorophyll tending to have higher chlorophyll values on the same dates (Figure 12). Linear modeled satellite chlorophyll concentrations were higher than the in situ chlorophyll values by 60%.
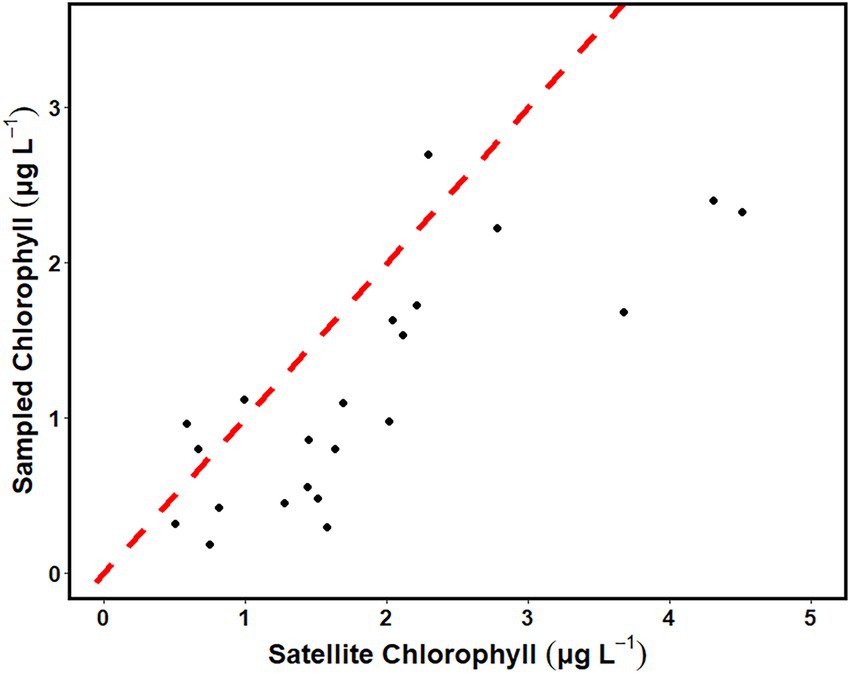
Figure 12. Correlation between the mean of sampled surface chlorophyll (μg L−1) and the satellite chlorophyll estimate for the region (μg L−1). The dashed red line represents the 1:1 ratio.
In situ chlorophyll a showed a strong positive correlation with turbidity, a positive correlation with TN, and a weaker positive correlation with TP (Figure 13). Surface chlorophyll a showed a negative correlation for parameters associated with the summer season including higher temperature and higher salinity (Figure 13). All correlations mentioned were statistically significant (p < 0.05).
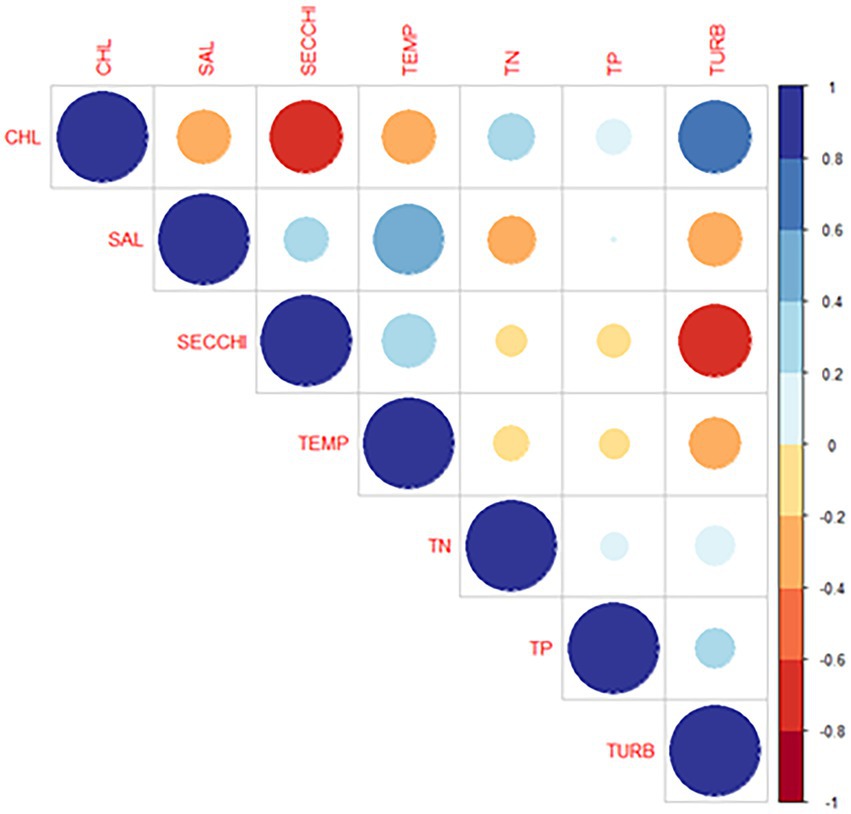
Figure 13. Pairwise correlation between physical/chemical variables and chlorophyll concentration during sampling period. Scale is in Pearson’s correlation coefficient.
Mean total phytoplankton biomass per sampling event, in terms of estimated carbon, ranged from 50 μg carbon L−1 in Spring 2016 to 340 μg carbon L−1 in fall of 2013 (Figure 14). Over the study period there were significant seasonal differences in mean total biomass over the study period (Table 3). The highest mean value was in the fall, followed by winter, summer, and lowest in spring. In order to examine the relative contribution of different taxonomic groups to total biomass, phytoplankton were subdivided into four groups: cyanobacteria, dinoflagellates, diatoms and “other” (i.e., all other taxa). The fall season had the highest mean biomass for all four groups (Table 3). However, for diatoms winter mean biomass was statistically similar to fall, and for cyanobacteria summer mean biomass was similar to fall. In terms of each season, cyanobacteria had the highest mean biomass in the spring, summer and winter (Table 3). In fall, dinoflagellates and cyanobacteria had higher mean biomass than diatoms or “Other” taxa.
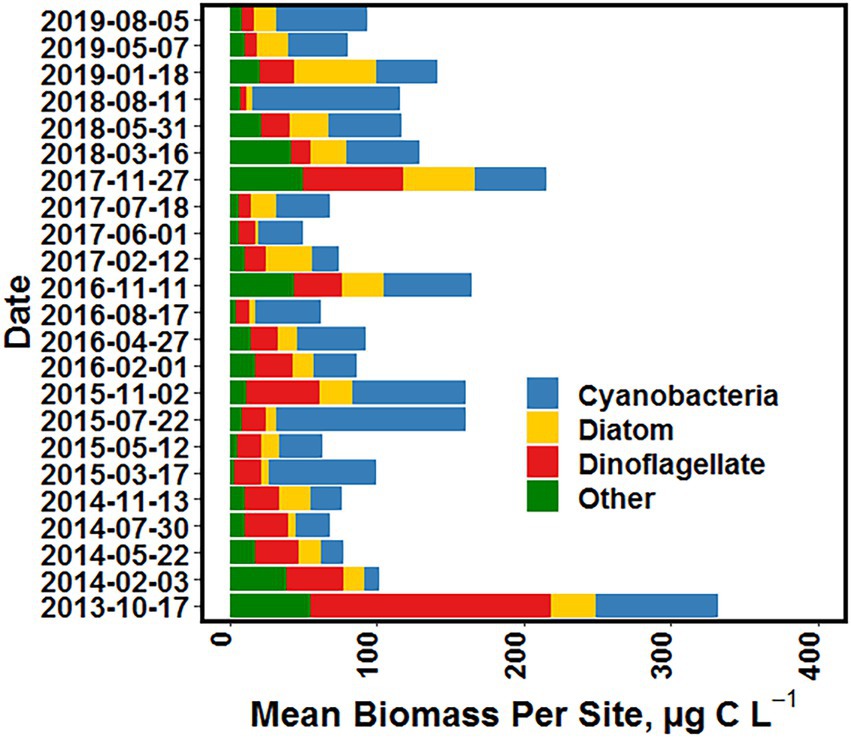
Figure 14. Mean surface water phytoplankton biomass (μg carbon L−1) for each sampling date, sub-divided into four major groups, i.e., cyanobacteria, diatoms, dinoflagellates and all “other” (i.e., all other taxa) groups, from October 2013 to August 2019.
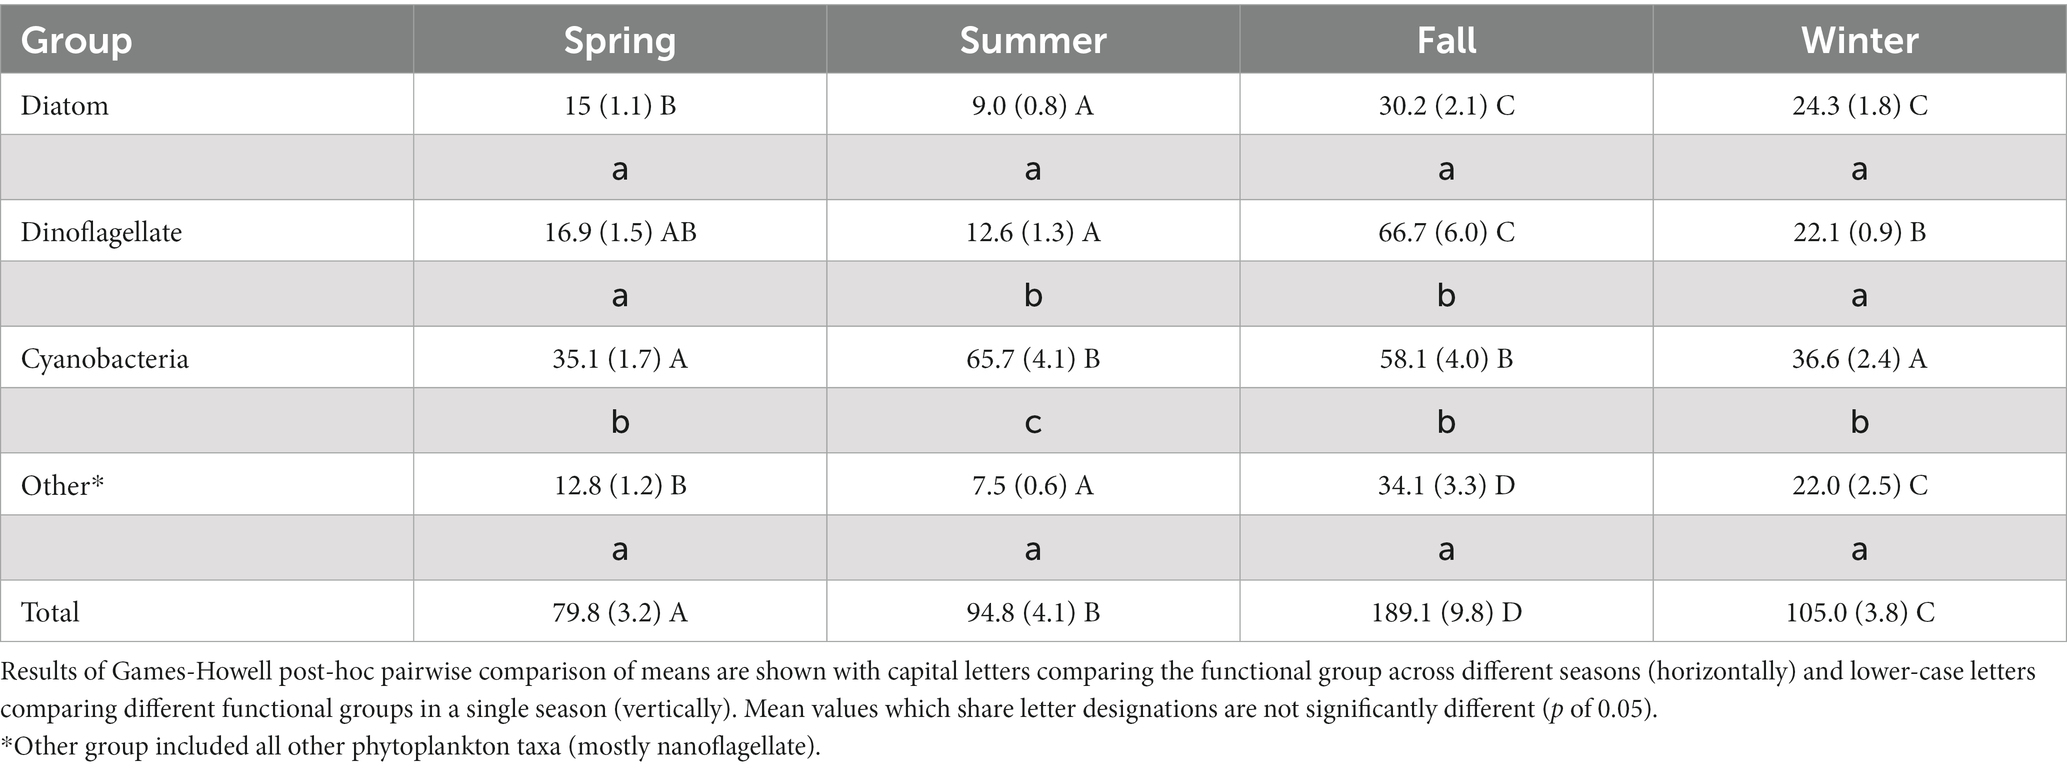
Table 3. Comparison of mean phytoplankton biomass (μg carbon L−1) by functional group between the four seasons with standard errors shown in parentheses.
In addition to mean biomass patterns for the four groups of taxa, there were also noteworthy differences in the dominant individual taxa by season. The seasonal differences are illustrated by a comparison of the frequency of occurrence of taxa in the Top-200 list of highest biomass values observed for individual taxa in the summer and fall seasons (Table 4). Cyanobacteria were major elements of the Top-200 list in both the summer and fall. In summer, picoplanktonic cyanobacteria (i.e., spherical forms and Synechococcus spp.) represented 90% of the Top-200 entries (Table 4). In fall, picoplanktonic cyanobacteria were only 48% of the Top-200 entries. In addition, the filamentous nitrogen-fixing cyanobacteria Trichodesmium erythraeum appeared four times on the list, principally in 2013. T. erythraeum also registered the highest single biomass observation in the Top-200 list in either list. T. erythraeum is considered a Harmful Algal Bloom (HAB) species with potential for toxin production (Lundholm et al., 2009; Lassus et al., 2016).
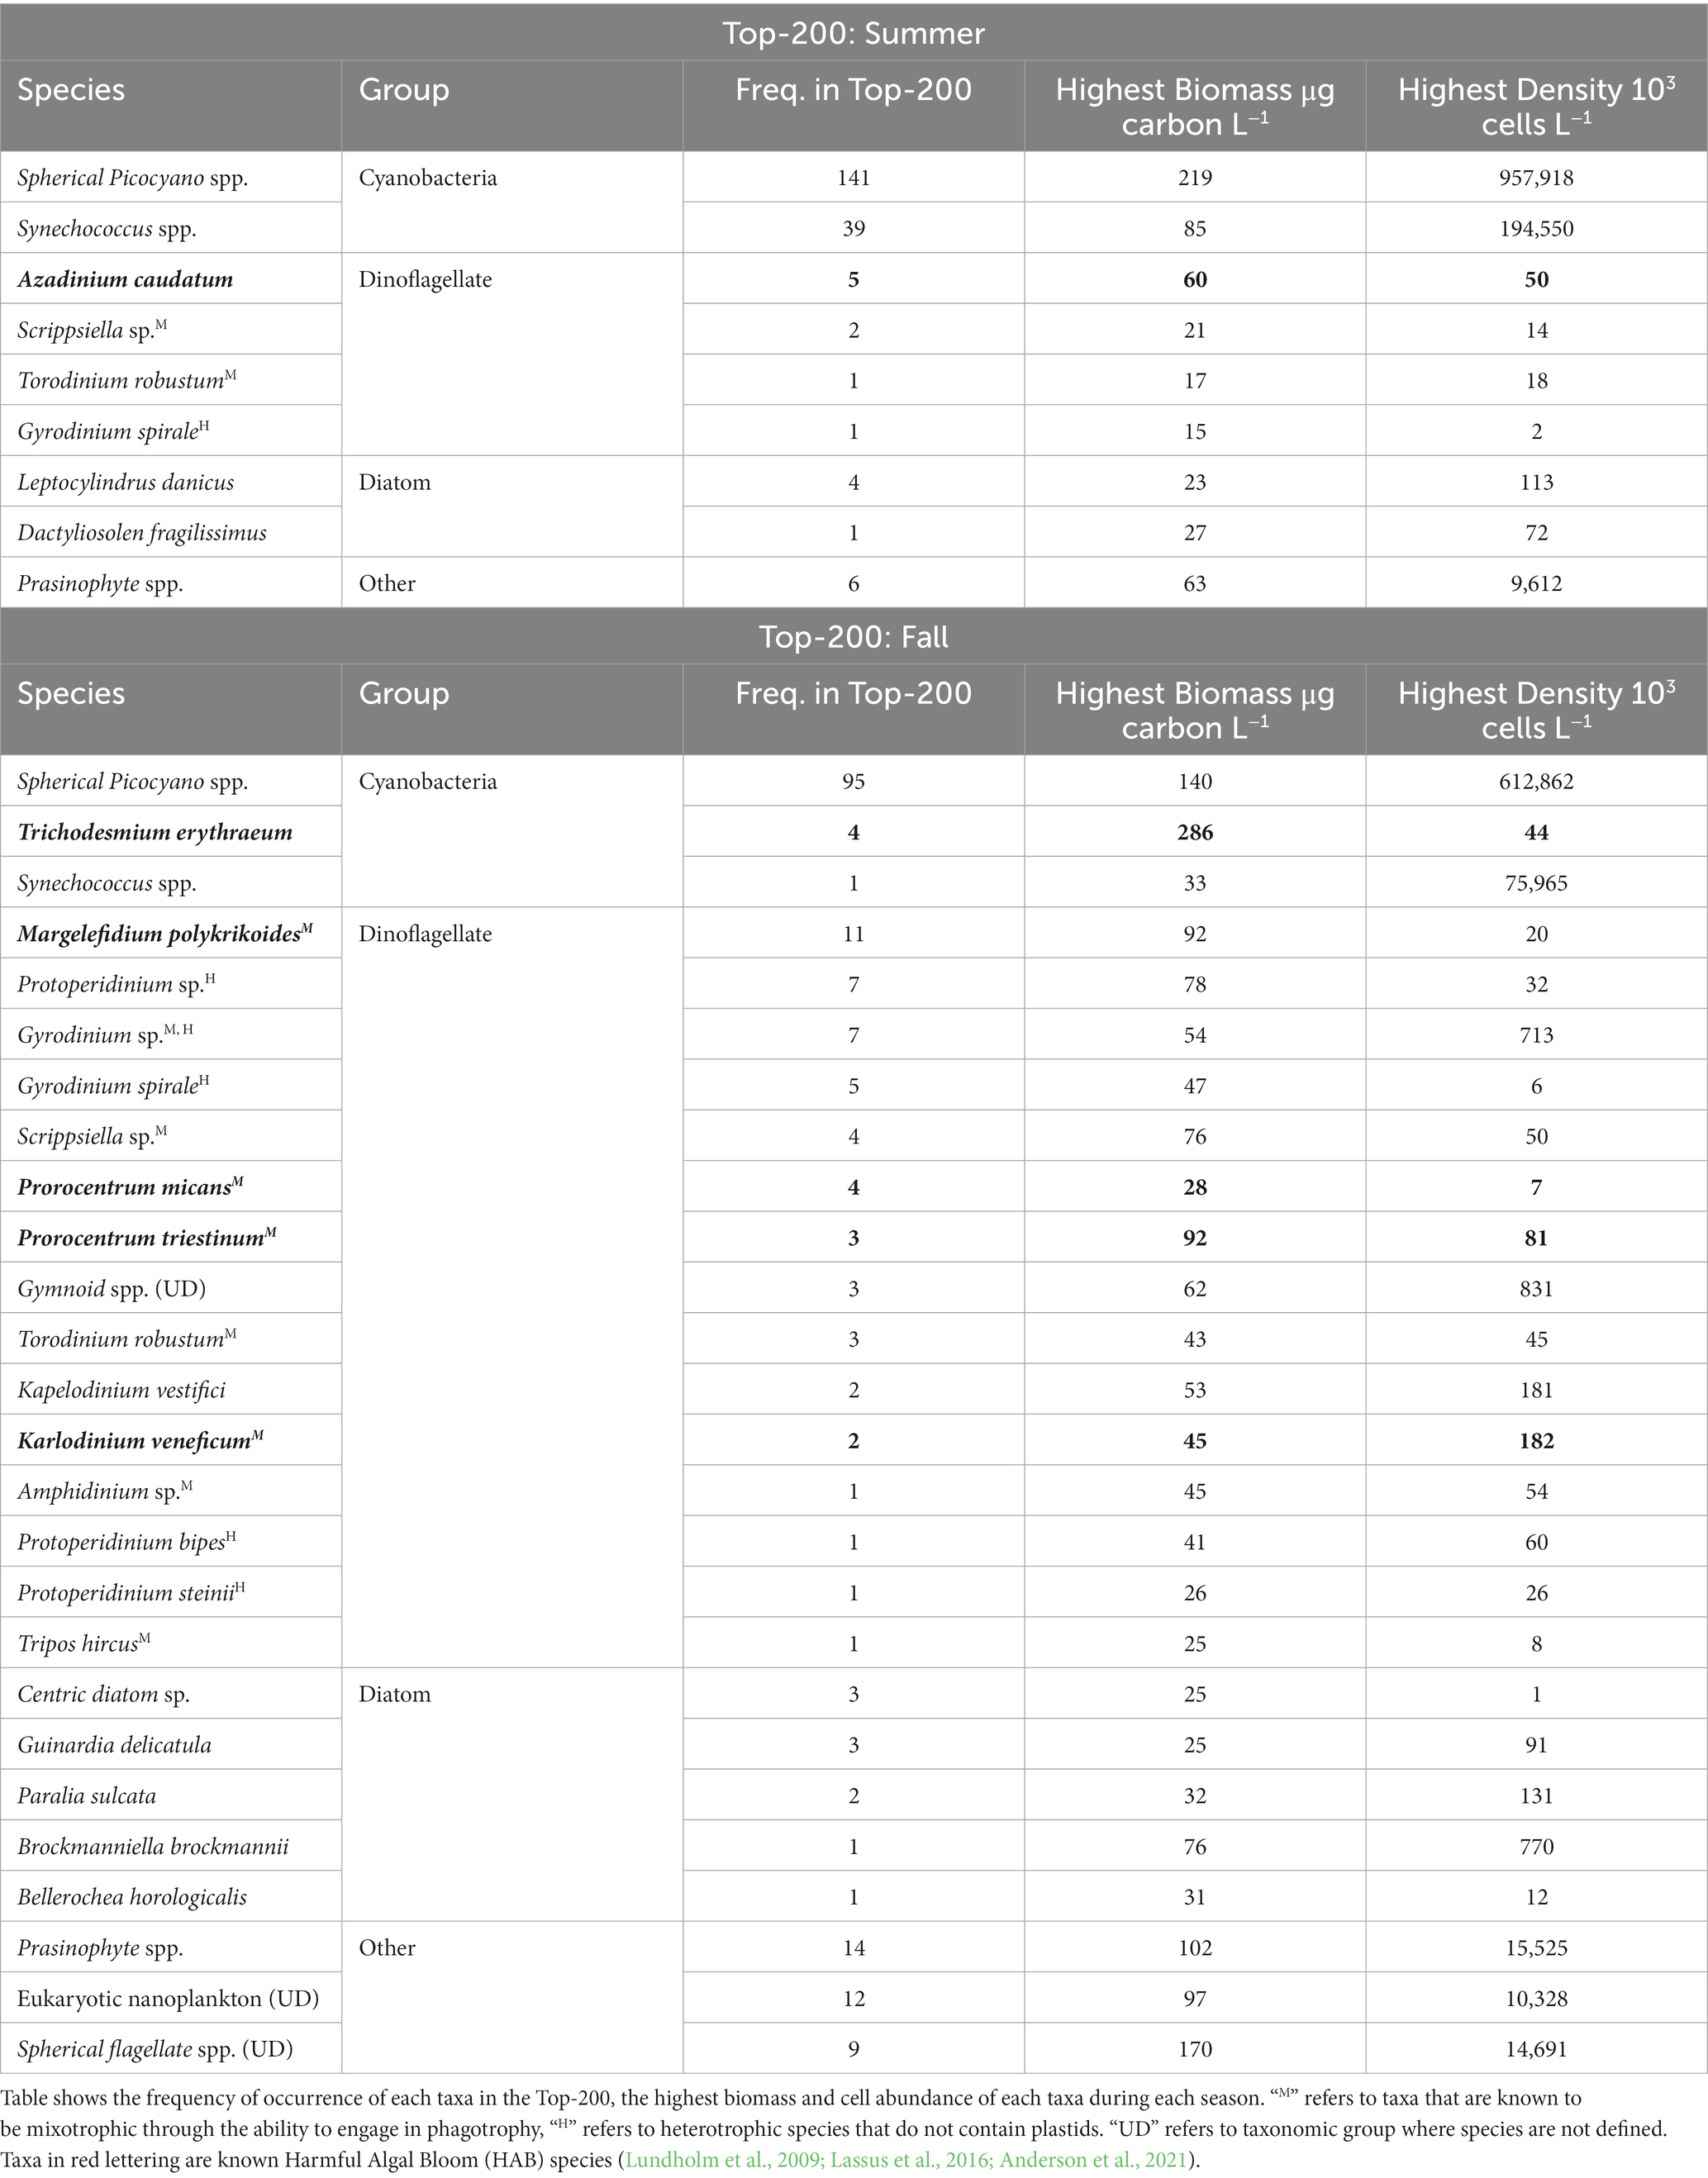
Table 4. Top-200 list of highest biomass of individual taxonomic groups for the summer and fall.
The second most prominent group in the Top-200 list of both the summer and fall was dinoflagellates (Table 4). In the summer, the most prominent of the four species on the list was the known toxin producer Azadinium caudatum (Lassus et al., 2016). The other three dinoflagellates on the summer Top-200 list were two mixotrophs, Scrippsiella sp., and Torodinium robustum, and the heterotroph Gyrodinium spirale. In the fall, there were 15 dinoflagellate taxa on the Top-200 list (Table 4). The HAB species Margalefidinium polykrikoides had the highest frequency of occurrence on the Top-200, and had the highest single biomass observation, 92 μg carbon L−1. The next dinoflagellates most frequently on the list were three heterotrophic species, including Protoperidinium sp., Gyrodinium sp., and Gyrodinium spirale. Seven other dinoflagellates were on the Top-200 list multiple times, including three HAB species, including Prorocentrum micans, Prorocentrum triestinum, and Karlodinium veneficum.
Overall, diatoms showed lower biomass levels in the summer than fall (Table 3).
In the summer, two diatom species were present on the Top-200 list, Leptocylindrus danicus, with four entries, and Dactyliosolen fragilissimus, with one entry (Table 4). Both species are cosmopolitan in distribution (Hoppenrath et al., 2009). In the fall, there were five diatom taxa that appear on the Top-200 list, including Guinardia delicatula, Paralia Sulcata, Brockmaniella brockmannii, Bellerochea horologicalis, and an undefined centric diatom. B. brockmannii had the highest observed biomass at 76 μg carbon L−1.
Within the “Other” category of taxa, prasinophytes (Chlorophyta) had the highest frequency of occurrence in the Top-200 list in both the summer and fall (Table 4). They were often among the numerically abundant taxa in many samples next to picoplanktonic cyanobacteria, and in fall reached the fourth highest individual biomass observation on the Top-200 list, at 102 μg carbon L−1. In the fall, other nanoplanktonic (i.e., >2–20 μm) taxa were in the Top-200 list, including undefined eukaryotic taxa and spherical flagellates.
The results of this study of the Cape Canaveral shelf (CCS) reveal distinct seasonal patterns in phytoplankton biomass and composition, and identify key environmental drivers. Using mean chlorophyll a as the measure of phytoplankton biomass, mean concentrations were higher in the fall and winter than in the spring or summer. A similar seasonal pattern has been reported in previous remote sensing studies of chlorophyll a in several other near-shore regions of the South Atlantic Bight along the east coast of the United States (Badylak and Phlips, 2004; Martins and Pelegrí, 2006; Signorini and McClain, 2007). The range of in situ chlorophyll a values is similar to the range of values for satellite studies of the broader South Atlantic Bight, i.e., 0.1–10 μg L−1 (Yoder et al., 1993, 2001, 2002; Barnard et al., 1997). This range is also in line with chlorophyll a values reported for many other subtropical coastal regions across the globe (Gregg et al., 2005; Xiao et al., 2018).
Although seasonal trends in chlorophyll a in the CCS were similar using in situ and satellite data, satellite-derived values were proportionally higher by around 60% of the in situ values. Similar disparities have been reported for coastal zone color scanner (CZCS) data for the continental shelf of the Southeast United States, where chlorophyll concentrations from satellites were ~50% higher than chlorophyll concentrations of in situ collected samples (Martins and María, 1998, Martins and Pelegrí, 2006). Much of the disparity appears to arise from the MODIS chlorophyll a algorithm, which uses the OC3/OC4 band ratio (Hu et al., 2012) and is intended for clear, case-1 waters. Shallow continental shelf water has higher turbidity than open ocean waters, as a result surface reflectance in these regions can be mistaken as an increase in chlorophyll concentration. To combat this overestimation, some researchers have used regional remote sensing algorithms for chlorophyll estimates in shallow near-shore environments (Brewin et al., 2013; Vazyulya et al., 2014). The differences between in situ and satellite chlorophyll a concentrations may also been influenced by uneven vertical distribution of phytoplankton in the portion of the water column captured by the two methods.
Estimates of phytoplankton biomass in terms of carbon obtained from microscopic analyses of water samples collected in situ in the CCS, yielded similar seasonal patterns obtained using chlorophyll a data. The highest mean carbon values were observed in the fall, followed by winter, then summer, and the lowest in the spring. The fall peak in mean phytoplankton biomass contrasts with the more typical observation of peaks in the spring reported for many temperate environments (Yamada et al., 2004; Harding et al., 2005; Cloern and Jassby, 2008; Winder and Cloern, 2010; Carstensen et al., 2015). The factors that drive the seasonal pattern of phytoplankton biomass in the CCS can be viewed within the context of two related questions: (1) what conditions promote the potential for elevated phytoplankton biomass in the fall and winter, and (2) what explains the comparatively low average biomass in the spring and summer? Three features of the Cape Canaveral shelf provide insights into the potential for elevated fall and winter biomass: the shallow depth of the nearshore shelf as it relates to light availability in the mixed layer, subtropical climatic conditions in the region as it relates to temperature and light intensity optima for algal growth, and seasonal shifts in nearshore circulation patterns which help to define the origins of water masses flowing across the CCS.
The shallow CCS is generally characterized by polymictic conditions with the euphotic zone often extending to the seafloor. In deeper temperate coastal regions, increases in solar irradiance, temperature and water column stratification in the spring provide conditions that drive elevated phytoplankton production (Sverdrup, 1953; Ianson et al., 2001). In addition, the central east coast of Florida is within the sub-tropical zone between the tropical waters of the Florida Keys and temperate waters north of Florida, providing higher fall and winter incident light and temperature than at higher latitudes. For example, maximum daily incident irradiance at Cape Canaveral is ~420 Langley’s day−1 in December, compared to only 250 Langley’s day−1 in December on the shores of Long Island in New York (Oswald, 1988). The seasonal range of water temperatures in the CCS fluctuates between winter low temperatures near 20°C to summer high temperatures near 30°C, well within the range to support strong phytoplankton growth throughout the year (Karentz and Smayda, 1984; Andersson et al., 1994; Boyd et al., 2013). While these features help to explain the potential for high phytoplankton biomass in the fall and winter, they do not explain the comparatively low phytoplankton biomass in the spring and summer when light and temperature conditions should be favorable.
Another important feature of the east coast of Florida is seasonal shifts in the prevailing longshore wind direction (Signorini and McClain, 2007; AlYousif et al., 2021), with a predominance of winds from the north in the fall and winter, and the reverse in the spring and summer. Longshore winds have a strong influence on the direction of currents along the inner shelf of Florida (Signorini and McClain, 2007; Miles and He, 2010; AlYousif et al., 2021). Seasonal changes in these wind patterns change the origin of water masses entering the CCS, which play a role in defining phytoplankton biomass and composition in the region. In other words, the character of the phytoplankton community is partially determined by the history of water masses introduced to the CCS from the north, south or east by longshore currents, eddies from the Gulf Stream, or upwelling of deep water from off the shelf (Atkinson et al., 1978, 1984; Lee et al., 1985).
During the peak phytoplankton biomass seasons of fall and winter, the predominant wind and surface current direction along the east coast of north Florida is from the north (Signorini and McClain, 2007, AlYousif et al., 2021). Nearshore water masses moving southward along the Florida peninsula toward the CCS interact with a number of major inputs from the peninsula, including the St. Johns River (one of Florida’s largest rivers) and three inlets to the intracoastal waterway: St. Augustine, Matanzas, and Ponce de Leon (Figure 1). The St. Johns River, and the inner barrier island estuaries linked to the three inlets, are associated with watersheds subject to significant cultural eutrophication and periodic major algal blooms (Scholl et al., 1980; Hendrickson et al., 2002; Phlips et al., 2007, 2015, 2021; Dix et al., 2013; Srifa et al., 2016; Herren et al., 2021). The St Johns River provides the highest riverine discharges to the eastern coast of Florida (Nordlie, 1990), with the fall demonstrating highest mean discharges within the annual cycle (Srifa et al., 2016). Watershed inputs of nutrients to the river yield high levels of nitrogen and phosphorus in the downstream reaches of the river, which are transformed into elevated levels of NH4+, NOx−, and dissolved inorganic phosphorus in the estuary (Wang and Zhang, 2020). Short water residence times in the saline reaches of the river diminish the potential for major marine phytoplankton blooms in the estuary, but elevated levels of phytoplankton have been detected in the river plume in the Atlantic shelf (Wang and Zhang, 2020).
Similar to the St. Johns River, the estuaries associated with the St. Augustine, Matanzas, and Ponce de Leon inlets are subject to significant cultural eutrophication, and are characterized by high nutrient levels compared to coastal waters (Dix et al., 2013; Phlips et al., 2010, 2021). Taken together, these observations indicate that inputs from estuaries along the northeast coast of Florida enhance nutrient and algal loads to the coast, which can be the basis for increases in phytoplankton biomass extending from the outflow of the St. Johns River down to the CCS – as illustrated by satellite images of nearshore chlorophyll a levels (e.g., Figure 11). Nutrient loads are heightened due to increased discharges during the fall because of high rainfall levels in the late summer and early fall, in part due to tropical storm activity during the peak of the hurricane season (i.e., August–October; Srifa et al., 2016; Phlips et al., 2020).
In contrast to fall and winter, there are two major components of water movement from the south during the spring and summer: (1) nearshore currents that move up the coast from the south, and (2) the Florida Current (Gulf Stream), which passes ~60 miles off the shore of Cape Canaveral, and is subject to eddies which propagate off the current toward the coast. A satellite image from August 2018 (Figure 11) illustrates the effect of northerly nearshore water movement on chlorophyll a levels in the summer, with elevated levels of chlorophyll a north of the outflow of the St. Johns River. This image indicates that nutrient and algal inputs from the river and other tributaries in Georgia (e.g., St. Mary’s River) and the Carolinas have a positive effect on phytoplankton biomass on the nearshore shelf. The Florida Current can influence the CCS directly when eddies periodically come off the western side of the Current (Yoder et al., 1981; Lee and Atkinson, 1983) driving water of tropical origin with comparatively low phytoplankton biomass and nutrient levels onto the shelf. Winds from the south in the summer can also drive upwelling of deep water from off the continental shelf into nearshore regions (Atkinson, 1977; Atkinson et al., 1978; Yoder et al., 1985; Miles and He, 2010). Deep cold-water intrusion onto the shelf likely has a depressing effect on phytoplankton biomass since it is low in phytoplankton abundance. While deep-water can contain elevated nutrient levels, the infrequency and limited magnitude of the events, and the limited residence time of the deep-water on the inner shelf, minimize the potential for significant impacts of autochthonous phytoplankton production from the upwelling on inner shelf biomass.
The hypothesis that seasonal differences in phytoplankton biomass are in part linked to changes in the sources of water masses passing through the CCS is further supported by seasonal differences observed in the character of phytoplankton communities. These differences are illustrated by a comparison of the species composition in the Top-200 list of highest biomass of individual taxonomic groups for the summer and fall. In the summer, the list is dominated by picoplanktonic cyanobacteria, which likely reflects a strong influence of Gulf Stream water. The latter observation coincides with previous studies that show the prominence of this group in open ocean ecosystems around the world (Jochem, 2003; Vaulot et al., 2008; Flombaum et al., 2013; Caroppo, 2015; Linacre et al., 2019). Picocyanobacteria have been shown to account for up to 80% of the total primary production in the tropical Eastern Pacific, and for ~60% in the tropical Western Atlantic (Blanchot et al., 1992). The peak densities for picocyanobacteria in this study (109 cells L−1) were generally higher than typically found in the open ocean (Flombaum et al., 2013), but similar to values observed in some other nearshore habitats where upwelled nutrients or terrestrial nutrient inputs provide the potential for higher biomass levels (Paerl et al., 2010; Scanlon, 2012, Caroppo, 2015).
In the fall, while picoplanktonic cyanobacteria are still well represented on the Top-200 list, dinoflagellates and nanoplanktonic eukaryotes are also prominent. Dinoflagellates on the list included a range of obligate autotrophs, mixotrophs and heterotrophs. For example, one of the mixotrophic dinoflagellates most frequently present on the fall Top-200 list is the HAB species Margelefidinium polykrikoides (aka Cochlodinium polykrikoides). M. polykrikoides has been linked to bloom events in other ecosystems subject to elevated levels of NH4 and dissolved organic nitrogen (DON; Kudela and Gobler, 2012; Qin et al., 2021). It has been proposed that elevated levels of NH4+ and DON provide a competitive advantage for dinoflagellates over diatoms, which favor elevated levels of nitrate as the principal source of nitrogen (Kang and Kang, 2022) and can even be inhibited by high levels of NH4+ (Lomas and Glibert, 1999; Berg et al., 2003). By contrast, many dinoflagellates and cyanobacteria are efficient users of NH4+ and dissolved organic forms of nitrogen, such as urea (Glibert et al., 2006; Hattenrath-Lehmann and Gobler, 2015; Huang et al., 2020; Ivey et al., 2020), and many mixotrophic/heterotrophic dinoflagellates, like M. polykrikoides, can also take advantage of particulate carbon and nitrogen through phagotrophy (Jeong et al., 2004).
The major sources of water inflows into the northeast coast of Florida emanate from estuaries that have experienced significant anthropogenic eutrophication over the past century, including the St. Johns River, St. Augustine Inlet, Matanzas Inlet, and the Ponce de Leon Inlet. Many of the dinoflagellate species most prominently represented on the Top-200 list for fall are also commonly observed in the aforementioned estuaries (Hart et al., 2015; Phlips et al., 2011, 2021). In addition, the strong representation of nanoplanktonic species (i.e., prasinophytes and other undefined nanoplanktonic eukaryote) in the Top-200 list for the fall is a feature shared by the aforementioned northeast coastal estuaries and the CCS, and may in part reflect elevated levels of inorganic and organic forms of nutrients. Taken together, these observations support the hypothesis that inputs from estuaries along the Northeast coast of Florida strongly influence not only nutrient levels along the coast, but also the composition and biomass of phytoplankton communities in water masses moving southward toward the CCS in the fall and winter.
Top-down processes may also contribute to the seasonal pattern of phytoplankton biomass in the CCS. While there are little data on zooplankton grazing rates in the CCS, a recent contemporaneous study of regional zooplankton composition may provide some insights (Phlips et al., 2022). The study showed that ciliates on average represent over a third of total zooplankton biomass. The same study also showed that pico- and nano-phytoplankton taxa represented on average over 50% of total phytoplankton biomass (Tate et al., 2020). Since ciliates are known to be a major grazer of pico- and nanoplankton (Pierce and Turner, 1992; Calbet and Landry, 2004), they likely play a role in top-down control of phytoplankton biomass. This observation highlights the importance of microbial loop processes (Pomeroy et al., 2007; Fenchel, 2008) in the CCS. The role of the zooplankton community on top-down control of phytoplankton biomass warrants further investigation, as does the role of other key microbial interactions, such as the impacts of marine viruses, which affect the dynamics of phytoplankton populations and nutrients within the water column (Lehahn et al., 2014; Weitz et al., 2015; Knowles et al., 2020).
The atypical pattern of fall/winter peaks of phytoplankton biomass in the Cape Canaveral shelf (CCS) are strongly influenced by allochthonous inputs. Although the CCS is not directly impacted by major river discharge, the origins of water masses moving through the region help to explain the observed seasonality of phytoplankton biomass. In the fall and winter, wind-driven southerly movement of water masses along the coast of northern Florida are exposed to inputs from nutrient- and phytoplankton-rich rivers and inlets to barrier island estuaries. The inputs enhance phytoplankton biomass potential of water masses that ultimately reach CCS. By contrast, persistent south easterly trade winds in the spring and summer enhance the influence of more oligotrophic Gulf Stream waters on the CCS, resulting in lower seasonal average phytoplankton biomass. The seasonal patterns observed highlight the potential sensitivity of coastal phytoplankton communities to continuing cultural eutrophication and future climate changes, such as higher temperatures, frequency and intensity of tropical storms, and alterations in the character and quantity of discharges from land.
The raw data supporting the conclusions of this article will be made available by the authors, without undue reservation.
BS primary author of the manuscript. EP corresponding author, and contributing author of the manuscript. SB primary taxonomist on research. LL field research leader. MT assistant taxonomist on research. AW-V co-leader of field research. All authors contributed to the article and approved the submitted version.
This study was funded by U.S. Department of Interior, CFDA no. 15.424, agreement number M13AC00012.
We thank the U.S. Department of Interior, Bureau of Ocean Energy Management (BOEM), who funded this project (CFDA No. 15.424, Agreement Number M13AC00012). EP and SB are supported by the USDA National Institute of Food and Agriculture, Hatch Project 1017098. Special thanks to Debra Murie for leading and coordinating the overall BOEM project.
The authors declare that the research was conducted in the absence of any commercial or financial relationships that could be construed as a potential conflict of interest.
All claims expressed in this article are solely those of the authors and do not necessarily represent those of their affiliated organizations, or those of the publisher, the editors and the reviewers. Any product that may be evaluated in this article, or claim that may be made by its manufacturer, is not guaranteed or endorsed by the publisher.
Ahlgren, G. (1983). Comparison of methods for estimation of phytoplankton carbon. Arch Hydrobiologia 98, 489–508.
AlYousif, A., Laurel-Castillo, J. A., So, S., Parra, S. M., Adams, P., and Valle-Levinson, A. (2021). Subinertial hydrodynamics around a cape influenced by a western boundary current. Estuar. Coast. Shelf Sci. 251:107199. doi: 10.1016/j.ecss.2021.107199
Anderson, D., Fensin, E., Gobler, C., Hoeglund, A., Hubbard, K., Kulis, D., et al. (2021). Marine harmful algal blooms (HABs) in the United States: history, current status and future trends. Harmful Algae 102:101975. doi: 10.1016/j.hal.2021.101975
Andersson, A., Haecky, P., and Hagström, Å. (1994). Effect of temperature and light on the growth of micro- nano- and pico-plankton: impact on algal succession. Mar. Biol. 120, 511–520. doi: 10.1007/BF00350071
Atkinson, L. P. (1977). Modes of gulf stream intrusion into the South Atlantic bight shelf waters. Geophys. Res. Lett. 4, 583–586. doi: 10.1029/GL004i012p00583
Atkinson, L. P., O’Malley, P. G., Yoder, J. A., and Paffenhöfer, G. A. (1984). The effect of summertime shelf break upwelling on nutrient flux in southeastern United States continental shelf waters. J. Mar. Res. 42, 969–993. doi: 10.1357/002224084788520756
Atkinson, L., Paffenhöfer, G.-A., and Dunstan, W. (1978). The chemical and biological effect of a gulf stream intrusion off St. Augustine, Florida. Bull. Mar. Sci. 28, 667–679.
Badruzzaman, M., Pinzon, J., Oppenheimer, J., and Jacangelo, J. G. (2012). Sources of nutrients impacting surface waters in Florida: a review. J. Environ. Manag. 109, 80–92. doi: 10.1016/j.jenvman.2012.04.040
Badylak, S., and Phlips, E. J. (2004). Spatial and temporal patterns of phytoplankton composition in a subtropical lagoon, the Indian River lagoon, Florida, USA. J. Plankton Res. 26, 1229–1247. doi: 10.1093/plankt/fbh114
Barnard, A. H., Stegmann, P. M., and Yoder, J. A. (1997). Seasonal surface ocean variability in the South Atlantic bight derived from CZCS and AVHRR imagery. Cont. Shelf Res. 17, 1181–1206. doi: 10.1016/S0278-4343(97)00002-2
Berg, G. M., Balode, M., Purina, I., Bekere, S., Bechemin, C., and Maestrini, S. Y. (2003). Plankton community composition in relation to availability and uptake of oxidized and reduced nitrogen. Aquat. Microb. Ecol. 30, 263–274. doi: 10.3354/ame030263
Blanchot, J., Rodier, M., and Bouteiller, L. (1992). Effect of El Niño southern oscillation events on the distribution and abundance of phytoplankton in the western Pacific tropical ocean along the 165°E. J. Plankton Res. 14, 137–156. doi: 10.1093/plankt/14.1.137
Bontempi, P. S., and Yoder, J. A. (2004). Spatial variability in SeaWiFS imagery of the South Atlantic bight as evidenced by gradients (fronts) in chlorophyll a, and water-leaving radiance. Deep-Sea Res. II Top. Stud. Oceanogr. 51, 1019–1032. doi: 10.1016/S0967-0645(04)00098-0
Boyd, P. W., Rynearson, T. A., Armstrong, E. A., Fu, F., Hayashi, K., Hu, Z., et al. (2013). Marine phytoplankton temperature versus growth responses from polar to tropical waters – outcome of a scientific community-wide study. PLoS One 8:e63091. doi: 10.1371/journal.pone.0063091
Brewin, R. J. W., Raitsos, D. E., Pradhan, Y., and Hoteit, I. (2013). Comparison of chlorophyll in the Red Sea derived from MODIS-aqua and in vivo fluorescence. Remote Sens. Environ. 136, 218–224. doi: 10.1016/j.rse.2013.04.018
Calbet, A., and Landry, M. R. (2004). Phytoplankton growth, microzooplankton grazing, and carbon cycling in marine systems. Limnol. Oceanogr. 49, 51–57. doi: 10.4319/lo.2004.49.1.0051
Caroppo, C. (2015). Ecology and biodiversity of picoplanktonic cyanobacteria in coastal and brackish environments. Biodivers. Conserv. 24, 949–971. doi: 10.1007/s10531-015-0891-y
Carstensen, J., Klais, R., and Cloern, J. E. (2015). Phytoplankton blooms in estuarine and coastal waters: seasonal patterns and key species. Estuar. Coast. Shelf Sci. 162, 98–109. doi: 10.1016/j.ecss.2015.05.005
Cloern, J. E., Foster, S. Q., and Kleckner, A. E. (2014). Phytoplankton primary production in the world's estuarine-coastal ecosystems. Biogeosciences 11, 2477–2501. doi: 10.5194/bg-11-2477-2014
Cloern, J. E., and Jassby, A. D. (2008). Complex seasonal patterns of primary producers at the land–sea interface. Ecol. Lett. 11, 1294–1303. doi: 10.1111/j.1461-0248.2008.01244.x
Dix, N., Phlips, E. J., and Suscy, P. (2013). Factors controlling phytoplankton biomass in a subtropical coastal lagoon: relative scales of influence. Estuar. Coasts 36, 981–996. doi: 10.1007/s12237-013-9613-4
Estrada, M., Delgado, M., Blasco, D., Latasa, M., Cabello, A. M., Benítez-Barrios, V., et al. (2016). Phytoplankton across tropical and subtropical regions of the Atlantic, Indian and Pacific oceans. PLoS One 11:e0151699. doi: 10.1371/journal.pone.0151699
Falkowski, P. G., Barber, R. T., and Smetacek, V. (1998). Biogeochemical controls and feedbacks on ocean primary production. Science 281, 200–206. doi: 10.1126/science.281.5374.200
Fenchel, T. (2008). The microbial loop – 25 years later. J. Exp. Mar. Biol. Ecol. 366, 99–103. doi: 10.1016/j.jembe.2008.07.013
Flombaum, P., Gallegos, J. L., Gordillo, R. A., Rincón, J., Zabala, L. L., Jiao, N., et al. (2013). Present and future global distributions of the marine cyanobacteria Prochlorococcus and Synechococcus. Proc. Natl. Acad. Sci. U. S. A. 110, 9824–9829. doi: 10.1073/pnas.1307701110
Games, P. A., and Howell, J. F. (1976). Pairwise multiple comparison procedures with unequal N’s and/or variances: a Monte Carlo study. J. Educ. Stat. 1, 113–125.
Glibert, P. M., and Burkholder, J. A. M. (2020). Harmful algae at the complex nexus of eutrophication and climate change. Harmful Algae 29, 724–738. doi: 10.1007/s00343-011-0502-z
Glibert, P. M., Harrison, J., Heil, C., and Seitzinger, S. (2006). Escalating worldwide use of urea – a global change contributing to coastal eutrophication. Biogeochemistry 77, 441–463. doi: 10.1007/s10533-005-3070-5
Gorelick, N., Hancher, M., Dixon, M., Ilyushchenko, S., Thau, D., and Moore, R. (2017). Google earth engine: planetary-scale geospatial analysis for everyone. Remote Sens. Environ. 202, 18–27. doi: 10.1016/j.rse.2017.06.031
Grattan, L. M., Holobaugh, S., and Morris, J. G. (2016). Harmful algal blooms and public health. Harmful Algae 57, 2–8. doi: 10.1016/j.hal.2016.05.003
Gregg, W. W., Casey, N. W., and McClain, C. R. (2005). Recent trends in global ocean chlorophyll. Geophys. Res. Lett. 32:L03606. doi: 10.1029/2004GL021808
Griffith, A. W., and Gobler, C. J. (2020). Harmful algal blooms: a climate change co-stressor in marine and freshwater ecosystems. Harmful Alga 91:101590. doi: 10.1016/j.hal.2019.03.008
Harding, L. W., Magnuson, A., and Mallonee, M. E. (2005). SeaWiFS retrievals of chlorophyll in Chesapeake Bay and the mid-Atlantic bight. Estuar. Coast. Shelf Sci. 62, 75–94. doi: 10.1016/j.ecss.2004.08.011
Harris, P. T., Macmillan-Lawler, M., Rupp, J., and Baker, E. K. (2014). Geomorphology of the oceans. Mar. Geol. 352, 4–24. doi: 10.1016/j.margeo.2014.01.011
Hart, J. A., Phlips, E. J., Badylak, S., Dix, N., Petrinec, K., Mathews, A. L., et al. (2015). Phytoplankton biomass and composition in a well-flushed sub-tropical estuary: the contrasting effects of hydrology, nutrient loads and allochthonous influences. Mar. Environ. Res. 112, 9–20. doi: 10.1016/j.marenvres.2015.08.010
Hattenrath-Lehmann, T., and Gobler, C. J. (2015). The contribution of inorganic and organic nutrients to the growth of a north American isolate of the mixotrophic dinoflagellate, Dinophysis acuminata. Limnol. Oceanogr. 60, 1588–1603. doi: 10.1002/lno.10119
Heil, C. A., Dixon, L. K., Hall, E., Garrett, M., Lenes, J. M., O’Neil, J. M., et al. (2014). Blooms of Karenia brevis (Davis) G. Hansen & Ø. Moestrup on the West Florida shelf: nutrient sources and potential management strategies based on a multi-year regional study. Harmful Algae 38, 127–140. doi: 10.1016/j.hal.2014.07.016
Heisler, J. P., Glibert, P. M., Burkholder, J. A., Anderson, D. M., Cochlan, W., Dennison, W., et al. (2008). Eutrophication and harmful algal blooms: a scientific consensus. Harmful Algae 8, 3–13. doi: 10.1016/j.hal.2008.08.006
Hendrickson, J., Trahan, E., Stecker, E., and Ouyang, Y. (2002). TMDL, and PLRG modeling for the lower St. Johns River: calculation of the external load. Technical memorandum, 109. St. Johns River Water Management District, Palatka, Florida.
Herren, L. W., Brewton, R. A., Wilking, L. E., Tarnowski, M. E., Vogel, M. A., and Lapointe, B. E. (2021). Septic systems drive nutrient enrichment of groundwaters and eutrophication in the urbanized Indian River lagoon, Florida. Mar. Pollut. Bull. 172:112928. doi: 10.1016/j.marpolbul.2021.112928
Herrmann, M., Najjar, R. G., Kemp, W. M., Alexander, R. B., Boyer, E. W., Cai, W., et al. (2015). Net ecosystem production and organic carbon balance of U.S. east coast estuaries: a synthesis approach. Glob. Biogeochem. Cycles 29, 96–111. doi: 10.1002/2013GB004736
Hoagland, P., Jin, D., Beet, A., Kirkpatrick, B., Reich, A., Ullmann, S., et al. (2014). The human health effects of Florida red tide (FRT) blooms: an expanded analysis. Environ. Int. 68, 144–153. doi: 10.1016/j.envint.2014.03.016
Hoppenrath, M., Elbrächter, M., and Drebes, G. (2009). Marine Phytoplankton. Kleine Senckenberg-Reihe 49. (Stuttgart, Germany: E. Schweizerbart’sche Verlagsbuchhandlung).
Hu, C., Lee, Z., and Franz, B. (2012). Chlorophyll algorithms for oligotrophic oceans: a novel approach based on three-band reflectance difference. J. Geophys. Res. Oceans 117:117. doi: 10.1029/2011JC007395
Huang, K., Feng, Q., Zhang, Y., Ou, L., Cen, J., Lu, S., et al. (2020). Comparative uptake and assimilation of nitrate, ammonium, and urea by dinoflagellate Karenia mikimotoi and diatom Skeletonema costatum in the coastal waters of the East China Sea. Mar. Pollut. Bull. 155:111200. doi: 10.1016/j.marpolbul.2020.111200
Iafrate, J., Watwood, J. S., Reyier, E., Ahr, B. J., Scheidt, D. M., Holloway-Adkins, K. G., et al. (2019). Behavior, Seasonality, and Habitat Preferences of Mobile Fishes and Sea Turtles within a Large Sand Shoal Complex: Insights from Traditional Sampling and Emerging Technologies. Report to US Dept. of Interior, Bureau of Ocean Energy Mgmt. OCS Study BOEM 43.
Ianson, D., Pond, S., and Parsons, T. (2001). The spring phytoplankton bloom in the coastal Temperate Ocean: growth criteria and seeding from shallow Embayments. J. Oceanogr. 57, 723–734. doi: 10.1023/A:1021288510407
Irizarry-Ortiz, M. M., Obeysekera, J., Park, J., Trimble, P., Barnes, J., Park-Said, W., et al. (2013). Historical trends in Florida temperature and precipitation. Hydrol. Process. 27, 2225–2246. doi: 10.1002/hyp.8259
Ivey, J. E., Wolny, J. L., Heil, C. A., Murasko, S. M., Brame, J. A., and Parks, A. A. (2020). Urea inputs drive picoplankton blooms in Sarasota Bay, Florida, USA. Water 12:2755. doi: 10.3390/w12102755
Jeong, H. J., Yoo, Y. D., Kim, J. S., Kim, T. H., Kim, J. H., Kang, N. S., et al. (2004). Mixotrophy in the phototrophic harmful alga Cochlodinium polykrikoides (Dinophycean): prey species, the effects of prey concentration, and grazing impact. J. Eukaryot. Microbiol. 51, 563–569. doi: 10.1111/j.1550-7408.2004.tb00292.x
Jochem, F. J. (2003). Photo- and heterotrophic pico- and nanoplankton in the Mississippi River plume: distribution and grazing activity. J. Plankton Res. 25, 1201–1214. doi: 10.1093/plankt/fbg087
Justice, C. O., Vermote, E., Townshend, J. R. G., Defries, R., Roy, D. P., Hall, D. K., et al. (1998). The moderate resolution imaging Spectroradiometer (MODIS): land remote sensing for global change research. IEEE Trans. Geosci. Remote Sens. 36, 1228–1249. doi: 10.1109/36.701075
Kang, Y., and Kang, C. (2022). Reduced forms of nitrogen control the spatial distribution of phytoplankton communities: the functional winner, dinoflagellates in an anthropogenically polluted estuary. Mar. Pollut. Bull. 177:113528. doi: 10.1016/j.marpolbul.2022.113528
Karentz, D., and Smayda, T. (1984). Temperature and seasonal occurrence patterns of 30 dominant phytoplankton species in Narragansett Bay over a 22-year period (1959-1980). Mar. Ecol. Prog. Ser. 18, 277–293. doi: 10.3354/meps018277
Knowles, B., Bonachela, J., Behrenfeld, M., Bondoc, K., Cael, B., Carlson, C., et al. (2020). Temperate infection in a virus–host system previously known for virulent dynamics. Nat. Commun. 11:4626. doi: 10.1038/s41467-020-18078-4
Kudela, R., and Gobler, C. J. (2012). Harmful dinoflagellate blooms caused by Cochlodinium sp.: global expansion and ecological strategies facilitating bloom formation. Harmful Algae 14, 71–86. doi: 10.1016/j.hal.2011.10.015
Lapointe, B. E., Herren, L. W., Debortoli, D. D., and Vogel, M. A. (2015). Evidence of sewage-driven eutrophication and harmful algal blooms in Florida’s Indian River Lagoon. Harmful Algae. 43, 82–101.
Lassus, P., Chomérat, N., Hess, P., and Nézan, E. (2016). Toxic and Harmful Microalgae of the World Ocean in Manuals and Guides 68. (Copenhagen, Denmark: International Society for the Study of Harmful Algae, International Oceanographic Committee, UNESCO).
Lee, T. N., and Atkinson, L. P. (1983). Low-frequency current and temperature variability from gulf stream frontal eddies and atmospheric forcing along the southeast U.S. outer continental shelf. J. Geophys. Res. Oceans 88, 4541–4567. doi: 10.1029/JC088iC08p04541
Lee, T. N., Kourafalou, V., Wang, J. D., Ho, W. J., Blanton, J. O., Atkinson, L. P., et al. (1985) “Shelf Circulation from Cape Canaveral to Cape Fear during Winter,” in Oceanography of the Southeastern US Continental Shelf, eds. L. P. Atkinson, D. W. Menzel and K. A. Bush (Washington, D.C.: American Geophysical Union (AGU)) 2, 33–62.
Lehahn, Y., Koren, I., Schatz, D., Frada, M., Sheyn, U., Boss, E., et al. (2014). Decoupling physical from biological processes to assess the impact of viruses on a mesoscale algal bloom. Curr. Biol. 24, 2041–2046. doi: 10.1016/j.cub.2014.07.046
Linacre, L., Durazo, R., Camancho-Ibar, V., Selph, K., Lara-Lara, J., Mirabal-Gómez, U., et al. (2019). Picoplankton carbon biomass assessments and distribution of Prochlorococcus ecotype linked to loop current eddies during summer in the southern Gulf of Mexico. J. Geophys. Res. Oceans 124, 8342–8359. doi: 10.1029/2019JC015103
Liu, M., Lei, X., Zhou, Y., Gao, J., Zhou, Y., Wang, L., et al. (2022). Save reservoirs of humid subtropical cities from eutrophication threat. Environ. Sci. Pollut. Res. 29, 949–962. doi: 10.1007/s11356-021-15560-4
Lomas, M., and Glibert, P. (1999). Interactions between NH4+ and NO3- uptake and assimilation: comparison of diatoms and dinoflagellates at several growth temperatures. Mar. Biol. 133, 541–551. doi: 10.1007/s002270050494
Longley, K. R., Huang, W., Clark, C., and Johnson, E. (2019). Effects of nutrient load from St. Jones river on water quality and eutrophication in Lake George, Florida. Limnologica 77:125687. doi: 10.1016/j.limno.2019.125687
Lundholm, N., Churro, C., Fraga, S., Hoppenrath, M., Iwataki, M., Larsen, J., et al. (Eds). (2009). IOC-UNESCO Taxonomic Reference List of Harmful Micro Algae. Available at: https://www.marinespecies.org/hab
Martins, F. D. S. F., and María, A. (1998). Winter variability of CZCS – derived pigment distributions on the southeastern U.S. continental shelf from 1978 to 1986. PhD thesis. Universidad de Las Palmas de Gran Canaria.
Martins, A. M., and Pelegrí, J. L. (2006). CZCS chlorophyll patterns in the South Atlantic bight during low vertical stratification conditions. Cont. Shelf Res. 26, 429–457. doi: 10.1016/j.csr.2005.11.012
Menden-Deuer, S., and Lessard, E. J. (2000). Carbon to volume relationships for dinoflagellates, diatoms and other protist plankton. Limnol. Oceanogr. 45, 569–579. doi: 10.4319/lo.2000.45.3.0569
Miles, T. N., and He, R. (2010). Temporal and spatial variability of Chl-a and SST on the South Atlantic bight: revisiting with cloud-free reconstructions of MODIS satellite imagery. Cont. Shelf Res. 30, 1951–1962. doi: 10.1016/j.csr.2010.08.016
Nixon, S. W. (1995). Coastal marine eutrophication. A definition, social consequences and future concerns. Ophelia 41, 199–219. doi: 10.1080/00785236.1995.10422044
Nordlie, F. (1990). “Rivers and springs” in Ecosystems of Florida. eds. R. Myers and J. Ewel (Orlando, FL., USA: University of Central Florida).
Oswald, W. J. (1988). “Micro-algae and wastewater treatment,” in Microalgal Biotechnology, eds. M. Borowitzka and L. Borowitzka (Cambridge, UK: Cambridge University Press), 305–328.
Paerl, H. W., Rossignol, K. L., Hall, S. N., Peierls, B. L., and Wetz, M. S. (2010). Phytoplankton community indicators of short- and long-term ecological change in the anthropogenically and climatically impacted Neuse River Estuary, North Carolina, USA. Estuaries Coasts 33, 485–497.
Paerl, H., Valdes, L. M., Peierls, B. L., Adolf, J. E., and Harding, L. W. (2006). Anthropogenic and climatic influences on the eutrophication of large estuarine systems. Limnol. Oceanogr. 51, 448–462. doi: 10.4319/lo.2006.51.1_part_2.0448
Peters, G-J. Y. (2018). Userfriendlyscience: Quantitative Analysis Made Accessible. doi: 10.17605/osf.io/txequ
Phlips, E. J., Badylak, S., Christman, M. C., and Lasi, M. A. (2010). Climatic trends and temporal patterns of phytoplankton composition, abundance and succession in the Indian River Lagoon, Florida, USA. Estuaries Coasts 33, 498–512.
Phlips, E. J., Badylak, S., Christman, M., Wolny, J., Garland, J., Hall, L., et al. (2011). Scales of temporal and spatial variability of harmful algae blooms in the Indian River, Florida, USA. Harmful Algae. 10, 277–290.
Phlips, E. J., Badylak, S., Landauer, L., West-Valle, A., and Stelling, B. (2022). “Chapter 9. Zooplankton,” in Ecological function and recovery of biological communities within dredged ridge-swale habitats in the South-Atlantic bight. Murie D. J., Smith G. H. Eds. U.S. Department of Interior, Bureau of Ocean Energy Management. Final report for agreement number M13AC00012.
Phlips, E. J., Badylak, S., Lasi, M. A., Chamberlain, R., Green, W. C., Hall, L. M., et al. (2015). From red tides to Green and Brown tides: bloom dynamics in a restricted subtropical lagoon under shifting climatic conditions. Estuar. Coasts 38, 886–904. doi: 10.1007/s12237-014-9874-6
Phlips, E. J., Badylak, S., and Lynch, T. L. (1999). Blooms of the picoplanktonic cyanobacterium Synechococcus in Florida bay. Limnol. Oceanogr. 44, 1166–1175. doi: 10.4319/lo.1999.44.4.1166
Phlips, E. J., Badylak, S., Nelson, N., Hall, L., Jacoby, C., Lasi, M., et al. (2021). Cyclical patterns and a regime shift in the character of phytoplankton blooms in a restricted sub-tropical lagoon, Indian River lagoon, Florida, USA. Front. Mar. Sci. 8:730934. doi: 10.3389/fmars.2021.730934
Phlips, E. J., Badylak, S., Nelson, N., and Havens, K. (2020). Hurricanes, El Niño and harmful algal blooms in two sub-tropical Florida estuaries: direct and indirect impacts. Sci. Rep. 10:1910. doi: 10.1038/s41598-020-58771-4
Phlips, E. J., Hendrickson, J., Quinlan, E. L., and Cichra, M. (2007). Meteorological influences on algal bloom potential in a nutrient-rich Blackwater river. Freshw. Biol. 52, 2141–2155. doi: 10.1111/j.1365-2427.2007.01844.x
Pierce, R. W., and Turner, J. T. (1992). Ecology of planktonic ciliates in marine food webs. Rev. Aquat. Sci. 6, 139–181.
Pomeroy, L. R., Williams, P. J., Azam, F., and Hobbie, J. E. (2007). The microbial loop. Oceanography 20, 28–33. doi: 10.5670/oceanog.2007.45
Qin, Q., Shen, J., Reece, K., and Mulholland, M. (2021). Developing a 3D mechanistic model for examining factors contributing to harmful blooms of Margelefidinium polykrikoides in a temperate estuary. Harmful Algae 105:102055. doi: 10.1016/j.hal.2021.102055
Sartory, D. P., and Grobbelaar, J. U. (1984). Extraction of chlorophyll a from freshwater phytoplankton for spectrophotometric analysis. Hydrobiologia 114, 177–187. doi: 10.1007/BF00031869
Scanlon, D. J. (2012). “Marine picocyanobacteria” in Ecology of Cyanobacteria II: Their Diversity in Space and Time. ed. B. A. Whitton (Dordrecht: Springer Netherlands), 503–533.
Scholl, J., Heaney, J., and Huber, W. (1980). Water quality analysis of the Halifax River, Florida. Water Resour. Bull. 16, 285–293. doi: 10.1111/j.1752-1688.1980.tb02392.x
Sicko-Goad, L. M., Schelske, C. L., and Stoermer, E. F. (1984). Estimation of intracellular carbon and silica content of diatoms from natural assemblages using morphometric techniques. Limnol. Oceanogr. 29, 1170–1178. doi: 10.4319/lo.1984.29.6.1170
Signorini, S. R., and McClain, C. R. (2007). Large-Scale Forcing Impact on Biomass Variability in the South Atlantic Bight. Geophys. Res. Lett. 21, 1–6. doi: 10.1029/2007GL031121
Simons, R. A. (2011). ERDDAP. Monterey, CA: NOAA/NMFS/SWFSC/ERD. Available at: https://coastwatch.pfeg.noaa.gov/erddap
Smayda, T. J. (1978). “From phytoplankters to biomass” in Phytoplankton manual. ed. A. Sournia (Paris: UNESCO), 273–279.
Srifa, A., Phlips, E. J., and Hendrickson, J. (2016). How many seasons are there in a sub-tropical lake? A multivariate statistical approach to determine seasonality and its application to phytoplankton dynamics. Limnologica 60, 39–50. doi: 10.1016/j.limno.2016.05.011
Steidinger, K. A. (2009). Historical perspective on Karenia brevis red tide research in the Gulf of Mexico. Harmful Algae 8, 549–561. doi: 10.1016/j.hal.2008.11.009
Stich, H., and Brinker, A. (2005). Less is better: uncorrected versus pheopigment-corrected photometric chlorophyll-a estimation. Archiv für Hydrobiologia 162, 111–120. doi: 10.1127/0003-9136/2005/0162-0111
Strathmann, R. R. (1967). Estimating the organic carbon content of phytoplankton from cell volume or plasma volume. Limnol. Oceanogr. 12, 411–418. doi: 10.4319/lo.1967.12.3.0411
Sun, J., and Liu, D. (2003). Geometric models for calculating cell biovolume and surface area for phytoplankton. J. Plankton Res. 25, 1331–1346.
Sverdrup, H. (1953). On conditions for the vernal blooming of phytoplankton. J. Cons. Int. Explor. Mer 18, 287–295. doi: 10.1093/icesjms/18.3.287
Tate, M. C., Phlips, E. J., Stelling, B., Badylak, S., Landauer, L., West-Valle, A., et al. (2020). Phytoplankton composition in the sub-tropical shelf environment of Cape Canaveral, Florida. Bull. Mar. Sci. 96, 593–616. doi: 10.5343/bms.2019.0079
Tillman, D. H., Cerco, C. F., Noel, M. R., Martin, J. L., and Hamrick, J. (2004). Three-dimensional eutrophication model of the lower St. John River, Florida. Engineer Research and Development Center, Environmental Laboratory, Vicksburg, MS.
Utermöhl, H. (1958). Zur Vervollkommnung der quantitativen phytoplankton-methodik. Mitt Int Ver Theor Angew Limnol 9, 1–38. doi: 10.1080/05384680.1958.11904091
Vargo, G. A. (2009). A brief summary of the physiology and ecology of Karenia brevis (Davis) Hansen and Moestrup red tides on the West Florida shelf and of hypotheses posed for their initiation, growth, maintenance, and termination. Harmful Algae 8, 573–584. doi: 10.1016/j.hal.2008.11.002
Vaulot, D., Eikrem, W., and Viprey, M. H. (2008). The diversity of small eukaryotic phytoplankton (≤ 3 μm) in marine ecosystems. FEMS Microbiol. Rev. 32, 795–820. doi: 10.1111/j.1574-6976.2008.00121.x
Vazyulya, S., Khrapko, A., Kopelevich, O., Burenkov, V., Eremina, T., and Isaev, A. (2014). Regional algorithms for the estimation of chlorophyll and suspended matter concentration in the Gulf of Finland from MODIS-aqua satellite data. Oceanologia 56, 737–756. doi: 10.5697/oc.56-4.737
Verity, P. G., Blanton, J. O., Amft, J., Barans, C., Knott, D., Stender, B., et al. (1998). Influences of physical oceanographic processes on chlorophyll distributions in coastal and estuarine waters of the South Atlantic bight. J. Mar. Res. 56, 681–711. doi: 10.1357/002224098765213630
Verity, P., Robertson, C. Y., Tronzo, C. R., Andrews, M. G., Nelson, J. R., and Stieracki, M. E. (1992). Relationships between cell volume and the carbon and nitrogen content of marine photosynthetic nanoplankton. Limnol. Oceanogr. 37, 1434–1446. doi: 10.4319/lo.1992.37.7.1434
Wang, J., and Zhang, Z. (2020). Phytoplankton, dissolved oxygen and nutrient patterns along a eutrophic river-estuary continuum: observation and modeling. J. Environ. Manag. 261:110233. doi: 10.1016/j.jenvman.2020.110233
Weitz, J., Stock, C., Wilhelm, S., Bourouiba, L., Coleman, M., Buchan, A., et al. (2015). A multitrophic model to quantify the effects of marine viruses on microbial food webs and ecosystem processes. ISME J. 9, 1352–1364. doi: 10.1038/ismej.2014.220
Winder, M., and Cloern, J. E. (2010). The annual cycles of phytoplankton biomass. Philos. Trans. R. Soc. B: Biol. Sci. 365, 3215–3226. doi: 10.1098/rstb.2010.0125
Winkler, S., and Ceric, A. (2004). Status and trends in water quality at selected sites in SJRWMD. Technical Publication SJ2004-3, St Johns River Water Management District, Palatka, FL.
Work, K., Havens, K., Sharfstein, B., and East, T. (2005). How important is carbon to planktonic grazers in a turbid, subtropical lake? J. Plankton Res. 27, 357–372. doi: 10.1093/plankt/fbi013
Xiao, Y., Zhang, J., Cui, T., and Sun, L. (2018). A new merged dataset of global ocean chlorophyll a concentration with higher spatial and temporal coverage. Acta Oceanol. Sineca 37, 118–130. doi: 10.1007/s13131-018-1249-6
Yamada, K., Ishizaka, J., Yoo, S., Kim, H., and Chiba, S. (2004). Seasonal and interannual variability of sea surface chlorophyll a concentration in the Japan/East Sea (JES). Prog. Oceanogr. 61, 193–211. doi: 10.1016/j.pocean.2004.06.001
Yoder, J. A. (1985). “Environmental control of phytoplankton production on the southeastern U.S. continental shelf,” in Oceanography of the southeastern U.S. continental shelf, eds. L. P. Atkinson, D. W. Menzel and K. A. Bush (Washington, D.C.: American Geophysical Union (AGU)), 93–103.
Yoder, J. A., Atkinson, L. P., Lee, T. N., Kim, H. H., and McClain, C. R. (1981). Role of gulf stream frontal eddies in forming phytoplankton patches on the outer southeastern shelf1. Limnol. Oceanogr. 26, 1103–1110. doi: 10.4319/lo.1981.26.6.1103
Yoder, J. A., Atkinson, L. P., Stephen Bishop, S., Blanton, J. O., Lee, T. N., and Pietrafesa, L. J. (1985). Phytoplankton dynamics within gulf stream intrusions on the southeastern United States continental shelf during summer 1981. Cont. Shelf Res. 4, 611–635. doi: 10.1016/0278-4343(85)90033-0
Yoder, J. A., O’Reilly, J. E., Barnard, A. H., Moore, T. S., and Ruhsam, C. M. (2001). Variability in coastal zone color scanner (CZCS) chlorophyll imagery of ocean margin waters off the US East Coast. Cont. Shelf Res. 21, 1191–1218. doi: 10.1016/S0278-4343(01)00009-7
Yoder, J. A., Schollaert, S. E., and O’Reilly, J. E. (2002). Climatological phytoplankton chlorophyll and sea surface temperature patterns in continental shelf and slope waters off the northeast U.S. coast. Limnol. Oceanogr. 47, 672–682. doi: 10.4319/lo.2002.47.3.0672
Yoder, J. A., Verity, P. G., Bishop, S. S., and Hoge, F. E. (1993). Phytoplankton Chl a, primary production and nutrient distributions across a coastal frontal zone off Georgia, U.S.A. Cont. Shelf Res. 13, 131–141. doi: 10.1016/0278-4343(93)90102-4
Keywords: climate, eutrophication, chlorophyll, cyanobacteria, dinoflagellates, South Atlantic Bight, Gulf Stream
Citation: Stelling B, Phlips E, Badylak S, Landauer L, Tate M and West-Valle A (2023) Seasonality of phytoplankton biomass and composition on the Cape Canaveral shelf of Florida: Role of shifts in climate and coastal watershed influences. Front. Ecol. Evol. 11:1134069. doi: 10.3389/fevo.2023.1134069
Edited by:
Michael C. Murrell, University of West Florida, United StatesReviewed by:
Sarat Chandra Tripathy, National Centre for Polar and Ocean Research, IndiaCopyright © 2023 Stelling, Phlips, Badylak, Landauer, Tate and West-Valle. This is an open-access article distributed under the terms of the Creative Commons Attribution License (CC BY). The use, distribution or reproduction in other forums is permitted, provided the original author(s) and the copyright owner(s) are credited and that the original publication in this journal is cited, in accordance with accepted academic practice. No use, distribution or reproduction is permitted which does not comply with these terms.
*Correspondence: Edward Phlips, ✉ cGhsaXBzQHVmbC5lZHU=
Disclaimer: All claims expressed in this article are solely those of the authors and do not necessarily represent those of their affiliated organizations, or those of the publisher, the editors and the reviewers. Any product that may be evaluated in this article or claim that may be made by its manufacturer is not guaranteed or endorsed by the publisher.
Research integrity at Frontiers
Learn more about the work of our research integrity team to safeguard the quality of each article we publish.