 Jie Li
 Jiangqi Wu
95% of researchers rate our articles as excellent or good
Learn more about the work of our research integrity team to safeguard the quality of each article we publish.
Find out more
ORIGINAL RESEARCH article
Front. Ecol. Evol. , 21 April 2023
Sec. Conservation and Restoration Ecology
Volume 11 - 2023 | https://doi.org/10.3389/fevo.2023.1131463
This article is part of the Research Topic Sustainable Grasslands: Management Options for Ecosystem Functioning and Service View all 23 articles
Most previous studies on water yield service (WYs) analyzed the driving factors of WYs from a holistic perspective, but ignored the spatial heterogeneity and development of the driving factors. Using Invest model, Random Forest (RF) model and Geographically and Temporally Weighted (GTWR) model, we first examined the spatial distribution characteristics of WYs in agro-pastoral ecotone of Gansu China (AEGC) from 2000 to 2020. Secondly, the driving mechanism behind the spatiotemporal variation of WYs was discussed. The results show that: (1) In recent 20 years, the average annual WYs of AEGC was 110.52 mm, and the interannual variation showed an upward trend, with an increasing rate of 2.28 mm/a (p < 0.05). WYs are high in the south, low in the north, and high in the northwest. Except for the southeast, WYs remained stable or increased in other regions. (2) The relative importance of the main influencing factors of WYs in AEGC successively were precipitation (1.57), evapotranspiration (1.29), temperature (1.12), population density (1.10), net primary productivity (NPP 1.06), and land use intensity (1.02). (3) Large-scale regional nature conditions are the primary force driving change in WYs, while in small-scale regions, human activities and land use are the primary drivers of WYs. Our research emphasizes that the effects of various influencing factors on WYs are significantly spatiotemporal heterogeneity, and WYs in different regions respond differently to the changes of influencing factors.
Water connects various ecosystem processes and human activities, and water shortages are a common problem for people all around the world (Greve et al., 2018; Chung et al., 2021). Therefore, WYs are one of the most important ecosystem services (ES) and are a key indicator of ecosystem health (Costanza et al., 1997; Xia et al., 2021). Furthermore, WYs directly affect regional water supplies, impact many ecological functions such as food and raw material production, soil conservation, climate regulation, and biodiversity, and help maintain ecosystem stability and human social development (Graham et al., 2021; Jung et al., 2021; Queiroz et al., 2021).
WYs can be considered “ecosystem water production.” The principle of dynamic water balance refers to the difference between water inflows and water expenditures over a certain period. Inflow is determined by precipitation, and expenditures are determined by actual evapotranspiration (Xia et al., 2017; Zhang and Zhang, 2018; Yang et al., 2019; Hu et al., 2021). Many studies have calculated the contribution of various factors to water balance. First, climate data and land use data from a certain time period are modeled in different scenarios to represent, fluctuations in WYs caused by land use change. Additionally, they use fixed land use data and inputs different climatic conditions to simulate changes in WYs caused by climate change (Hu et al., 2020; He et al., 2021; Son et al., 2022). These methods consider precipitation to be an unpredictable factor and that human activities will change land use and alter evapotranspiration; however, this approach ignores the effects of climate change and the complexity of human activities (Rohatyn et al., 2018; Yin et al., 2020; Chen et al., 2022; Jia et al., 2022). Therefore, these simulations could overestimate the relative role of land-use change on WYs and underestimate the role of nature factors, resulting in inaccurate the conclusions.
Researchers have commonly explored the mechanism of WYs and related factors by assessing their relationship to the water cycle (Wang J. et al., 2021; Wang X. et al., 2021). Other studies have demonstrated that precipitation is significantly positively correlated with WYs and that actual evapotranspiration is significantly negatively correlated with WYs (Su and Fu, 2013; Zhang et al., 2020; Wu J. et al., 2021). Temperature, NPP, and normalized digital vegetation index (NDVI) have an insignificant impact on WYs, showing positive and negative bidirectionality. Some scholars (Yin et al., 2019) further believe that NPP positively affects WYs in regions with thriving ecosystems, and negatively affects regions with impaired ecosystems. However, our research analyzed these factors holistically and did not consider the spatial heterogeneity of WYs drivers; it also separated the continuity of development and change of WYs drivers over time. However, these results must be verified in other regions. Therefore, it is necessary to analyze the driving mechanism of WYs, using different methods at various regional scales.
After considering the importance of ecological functions and the variance related to geographical locations, the AEGC was selected as our study area. The AEGC is an important ecological barrier and the largest climatic and ecological transition zone in China. It is extremely sensitive to nature conditions change and human interference. Therefore, it is a suitable region for studying environmental problems (Pei et al., 2021; Fang et al., 2022). As an ecologically fragile, this area is the site of national ecological restoration projects such as the Three-North Shelterbelt and returning farmland to a forest (Liu et al., 2021), making it a suitable location for exploring the driving mechanism of WYs and how it is affected by nature conditions change (Yang et al., 2021) and human activities.
In this study, the main objectives are to (1) explore the long-term change trend and spatial distribution characteristics of WYs in AEGC from 2000 to 2020. (2) establish a comprehensive database of natural conditions and human activities to quantify the relative importance of various factors affecting WYs. (3) identify the spatiotemporal differences of the main impact factors on WYs, and study the driving mechanism behind the spatiotemporal changes of WYs. This work can not only aid in comprehending the effects of natural conditions change and human activities on WYs, but also provides valuable information for the protection, utilization and management of water resources.
The AEGC (33°40′ ~ 37°54′N, 101°55′ ~ 108°34′E) includes 35 districts and counties (Figure 1), covering an area of 99,300 km2. It is located on the eastern edge of the Tibetan Plateau and is a transition zone for major geographical units. It is known as the “Asian water tower” and is connected to the Tibetan Plateau in the west, Qinba Mountain in the south, the Loess Plateau in the east, and the Hexi Corridor in the north (Zhang et al., 2016; Immerzeel et al., 2020). The study area spans the two major river basins of the Yellow River and the Yangtze River and is an important source of water for the Yellow River. Its main rivers are the Tao River, Wei River, Huangshui River, and Bailong River (Qiu et al., 2022). The ecological environment in the study area is complex and diverse, and its primary landforms are plateaus, mountains, hills, and river valleys (Nie et al., 2015). Its altitude is 1,102 ~ 5,339 m, and is generally higher in the west and lower in the east. Precipitation is higher in the south (about 800 mm per year) and lower in the north (about 200 mm per year), with an average annual temperature of 1 ~ 11°C. In the summer, temperatures are higher, and there is more precipitation, while in the winter, temperatures are lower with less precipitation. As a result, there are differences in topography, climate, hydrology, and land use among the regions of the AEGC (Ma et al., 2020).
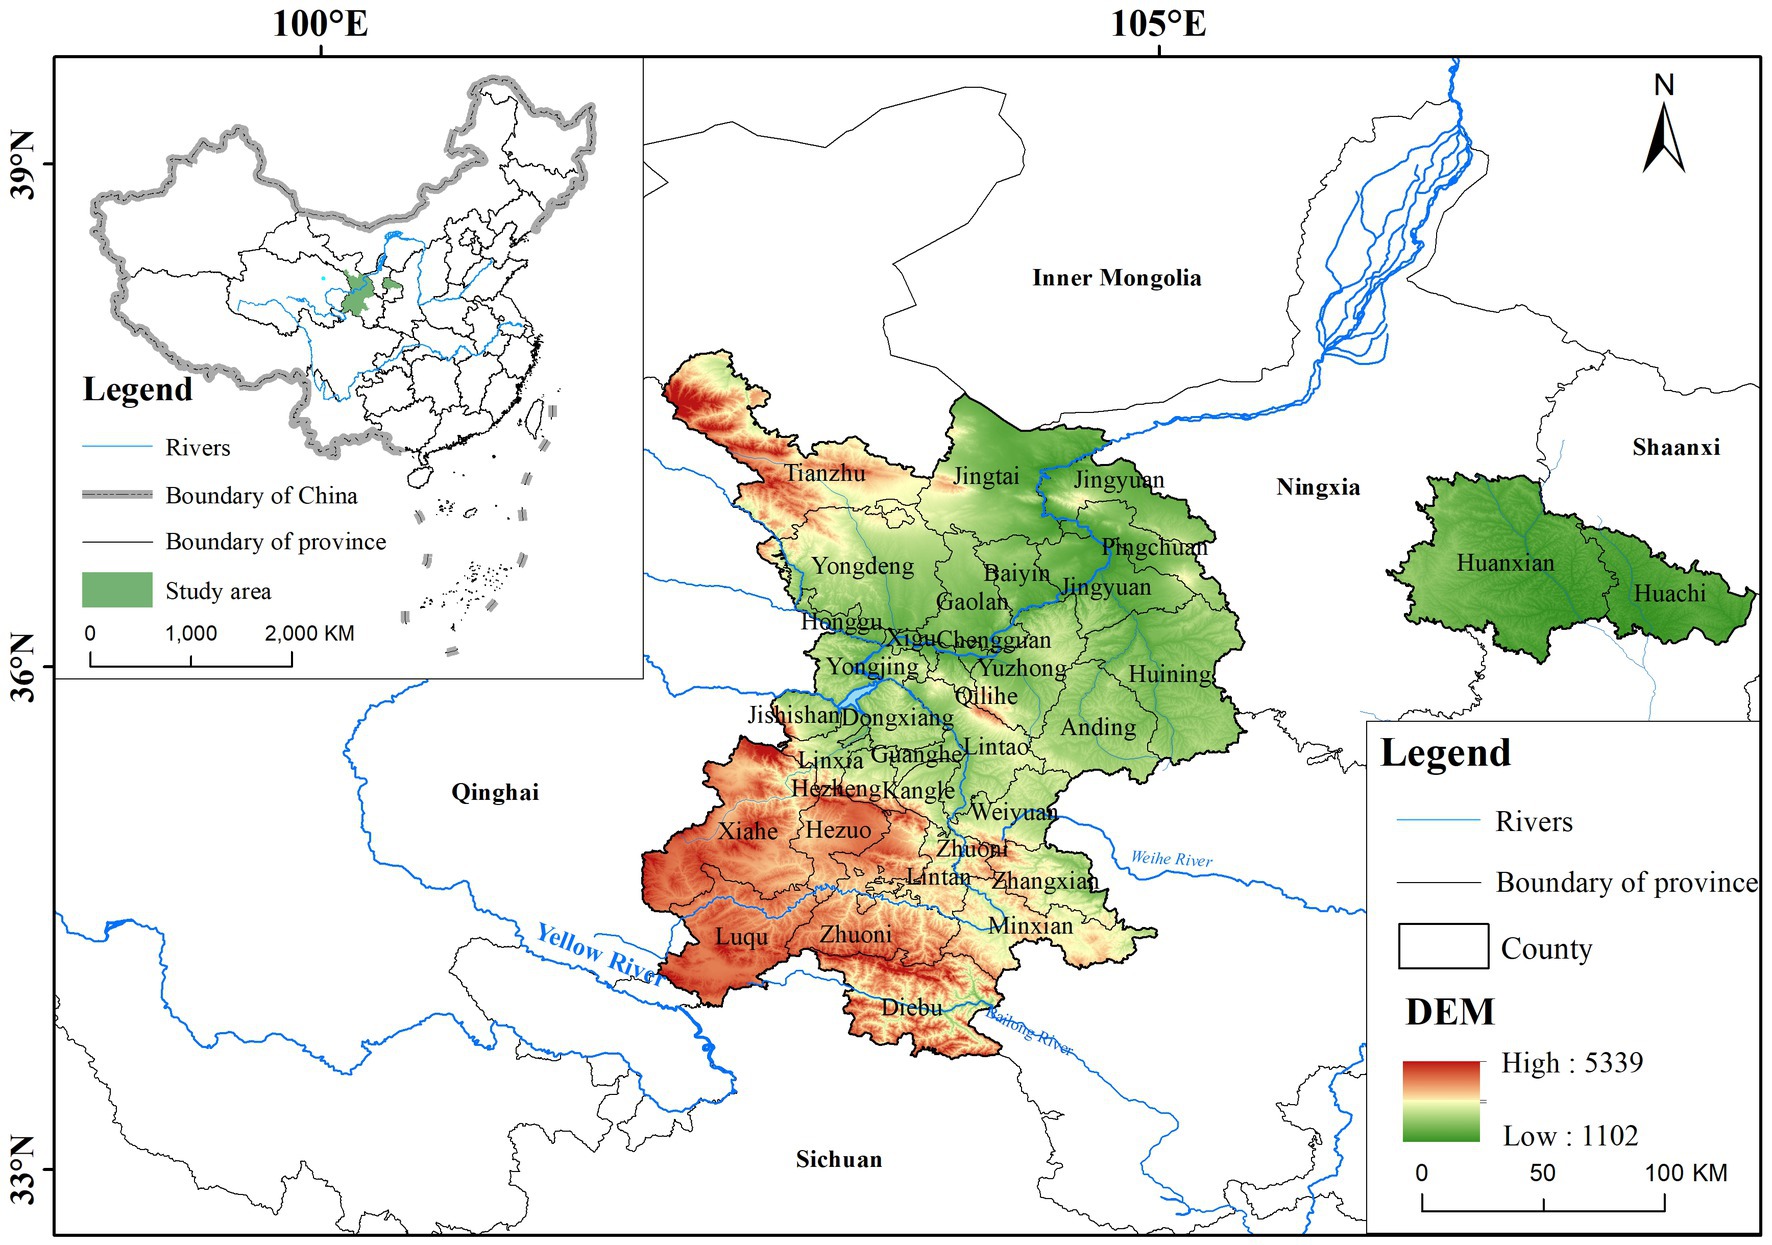
Figure 1. Spatial range of the study area.
Select population density, economic density and land use intensity as human activity factors (Sang et al., 2019; Liu et al., 2020; Jiang et al., 2023), precipitation, temperature, evapotranspiration, NDVI, NPP, (Digital Elevation Model) DEM and slope as natural condition factors (Yang et al., 2011; Ahmed et al., 2021; Hu et al., 2021; Wang J. et al., 2021; Wang X. et al., 2021), and establish a comprehensive factors database that may affect water production services, providing a basis for subsequent determination of impact factors (Figure 2). All data sources and preprocessing can be visible in Table 1.
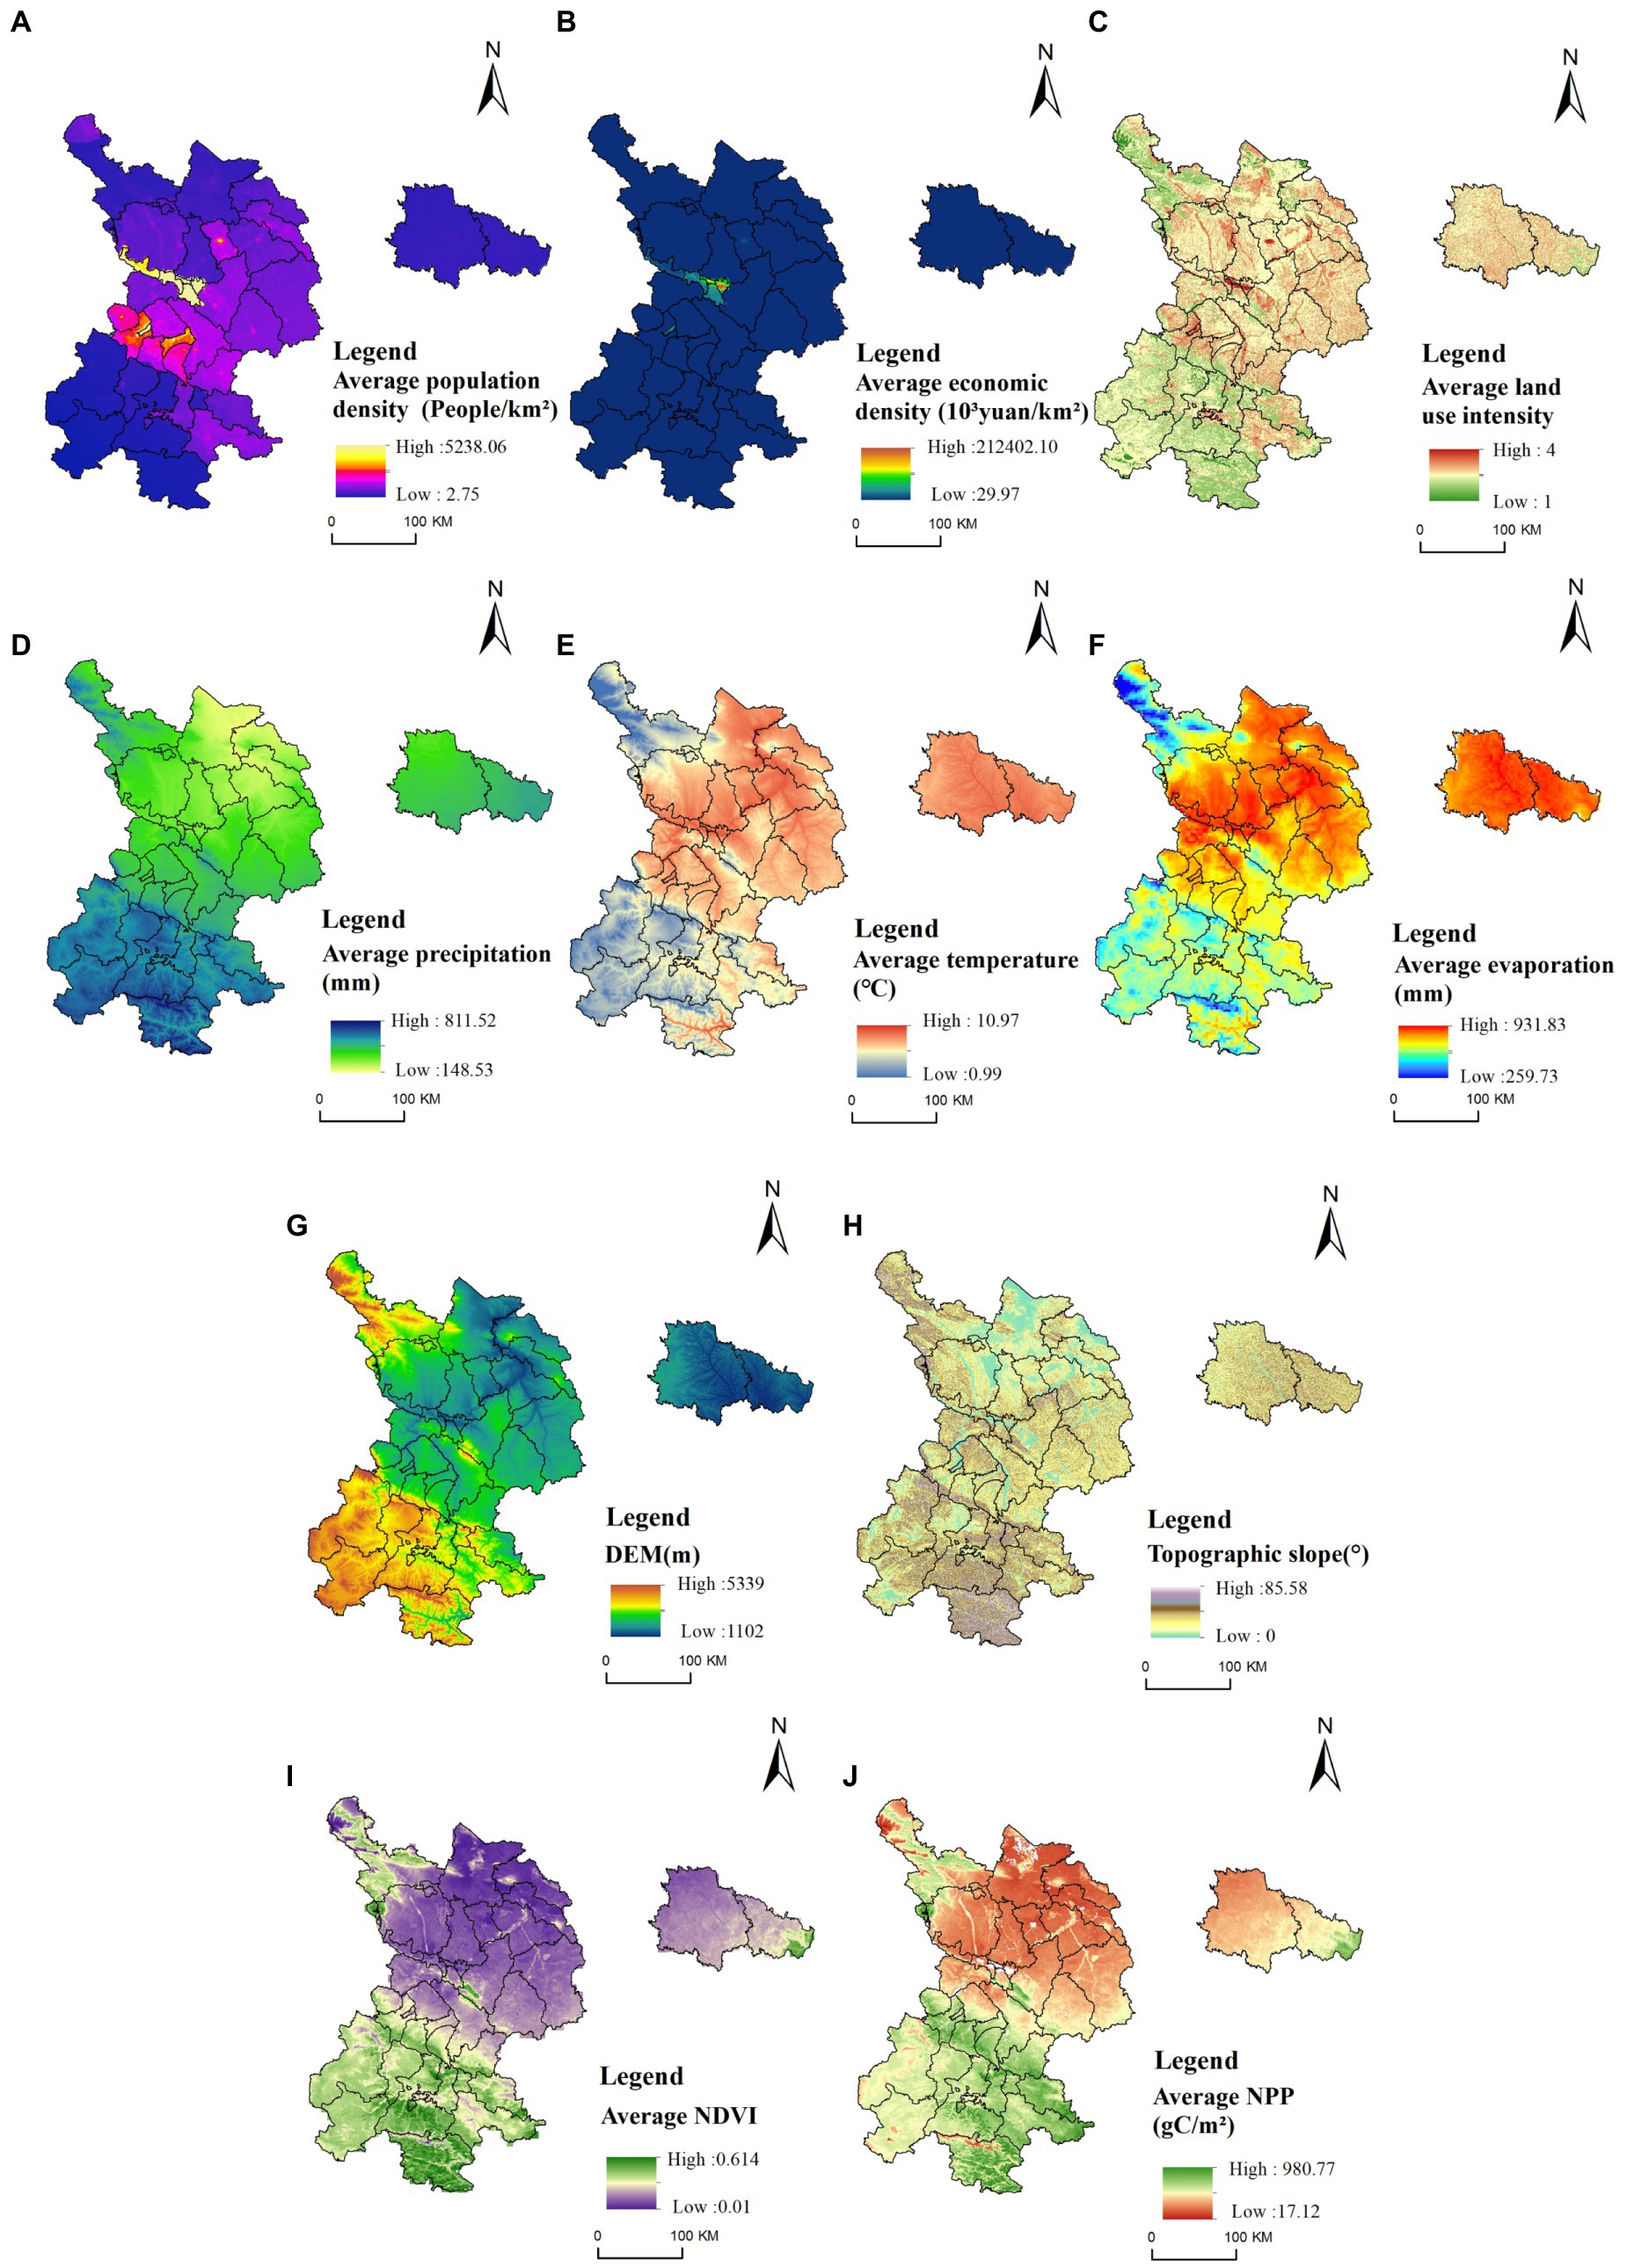
Figure 2. The impact factors database is briefly displayed. Due to the large amount of data, except DEM and slope data, which are basically fixed, other data are displayed spatially based on the average value from 2000 to 2020. The population density (A) and economic density (B) to some extent indicate the intensity of human activities in the region, and the intensity of land use directly (C) reflects the transformation of the natural environment by human beings. (D–F) belongs to climate data, which are average precipitation, average temperature and average evaporation respectively. (G, H) are geographic data, where are DEM and topographic slope respectively. (I, J) are ecological data, which are average NDVI and average NPP respectively.
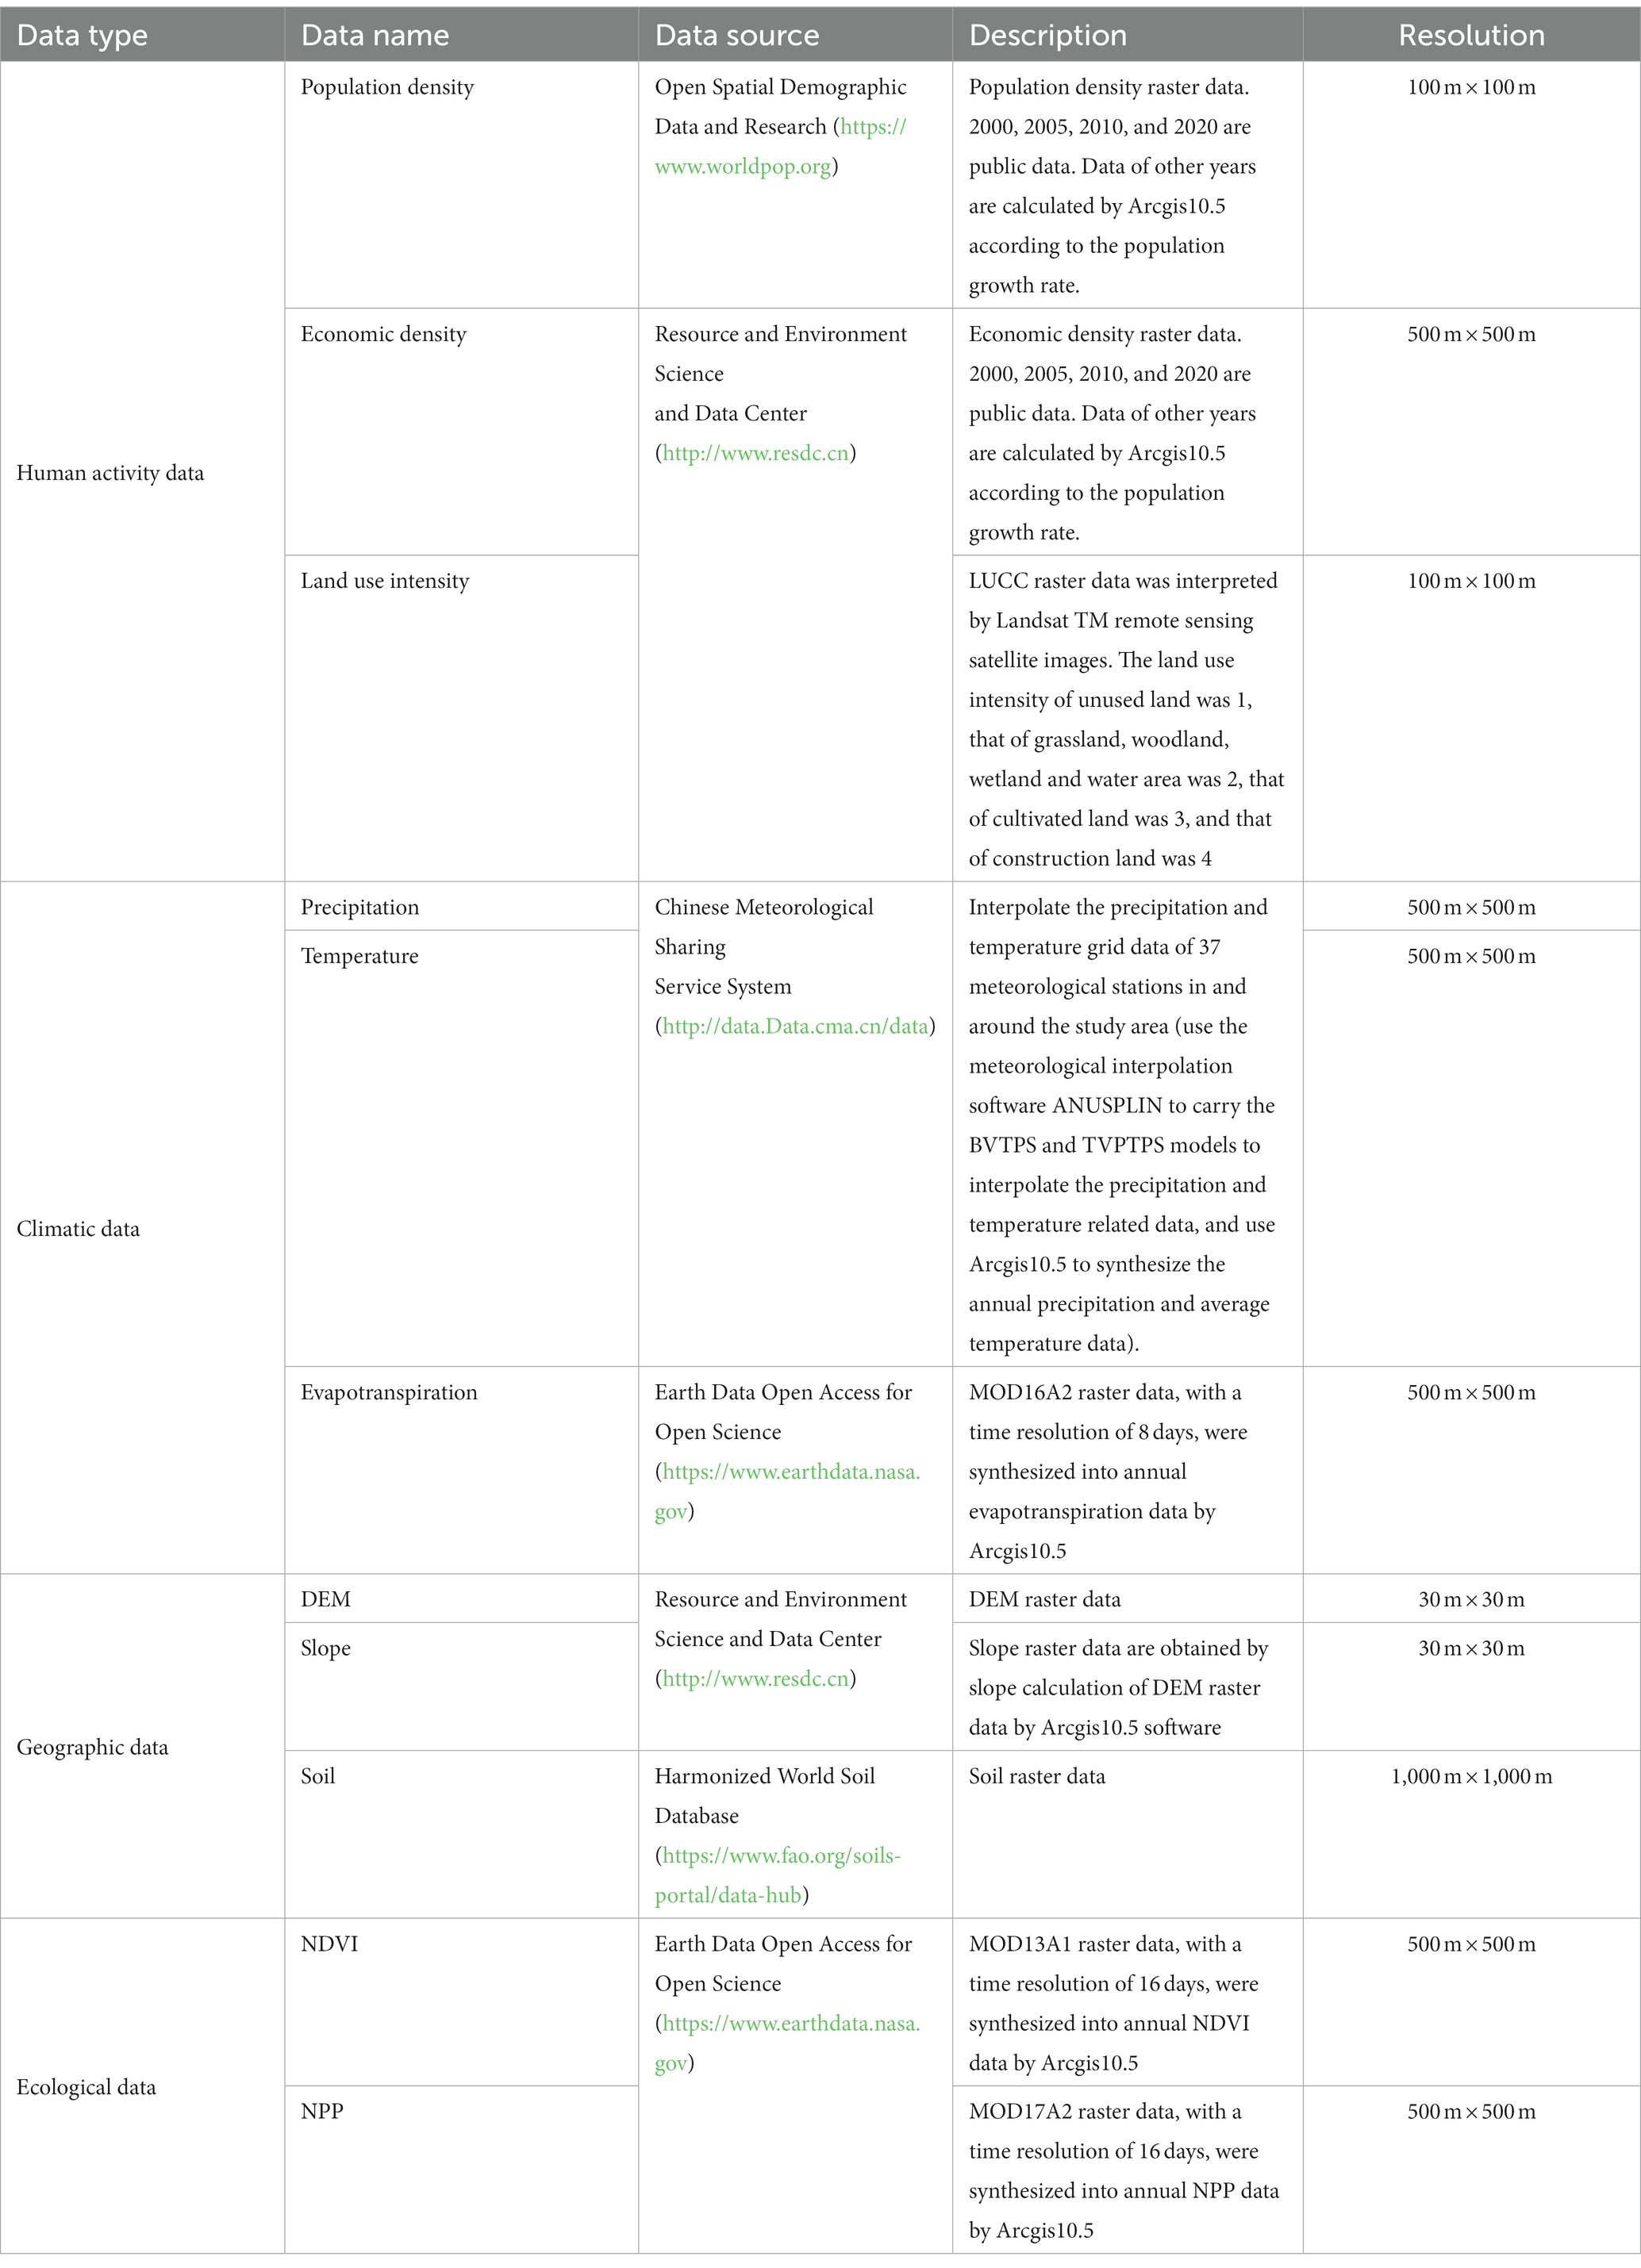
Table 1. Data descriptions and sources used in this study.
Many studies have confirmed that InVEST can effectively perform ES simulations in different regions.1 The evaluation results of the model can be visualized at the landscape scale (Hamel and Guswa, 2015; Redhead et al., 2016). Therefore, this study uses the InVEST to evaluate WYs according to the following calculation equations:
In Eqs (1)–(6), is WYs of land-use type in grid (mm); is the actual evapotranspiration of land-use type in grid (mm); is the annual precipitation in grid (mm); is the evapotranspiration coefficient of land-use ; is the reference crop evapotranspiration in grid (mm); is the empirical parameters in grid ; is seasonal content with a range of 1 to 30, which was assigned a value of 30 according to the estimates of actual evapotranspiration; is the soil available water capacity in grid (mm); is the root burial depth (mm) from HWSD; is the plant root depth (mm); is the plant available water content . where the SAND, SILT, CLA Y, and SOC are the proportion of sand, silt, clay, and organic matters in the soil, respectively.
A linear regression analysis was used to analyze the variation trend of WYs by grid unit, which is widely used and easy to interpret (Belay et al., 2021; Kilama Luwa et al., 2021). The coefficient of variation is the ratio of the standard deviation to the mean value, which can reflect the spatial fluctuation characteristics of the WYs of the grid unit. The following calculation equations were used:
In Eqs (7)–(8), is the WYs in years of (mm); where is the year; is the number of years; is the slope of the trend of water production; the significance test indicates 95% confidence, is the coefficient of variation; is the standard deviation; and is the average value.
Using RF to evaluate the importance of independent variables is to quantify the contribution degree of each independent variable to the classification performance of the constructed K decision trees (Arabameri et al., 2019; Peng et al., 2020). Contribution degree is usually evaluated by out of bag (OOB) error rate. Contribution degree is represented by feature importance measures (FIM).
In Eqs (9)–(10), is the number of observed samples of the tree. is the sample pair true classification labels should be applied. is the prediction classification result of the p observation of OOB data by the tree before random replacement . is the classification result of the sample by the decision tree after random replacement . When the feature does not appear in the tree, shows the number of decision trees in the RF. is the standard deviation of . The importance score of feature represents the contribution of feature to the classification accuracy. FIM was determined by mean and standard deviation of OOB error rate.
Based on the classical geographically-weighted regression model, the GTWR model adds time to the two-dimensional spatial coordinates from the geographically-weighted regression model, producing three-dimensional coordinates (He and Huang, 2018; Liu et al., 2018; Li and Managi, 2021; Wu S. et al., 2021). The spatiotemporal non-stationarity relationship was modeled by constructing a local model of spatial and temporal dependence, which can better reveal the local effects of various driving factors on WYs. It was calculated as follows:
In Eq. (11), is the fitting value of the WYs change of sample ;() is the space–time coordinate of sample ; is the intercept term; p is the number of explanatory variables; is the estimated coefficient of the kth explanatory variable; and is the model residual.
The dynamic degree is a measure of changes in the area of WYs driven by dominant driving factors (Li et al., 2022; Yao et al., 2022) and is calculated as follows:
In Eq. (12), is the dynamic degree of the dominant driving WYs area of a factor; , are the areas dominated by the element at the beginning and end of the study; is the length of the study period.
From 2000 to 2020, the average annual WYs in AEGC was 110.52 mm, and the total average annual WYs was 1.1 × 10^10 m3(Figure 3). The WYs in AEGC generally showed an upward trend, with an average increase rate of 2.28 mm/a. The annual WYs were the smallest in 2015 (35.48 mm), and the largest in 2019 (172.63 mm). Subsection statistics better reflect the changing trend of WYs. From 2000 to 2010, the annual WYs steadily increased, with an average WYs of 99.59 mm and an increased rate of 0.58 mm/a. From 2011 to 2020, the fluctuation range of annual WYs became larger; the average WYs was 122.56 mm, and the rate of increase was 5.21 mm/a (p < 0.05).
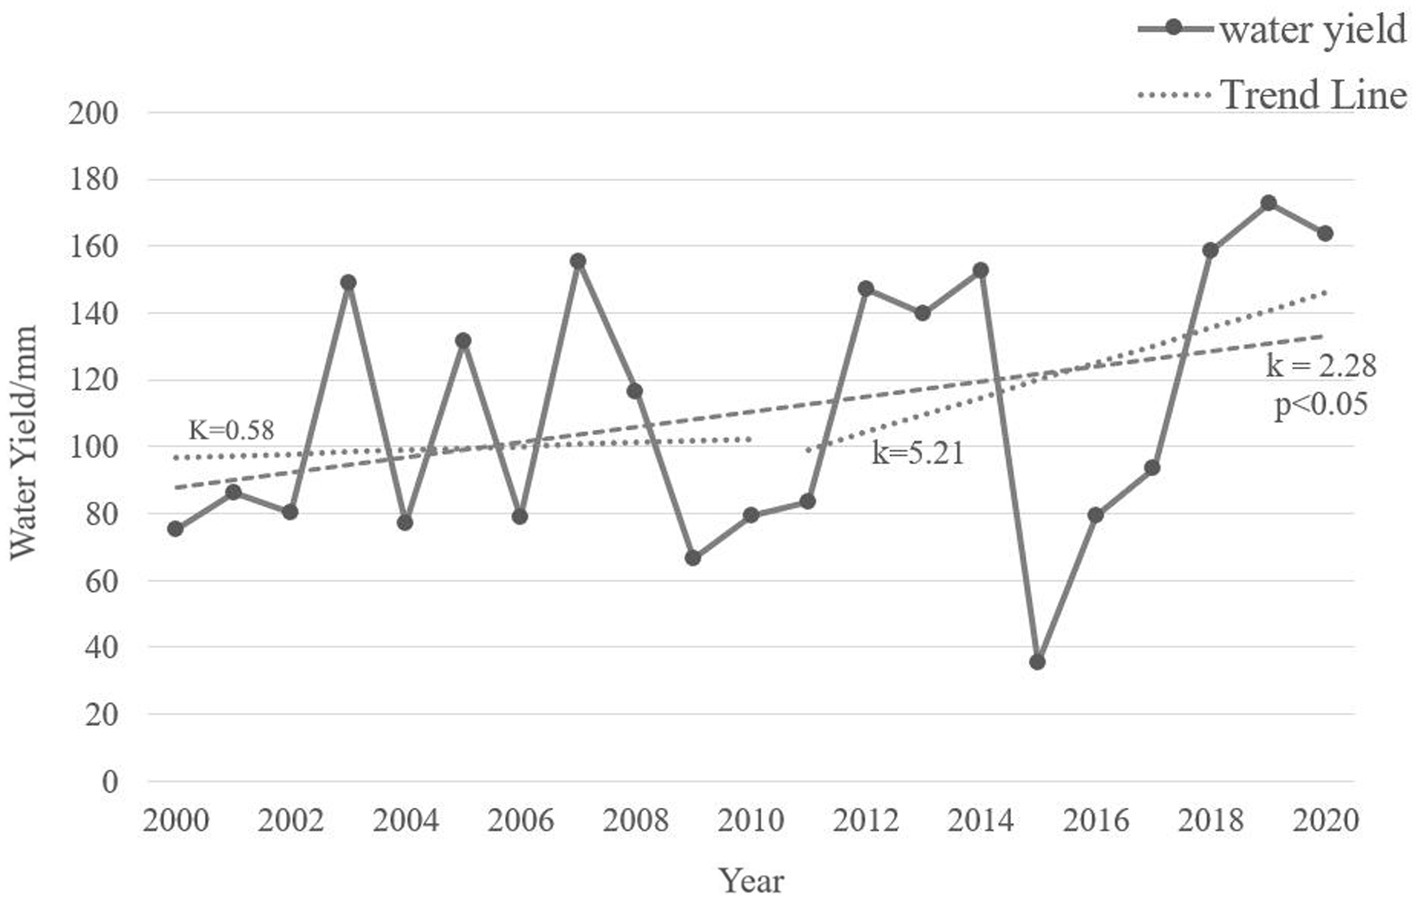
Figure 3. Inter-annual changes of WYs in AEGC from 2000 to 2020. The black solid line is the WYs, and the dotted line is the change trend of WYs.
Based on the spatial distribution characteristics of the multi-year average WYs in AEGC from 2000 to 2020 (Figure 4A), the WYs have obvious spatial differentiation. The overall WYs are high in the south, low in the north, and high in the northwest. High-value areas with WYs exceeding 300 mm are primarily concentrated in the south and northwest of the AEGC, and the low-value areas with WYs below 100 mm are mainly distributed in the north and northeast of the AEGC. In terms of subregions, there were significant differences in WYs among districts and counties (Figure 4B). The average annual WYs of Jingtai was the lowest (1.54 mm), and Hezuo was the highest (295.41 mm). The average WYs of all units were divided into 5 categories using the ArcGIS10.5 natural breaking point method. The spatial distribution of the units with low WYs formed a regional cluster, with Jingyuan at the center. The spatial distribution of high WYs units in the south is centered around Zhuoni.
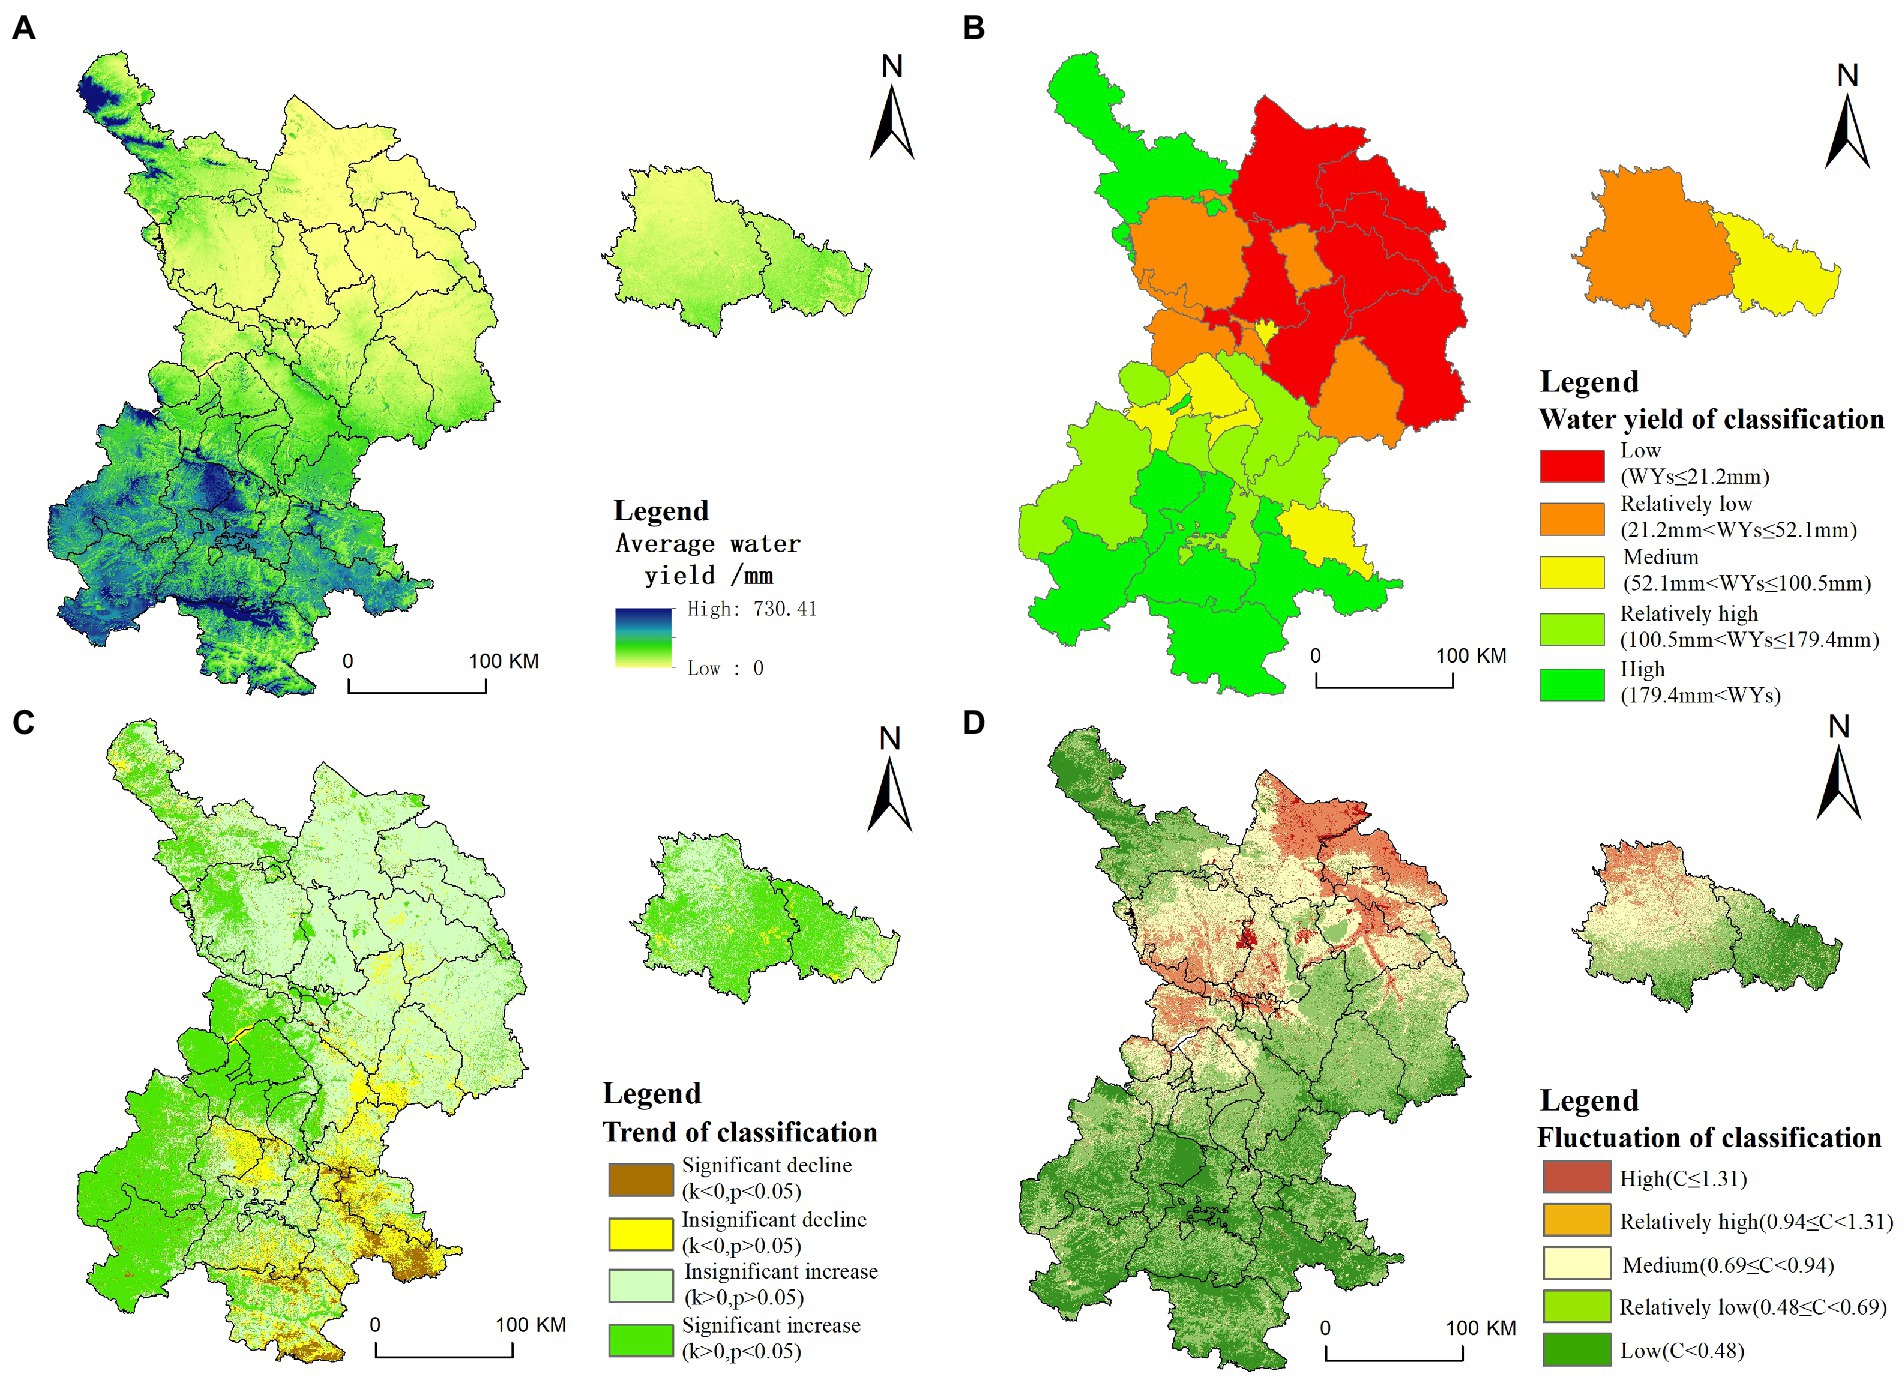
Figure 4. Spatial distribution characteristics and change rules of WYs. It shows the spatial distribution of the average WYs from 2000 to 2020 (A), and the statistics of WYs based on the county-level administrative units (B). Due to the large interannual variation of WYs, in order to intuitively display the spatial regularity of WYs over a long period of time, we have carried out trend analysis (C) and coefficient of variation calculation (D).
According to the results of the change trend analysis, the change trends of WYs in AEGC are divided into 4 categories (Figure 4C). Areas with insignificant increases in WYs account for the largest proportion (57.18%) and are widely distributed in the middle and north of the AEGC. The significantly increased area was concentrated in the southwest and northeast of the AEGC (24.29%). Only in the southeast, WYs showed a downward trend (5.22%). Using the ArcGIS10.5 natural breaking point method, the WYs fluctuations in AEGC were divided into five categories (Figure 4D). WYs fluctuations are higher in the north, lower in the south, and higher along the Yellow River. Areas with high WYs fluctuations are concentrated in the Lanzhou New District and the Yellow River Valley and account for 3.82% of the AEGC. The relatively low fluctuation and low fluctuation areas are widely distributed in the southern, central-eastern, and northwestern parts of the AEGC, accounting for 49.17 and 18.53% of the AEGC, respectively.
The driving factors of WYs have always been the focus of relevant research. In this study, based on the establishment of a comprehensive database including human activity factors and natural condition factors, the RF was applied to evaluate the relative importance of these factors. According to the results (Figure 5), Ranking of importance of independent variables: precipitation (1.57) > evapotranspiration (1.29) > temperature (1.12) > population density (1.10) > NPP (1.06) > land use intensity (1.02) > NDVI (0.83) > DEM (0.71) > economic density (0.68) > slope (0.51). Indicators with relative importance greater than 1 were selected for GTWR analysis.

Figure 5. The relative importance of the impact factors of WYs. The importance value has no substantive meaning and can be used for comparison.
The GTWR model reflects the intensity and difference of these effects through the different regression coefficients of the driving factors in each region. Table 2 shows the fitting results of the GTWR model on the driving intensity of WYs by various factors from 2000 to 2020. Precipitation has a significant positive driving effect on WYs in AEGC (Figure 5), and the driving strength increases from the northeast to the south and northwest. The actual evapotranspiration negatively affects WYs (Figure 5). The driving intensity increases from the northeast to the south, and the actual evapotranspiration in the southeast most clearly inhibits the southeast WYs. The impact of temperature on WYs in the central and eastern regions showed a negative effect, and in the western region, it showed a positive effect, especially in the northwest region (Figure 5). The inhibition of population density on WYs is strong in the middle AEGC (Figure 5). NPP inhibits WYs in the south and northwest and promotes WYs in the northeast (Figure 5). Land-use intensity has a significant negative driving effect on WYs (Figure 5), especially in the south and northwest.

Table 2. Result of GTWR model.
The time axis of the GTWR model was adjusted to fit the driving intensity of various factors on WYs in stages from 2000 to 2010 and 2011 to 2020. The dominant driving factors in different regions in each stage were then identified (Figure 6). The area of WYs driven by precipitation is the largest (54.7%). Evapotranspiration inhibits WYs in the southeast. The low WYs in the northern part of AEGC are negatively driven by temperature. WYs in Lanzhou was negatively driven by population density. WYs in the northeast region are positively driven by NPP. WYs was inhibited by land use intensity in northwest AEGC. Table 3 shows that the WYs area driven by population density and temperature increases significantly, while the WYs area driven by precipitation and actual evapotranspiration decreases significantly. From the dynamic point of view, the population density driven WYs area growth rate is the highest, and the land use intensity and temperature driven WYs area growth rate is more than 10%. These results indicate that human activities have an increasingly significant influence on WYs in local areas (see Figure 7).
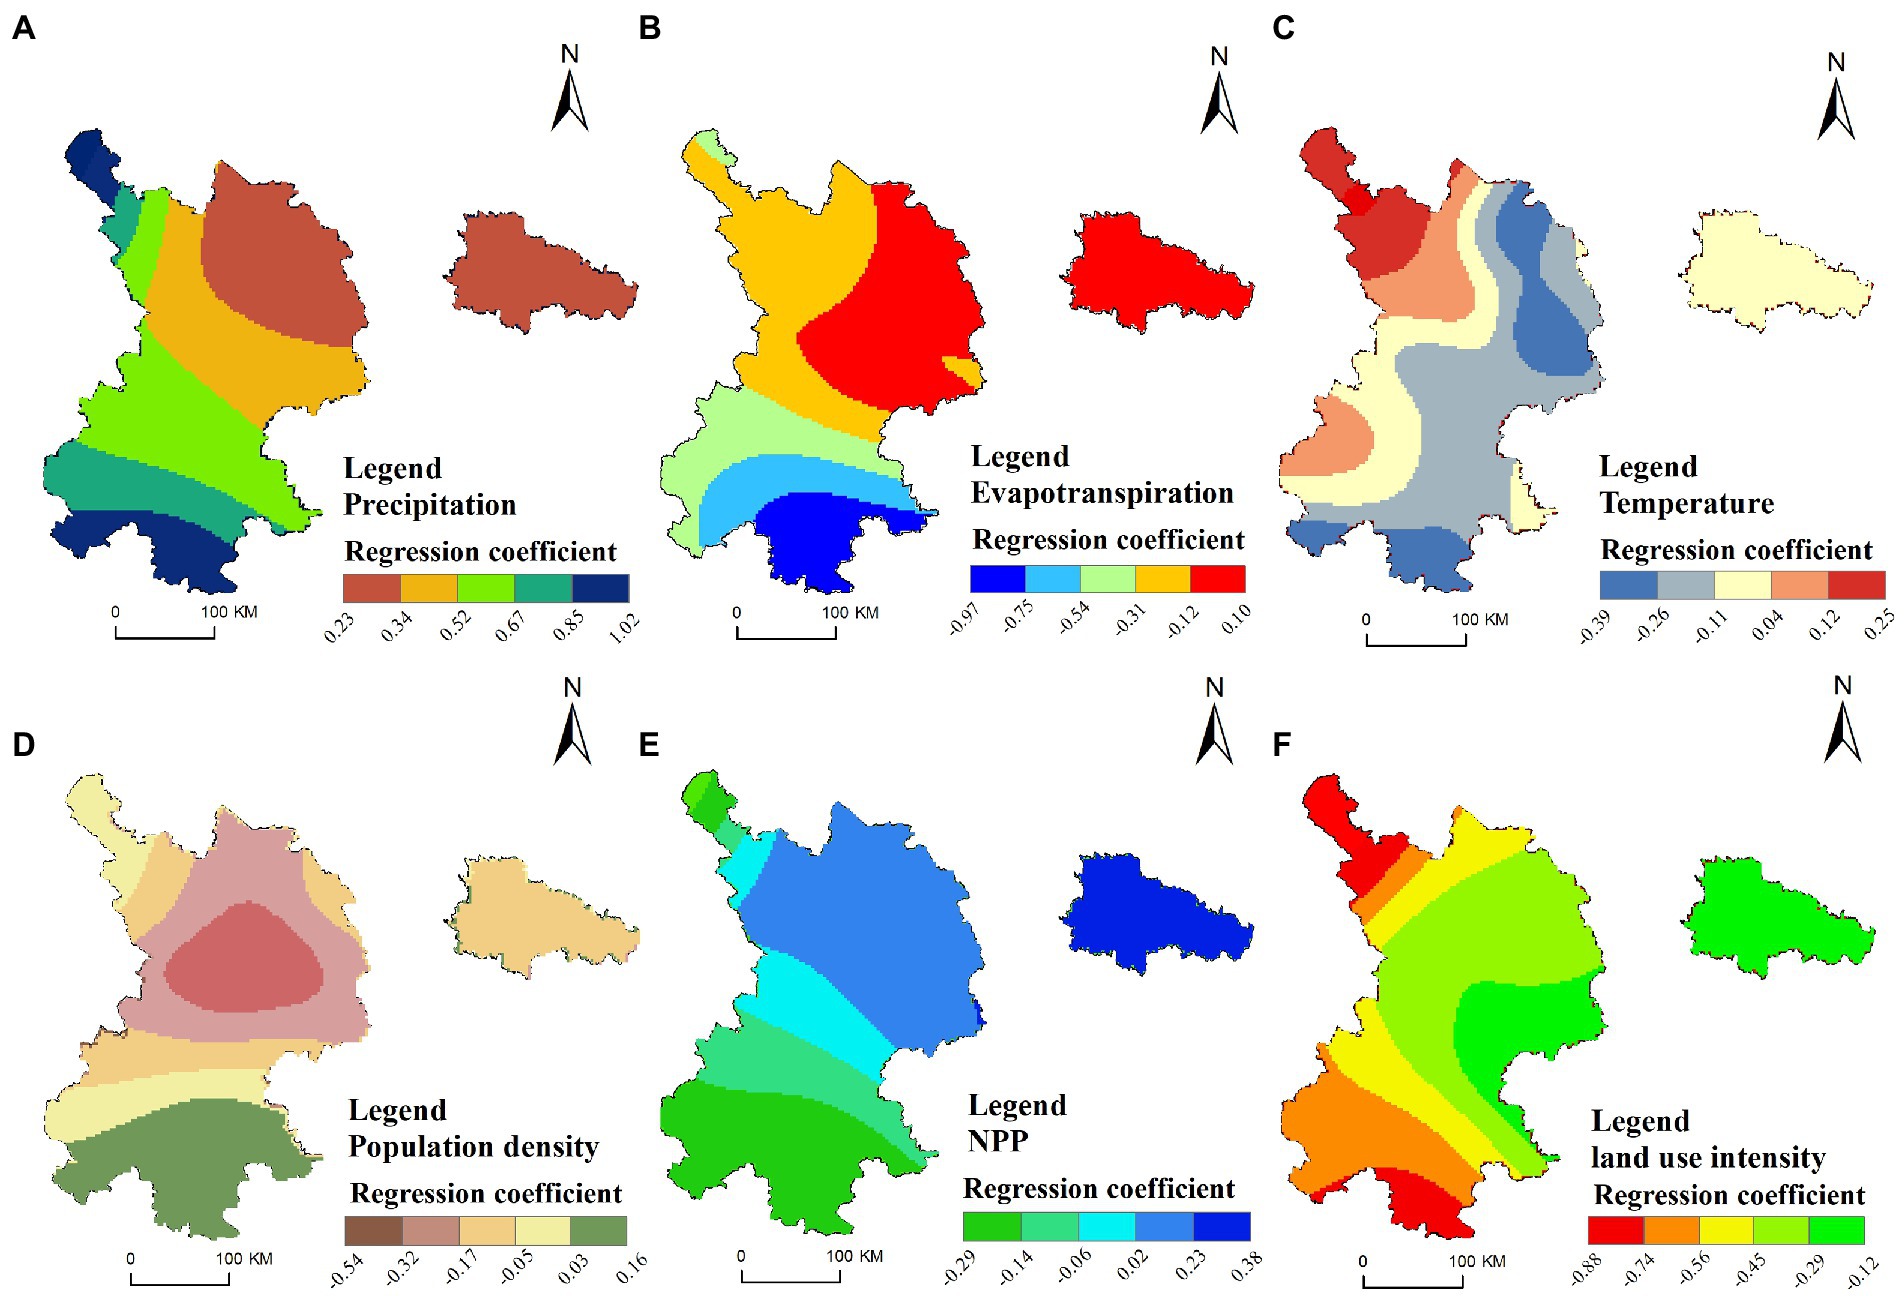
Figure 6. The spatial characteristics of the main influencing factors on WYs. The factors are listed in order of relative importance (A–F).
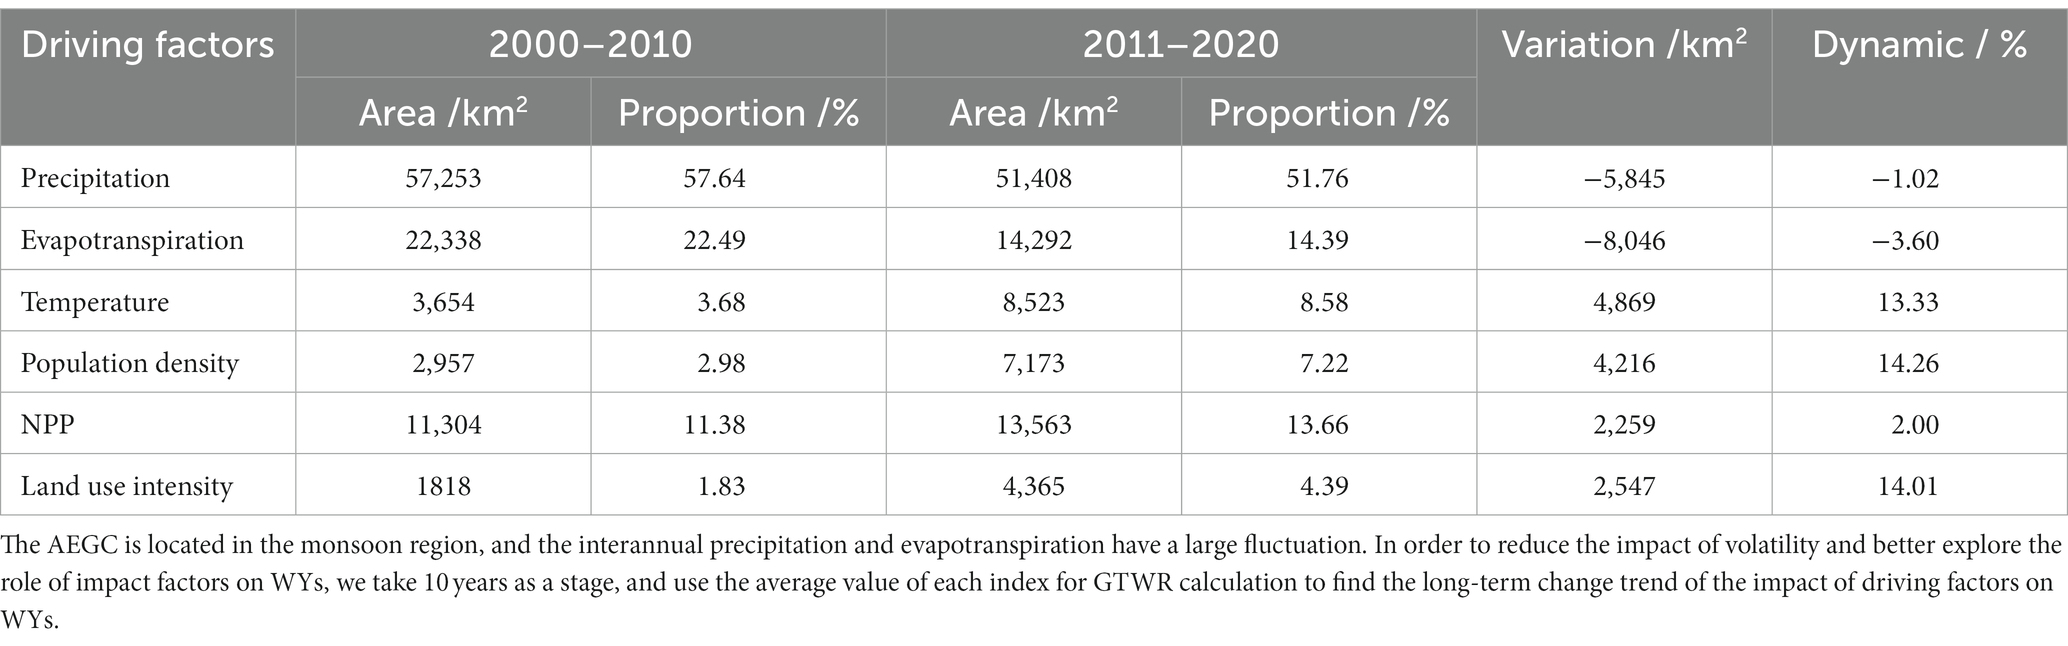
Table 3. Summary of control area of the main impact factors of WYs.
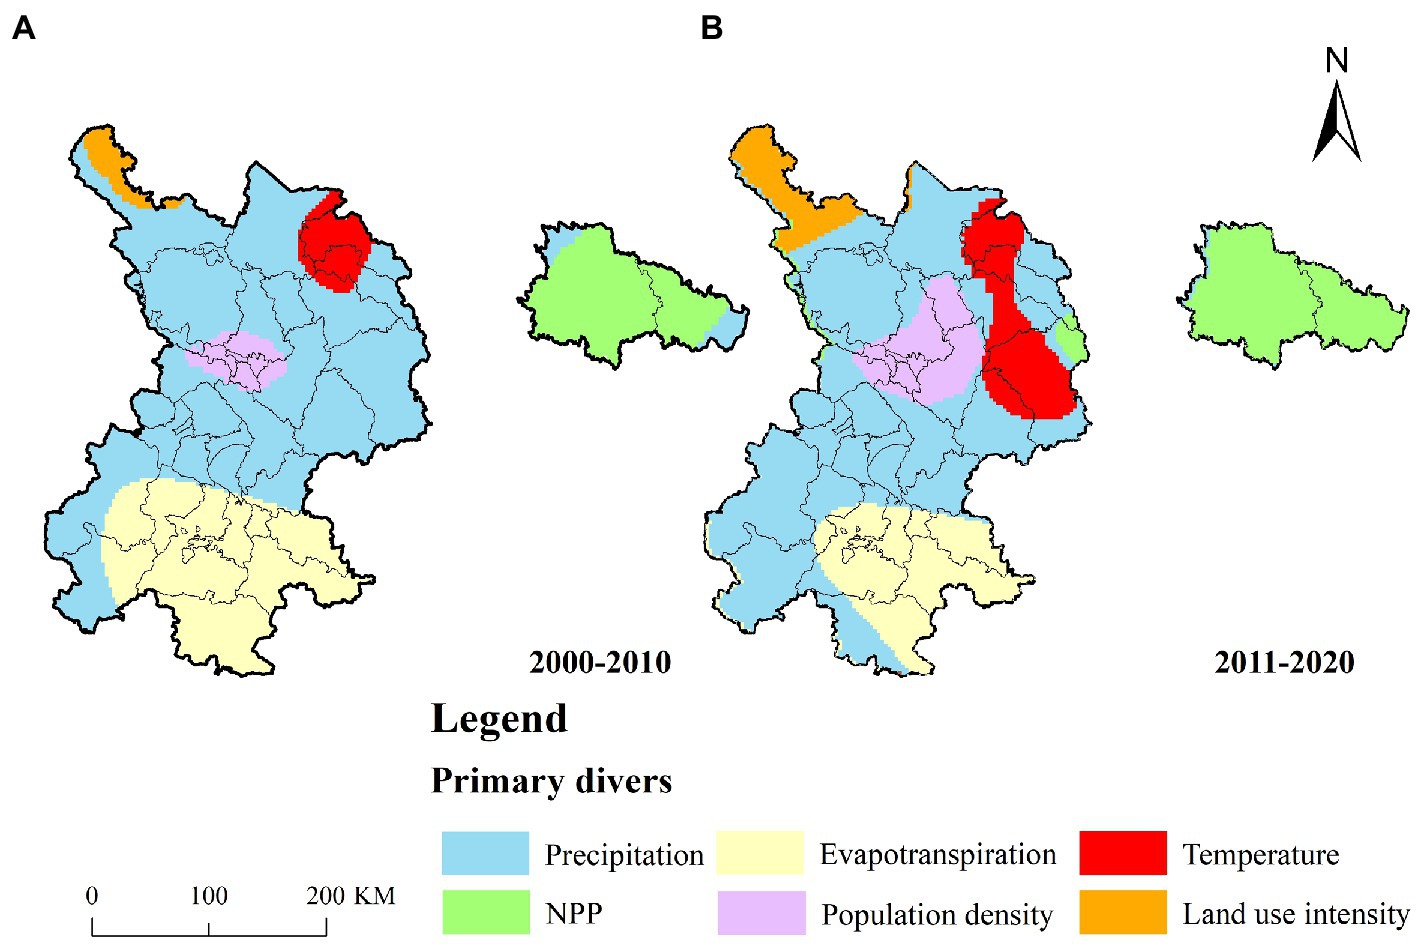
Figure 7. Spatially identify the first influencing factor of WYs in each region. Taking 10 years as a stage, the rule changes of each type of influencing factors on WYs were discussed. (A, B) are the spatial distribution of the dominant active factors for WYs in 2000–20010 and 2011–2020, respectively.
Based on the interannual variation of WYs in AEGC, WYs was lowest in 2015 and highest in 2019 Since 2010, the overall WYs of AEGC has been on the rise. Meteorological research shows (Lai, 2012; Wang et al., 2016; Lu et al., 2021; Yang et al., 2021) that 2015 was a strong El Niño year with little precipitation in eastern Gansu. In 2019, precipitation significantly increased in the AEGC, and precipitation in the eastern part of Northwest China showed an upward trend. Consistent changes of precipitation and WYs (Dai et al., 2020). This study demonstrates that the area where precipitation dominated WYs was the largest, accounting for 52.59% of the AEGC. Overall, after analyzing regions with different WYs levels, precipitation was the most important factor affecting WYs.
Evapotranspiration, an important parameter to quantify WYs, combines water and energy balances and links the climate system to terrestrial ecosystems (Li et al., 2016; McEvoy et al., 2016; Zhang et al., 2020). In the southeastern AEGC with higher WYs, evapotranspiration is the dominant driver. This is because in areas with high WYs, WYs and evapotranspiration levels are in the same order of magnitude, meaning that WYs are sensitive to changes in evapotranspiration (Dai et al., 2020; Dai and Wang, 2020; Zhang Y. et al., 2021; Zhang J. et al., 2021; Jiang et al., 2022). However, in areas with low WYs, evapotranspiration is several times higher than WYs, and interannual changes in evapotranspiration could be greater than the average annual WYs (Zeng et al., 2022). Therefore, WYs is not sensitive to evapotranspiration response.
The effect of temperature on WYs shows positive and negative bidirectionality. In the northern AEGC of low WYs, temperature inhibits the rapid growth of WYs area. This because warming and drying of the drylands in recent decades, most notably in the current decade (Daramola and Xu, 2022; Yang et al., 2022). The increase of surface temperature leads to increase of precipitation intensity in the Tibetan plateau, especially for convective precipitation (Zhao et al., 2022). Therefore, temperatures are positive effecting WYs positively in the western AEGC.
This study found that NPP could positively drive WYs in fragile ecological areas with an average NPP of less than 200 gc/m2, which is in addition to the previous conclusions (Yin et al., 2020). This might be directly related to the nature reserve construction projects and the Conversion of Cropland to Forest Project, projects had the climate and water conservation effects (Liu et al., 2020; Qu et al., 2020). However, in areas experiencing water shortages, such as the Loess Plateau, it is necessary to simulate and evaluate the water consumption of vegetation restoration projects to ensure that the ecological water demand matches local water resources, thereby avoiding construction that further stresses local water resources (Xin and Jérôme, 2019).
In the densely populated Lanzhou-Baiyin urban agglomeration, human density significantly inhibited WYs, and the area with strong inhibitory effect increased by 142.6%. China has witnessed unprecedented urbanization during the last three decades, with 901.99 million people (i.e., 63.89% of its population) living in urban areas in 2020 (NBSC, 2020). Undoubtedly, human activity and urban expansion has emerged as a highly significant driver of regional climate change (Griggs et al., 2013; Nagendra et al., 2018). The urban, characterized by high heat-storage capacity, impediments to atmospheric motion, and increased solar radiation absorption, greatly alter the surface energy budget and hydrological cycle, resulting in profound changes of WYs (Grimm et al., 2008; Georgescu, 2015; Jiang et al., 2022).
Land use is one of the most important and lasting ways that humans affect the natural environment and affects the hydrological processes of an ecosystem (Zhu and Woodcock, 2014; Pan et al., 2021; Fang et al., 2022). Land-use intensity significantly negatively affects areas with high WYs because there are significant differences in soil water content, evapotranspiration capacity, litter water holding capacity, and canopy interception among different land-use types (Rutter et al., 1971; Gash, 1979). The higher the land-use intensity, the lower the WYs. The south and northwest of the AEGC have high WYs and are important water conservation areas in the upper reaches of the Yellow River. At the same time, there is low land-use intensity in these areas, which are primarily grassland and forest land and are sensitive to land-use changes (Yang et al., 2018; Xia et al., 2022). Therefore, economic development must be balanced with ecosystem conservation, particularly in water conservation areas with high WYs. Land use should be strictly controlled, full use should be made of existing construction land, and land-use efficiency should be improved, to avoid the decrease in WYs caused by the transformation of ecological land and agricultural land to construction land.
By studying the spatiotemporal heterogeneity and evolution of the factors driving WYs, we found that large-scale regional nature conditions are the primary force driving changes in WYs (Su and Fu, 2013; Wang J. et al., 2021; Wang X. et al., 2021; Jia et al., 2022), while in small-scale regions, human activities and land use are primary forces altering WYs (Rohatyn et al., 2018; Hu et al., 2020; He et al., 2021).
There are certain uncertainties when evaluating WYs. The spatial distribution of meteorological data is affected by factors such as the meteorological stations and interpolation methods; in mountainous areas with vertical effects, the interpolation method will increase uncertainty (Guo et al., 2020; MacDonald et al., 2020). Future research can produce more accurate results by increasing the amount of data and comparing various interpolation methods. While climate and anthropogenic factors are included, the internal relationship between these factors has not been systematically explored (Wang et al., 2016, 2022; Dai et al., 2020, 2022; Cui et al., 2021), which is an area worthy of further research. Research on multi-scale spatial differentiation is the focus of current geographic research, while the spatial differentiation attributes of WYs should be studied at different scales to better reveal the factors influencing WYs spatial differentiation. Climate changing (Jiao K. et al., 2021; Jiao W. et al., 2021) will increase precipitation in Northwest China, also will increase the probability of sudden drought events (Yang et al., 2021; Gong et al., 2022). Therefore, fluctuations in precipitation and temperature increase will likely continue to negatively impact WYs and ecosystems, which is of significant concern.
This study explored the spatiotemporal distribution and driving mechanism of WYs in AEGC from 2000 to 2020. To achieve the goal, a comprehensive database of natural conditions and human activities affecting WYs has been built, and algorithms such as Invest model, RF model and GTWR model have been used. The main conclusions are as follows: (1) In recent 20 years, the average annual WYs of AEGC was 110.52 mm, and the interannual variation showed an upward trend, with an increasing rate of 2.28 mm/a (p < 0.05). WYs are high in the south, low in the north, and high in the northwest. Except for the southeast, WYs remained stable or increased in other regions. (2) The relative importance of the main influencing factors of WYs in AEGC successively were precipitation (1.57), evapotranspiration (1.29), temperature (1.12), population density (1.10), NPP (1.05) and land use intensity (1.02). (3) The variation trend of precipitation is consistent with that of WYs, which is the most important factor affecting the overall WYs in AEGC. In areas with low WYs, evapotranspiration is several times higher than WYs, so WYs is not sensitive to changes in evapotranspiration. Increased precipitation over the Tibet Plateau caused by rising temperatures promoted WYs in the west. Human activities in densely populated areas greatly changed the surface energy budget and hydrological cycle (Georgescu, 2015; Jiang et al., 2021), and the increase of land use intensity significantly inhibited WYs in water conservation areas. At the same time, ecological restoration projects can promote WYs. The results show that: (1) Large-scale regional nature conditions are the primary force driving change in WYs, while in small-scale regions (Feng et al., 2021), human activities and land use are the primary drivers of WYs. (2) The effects of the influencing factors on WYs showed significant spatiotemporal heterogeneity, and the responses of WYs to the changes of the influencing factors were different in different regions.
The original contributions presented in the study are included in the article/supplementary material, further inquiries can be directed to the corresponding author.
JL and JW designed research. GL performed research. WM, YaL, and YuL modified paper. JL and GL wrote the paper. All authors have read and agreed to the published version of the manuscript.
This research was funded by the Key Research and Development Program of Gansu Province (22YF7FA116); Financial Special Project of Gansu Province (GSCZZ 20160909); Key Research and Development Program of Gansu Province (20YF8NA135); Higher Education Industry Support Project of Gansu Province (2021CYZC-15).
We would like to thank all the people who were involved in the field and laboratory work.
The authors declare that the research was conducted in the absence of any commercial or financial relationships that could be construed as a potential conflict of interest.
All claims expressed in this article are solely those of the authors and do not necessarily represent those of their affiliated organizations, or those of the publisher, the editors and the reviewers. Any product that may be evaluated in this article, or claim that may be made by its manufacturer, is not guaranteed or endorsed by the publisher.
Ahmed, Z., Zhang, B., and Cary, M. (2021). Linking economic globalization, economic growth, financial development, and ecological footprint: evidence from symmetric and asymmetric ARDL. Ecol. Indic. 121:107060. doi: 10.1016/j.ecolind.2020.107060
Arabameri, A., Pradhan, B., and Rezaei, K. (2019). Gully erosion zonation mapping using integrated geographically weighted regression with certainty factor and random forest models in GIS. J. Environ. Manag. 232, 928–942. doi: 10.1016/j.jenvman.2018.11.110
Belay, A., Demissie, T., Recha, J. W., Oludhe, C., Osano, P. M., Olaka, L. A., et al. (2021). Analysis of climate variability and trends in southern Ethiopia. Climate 9:96. doi: 10.3390/cli9060096
Chen, H., Liu, L., Fang, J., Li, C., Wang, L., Quan, Q., et al. (2022). Spatio-temporal analysis of the coupling relationship between urbanization and eco-environment in backward regions of China. Environ. Sci. Pollut. Res. 29, 7406–7423. doi: 10.1007/s11356-021-16240-z
Chung, M. G., Frank, K. A., Pokhrel, Y., Dietz, T., and Liu, J. (2021). Natural infrastructure in sustaining global urban freshwater ecosystem services. Nat Sustain. 4, 1068–1075. doi: 10.1038/s41893-021-00786-4
Costanza, R., d'Arge, R., de Groot, R., Farber, S., Grasso, M., Hannon, B., et al. (1997). The value of the world's ecosystem services and natural capital. Nature 387, 253–260. doi: 10.1038/387253a0
Cui, F., Wang, B., Zhang, Q., Tang, H., de Maeyer, P., Hamdi, R., et al. (2021). Climate change versus land-use change——what affects the ecosystem services more in the forest-steppe ecotone? Sci. Total Environ. 759:143525. doi: 10.1016/j.scitotenv.2020.143525
Dai, E., and Wang, Y. (2020). Attribution analysis for water yield service based on the geographical detector method: a case study of the Hengduan Mountain region. J. Geogr. Sci. 30, 1005–1020. doi: 10.1007/s11442-020-1767-y
Dai, X., Wang, L., Huang, C., Fang, L., Wang, S., and Wang, L. (2020). Spatio-temporal variations of ecosystem services in the urban ag-glomerations in the middle reaches of the Yangtze River. China. Ecol. Indicat. 115:106394. doi: 10.1016/j.ecolind.2020.106394
Dai, X., Wang, L., Yang, L., Wang, S., Li, Y., and Wang, L. (2022). Predicting the supply–demand of ecosystem services in the Yangtze River middle reaches urban agglomeration. Progr. Phys. Geogr. Earth Environ. 46, 530–546. doi: 10.1177/03091333221074490
Daramola, M. T., and Xu, M. (2022). Recent changes in global dryland temperature and precipitation. Int. J. Climatol. 42, 1267–1282. doi: 10.1002/joc.7301
Fang, Z., Ding, T., Chen, J., Xue, S., Zhou, Q., Wang, Y., et al. (2022). Impacts of land use/land cover changes on ecosystem services in ecologically fragile regions. Sci. Total Environ. 831:154967. doi: 10.1016/j.scitotenv.2022.154967
Feng, Z., Jin, X., Chen, T., and Wu, J. (2021). Understanding trade-offs and synergies of ecosystem services to support the decision-making in the Beijing-Tianjin-Hebei region. Land Use Policy 106:105446. doi: 10.1016/j.landusepol.2021.105446
Gash, J. H. C. (1979). An analytical model of rainfall interception by forests. Q. J. R. Meteorol. Soc. 105, 43–55. doi: 10.1002/qj.49710544304
Georgescu, M. (2015). Challenges associated with adaptation to future urban expansion. J. Clim. 28, 2544–2563. doi: 10.1175/JCLI-D-14-00290.1
Gong, Z., Zhu, J., and Li, T. (2022). The features of regional flash droughts in four typical areas over China and the possible mechanisms. Sci. Total Environ. 827:154217. doi: 10.1016/j.scitotenv.2022.154217
Graham, N. T., Iyer, G., Hejazi, M. I., Kim, S. H., Patel, P., and Binsted, M. (2021). Agricultural impacts of sustainable water use in the United States. Sci. Rep. 11:17917. doi: 10.1038/s41598-021-96243-5
Greve, P., Kahil, T., Mochizuki, J., Schinko, T., Satoh, Y., Burek, P., et al. (2018). Global assessment of water challenges under uncertainty in water scarcity projections. Nat. Sustain. 1, 486–494. doi: 10.1038/s41893-018-0134-9
Griggs, D., Stafford-Smith, M., Gaffney, O., Rockström, J., Öhman, M. C., Shyamsundar, P., et al. (2013). Sustainable development goals for people and planet. Nature 495, 305–307. doi: 10.1038/495305a
Grimm, N. B., Faeth, S. H., Golubiewski, N. E., Redman, C. L., Wu, J., Bai, X., et al. (2008). Global change and the ecology of cities. Science 319, 756–760. doi: 10.1126/science.1150195
Guo, B., Zhang, J., Meng, X., Xu, T., and Song, Y. (2020). Long-term spatio-temporal precipitation variations in China with precipitation surface interpolated by ANUSPLIN. Sci. Rep. 10:81. doi: 10.1038/s41598-019-57078-3
Hamel, P., and Guswa, A. J. (2015). Uncertainty analysis of a spatially explicit annual water-balance model: case study of the cape fear basin, North Carolina. Hydrol. Earth Syst. Sci. 19, 839–853. doi: 10.5194/hess-19-855-2015
He, Q., and Huang, B. (2018). Satellite-based high-resolution PM 2.5 estimation over the Beijing-Tianjin-Hebei region of China using an improved geographically and temporally weighted regression model. Environ. Pollut. 236, 1027–1037. doi: 10.1016/j.envpol.2018.01.053
He, F., Jin, J., Zhang, H., and Yuan, L. (2021). The change of ecological service value and the promotion mode of ecological function in mountain development using InVEST model. Arab. J. Geosci. 14:510. doi: 10.1007/s12517-021-06869-y
Hu, W., Li, G., Gao, Z., Jia, G., Wang, Z., and Li, Y. (2020). Assessment of the impact of the poplar ecological retreat project on water conservation in the Dongting Lake wetland region using the InVEST model. Sci. Total Environ. 733:139423. doi: 10.1016/j.scitotenv.2020.139423
Hu, W., Li, G., and Li, Z. (2021). Spatial and temporal evolution characteristics of the water conservation function and its driving factors in regional lake wetlands—two types of homogeneous lakes as examples. Ecol. Indic. 130:108069. doi: 10.1016/j.ecolind.2021.108069
Immerzeel, W. W., Lutz, A. F., Andrade, M., Bahl, A., Biemans, H., Bolch, T., et al. (2020). Importance and vulnerability of the world’s water towers. Nature 577, 364–369. doi: 10.1038/s41586-019-1822-y
Jia, G., Hu, W., Zhang, B., Li, G., Shen, S., Gao, Z., et al. (2022). Assessing impacts of the ecological retreat project on water conservation in the Yellow River Basin. Sci. Total Environ. 828:154483. doi: 10.1016/j.scitotenv.2022.1544836
Jiang, S., Liu, Y., Wang, M., Zhu, Y., Cui, H., Du, S., et al. (2023). Quantifying the impact of climate change and human activities on the eco-hydrological regimes of the Weihe River basin Northwest China. Hydrol. Res. 54, 49–64. doi: 10.2166/nh.2022.194
Jiang, W., Niu, Z., Wang, L., Yao, R., Gui, X., Xiang, F., et al. (2022). Impacts of drought and climatic factors on vegetation dynamics in the Yellow River Basin and Yangtze River basin. China. Remote Sens. 14:930. doi: 10.3390/rs14040930
Jiang, H., Sun, Z., Guo, H., Weng, Q., du, W., Xing, Q., et al. (2021). An assessment of urbanization sustainability in China between 1990 and 2015 using land use efficiency indicators. NPJ Urban Sustain. 1:34. doi: 10.1038/s42949-021-00032-y
Jiao, K., Gao, J., and Liu, Z. (2021). Precipitation drives the NDVI distribution on the Tibetan plateau while high warming rates may intensify its ecological droughts. Remote Sens. 13:1305. doi: 10.3390/rs13071305
Jiao, W., Wang, L., Smith, W. K., Chang, Q., Wang, H., and D’Odorico, P. (2021). Observed increasing water constraint on vegetation growth over the last three decades. Nat. Commun. 12:3777. doi: 10.1038/s41467-021-24016-9
Jung, M., Arnell, A., de Lamo, X., García-Rangel, S., Lewis, M., Mark, J., et al. (2021). Areas of global importance for conserving terrestrial biodiversity, carbon and water. Nat. Ecol. Evol. 5, 1499–1509. doi: 10.1038/s41559-021-01528-7
Kilama Luwa, J., Majaliwa, J.-G. M., Bamutaze, Y., et al. (2021). Variabilities and trends of rainfall, temperature, and river flow in Sipi sub-catchment on the slopes of Mt. Elgon, Uganda. Water 13:1834. doi: 10.3390/w13131834
Lai, Z. (2012). Was late marine isotope stage (MIS) 3 warm and humid in nowadays arid northwestern China? Quat. Int. 279-280:261. doi: 10.1016/j.quaint.2012.08.644
Li, S., Dong, B., Gao, X., Xu, H., Ren, C., Liu, Y., et al. (2022). Study on spatio-temporal evolution of habitat quality based on land-use change in Chongming Dongtan. China. Environ Earth Sci. 81:220. doi: 10.1007/s12665-022-10324-w
Li, Y., Liang, K., Bai, P., Feng, A., Liu, L., and Dong, G. (2016). The spatiotemporal variation of reference evapotranspiration and the contribution of its climatic factors in the loess plateau. China. Environ. Earth Sci. 75:354. doi: 10.1007/s12665-015-5208-7
Li, C., and Managi, S. (2021). Contribution of on-road transportation to PM2.5. Sci. Rep. 11:21320. doi: 10.1038/s41598-021-00862-x
Liu, M., Jia, Y., Zhao, J., Shen, Y., Pei, H., Zhang, H., et al. (2021). Revegetation projects significantly improved ecosystem service values in the agro-pastoral ecotone of northern China in recent 20 years. Sci. Total Environ. 788:147756. doi: 10.1016/j.scitotenv.2021.147756
Liu, Y., Lam, K. F., Wu, J. T., et al. (2018). Geographically weighted temporally correlated logistic regression model. Sci. Rep. 8:1417. doi: 10.1038/s41598-018-19772-6
Liu, Z., Wang, J., Wang, X., and Wang, Y. (2020). Understanding the impacts of “grain for green” land management practice on land greening dynamics over the loess plateau of China. Land Use Policy 99:105084. doi: 10.1016/j.landusepol.2020.105084
Lu, Y., Li, G., Yan, X., et al. (2021). Study on the change of precipitation in agro-pastoral ecotone of Gansu province from 1971 to 2019. Acta Agrestia Sinica. 29, 2556–2565. doi: 10.11733/j.issn.1007-0435.2021.11.022
Ma, T., Sun, S., Fu, G., Hall, J. W., Ni, Y., He, L., et al. (2020). Pollution exacerbates China’s water scarcity and its regional inequality. Nat. Commun. 11:650. doi: 10.1038/s41467-020-14532-5
MacDonald, H., McKenney, D. W., Papadopol, P., Lawrence, K., Pedlar, J., and Hutchinson, M. F. (2020). North American historical monthly spatial climate dataset, 1901–2016. Sci Data. 7:411. doi: 10.1038/s41597-020-00737-2
McEvoy, D. J., Huntington, J. L., Hobbins, M. T., Wood, A., Morton, C., Anderson, M., et al. (2016). The evaporative demand drought index. Part II: CONUS-wide assessment against common drought indicators. J. Hydrometeorol. 17, 1763–1779. doi: 10.1175/JHM-D-15-0122.1
Nagendra, H., Bai, X., Brondizio, E. S., and Lwasa, S. (2018). The urban south and the predicament of global sustainability. Nat. Sustain. 1, 341–349. doi: 10.1038/s41893-018-0101-5
NBSC. (2020). National bureau of statistics of China: China statistical yearbook 2020. Beijing: China Statistics Press.
Nie, J., Stevens, T., Rittner, M., Stockli, D., Garzanti, E., Limonta, M., et al. (2015). Loess plateau storage of northeastern Tibetan plateau-derived Yellow River sediment. Nat. Commun. 6:8511. doi: 10.1038/ncomms9511
Pan, T., Zuo, L., Zhang, Z., Zhao, X., Sun, F., Zhu, Z., et al. (2021). Impact of land use change on water conservation: a case study of Zhangjiakou in Yongding River. Sustainability. 13:22. doi: 10.3390/su13010022
Pei, H., Liu, M., Shen, Y., Xu, K., Zhang, H., Li, Y., et al. (2021). Quantifying impacts of climate dynamics and land-use changes on water yield service in the agro-pastoral ecotone of Northern China. Sci. Total Environ. 809:151153. doi: 10.1016/j.scitotenv.2021.151153
Peng, K., Jiang, W., Deng, Y., Liu, Y., Wu, Z., and Chen, Z. (2020). Simulating wetland changes under different scenarios based on integrating the random forest and CLUE-S models: a case study of Wuhan urban agglomeration. Ecol. Indic. 117:106671. doi: 10.1016/j.ecolind.2020.106671
Qiu, M., Zuo, Q., Wu, Q., Yang, Z., and Zhang, J. (2022). Water ecological security assessment and spatial autocorrelation analysis of prefectural regions involved in the Yellow River Basin. Sci. Rep. 12:5105. doi: 10.1038/s41598-022-07656-9
Qu, S., Wang, L., Lin, A., Yu, D., and Yuan, M. (2020). Distinguishing the impacts of climate change and anthropogenic factors on vegetation dynamics in the Yangtze River basin. China. Ecol. Indicat. 108:105724. doi: 10.1016/j.ecolind.2019.105724
Queiroz, C., Norström, A. V., Downing, A., Harmáčková, Z. V., de Coning, C., Adams, V., et al. (2021). Investment in resilient food systems in the most vulnerable and fragile regions is critical. Nat Food. 2, 546–551. doi: 10.1038/s43016-021-00345-2
Redhead, J. W., Stratford, C., Sharps, K., Jones, L., Ziv, G., Clarke, D., et al. (2016). Empirical validation of the InVEST water yield ecosystem service model at a national scale. Sci. Total Environ. 569-570, 1418–1426. doi: 10.1016/j.scitotenv.2016.06.227
Rohatyn, S., Rotenberg, E., Ramati, E., Tatarinov, F., Tas, E., and Yakir, D. (2018). Differential impacts of land use and precipitation on “ecosystem water yield”. Water Resour. Res. 54, 5457–5470. doi: 10.1029/2017WR022267
Rutter, A. J., Kershaw, K. A., Robins, P. C., and Morton, A. J. (1971). A predictive model of rainfall interception in forests,1Derivation of the model form observations in a plantation of Corsican pine. Agric. Meteorol. 9, 367–384. doi: 10.1016/0002-15719(71)90034-3
Sang, X., Guo, Q., Wu, X., Fu, Y., Xie, T., He, C., et al. (2019). Intensity and stationarity analysis of land use change based on CART algorithm. Sci. Rep. 9:12279. doi: 10.1038/s41598-019-48586-3
Son, N. T., Le Huong, H., Loc, N. D., et al. (2022). Application of SWAT model to assess land use change and climate variability impacts on hydrology of Nam rom catchment in northwestern Vietnam. Environ. Dev. Sustain. 24, 3091–3109. doi: 10.1007/s10668-021-01295-2
Su, C., and Fu, B. (2013). Evolution of ecosystem services in the Chinese loess plateau under climatic and land use changes. Glob. Planet. Chang. 101, 119–128. doi: 10.1016/j.gloplacha.2012.12.014
Wang, X., Chu, B., Feng, X., Li, Y., Fu, B., Liu, S., et al. (2021). Spatiotemporal variation and driving factors of water yield services on the Qingzang plateau. Geogr. Sustain. 2, 31–39. doi: 10.1016/j.geosus.2021.02.002
Wang, Y., Qian, X., Zhou, Y., and Chen, X. (2022). Spatial difference of Chinese public awareness of soil and water conservation and perception of information construction. Alex. Eng. J. 61, 8611–8623. doi: 10.1016/j.aej.2022.01.048
Wang, S., Wang, S., and Feng, J. (2016). Drought events and its influence in 2015 in China. J. Arid Meteorol. 34, 382–389. doi: 10.11755/j.issn.1006-7639(2016)-02-0382
Wang, J., Wu, T., Li, Q., Wang, S., et al. (2021). Quantifying the effect of environmental drivers on water conservation variation in the eastern loess plateau. China. Ecol. Indicat. 125:107493. doi: 10.1016/j.ecolind.2021.107493
Wu, J., Li, X., Luo, Y., and Zhang, D. (2021). Spatiotemporal effects of urban sprawl on habitat quality in the Pearl River Delta from 1990 to 2018. Sci. Rep. 11:13981. doi: 10.1038/s41598-021-92916-3
Wu, S., Wang, Z., Huang, B., et al. (2021). Geographically and temporally neural network weighted regression for modeling spatiotemporal non-stationary relationships. Int. J. Geogr. Inf. Sci. 35, 582–608. doi: 10.1080/13658816.2020.1775836
Xia, L., Bi, R., Song, X., Hu, W., Lyu, C. J., Xi, X., et al. (2022). Soil moisture response to land use and topography across a semi-arid watershed: implications for vegetation restoration on the Chinese loess plateau. J. Mt. Sci. 19, 103–120. doi: 10.1007/s11629-021-6830-3
Xia, H., Kong, W., Zhou, G., and Sun, O. J. (2021). Impacts of landscape patterns on water-related ecosystem services under natural restoration in Liaohe River reserve. China. Sci. Total Environ. 792:148290. doi: 10.1016/j.scitotenv.2021.148290
Xia, L., Song, X., Fu, N., Meng, C. F., Li, H. Y., and Li, Y. L. (2017). Impacts of precipitation variation and soil and water conservation measures on runoff and sediment yield in the loess plateau gully region. China. J. Mt. Sci. 14, 2028–2041. doi: 10.1007/s11629-016-4173-2
Xin, W., and Jérôme, T. (2019). Spatiotemporal analysis of water-related ecosystem services under ecological restoration scenarios: a case study in northern Shaanxi. China. Sci. Total Environ. 720:137477. doi: 10.1016/j.scitotenv.2020.137477
Yang, Z., Gao, J., Zhou, C., Shi, P., Zhao, L., Shen, W., et al. (2011). Spatio-temporal changes of NDVI and its relation with climatic variables in the source regions of the Yangtze and yellow rivers. J. Geogr. Sci. 21, 979–993. doi: 10.1007/s11442-011-0894-x3
Yang, B., Ochuodho, T. O., and Jian, Y. (2019). Impact of land use and climate change on water-related ecosystem services in Kentucky, USA. Ecol. Indic. 102, 51–64. doi: 10.1016/j.ecolind.2019.01.079
Yang, J., Zhang, Q., Lu, G., Liu, X., Wang, Y., Wang, D., et al. (2021). Climate transition from warm-dry to warm-wet in eastern Northwest China. Atmos. 12:548. doi: 10.3390/atmos12050548
Yang, Z., Zhang, Q., Zhang, Y., Yue, P., Zhang, L., Zeng, J., et al. (2022). Hydrothermal factors influence on spatial-temporal variation of evapotranspiration-precipitation coupling over climate transition zone of North China. Remote Sens. 14:1448. doi: 10.3390/rs14061448
Yang, S., Zhao, W., Liu, Y., Wang, S., Wang, J., and Zhai, R. (2018). Influence of land use change on the ecosystem service trade-offs in the ecological restoration area: dynamics and scenarios in the Yanhe watershed. China. Sci. Total Environ. 644, 556–566. doi: 10.1016/j.scitotenv.2018.06.348
Yao, G., Li, H., Wang, N., Zhao, L., du, H., Zhang, L., et al. (2022). Spatiotemporal variations and driving factors of ecological land during urbanization—a case study in the Yangtze River’s lower reaches. Sustainability. 14:4256. doi: 10.3390/su14074256
Yin, G., Wang, X., Zhang, X., Fu, Y., Hao, F., and Hu, Q. (2020). InVEST model-based estimation of water yield in North China and its sensitivities to climate variables. Water 12:1692. doi: 10.3390/w12061692
Yin, L., Wang, X., Zhang, K., et al. (2019). Trade-offs and synergy between ecosystem services in National Barrier Zone. Geogr. Res. 38, 2162–2172. doi: 10.11821/dlyj020180578
Zeng, S., Du, H., Xia, J., et al. (2022). Attributions of evapotranspiration and gross primary production changes in semi-arid region: a case study in the water source area of the Xiong’an new area in North China. Remote Sens. 14:1187. doi: 10.3390/rs14051187
Zhang, P., Ao, H., Dekkers, M., Li, Y., and An, Z. (2016). Late Oligocene–early Miocene magnetochronology of the mammalian faunas in the Lanzhou Basin–environmental changes in the NE margin of the Tibetan plateau. Sci. Rep. 6:38023. doi: 10.1038/srep38023
Zhang, Y., Du, J., Guo, L., et al. (2021). Water conservation estimation based on time series NDVI in the Yellow River Basin. Remote Sens. 13:1105. doi: 10.3390/rs13061105
Zhang, J., Gao, G., Li, Z., Fu, B., and Gupta, H. V. (2020). Identification of climate variables dominating streamflow generation and quantification of streamflow decline in the loess plateau. China. Sci. Total Environ. 722:137935. doi: 10.1016/j.scitotenv.2020.137935
Zhang, Y., and Zhang, Y. (2018). Evaluation and management of forest water conservation services – taking Zhalantun City in Inner Mongolia, China as an example. J. Water Clim. Change. 9, 679–690. doi: 10.2166/wcc.2018.036
Zhang, J., Zhang, Y., and Liu, N. (2021). Climate variability masked greening effects on water yield in the Yangtze River basin during 2001-2018. Water Resour. Res. 58:e2021WR030382. doi: 10.1029/2021WR030382
Zhao, P., Xiao, H., Liu, J., and Zhou, Y. (2022). Precipitation efficiency of cloud and its influencing factors over the Tibetan plateau. Int. J. Climatol. 42, 416–434. doi: 10.1002/joc.7251
Keywords: water yield service, climate change, human activities, driving factors, agro-pastoral ecotone of Gansu China
Citation: Li J, Li G, Ma W, Wu J, Lu Y and Liang Y (2023) Significant spatiotemporal heterogeneity in drivers of water yield Service in Agro-pastoral Ecotone of Gansu, China. Front. Ecol. Evol. 11:1131463. doi: 10.3389/fevo.2023.1131463
Edited by:
Fujiang Hou, Lanzhou University, ChinaReviewed by:
Zhenshan Xue, Northeast Institute of Geography and Agroecology (CAS), ChinaCopyright © 2023 Li, Li, Ma, Wu, Lu and Liang. This is an open-access article distributed under the terms of the Creative Commons Attribution License (CC BY). The use, distribution or reproduction in other forums is permitted, provided the original author(s) and the copyright owner(s) are credited and that the original publication in this journal is cited, in accordance with accepted academic practice. No use, distribution or reproduction is permitted which does not comply with these terms.
*Correspondence: Guang Li, bGlnQGdzYXUuZWR1LmNu
Disclaimer: All claims expressed in this article are solely those of the authors and do not necessarily represent those of their affiliated organizations, or those of the publisher, the editors and the reviewers. Any product that may be evaluated in this article or claim that may be made by its manufacturer is not guaranteed or endorsed by the publisher.
Research integrity at Frontiers
Learn more about the work of our research integrity team to safeguard the quality of each article we publish.