 Peng Bun Ngor1,2*
 Sophorn Uy1,2
 Ratha Sor2,3
 Bunyeth Chan2,4
 Joseph Holway5
 Sarah E. Null6,7Nam So8Gaël Grenouillet9Sudeep Chandra10
 Zeb S. Hogan10Sovan Lek9
- 1Faculty of Fisheries and Aquaculture, Royal University of Agriculture, Phnom Penh, Cambodia
- 2Wonders of the Mekong Project, c/o Faculty of Fisheries and Aquaculture, Royal University of Agriculture, Phnom Penh, Cambodia
- 3Graduate School, Chea Sim University of Kamchaymear, Phnom Penh, Cambodia
- 4Faculty of Agriculture, Svay Rieng University, Svay Rieng, Cambodia
- 5School of Life Sciences, Arizona State University, Tempe, AZ, United States
- 6Department of Watershed Sciences, Utah State University, Logan, UT, United States
- 7Ecology Center, Utah State University, Logan, UT, United States
- 8Mekong River Commission, Vientiane, Laos
- 9CNRS, IRD, UMR5174 EDB (Laboratoire Evolution et Diversité Biologique), Université Toulouse III Paul Sabatier, Toulouse, France
- 10Department of Biology and Global Water Center, University of Nevada, Reno, NV, United States
Predictive models are widely used to investigate relationships between the distribution of fish diversity, abundance, and the environmental conditions in which they inhabit, and can guide management actions and conservation policies. Generally, the framework to model such relationships is established; however, which models perform best in predicting fish diversity and abundance remain unexplored in the Mekong River Basin. Here, we evaluated the performance of six single statistical models namely Generalized Linear Model, Classification and Regression Tree, Artificial Neural Network, k-Nearest Neighbor, Support Vector Machine and Random Forest in predicting fish species richness and abundance in the Lower Mekong Basin. We also identified key variables explaining variability and assessed the variable’s sensitivity in prediction of richness and abundance. Moreover, we explored the usefulness of an ensemble modeling approach and investigated if this approach improved model performance. Our results indicated that, overall, the six single statistical models successfully predicted the fish species richness and abundance using 14 geo-hydrological, physicochemical and climatic variables. The Random Forest model consistently out-performed all single statistical models for predicting richness (R2 = 0.85) and abundance (R2 = 0.77); whereas, Generalized Linear Model performed the worst of all models (R2 = 0.60 and 0.56 for richness and abundance). The most important predictors of variation in both richness and abundance included water level, distance from the sea and alkalinity. Additionally, dissolved oxygen, water temperature and total nitrate were important predictors of species richness, while conductivity was important for fish abundance. We found that species richness increased with increasing water level, dissolved oxygen and water temperature, but decreased with increasing distance from the sea, alkalinity and total nitrate. Fish abundance increased with conductivity, but decreased with increasing distance from the sea, water level and alkalinity. Finally, our results highlighted the usefulness of ensemble modeling (R2 = 0.90 and 0.85 for richness and abundance) for providing better predictive power than any of the six single statistical models. Our results can be used to support Mekong River management, particularly fisheries in the context of contemporary regional and global changes.
1. Introduction
In our fast-changing world, anthropogenic activities are putting freshwater ecosystems at risk by changing biodiversity pattern spatially and over time. Freshwater ecosystems are among the most vulnerable ecosystems on the planet (Allan et al., 2005; Ngor et al., 2018c; Ramsar Convention on Wetlands, 2018; Grill et al., 2019). In many regions, these spatial and temporal biodiversity changes go undocumented, and in these cases, research is urgently needed to document patterns and trends of biodiversity to improve conservation policies and management actions (Gaston and Blackburn, 1995; Darwall et al., 2018).
The Mekong Basin hosts an estimated 1,200 fish species (Rainboth, 1996) and at least 32 annelids, 38 crustaceans, 131 aquatic insects, and 146 mollusks (Köhler et al., 2012; Sor et al., 2020). Fish are important for ecological function and are key for the economic, sociocultural and food security of people inhabiting the basin (Poulsen et al., 2002; Hortle, 2007; Hortle and Bamrungrach, 2015). The Mekong River is one of the world’s biodiversity hotspots where livelihoods and food security of most people are derived from or closely related to riverine resources (MRC, 2003, 2010; Mittermeier et al., 2011; Allen et al., 2012; Sor et al., 2017a; Ngor et al., 2018e; Ng et al., 2020; Sor et al., 2020; Siriwut et al., 2021). Yet, the Mekong River is identified as one of the world’s regions that (i) has received little research on many aspects of its resources and ecology (Dudgeon, 2003; Sabo et al., 2017), (ii) faces increasing threats to water security and biodiversity (Hogan et al., 2004; Brooks et al., 2010; Mcintyre et al., 2010; Winemiller et al., 2016; Sabo et al., 2017; Ngor et al., 2018b,c), (iii) is home to a rapidly increasing population at risk of nutritional deficiencies (Golden et al., 2019) and (iv) has contentious trade-offs between economic growth and environmental degradation as a consequence of water-related development projects (Null et al., 2021).
Anthropogenic-caused disturbances facing the Mekong Basin and its fish resources are numerous. Forty-two hydropower dams are in operation, 29 are under construction and 76 planned along the Mekong River mainstream and its tributaries in the Lower Mekong Basin (LMB) (Ngor et al., 2018b; Soukhaphon et al., 2021). In addition, two mainstream hydropower dams (Xayaburi and Don Sahong) have been commissioned in the Mekong River mainstream in Laos, three more (Pak Beng, Luang Prabang and Pak Lay) have completed the Prior-Consultation Process and two more (Sanakham and Phou Ngoy) are being proposed (MRC website).1 Such changes and development inevitably disrupt longitudinal and lateral river connectivity, dampen flood pulses, mute flow seasonality and predictability (Poff et al., 2007; Ziv et al., 2012; Winemiller et al., 2016; Sabo et al., 2017; Ngor et al., 2018b,d; Barbarossa et al., 2020), degrade water quality (Oeurng et al., 2016; Chea et al., 2016a; Sor et al., 2021), and modify river morphology (Brunier et al., 2014). Combined with other human-induced stressors such as floodplain infrastructure development and pollution, overfishing, habitat loss (e.g., through deforestation and land use change) and warming temperature (Pokhrel et al., 2018; Ngor et al., 2018c; Arias et al., 2019; Lohani et al., 2020; Namkhan et al., 2020; Chan et al., 2020b), aquatic biodiversity is declining. To mitigate these adverse effects, it is crucial to better support the management and conservation planning of LMB fish biodiversity using statistical models to predict biodiversity change.
In recent years, significant attention has been directed toward understanding how environmental drivers influence spatial and temporal variation in fish abundance and fishery yields in the LMB. Hydrological parameters are key fish migration triggers and determinants of species diversity, abundance and fisheries productivity in the lower Mekong system (Baran et al., 2001a; Baran, 2006; Sabo et al., 2017; Ngor et al., 2018b,d; Chan et al., 2019). Also, spatial and temporal variation in fish assemblages are linked to river ecological gradients, physicochemical parameters such as water temperature, dissolved oxygen, pH, total phosphorus and total nitrate, as well as climatic factors such as precipitation and temperature (Chea et al., 2016b; Ngor et al., 2018a; Chan et al., 2020a). In other watersheds, geo-hydrological, physicochemical and land use/land cover variables are good predictors for determining fish assemblage structure such as species (relative) abundances and diversity, including in Chinese impounded lakes (Cheng et al., 2010, 2012; Guo et al., 2019), South Korea’s rivers (Kwon et al., 2012), European lakes and streams (Brosse et al., 1999; Grenouillet et al., 2011; Brucet et al., 2013) and in other natural lakes globally (Amarasinghe and Welcomme, 2002). Both descriptive (e.g., ordination methods) and predictive models using different sets of machine learning algorithms were applied in the above studies. Generally, statistical approaches to model such relationships are rich; however, it is poorly understood which models best predict the spatiotemporal variation in the diversity and abundances of multi-species fisheries in tropical river systems with high diversity like the Mekong.
Over the last decade, ensemble modeling has emerged as a powerful statistical modeling tool in ecology. Ensemble modeling is a technique used to reduce prediction uncertainty by combining the predictions of single statistical models (single-SMs) and averaging the prediction outputs. Previous studies reported that the performance of ensemble models is more robust and reliable than those of the single-SM, which commonly have varied and less reliable performance (Araújo and New, 2006; Grenouillet et al., 2011; Oppel et al., 2012; Guo et al., 2014). Application of the SMs in predicting continuous responses like species richness, abundance, density or biomass, is not as common as those predicting presence/absence responses. One reason for this may be that continuous data are difficult to predict and, in some cases, models provide unreliable predictions (Oppel et al., 2012). Some existing studies applying SMs to predict continuous responses included the use of generalized linear models (GLM) to predict butterfly abundance (Hodgson et al., 2015), classification and regression trees (CART) to predict macroinvertebrate richness and abundance (Boets et al., 2013), generalized additive models (GAM) to predict marine fish density (Young and Carr, 2015), multiple linear regression (MLR) and artificial neural networks (ANN) to predict fish abundance (Brosse et al., 1999). In the Mekong Basin, the utility of SMs to predict fish diversity and abundance has not been explored. In this system, the only existing implementation of SMs is for fish yield in the Tonle Sap River fishery using hydrological drivers (Sabo et al., 2017) and the presence/absence prediction of macroinvertebrates (Sor et al., 2017b). Here we present the first application of combined single-SMs and ensemble approach to assess the SMs’ performances based on fish species richness and abundance.
In this study, we use time-series of physicochemical, climatic and geo-hydrological data to predict fish species richness and abundance of multi-species assemblages in the LMB. This study uses six common single-SMs and an ensemble model to (i) demonstrate whether there is significant variation in predictive performances among single-SMs and the ensemble model, (ii) identify which technique provides the best performance for predicting fish species richness and abundance in the LMB; and (iii) identify key predictive variables that explain variability in species richness and abundance in the LMB. Our study does not attempt to improve the performances of each of the six statistical models by modifying or adding the model’s parameters (e.g., model’s quadratic effects), but to explore the basic performances of each model using default model specifications provided by the statistical package.
2. Materials and methods
2.1. Data collection
The data used in this study include monthly fish richness (number of species), fish abundance (number of individuals), water levels, water quality, climate and distance from the sea. Here we used both air and water temperature as model predictors to understand if the variability of fish richness and abundance is influenced by climate or water quality change. Fish richness and abundance, water level and water quality data were obtained from the long-term fish and environmental monitoring programs of the Mekong River Commission (MRC); climate data were derived from the Climatic Research Unit (Harris et al., 2020) at http://www.cru.uea.ac.uk/data, and distance from the sea measured from the point of zero-elevation to each fish sampling site was calculated using ArcGIS.
Fish data were collected using the MRC’s Fisheries Programme’s standard sampling protocols described in MRC (2007) and Ngor et al. (2016). We selected eight fish sampling sites in the LMB, including six sites in the lower Mekong mainstream, one site in the Tonle Sap River and one site in the Bassac River (Figure 1) from June 2007 to May 2014. The sampling sites were chosen because fish and environmental time-series datasets were regularly collected. At each site, three professional fishers participated in a daily fish sampling program supervised by the MRC National Line Fisheries Agencies with technical coordination by a regional fish monitoring specialist. Generally, the sampling sites were relatively unchanged over the study period, and gillnets (length: 120 ± 50 m, height: 2–3.5 m, mesh size: 3–12 cm, daily soak hours: 12 ± 2) were the most commonly used fishing gear to fish in riverine habitats and fish catches by species were recorded for the study (Ngor et al., 2018b). Captured fish were identified to species level and counted to estimate fish diversity and abundance in the LMB. Some 500 species (from 78 families) were recorded in the long-term MRC fish monitoring program, and among these, about 95% of the catch belonged to Cyprinidae (80%) and other common families included Pangasiidae, Cobitidae, Siluridae and Clupeidae (Ngor, 2018). We used a fish list containing ~900 species from the Mekong Fish Database (MFD, 2003) and fish species were further cross-checked with FishBase (Froese and Pauly, 2017) and other sources (Rainboth et al., 2012; Kottelat, 2013). Mean daily fish abundance data from three fishers at each site were aggregated to obtain the site’s total monthly fish abundance used in our study.
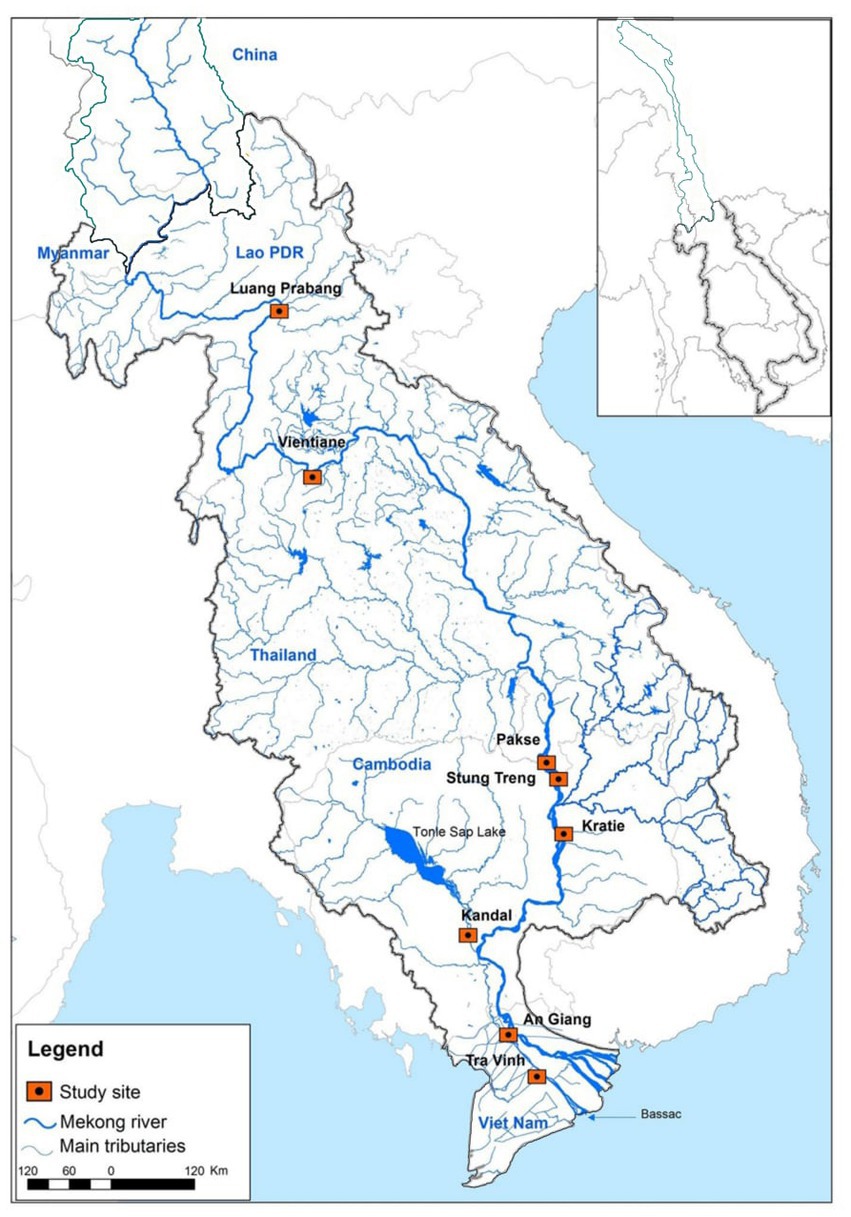
Figure 1. Study sites in the Lower Mekong Basin.
Water level and water quality data were monitored daily by the MRC in partnership with their member countries. We used hydrological and water quality monitoring stations that are closest to the eight fish monitoring sites and averaged daily data to monthly data. Water quality variables used in this study were water temperature, pH, dissolved oxygen, water conductivity, total nitrite and nitrate (hereafter referred to as total nitrate), ammonium, total phosphorus, alkalinity, total suspended solids and chemical oxygen demand. Protocols for water quality sampling, preservation protocols and data analysis were based on the 20th edition of the Standard Method for the Examination of Water and Wastewater (Clescerl et al., 1998) or the MRC standard (MRC, 2019). Mean air temperature was used in this study. All the predictive variables for the model are given in Table 1.
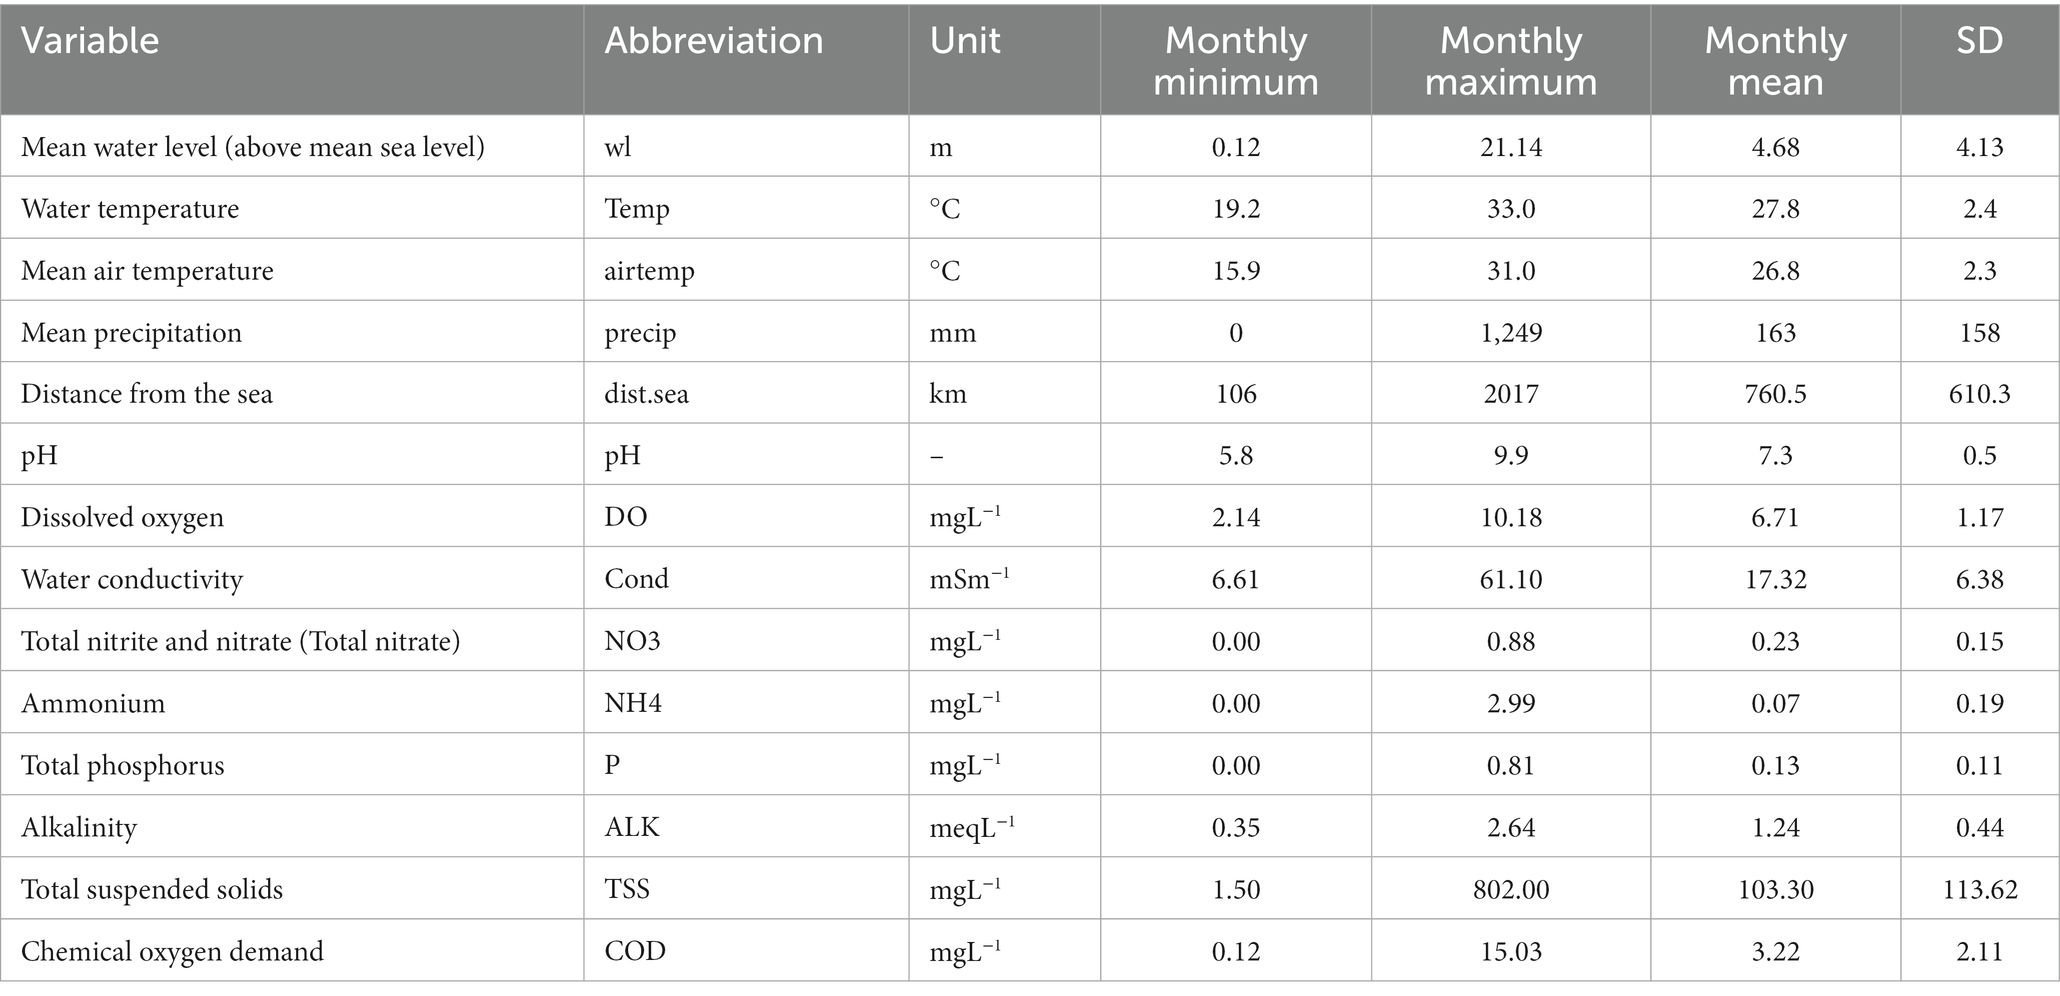
Table 1. Summary of predictive variables across the eight study sites in the Lower Mekong Basin.
2.2. Statistical model selection and preparation
The study used six common single-SMs namely Generalized Linear Model (GLM), Classification and Regression Tree (CART), Artificial Neural Networks (ANN), k-Nearest Neighbor (KNN), Support Vector Machine (SVM), and Random Forest (RF). Detailed information about each SM was described in Lek and Guegan (1999), Sor et al. (2017b), Van Echelpoel and Goethals (2018), and Guo et al. (2019). All of these models used the same dataset, and thus each model was affected by equal bias. Given that there were some missing values in our dataset, our final analysis included monthly data from 606 samples and 14 predictive variables, which we used to predict monthly fish richness and abundance in the LMB.
2.3. Model development and validation
Prior to developing the models, response variables were normalized between 0 and 1 to meet the requirement of modeling methods used in this study. Predictive variables were standardized to homogenize the relative strength of the predictors. The selected single-SMs were developed and validated using a k-fold cross-validation (CV) procedure. This procedure randomly splits the whole dataset into k non-overlapping folds, and then uses k-1 folds for the model development process and the remaining 1 fold for the validation. This process is repeated k times so that at the end, each of the folds is used once as the validation set. The k-fold cross-validation is a robust method that is commonly used to estimate the accuracy of models by averaging the k results to produce a single estimate for a model. The replication of the k-fold CV (15 replicates in our case) is often conducted to assure model performance stability. We used the 15-fold CV because the majority of model performance estimates were almost unbiased when k is between 10 and 20 folds (Kohavi, 1995). We also made three replicates of the 15-fold CV cross-validation (Figure 2). Consequently, we developed and validated a total of 45 statistical models for each of the six selected single-SMs in predicting both fish species richness and abundance in the LMB. In all, we built a total of 540 different statistical models for the six selected single-SMs (45 models × 6 single-SMs × 2) to predict fish richness and abundance in the LMB.
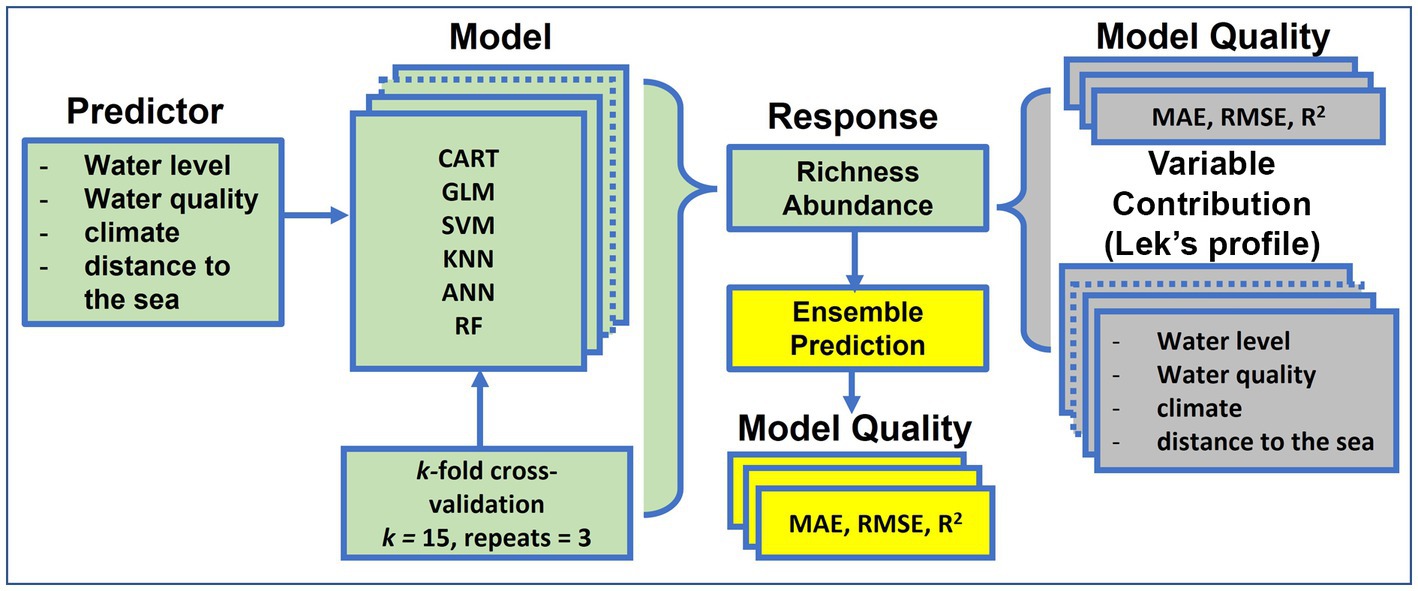
Figure 2. Process of single statistical model (single-SM) and ensemble model development on fish species richness and abundance in the Lower Mekong Basin. GLM, Generalized Linear Model; CART, Classification and Regression Tree; ANN, Artificial Neural Network; KNN, k-Nearest Neighbor; SVM, Support Vector Machine; RF, Random Forest. ‘Green’ background color indicates the single-SM inputs and responses, ‘grey’ shows the assessment of single SM model quality and ‘yellow’ shows ensemble predictions.
The predictions of all single-SMs in this study were performed using the ‘trainControl’ function, ‘method = repeatedcv’ of the ‘caret’ package (Kuhn, 2008) in the R programming language version 4.0.5 (R Core Team, 2021). This package streamlines the process of building predictive models. The process of all single-SM development and validation on fish richness and abundance is summarized in Figure 2.
2.4. Model performance
We used three model performance measures, namely Mean Absolute Error (MAE), Root Mean Squared Error (RMSE) and Coefficient of Determination (R2) to evaluate and compare the overall performance of all single-SMs. MAE tells the magnitude of an error we can expect from the forecast on average; whereas, RMSE shows the average distances between modeled and measured data (Moriasi et al., 2007; Guisan et al., 2013). R2 shows how well predictors explain the variation in response variables. The R2 values range from 0 to 1, where 1 represents perfect model fit. The optimal model is the one with the smallest value of MAE and RMSE and the highest value of R2. In addition, the ‘varImp’ function was applied on the fitted single-SMs to assess the relative importance of each predictor for each single-SM. Further, sensitivity analyses of GLM, ANN and RF response variables to key predictors were visualized using Lek’s profile method (Lek et al., 1995, 1996) computed with the ‘lekprofile’ function in the ‘NeuralNetTools’ package. Lek’s profile method explores the relationship between the outcome variable and a predictor of interest, while holding other predictors at constant values.
2.5. Statistical tests
Differences in performance measures among the models were tested using a non-parametric multiple comparison Kruskal Wallis rank sum test. To compare the difference in performance measures between models, pairwise Wilcox tests were used, with the pairewise.wilcox.test function of ‘stats’ package.
2.6. Ensemble prediction
The ensemble prediction is expected to provide robust results and improve the predictive performances when compared to any of the single-SM predictions (Grenouillet et al., 2011; Oppel et al., 2012; Guo et al., 2014). The approach is to average the outcome of multiple models by taking the mean. For this study, we therefore used the predicted results of the six single-SMs for both richness and abundance separately as the input for ensemble predictions. To perform the ensemble prediction, (i) ‘caretList’ function of ‘caretEnsemble’ package was applied to build a list of train objects (for all single-SMs) that is necessary to pass to the ensemble prediction; (ii) ‘caretStack’ function was employed to combine the outputs from all single-SMs to create the ensemble model from the list of train objects in (i). The values of MAE, RMSE, R2 were then extracted from the results of the ensemble prediction to assess models’ performances. All predictions and statistical analyses were performed using R language program version 4.0.5 (R Core Team, 2021).
3. Results
3.1. Species richness prediction
Overall, the six single-SMs performed well in predicting observed fish species richness using geo-hydrological, physicochemical and climatic data in the LMB, with median R2 values ranging between 0.63 for GLM and 0.85 for RF. The single-SM with the best performance was RF (Figure 3). The second-best performing single-SM was CART and the ranking was followed by SVM, ANN and KNN. GLM was the worst-performing model, with the lowest median R2 value and highest values of MAE and RMSE. The ensemble model representing the average of the six single-SMs performed best at predicting richness, with an R2 of 0.90, which was significantly better than other models.
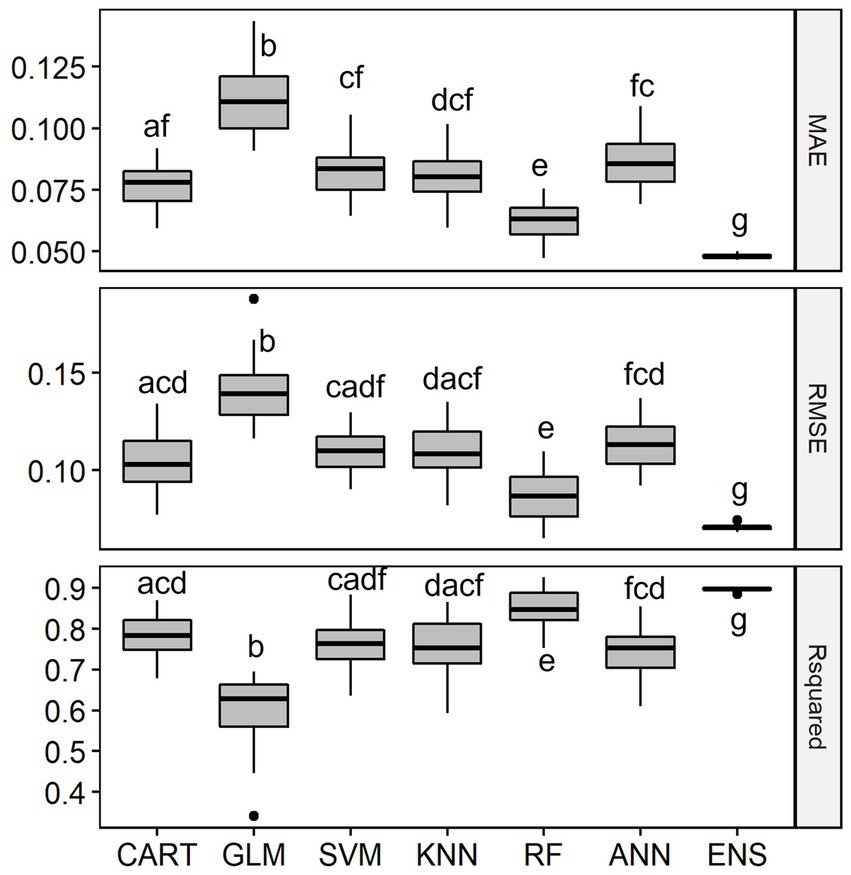
Figure 3. Distribution of Mean Absolute Error (MAE), Root Mean Squared Error (RMSE) and Coefficient of Determination (R2) of the single-SMs and the ensemble model (ENS) for species richness prediction in the Lower Mekong Basin. MAE and RMSE are unitless while R2 is % of the variation explained. For model abbreviations, see Figure 2. Note that the R2 of the ensemble model was 0.90, significantly higher than R2 of RF which was 0.85. Mean values among model’s performance measures with a common letter are not significantly different at the 0.05 level (Pairwise Wilcoxon Rank Sum Tests). Detailed Pairwise Test results on model’s performance measures are given in Supplementary Table S1.
Among the 14 predictive variables, water level (wl), distance from the sea (dist.sea), dissolved oxygen (DO), total nitrate (NO3), water temperature (Temp) and alkalinity (ALK) were the key predictors explaining the variation of fish species richness in the LMB (Figure 4). Indeed, all six-study single-SMs consistently indicated that these six key predictors were among the important variables to predict species richness in the LMB (Supplementary Information S1). Predictive variables that contributed the least in predicting species richness were ammonium (NH4) and chemical oxygen demand (COD) (Supplementary Information S1).
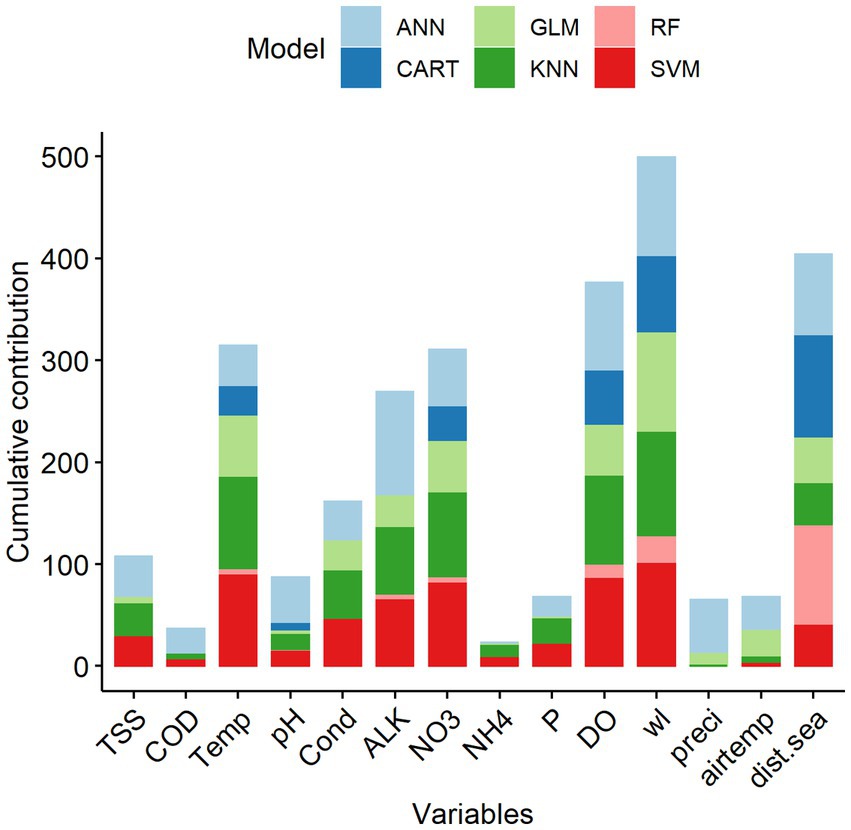
Figure 4. Cumulative percentage contribution (%) of predictive variables to the overall performance of the single statistical models on species richness in the Lower Mekong Basin. Predictive variable abbreviations as in Table 1.
Sensitivity analyses showed the overall pattern of the contribution profile of the six key predictors using linear GLM, non-linear ANN and ensemble-tree RF (Figure 5). The linear model (GLM) showed species richness increased linearly with increasing water level, dissolved oxygen and temperature. However, species richness decreased with the other three predictors namely alkalinity, distance from the sea and total nitrate. Non-linear models (ANN and RF) indicated clear non-linear patterns for species richness in response to the increase in the predictor values (Figures 5B,C), with peaks that then declined in the response of fish species richness to increasing dissolved oxygen, temperature, and water level. This was most apparent with the RF model and suggests optimal or near optimal ranges of predictor variables for species richness. For instance, the RF model showed a sharp increase in species richness with increasing water levels; however, this pattern was flattened when there was a further increase in flow. Likewise, the RF model showed an initial peak in species richness as the distance from the sea increased; however, this pattern sharply declined with a longer distance from the sea. Overall, there was more variability in species richness from increasing water levels with non-linear models (ANN, RF).
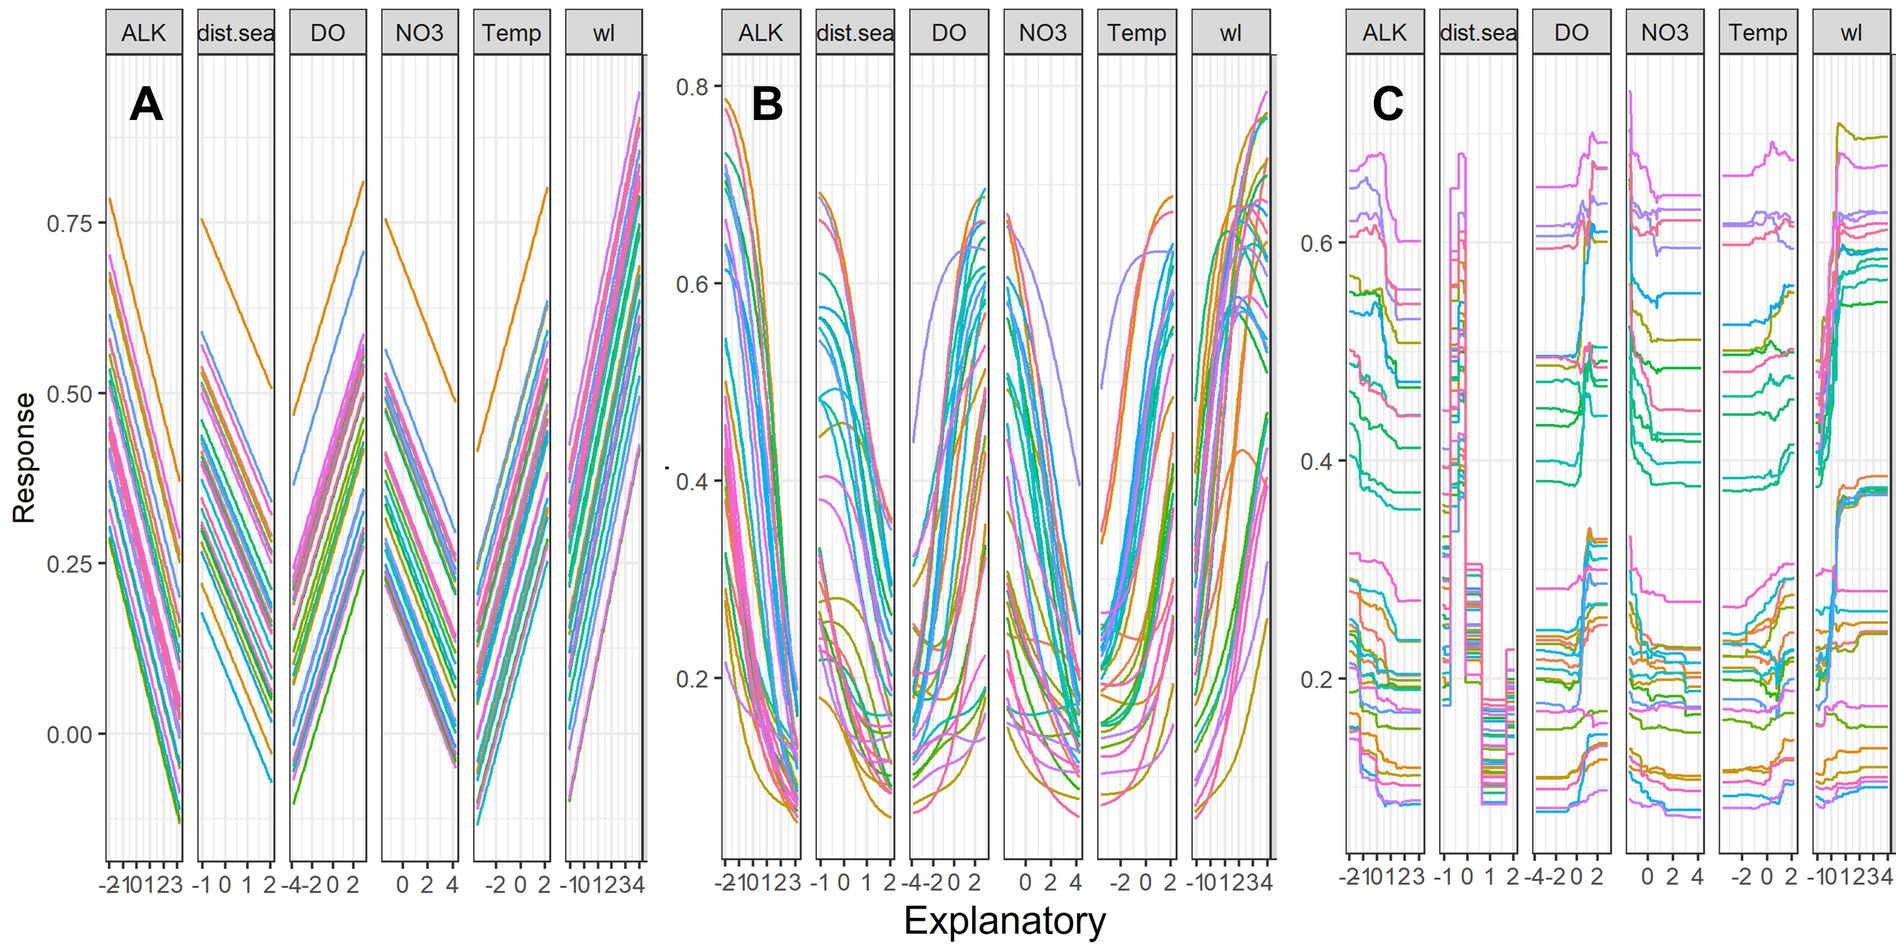
Figure 5. Sensitivity analyses of six key predictors for fish species richness (SR) using Lek’s profile method (response curves) with (A) Generalized Linear Model (GLM), (B) Artificial Neural Network (ANN) and (C) Random Forest (RF) models. The y-axis is scaled between 0 and 1, and the x-axis is the standardized values of predictors. For variable abbreviations, see Table 1. Line colors indicate the response of species richness to the scale of variable from the minimum (pink) to median (green) and maximum (red) and intermediate values of 30 range scales.
3.2. Fish abundance prediction
Overall, all six single-SMs performed well in predicting fish abundance using geo-hydrological, physicochemical and climatic data in the LMB, with median R2 values ranging between 0.58 for GLM and 0.77 for RF. The second-best performance single-SM for fish abundance was SVM (R2 = 0.73), followed by KNN (R2 = 0.72), ANN (R2 = 0.69) and CART (R2 = 0.61). Consistently, the single-SM with the best performance for fish abundance was RF while the poorest single-SM was GLM, with a significantly lower R2 value and higher MAE and RMSE (Figure 6). The ensemble model performed best to predict fish abundance, with the highest median R2 value of 0.85, which was significantly higher than other models.
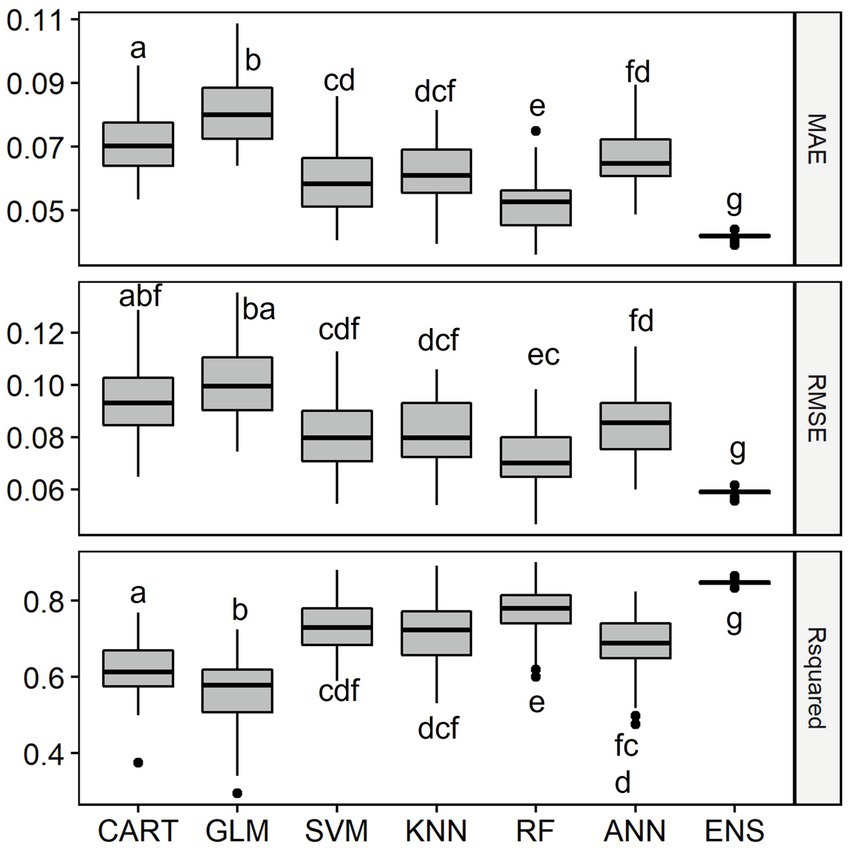
Figure 6. Distribution of Mean Absolute Error (MAE), Root Mean Squared Error (RMSE) and Coefficient of Determination (R2) of the six single-SMs and the ensemble model (ENS) for fish abundance prediction in the Lower Mekong Basin. For model abbreviations, see Figure 2. Note that the R2 of the ensemble model was 0.85, higher than the R2 of RF which was 0.77. Mean values of model performance measures with a common letter are not significantly different at the 0.05 level (Pairwise Wilcoxon Rank Sum Tests). Detailed Pairwise Test results on model’s performance measures are given in Supplementary Table S2.
Among the 14 predictors, the four key predictive variables that explained the variation of fish abundance in the LMB were distance from the sea (dist.sea), water level (wl), alkalinity (ALK) and water conductivity (Cond) (Figure 7). Other predictors, notably ammonium (NH4) and precipitation (preci), contributed the least to explaining the variation in fish abundance. Single-SMs revealed major differences in terms of variable importance when predicting fish abundance. CART, KNN and SVM consistently indicated that distance from the sea, water level, alkalinity and conductivity were among the most important variables to predict fish abundance in the LMB. Water level and distance from the sea were the two most important variables to predict fish abundance for all single-SMs, except for ANN, where total nitrate and water temperature were more important than water level (Supplementary Information S2).
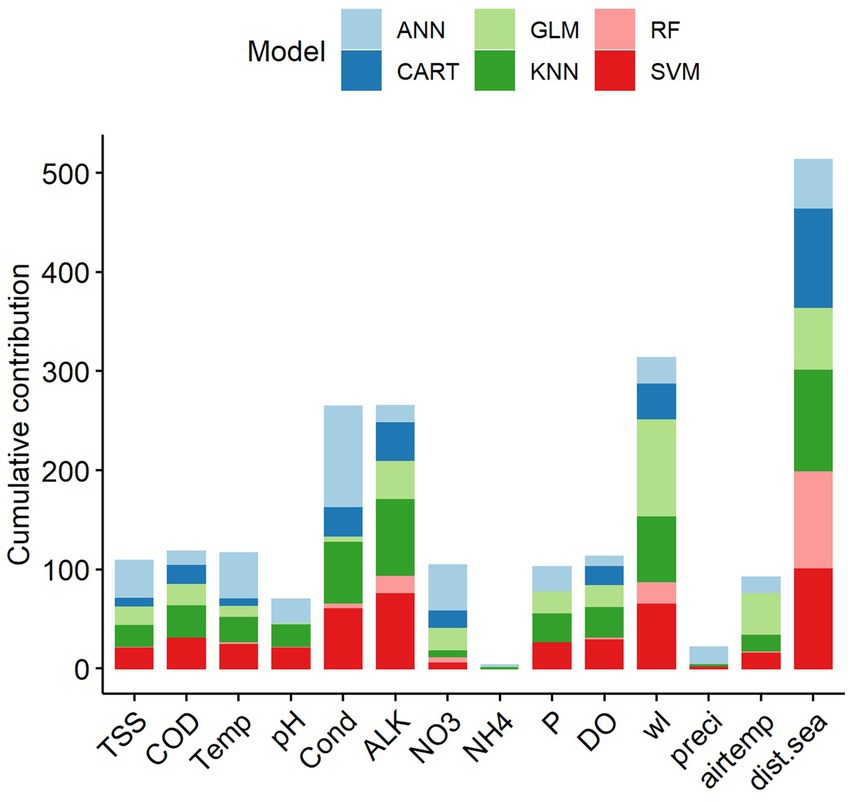
Figure 7. Cumulative contribution (%) of predictive variables to the overall performance of the single statistical models on fish abundance in the Lower Mekong Basin. Predictive variable abbreviations as in Table 1.
Figure 8 shows changes to fish abundance from changes in the four key predictive variables for the GLM, ANN, and RF models. The linear model (GLM) showed that fish abundance increased linearly with increasing water conductivity. However, fish abundance decreased with increasing alkalinity, distance from the sea and water level. Non-linear models (ANN and RF) indicated that fish abundance in response to the increase in the conductivity values (Figures 8B,C), with peaks that then declined sharply before the pattern was flattened. This was most apparent with the RF model and suggests optimal or near optimal ranges of predictor variables for fish abundance. Contrary to conductivity, in GLM, linear decrease in fish abundance was found to be connected with increasing distance from the sea, increasing water level and increasing alkalinity. However, it was observed that, in non-linear models especially RF, the initial increase in fish abundance was indicated when there was an increase in water level. The pattern was then followed by a sharp drop in abundance when there was a further rise in water level.
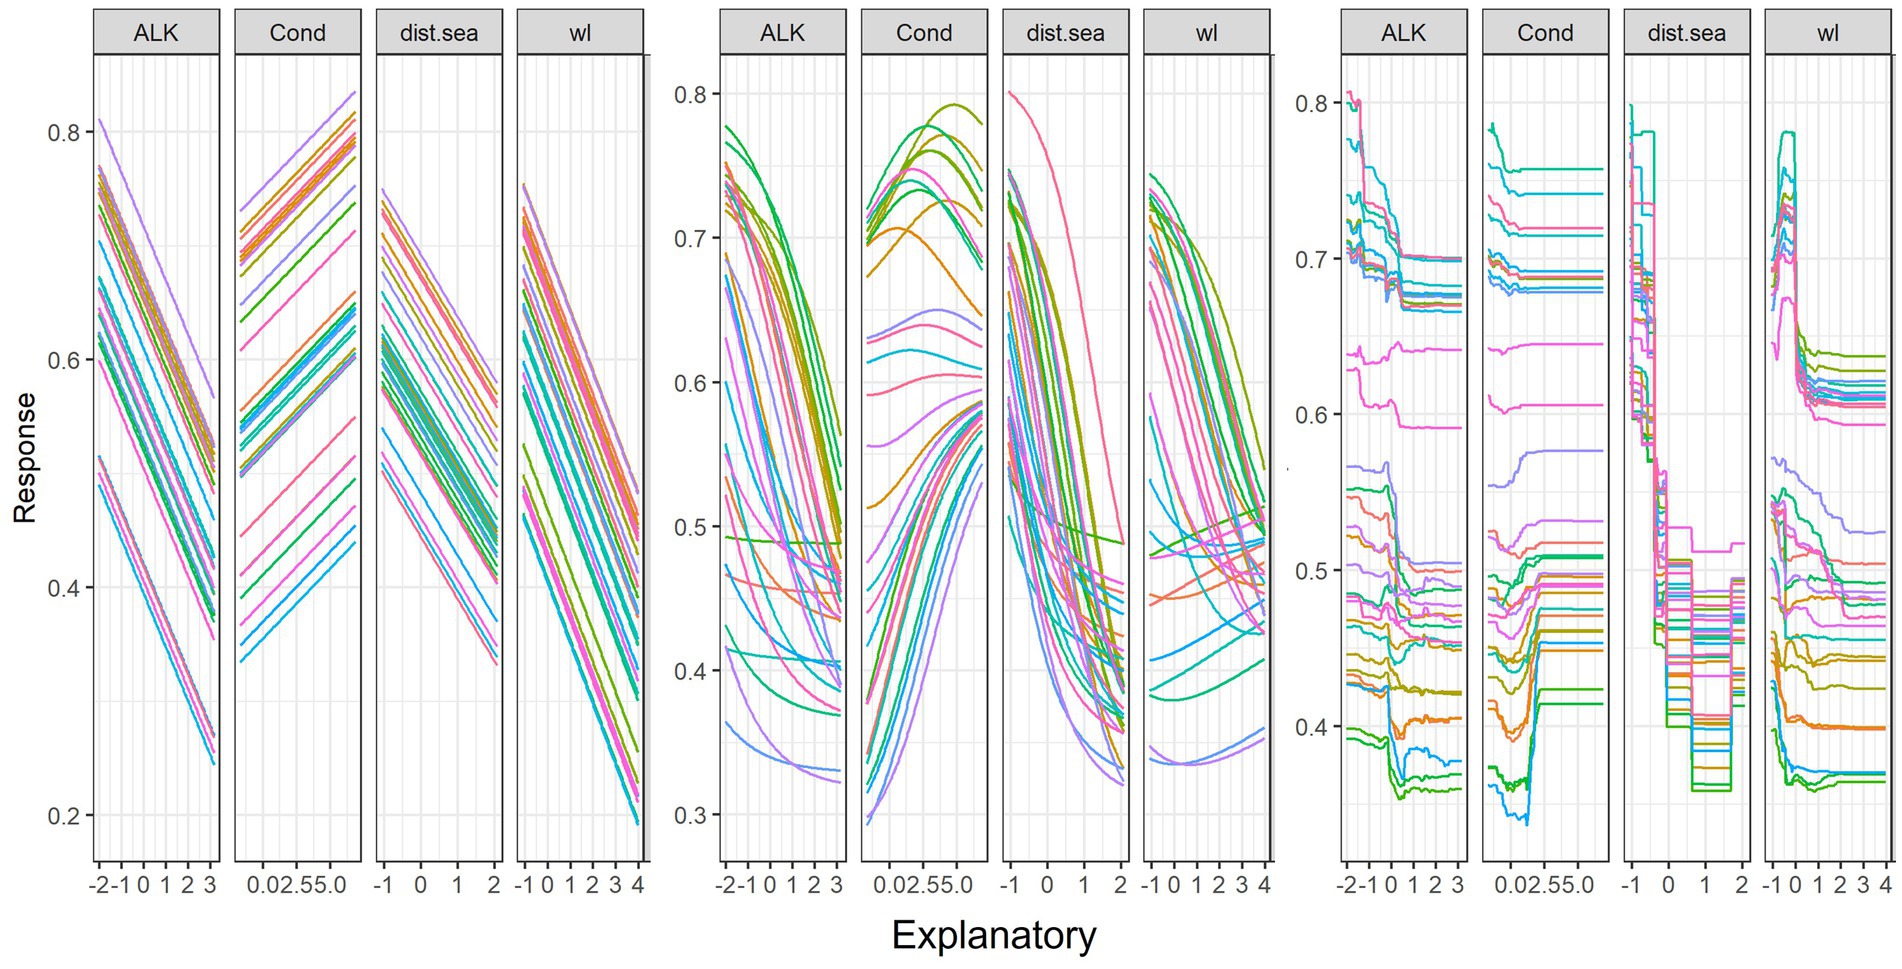
Figure 8. Sensitivity analysis of four key predictors for fish abundance (AB) using Lek’s profile method (response curves) with (A) Generalized Linear Model (GLM), (B) Artificial Neural Network (ANN) and (C) Random Forest (RF) models. The y-axis is scaled between 0 and 1, and the x-axis is the standardized values of predictors. For variable abbreviations, see Table 1. Line colors indicate the response of fish abundance to the scale of variable from the minimum (pink) to median (green) and maximum (red) and intermediate values of 30 range scales.
4. Discussion
4.1. Model performance
Our study is the first contribution from the LMB to the current literature on species richness and abundance prediction using SMs. It showed that the selection of single-SMs and modeling methods matters in predicting fish species richness and abundance of multi-species assemblages in one of the world’s biodiversity hotspot regions. Overall, the six single-SMs and the ensemble (average) model in this study demonstrated a varied ability (with R2 values between 0.56 and 0.90 of the total variability depending on the model used) to predict the species richness and abundance using geo-hydrological, physicochemical and climatic data. Consistently, RF performed best among all single-SMs in its predictive ability, with R2 values equal to 0.85 and 0.77 for richness and abundance, respectively. More importantly, we confirmed that the ensemble model performed better (R2 = 0.90 and 0.85 for richness and abundance, respectively) than all single-SMs.
In addition, our results indicated that the performance of the RF model was also very high and almost comparable to that of the ensemble model. This may not be surprising because RF incorporates the notion of ensemble modeling technique with thousands of trees being generated and predictions aggregated by averaging (Araújo and New, 2006). With this process, each decision tree is randomly built from the input dataset, and finally, all single trees are merged to get a more accurate and stable prediction (Breiman, 1996). Additionally, the best predictive performance of the ensemble model could be due to the low-pass filtering ability or cleaning effect of the average function (Marmion et al., 2009). Our results were in agreement with those of the previous SM work discerning that the performance of RF was very close to the performance of the ensemble model (Grenouillet et al., 2011; Guo et al., 2014). Overall, some SM models (e.g., GLM) did not perform well in our study. This is because each model has its own approach to predicting different characteristics of response variables, e.g., common and rare species (Guisan and Zimmermann, 2000; Sor et al., 2017b). For instance, Sor et al. (2017b) found that ANN and GLM performed better in predicting rare species than other SMs. Our results strengthened the recommendations, (e.g., Araújo and New, 2006; Marmion et al., 2009; Grenouillet et al., 2011; Oppel et al., 2012; Guo et al., 2014) that the application of the ensemble modeling technique generally yields a more certain, robust and reliable result than those of the single-SMs, and may therefore be best for guiding biodiversity management and conservation policy decisions. In this regard, it is not impossible to predict continuous responses (i.e., observed fish species richness and abundance) in the LMB, a large tropical freshwater system that is being impacted by regional and global changes. Our findings here contradict that of Oppel et al. (2012) who proved that it was extremely difficult to predict bird abundance in the coast of Portugal and Spain. This could be due to the strong adaptability of aquatic organisms to the Mekong River flood pulse environmental conditions. Changes in the system’s environmental conditions, e.g., seasonality and predictability of hydrology would likely cause changes in fish diversity and community structure (Ngor et al., 2018a,b,d). Our modeling results may therefore contribute to the ecological impact assessment and the management of aquatic ecosystem health, particularly fisheries health in the context of regional development (e.g., increasing hydropower dam) and climate change in the Mekong and other large tropical flood pulse freshwater systems. For example, statistical models have been used to conduct a risk assessment to support wetland restoration and conservation in an Indian wetland (Ghosh and Das, 2020), and to evaluate the flood hazard risk and management options in the Dongjiang River Basin, China (Wang et al., 2015). In the Mekong River Basin, statistical models could be used to evaluate the benefits of restoration, or the trade-offs between flood hazard risk management and fisheries health.
4.2. Important variables to species richness
We found that water levels and distance from the sea are the most important predictors of fish species richness variability. Water levels are widely known to be the key ecological trigger to fish migration in the lower Mekong system (Ngor, 2000; Baran et al., 2001a,b; Baran, 2006; Ngor et al., 2018c). Increasing water levels signal fish migration for reproduction or dispersal. Mekong fish often leave permanent water bodies during the early wet season, moving to floodplains with improved environmental conditions (e.g., often with favorable conditions of dissolved oxygen, temperature and access to food and habitat) primarily for rearing and feeding (Matthews, 1998; Poulsen et al., 2002; Ngor et al., 2018a,e; Pin et al., 2020). We also found that fish species richness increased with increasing dissolved oxygen (min: 2.14, max:10.81 mgL−1) and water temperature (min: 19.2, max: 33.0°C); see Table 1 for the values of predictors. Indeed, increasing water levels (i.e., from dry to wet season) are significantly linked to the increase in dissolved oxygen in waters (Soum et al., 2021), and in habitat or water surface connectivity within the LMB’s river network and its surrounding floodplains, and thus more favorable water conditions and habitats available for fish (Poulsen et al., 2002; Ngor, 2018; Ngor et al., 2018a). Such conditions give fish species a colonizing advantage, which drives greater species richness and diversity (Henriques-Silva et al., 2013; Laske et al., 2016). The pattern of increasing water surface coverage was also described as one of the most significant variables explaining the increase in species richness in Venezuela’s Cinaruco River (Rodríguez and Lewis, 1997; Hoeinghaus et al., 2003) and in the Brazilian Pantanal River (Fernandes et al., 2010). Also, the positive association between richness and temperature is likely explained by the difference in the ecological gradient of our study sites. Sites situated in the upper reach of the LMB (with higher elevation and lower species richness) generally have lower temperatures than sites in the lower floodplain where there is higher species richness. Moreover, our results were in line with those of recent studies indicating that there was significantly higher species richness in the wet season than in the dry season, particularly in the Mekong River mainstream and its tributary habitats (Pin et al., 2020). Fish species composition (beta diversity) of the lower Mekong River system was also observed to be significantly unique during increasing water levels in the early part of the wet season (Ngor et al., 2018b).
Further, decreasing richness was predicted to be connected with increasing distance from the sea. In other words, richness increased along the ecological (upstream-downstream) gradient toward the lower floodplain of the LMB. The result was consistent with broad-scale patterns of fish diversity in the LMB with greater species richness in the lower floodplain, i.e., the Mekong delta closest to the sea (Chea et al., 2016b). The increase in species richness was also explained by the ‘addition’ concept where the addition of fish species took place in the downstream floodplain. The addition concept has been widely observed in many river systems in both tropical and temperate zones alike, due to an increase in habitat diversity (species-area relationship theory) and improved environmental conditions for rearing and feeding (Oberdorff et al., 1993; Bistoni and Hued, 2002; Suvarnaraksha et al., 2012). Interestingly, in the non-linear models, increasing distance from the sea initially showed a sharp increase in species richness, and then followed by a drastic decline in richness with the increase in distance from the sea. This may indicate the important area of the middle system in the LMB in Cambodia particularly the Mekongg-3S system as a fish biodiversity hotspot. This result is in agreement with previous studies indicating the high fish diversity in Cambodia and the Mekong-3S (Chea et al., 2016b; Ngor et al., 2018b; Pin et al., 2020). Moreover, our results revealed that species richness decreased with increasing alkalinity and total nitrate. Increasing concentration of the two variables by anthropogenic activities might cause water pollution and thus likely reduced species richness. They were found to have a significant negative relationship with hydrological parameters including water level and precipitation, while positively correlated with evaporation and temperature (Prathumratana et al., 2008). This may indicate that higher concentration of alkalinity and total nitrate takes place in the low flow period. Low flows, i.e., during the dry season or droughts, indeed could cause detrimental effects on fish biota and, thus decrease species richness (and possibly abundance), as a consequence of increased water pollution with high alkalinity and decreased dissolved oxygen, and increased biochemical oxygen demand by microbes and decreased dissolved organic carbon (Dahm et al., 2003; Prathumratana et al., 2008; van Vliet and Zwolsman, 2008).
4.3. Important variables to fish abundance
Similar to fish species richness, higher fish abundance was linked to decreasing distance from the sea. In the LMB, the major flood zone where large fisheries yields occur is predominately located in the lower floodplain of Cambodia (55% of the total yield) and the Mekong Delta of Vietnam (25%) while only 9 and 11% of the total yield is observed in the upper reach of the LMB in Laos and Thailand, respectively (Hortle and Bamrungrach, 2015). Higher fish abundance in the lower floodplain closer to the sea may be due to availability of better and more habitat and food sources for fish, and especially young fish, to rear, feed and grow during high flow periods. This result further reinforces the importance of maintaining environmental health and ecological connectivity in the lower floodplain (Arias et al., 2019) in support of sustainable fishery yields that are necessary to feed millions in the region.
Opposite to species richness, we discovered that fish abundance increased with decreasing water levels. This can be due to fish seasonal migrations that are fine-tuned with seasonal hydrology of the Mekong. In the lower Mekong system, increasing water level facilitates fish dispersal from upstream to downstream inundated areas in the lower floodplains with increased habitat diversity during the wet season for fish rearing and feeding. During the period, fish are widely dispersed with seasonal floods over huge flooded plains in the basin. This may drive lower fish abundance as lower fish density is expected during the high flow which makes it difficult for fishers to capture them in large quantities. When water level recedes during the dry season, fish that have been reared and fed in the flooded plains migrate back to the deeper area of water bodies or main river channels such as lakes and deep pools for dry season refuge. Many fishes in large quantities are vulnerable to being captured during their dry season migrations and during their sedentary period in the dry season refuge since they tend to concentrate in high density in those habitats. This drives greater abundance of fish during lower flows. In fact, intensive fishing activities take place during the periods of decreasing flow in many parts of the LMB both for subsistence and commercial-scale fisheries, e.g., the century-old, commercial-scale stationary trawl bagnet fishery in the Tonle Sap River. The fishing activities particularly happen when the water levels drop to about the average flow level between the highest and lowest flow in December and January at the Tonle Sap River (Ngor, 2000; Halls et al., 2013; Sabo et al., 2017; Ngor et al., 2018c).
Interestingly, we predicted fish abundance would increase with increasing conductivity in water. This is likely reasonable because increased conductivity is generally accompanied by decreasing flow and higher temperature, and during the period, there is more concentration of dissolved substances, chemicals and minerals in water (Prathumratana et al., 2008; Izaguirre et al., 2018; Sensorex, 2021). Therefore, in the LMB, high water conductivity tends to occur during decreasing water levels concomitant with high fish abundance being generally harvested particularly during the first three to 4 months of the dry season (October–January) (Halls et al., 2013; Ngor et al., 2018a,c). This causal relationship may explain our result of increased fish abundance being linked to increased conductivity in water. However, toward the end of the dry season (March–April) which is among the driest period of the year, significantly high conductivity and alkalinity could occur in tandem due to high minerals and chemical pollutants entering the water, e.g., from agriculture, industries and urban sewages drained directly to rivers (Prathumratana et al., 2008; Sensorex, 2021). High conductivity, e.g., greater than 50 mSm−1 could be harmful to stream fish (Zhang et al., 2019). In the LMB, maximum conductivity was recorded at 61.10 mSm−1 in this study.
Finally, our study found that high fish abundance was related with decreased alkalinity. In polluted rivers, high alkalinity was associated with low oxygenation conditions, (e.g., Abril and Frankignoulle, 2001). In the LMB, high alkalinity was found to be connected with low precipitation and flow, but high evaporation and temperature (Prathumratana et al., 2008). This indicates that high alkalinity predominantly exists in the warmest months of the year (March–April), and could cause hypoxic conditions that could be harmful to aquatic biota. This may drive the inverse relationship between fish abundance and alkalinity in the LMB. Such relationship was also indicated for some stream fishes in eastern Thailand (Tongnunui and Beamish, 2009).
5. Concluding messages
Our study (1) quantified the predictability of six single-SMs, (2) identified the best single-SM, (3) identified three important environmental predictive variables and (4) highlighted the advantages of ensemble models. First, the six single-SMs used in this study demonstrated relatively high variability, but good ability to predict observed (continuous) fish species richness and abundance of this large, complex tropical freshwater ecosystem, the Mekong, using geo-hydrological, physicochemical and climatic data. Second, among the six-study single-SMs, RF model consistently performed best in predicting species richness and abundance of multi-species assemblages. Third, the three predictors that explained most of the variability in both richness and abundance included water level, distance from the sea and alkalinity. Additionally, dissolved oxygen, water temperature and total nitrate were among the important predictive variables to explain the variability in species richness while conductivity was important for fish abundance. We also found that species richness increased with increasing water level, dissolved oxygen and water temperature, and decreased with increasing distance from the sea, alkalinity and total nitrate. Fish abundance increased with increasing conductivity, but decreased with increasing distance from the sea, water level and alkalinity. Fourth, our results also highlighted the usefulness of ensemble modeling approach for providing a more robust and reliable predictive power than that of any single-SMs. Our results have important applications to the management of aquatic ecosystem health particularly Mekong’s fisheries in the context of contemporarily regional and global change. The modeling approach may be applied to assess environmental risks associated with water development projects and climate change in the region in support of the sustainable fisheries management and conservation.We also propose continued monitoring of water levels and important water quality parameters identified in this study to understand the environmental impacts that may originate from regional development projects including hydropower dams and climate change.
Data availability statement
Data used in this analysis are provided by Mekong River Commission and are available in raw form via request to the Mekong River Commission. Requests to access the datasets should be directed to SN (c29uYW1AbXJjbWVrb25nLm9yZw==).
Author contributions
PN and SL conceived the idea, designed the methodology, and acquired the data. SU helped organize the data. PN, SL, and ZH led the writing of the manuscript. All authors contributed critically to the drafts and gave final approval for publication.
Funding
This study was funded by the USAID supported “Wonders of the Mekong” Cooperative Agreement No: AID-OAA-A-16-00057 to ZH, SC, and SN. EDB is supported by “Investissement d’Avenir” grants (CEBA, ref. ANR-10-LABX-0025; TULIP, ref. ANR-10-LABX-41).
Acknowledgments
We thank to the Fisheries Programme of the Mekong River Commission (MRC) for making available the fish monitoring data sets used in this study. Also, we sincerely thank to the EDB laboratory.
Conflict of interest
The authors declare that the research was conducted in the absence of any commercial or financial relationships that could be construed as a potential conflict of interest.
Publisher’s note
All claims expressed in this article are solely those of the authors and do not necessarily represent those of their affiliated organizations, or those of the publisher, the editors and the reviewers. Any product that may be evaluated in this article, or claim that may be made by its manufacturer, is not guaranteed or endorsed by the publisher.
Supplementary material
The Supplementary material for this article can be found online at: https://www.frontiersin.org/articles/10.3389/fevo.2023.1131142/full#supplementary-material
Footnotes
References
Abril, G., and Frankignoulle, M. (2001). Nitrogen-alkalinity interactions in the highly polluted scheldt basin (Belgium). Water Res. 35, 844–850. doi: 10.1016/S0043-1354(00)00310-9
Allan, J. D., Abell, R., Hogan, Z., Revenga, C., Taylor, B. W., Welcomme, R. L., et al. (2005). Overfishing of inland waters. Bioscience 55, 1041–1051. doi: 10.1641/0006-3568(2005)055[1041:OOIW]2.0.CO;2
Allen, D. J., Smith, K. G., and Darwall, W. R. T. (2012). The status and distribution of freshwater biodiversity in Indo-Burma. Cambridge, UK and Gland, Switzerland: IUCN.
Amarasinghe, U. S., and Welcomme, R. L. (2002). An analysis of fish species richness in natural lakes. Environ. Biol. Fish 65, 327–339. doi: 10.1023/A:1020558820327
Araújo, M. B., and New, M. (2006). Ensemble forecasting of species distributions. Trends Ecol. Evol. 22, 42–47. doi: 10.1016/j.tree.2006.09.010
Arias, M., Holtgrieve, G., Ngor, P. B., Dang, T. D., and Piman, T. (2019). Maintaining perspective of ongoing environmental change in the Mekong floodplains. Curr. Opin. Environ. Sustain. 37, 1–7. doi: 10.1016/j.cosust.2019.01.002
Baran, E. (2006) in Fish migration triggers in the Lower Mekong Basin and other tropical freshwater systems. ed. T. Burnhill (Vientiane: Mekong River Commission)
Baran, E., Zalinge, N. P. van, and Ngor, P. B. (2001a). Floods, floodplains and fish production in the Mekong Basin: present and past trends. In: A. Ali (Ed). Proceedings of the second Asian wetlands symposium. Pulau Pinang, Malaysia: Penerbit Universiti Sains Malaysia.
Baran, E., van Zalinge, N., and Ngor, P. B. (2001b). Analysis of the Cambodian bagnet (“dai”) fishery data. Phnom Penh ICLARM, Mekong River Commission Secretariat and Dept of Fisheries
Barbarossa, V., Schmitt, R. J. P., Huijbregts, M. A. J., Zarfl, C., King, H., and Schipper, A. M. (2020). Impacts of current and future large dams on the geographic range connectivity of freshwater fish worldwide. Proc. Natl. Acad. Sci. U. S. A. 117, 3648–3655. doi: 10.1073/pnas.1912776117
Bistoni, M. A., and Hued, A. C. (2002). Patterns of fish species richness in rivers of the central region of Argentina. Brazilian J. Biol. 62, 753–764. doi: 10.1590/S1519-69842002000500004
Boets, P., Lock, K., and Goethals, P. L. M. (2013). Modelling habitat preference, abundance and species richness of alien macrocrustaceans in surface waters in Flanders (Belgium) using decision trees. Ecol Informat 17, 73–81. doi: 10.1016/j.ecoinf.2012.06.001
Brooks, S. E., Allison, E. H., Gill, J. A., and Reynolds, J. D. (2010). Snake prices and crocodile appetites: aquatic wildlife supply and demand on Tonle Sap Lake, Cambodia. Biol. Conserv. 143, 2127–2135. doi: 10.1016/j.biocon.2010.05.023
Brosse, S., Guegan, J. F., Tourenq, J. N., and Lek, S. (1999). The use of artificial neural networks to assess fish abundance and spatial occupancy in the littoral zone of a mesotrophic lake. Ecol. Model. 120, 299–311. doi: 10.1016/S0304-3800(99)00110-6
Brucet, S., Pédron, S., Mehner, T., Lauridsen, T. L., Argillier, C., Winfield, I. J., et al. (2013). Fish diversity in European lakes: geographical factors dominate over anthropogenic pressures. Freshw. Biol. 58, 1779–1793. doi: 10.1111/fwb.12167
Brunier, G., Anthony, E. J., Goichot, M., Provansal, M., and Dussouillez, P. (2014). Recent morphological changes in the Mekong and Bassac river channels, Mekong delta: the marked impact of river-bed mining and implications for delta destabilisation. Geomorphology 224, 177–191. doi: 10.1016/j.geomorph.2014.07.009
Chan, B., Brosse, S., Hogan, Z. S., Ngor, P., and Lek, S. (2020a). Influence of local habitat and climatic factors on the distribution of fish species in the Tonle Sap Lake. Water 12:w12030786. doi: 10.3390/w12030786
Chan, B., Ngor, P. B., Hogan, Z. S., So, N., Brosse, S., and Lek, S. (2020b). Temporal dynamics of fish assemblages as a reflection of policy shift from fishing concession to co-management in one of the world’s largest tropical flood pulse fisheries. Water 12, 1–18. doi: 10.3390/w12112974
Chan, B., Sor, R., Ngor, P. B., Baehr, C., and Lek, S. (2019). Modelling spatial and temporal dynamics of two small mud carp species in the Tonle Sap flood-pulse ecosystem. Ecol. Model. 392, 82–91. doi: 10.1016/j.ecolmodel.2018.11.007
Chea, R., Grenouillet, G., and Lek, S. (2016a). Evidence of water quality degradation in Lower Mekong Basin revealed by self-organizing map. PLoS One 11, 1–19. doi: 10.1371/journal.pone.0145527
Chea, R., Lek, S., Ngor, P. B., and Grenouillet, G. (2016b). Large-scale patterns of fish diversity and assemblage structure in the longest tropical river in Asia. Ecol. Freshw. Fish 26, 575–585. doi: 10.1111/eff.12301
Cheng, L., Lek, S., Lek-Ang, S., and Li, Z. (2012). Predicting fish assemblages and diversity in shallow lakes in the Yangtze River basin. Limnologica 42, 127–136. doi: 10.1016/j.limno.2011.09.007
Cheng, L., Lek, S., Loot, G., Lek-Ang, S., and Li, Z. (2010). Variations of fish composition and diversity related to environmental variables in shallow lakes in the Yangtze River basin. Aquat. Living Resour. 23, 417–426. doi: 10.1051/alr/2011001
Clescerl, L., Greenberg, A., and Eaton, A. (1998). Standard methods for the examination of water and wastewater. 20th. American Public Health Association, Washington, DC
Dahm, C. N., Baker, M. A., Moore, D. I., and Thibault, J. R. (2003). Coupled biogeochemical and hydrological responses of streams and rivers to drought. Freshw. Biol. 48, 1219–1231. doi: 10.1046/j.1365-2427.2003.01082.x
Darwall, W., Bremerich, V., de Wever, A., Dell, A. I., Freyhof, J., Gessner, M. O., et al. (2018). The alliance for Freshwater Life: a global call to unite efforts for freshwater biodiversity science and conservation. Aquat. Conserv. 28, 1015–1022. doi: 10.1002/aqc.2958
Dudgeon, D. (2003). The contribution of scientific information to the conservation and management of freshwater biodiversity in tropical Asia. Hydrobiologia 500, 295–314. doi: 10.1023/A:1024666627070
Fernandes, I. M., Machado, F. A., and Penha, J. (2010). Spatial pattern of a fish assemblage in a seasonal tropical wetland: effects of habitat, herbaceous plant biomass, water depth, and distance from species sources. Neotrop Ichthyol 8, 289–298. doi: 10.1590/S1679-62252010000200007
Gaston, K. J., and Blackburn, T. M. (1995). Mapping biodiversity using surrogates for species richness: macro-scales and New World birds. Proc. R. Soc. B Biol. Sci. 262, 335–341. doi: 10.1098/rspb.1995.0214
Ghosh, S., and Das, A. (2020). Wetland conversion risk assessment of East Kolkata Wetland: a Ramsar site using random forest and support vector machine model. J. Clean. Prod. 275:123475. doi: 10.1016/j.jclepro.2020.123475
Golden, C. D., Shapero, A., Vaitla, B., Smith, M. R., Myers, S. S., Stebbins, E., et al. (2019). Impacts of mainstream hydropower development on fisheries and human nutrition in the Lower Mekong. Front Sustain Food Syst 3:93. doi: 10.3389/fsufs.2019.00093
Grenouillet, G., Buisson, L., Casajus, N., and Lek, S. (2011). Ensemble modelling of species distribution: the effects of geographical and environmental ranges. Ecography 34, 9–17. doi: 10.1111/j.1600-0587.2010.06152.x
Grill, G., Lehner, B., Thieme, M., Geenen, B., Tickner, D., Antonelli, F., et al. (2019). Mapping the world’s free-flowing rivers. Nature 569, 215–221. doi: 10.1038/s41586-019-1111-9
Guisan, A., Tingley, R., Baumgartner, J. B., Naujokaitis-Lewis, I., Sutcliffe, P. R., Tulloch, A. I. T., et al. (2013). Predicting species distributions for conservation decisions. Ecol. Lett. 16, 1424–1435. doi: 10.1111/ele.12189
Guisan, A., and Zimmermann, N. E. (2000). Predictive habitat distribution models in ecology. Ecol. Model. 135, 147–186. doi: 10.1016/S0304-3800(00)00354-9
Guo, C., Chen, Y., Liu, H., Lu, Y., Qu, X., Yuan, H., et al. (2019). Modelling fish communities in relation to water quality in the impounded lakes of China’s South-to-North Water Diversion Project. Ecol. Model. 397, 25–35. doi: 10.1016/j.ecolmodel.2019.01.014
Guo, C., Lek, S., Ye, S., Li, W., Liu, J., and Li, Z. (2014). Uncertainty in ensemble modelling of large-scale species distribution: effects from species characteristics and model techniques. Ecol. Model. 306, 67–75. doi: 10.1016/j.ecolmodel.2014.08.002
Halls, A. S., Paxton, B. R., Hall, N., Peng Bun, N., Lieng, S., Pengby, N., et al. (2013). The stationary trawl (dai) fishery of the Tonle Sap-great Lake system, Cambodia. Phnom Penh: Mekong River Commission.
Harris, I., Osborn, T. J., Jones, P., and Lister, D. (2020). Version 4 of the CRU TS monthly high-resolution gridded multivariate climate dataset. Sci. Data 7, 1–18. doi: 10.1038/s41597-020-0453-3
Henriques-Silva, R., Lindo, Z., and Peres-Neto, P. R. (2013). A community of metacommunities: exploring patterns in species distributions across large geographical areas. Ecology 94, 627–639. doi: 10.1890/12-0683.1
Hodgson, J. A., Bennie, J. J., Dale, G., Longley, N., Wilson, R. J., and Thomas, C. D. (2015). Predicting microscale shifts in the distribution of the butterfly Plebejus argus at the northern edge of its range. Ecography 38, 998–1005. doi: 10.1111/ecog.00825
Hoeinghaus, D. J., Layman, C., Arrington, D. A., and Winemiller, K. O. (2003). Spatiotemporal variation in fish assemblage structure in tropical floodplain creeks. Environ. Biol. Fish 67, 379–387. doi: 10.1023/A:1025818721158
Hogan, Z. S., Moyle, P. B., May, B., Vander-Zanden, J., and Baird, I. G. (2004). The imperiled giants of the Mekong. Am. Sci. 92, 228–237. doi: 10.1511/2004.47.929
Hortle, K. G . (2007). Consumption and the yield of fish and other aquatic animals from the Lower Mekong Basin. Vientiane: Mekong River Commission.
Hortle, KG, and Bamrungrach, P. (2015). Fisheries habitat and yield in the Lower Mekong Basin. Phnom Penh: Mekong River Commission.
Izaguirre, I., Lancelotti, J., Saad, J. F., Porcel, S., O’Farrell, I., Marinone, M. C., et al. (2018). Influence of fish introduction and water level decrease on lakes of the arid Patagonian plateaus with importance for biodiversity conservation. Glob Ecol Conserv 14:e00391. doi: 10.1016/j.gecco.2018.e00391
Kohavi, R. (1995). “A study of cross-validation and bootstrap for accuracy estimation and model selection” in International joint conference of artificial intelligence (Stanford, CA: Computer Science Department, Stanford University)
Köhler, F., Seddon, M., Bogan, A. E., Do, V. T., Sri-Aroon, P., and Allen, D. (2012). “The status and distribution of freshwater molluscs of the indo-Burma region” in The status and distribution of freshwater biodiversity in indo- Burma. eds. D. Allen, K. Smith, and W. Darwall (Cambridge: Gland)
Kottelat, M. (2013). The fishes of the inland waters of Southeast Asia: a catalogue and core bibliography of the fishes known to occur in freshwaters, mangroves and estuaries. Raffles Bull. Zool. 27, 1–663.
Kuhn, M. (2008). Building predictive models in R using the caret package. J. Stat. Softw. 28, 1–26. doi: 10.18637/jss.v028.i05
Kwon, Y. S., Li, F., Chung, N., Bae, M. J., Hwang, S. J., Byoen, M. S., et al. (2012). Response of fish communities to various environmental variables across multiple spatial scales. Int. J. Environ. Res. Public Health 9, 3629–3653. doi: 10.3390/ijerph9103629
Laske, S. M., Haynes, T. B., Rosenberger, A. E., Koch, J. C., Wipfli, M. S., Whitman, M., et al. (2016). Surface water connectivity drives richness and composition of Arctic lake fish assemblages. Freshw. Biol. 2016, 1–15. doi: 10.1111/fwb.12769
Lek, S., Belaud, A., Dimopoulos, I., Lauga, J., Moreau, J., Whitman, M., et al. (1995). Improved estimation, using neural networks, of the food consumption of fish populations. Mar. Freshw. Res. 46, 1229–1236. doi: 10.1071/MF9951229
Lek, S., Delacoste, M., Baran, P., Dimopoulos, I., Lauga, J., and Aulagnier, S. (1996). Application of neural networks to modelling nonlinear relationships in ecology. Ecol. Model. 90, 39–52. doi: 10.1016/0304-3800(95)00142-5
Lek, S., and Guegan, J. F. (1999). Artificial neural network as a tool in ecological modelling, an introduction. Ecol. Model. 120, 65–73. doi: 10.1016/S0304-3800(99)00092-7
Lohani, S., Dilts, T. E., Weisberg, P. J., Null, S., and Hogan, Z. (2020). Rapidly accelerating deforestation in Cambodia’s Mekong River basin: a comparative analysis of spatial patterns and drivers. Water 12:2191. doi: 10.3390/w12082191
Marmion, M., Parviainen, M., Luoto, M., Heikkinen, R. K., and Thuiller, W. (2009). Evaluation of consensus methods in predictive species distribution modelling. Divers. Distrib. 15, 59–69. doi: 10.1111/j.1472-4642.2008.00491.x
Mcintyre, P. B., Gessner, M. O., Dudgeon, D., Prusevich, A., Green, P., Glidden, S., et al. (2010). Global threats to human water security and river biodiversity. Nature 467, 555–561. doi: 10.1038/nature09440
MFD . (2003). Mekong fish database: a taxonomic fish database for the Mekong Basin. Phnom Penh: Mekong River Commission.
Mittermeier, R. A., Turner, W. R., Larsen, F. W., Brooks, T. M., and Gascon, C. (2011). “Global biodiversity conservation: the critical role of hotspots” in Biodiversity hotspots: distribution and protection of conservation priority areas. eds. F. Zachos and J. Habel (Berlin Heidelberg: Springer-Verlag)
Moriasi, D. N., Arnold, J. G., Van, L. M. W., Bingner, R., Harmel, R. D., and Veith, T. (2007). Model evaluation guidelines for systematic quantification of accuracy in watershed simulations. Am Soc Agric Biol Eng 50, 885–900. doi: 10.13031/2013.23153
MRC . (2007). Monitoring fish abundance and diversity in the Lower Mekong Basin: Methodological guidelines. Phnom Penh: Mekong River Commission.
Namkhan, M., Gale, G. A., and Savini, T. (2020). Loss and vulnerability of lowland forests in mainland Southeast Asia. Conserv. Biol. 35, 1–10. doi: 10.1111/cobi.13538
Ng, T. H., Jeratthitikul, E., Sutcharit, C., Chhuoy, S., Pin, K., Pholyotha, A., et al. (2020). Annotated checklist of freshwater molluscs from the largest freshwater lake in Southeast Asia. Zookeys 958, 107–141. doi: 10.3897/zookeys.958.53865
Ngor, P. B . (2000). Dai fisheries in the Tonle Sap River of Phnom Penh and Kandal province (including a review of the census data of 1996-97). In: van Zalinge, N. P. , T. Nao and S. Lieng (Eds). Management aspects of Cambodia’s freshwater capture fisheries and management implications, eleven presentation given at the annual meeting of the Department of Fisheries of the Ministry of Agriculture, Forestry and Fisheries, 27–27 January 2000. Phnom Penh: Mekong River Commission and Department of Fisheries.
Ngor, P. B. (2018). Fish assemblages dynamic in the tropical flood-pulse system of the Lower Mekong River Basin. University of Toulouse 3 Paul Sabatier, Toulouse, France.
Ngor, P. B., Grenouillet, G., Phem, S., So, N., and Lek, S. (2018a). Spatial and temporal variation in fish community structure and diversity in the largest tropical flood-pulse system of Southeast Asia. Ecol. Freshw. Fish 27, 1087–1100. doi: 10.1111/eff.12417
Ngor, P. B., Hortle, G. K., and So, N. (2016). Standard sampling procedures for fish abundance and diversity monitoring in the Lower Mekong Basin. Phnom Penh: Mekong River Commission.
Ngor, P. B., Legendre, P., Oberdorff, T., and Lek, S. (2018b). Flow alterations by dams shaped fish assemblage dynamics in the complex Mekong-3S river system. Ecol. Indic. 88, 103–114. doi: 10.1016/j.ecolind.2018.01.023
Ngor, P. B., McCann, K. S., Grenouillet, G., So, N., McMeans, B. C., Fraser, E., et al. (2018c). Evidence of indiscriminate fishing effects in one of the world’s largest inland fisheries. Sci. Rep. 8:8947. doi: 10.1038/s41598-018-27340-1
Ngor, P. B., Oberdorff, T., Phen, C., Baehr, C., Grenouillet, G., and Lek, S. (2018d). Fish assemblage responses to flow seasonality and predictability in a tropical flood pulse system. Ecosphere 9:e02366. doi: 10.1002/ecs2.2366
Ngor, P. B., Sor, R., Prak, L. H., So, N., Hogan, Z. S., and Lek, S. (2018e). Mollusc fisheries and length–weight relationship in Tonle Sap flood pulse system, Cambodia. Ann Limnol Int J Lim 54, 34–10. doi: 10.1051/limn/2018026
Null, S. E., Farshid, A., Goodrum, G., Gray, C. A., Lohani, S., Morrisett, C. N., et al. (2021). A meta-analysis of environmental tradeoffs of hydropower dams in the Sekong, Sesan, and Srepok (3S) rivers of the Lower Mekong Basin. Water 13, 1–18. doi: 10.3390/w13010063
Oberdorff, T., Guilbert, E., and Lucchetta, J. C. (1993). Patterns of fish species richness in the Seine River basin, France. Hydrobiologia 259, 157–167. doi: 10.1007/BF00006595
Oeurng, C., Cochrane, T. A., Arias, M. E., Shrestha, B., and Piman, T. (2016). Assessment of changes in riverine nitrate in the Sesan, Srepok and Sekong tributaries of the lower Mekong River basin. J Hydrol Reg Stud 8, 95–111. doi: 10.1016/j.ejrh.2016.07.004
Oppel, S., Meirinho, A., Ramírez, I., Gardner, B., O’Connell, A. F., Miller, P. I., et al. (2012). Comparison of five modelling techniques to predict the spatial distribution and abundance of seabirds. Biol. Conserv. 156, 94–104. doi: 10.1016/j.biocon.2011.11.013
Pin, K., Nut, S., Hogan, Z., Chandra, S., Saray, S., Touch, B., et al. (2020). Cambodian freshwater fish assemblage structure and distribution patterns: using a large-scale monitoring network to understand the dynamics and management implications of species clusters in a global biodiversity hotspot. Water 12:2506. doi: 10.3390/w12092506
Poff, N. L., Olden, J. D., Merritt, D. M., and Pepin, D. M. (2007). Homogenization of regional river dynamics by dams and global biodiversity implications. Proc. Natl. Acad. Sci. U. S. A. 104, 5732–5737. doi: 10.1073/pnas.0609812104
Pokhrel, Y., Burbano, M., Roush, J., Kang, H., Sridhar, V., and Hyndman, D. W. (2018). A review of the integrated effects of changing climate, land use, and dams on Mekong river hydrology. Water 10, 1–25. doi: 10.3390/w10030266
Poulsen, A. F., Ouch, P., Viravong, S., Suntornratana, Ubolratana, and Tung, Nguyen Thanh (2002). Fish migrations of the Lower Mekong River basin: implications for development, planning and environmental management. Phnom Penh: Mekong River Commission.
Prathumratana, L., Sthiannopkao, S., and Kim, K. W. (2008). The relationship of climatic and hydrological parameters to surface water quality in the lower Mekong River. Environ. Int. 34, 860–866. doi: 10.1016/j.envint.2007.10.011
R Core Team . (2021). R: A language and environment for statistical computing. R Foundation for Statistical Computing. Available at: http://www.r-project.org
Rainboth, W. J . (1996). Fishes of the Cambodian Mekong. Rome: Food and Agriculture Organisation of the United Nations.
Rainboth, W. J., Vidthayanon, C., and Mai, D. Y. (2012) in Fishes of the greater Mekong ecosystem with species list and photoraphic atlas. eds. J. Burch and J. Pappas (Michigan: Museum of Zoology, University of Michigan)
Ramsar Convention on Wetlands . (2018). Global wetland outlook: state of the world’s wetlands and their services to people 2018.
Rodríguez, M. A., and Lewis, W. M. (1997). Structure of fish assemblages along environmental gradients in floodplain lakes of the Orinoco River. Ecol. Monogr. 67, 109–128. doi: 10.1890/0012-9615(1997)067[0109:SOFAAE]2.0.CO;2
Sabo, J. L., Ruhi, A., Holtgrieve, G. W., Elliott, V., Arias, M. E., Ngor, P. B., et al. (2017). Designing river flows to improve food security futures in the lower Mekong Basin. Science 358, 1–11. doi: 10.1126/science.aao1053
Sensorex . (2021). Why electrical conductivity of water is important for industrial applications. Available at: https://sensorex.com/blog/2019/10/08/electrical-conductivity-water-important-industrial-applications/
Siriwut, W., Jeratthitikul, E., Panha, S., Chanabun, R., Ngor, P. B., and Sutcharit, C. (2021). Evidence of cryptic diversity in freshwater Macrobrachium prawns from Indochinese riverine systems revealed by DNA barcode, species delimitation and phylogenetic approaches. PLoS One 16:e0252546. doi: 10.1371/journal.pone.0252546
Sor, R., Boets, P., Chea, R., Goethals, P. L. M., and Lek, S. (2017a). Spatial organization of macroinvertebrate assemblages in the Lower Mekong Basin. Limnologica 64, 20–30. doi: 10.1016/j.limno.2017.04.001
Sor, R., Ngor, P. B., Boets, P., Goethals, P., Lek, S., Hogan, Z., et al. (2020). Patterns of Mekong Mollusc biodiversity: identification of emerging threats and importance to management and livelihoods in a region of globally significant biodiversity and endemism. Water 12:2619. doi: 10.3390/w12092619
Sor, R., Ngor, P. B., Soum, S., Chandra, S., Hogan, Z. S., and Null, S. E. (2021). Water quality degradation in the Lower Mekong Basin. Water 13:1555. doi: 10.3390/w13111555
Sor, R., Park, Y. S., Boets, P., Goethals, P. L. M., and Lek, S. (2017b). Effects of species prevalence on the performance of predictive models. Ecol. Model. 354, 11–19. doi: 10.1016/j.ecolmodel.2017.03.006
Soukhaphon, A., Baird, I. G., and Hogan, Z. S. (2021). The impacts of hydropower dams in the mekong river basin: a review. Water 13, 1–18. doi: 10.3390/w13030265
Soum, S., Ngor, P. B., Dilts, T. E., Lohani, S., Kelson, S., Null, S. E., et al. (2021). Spatial and long-term temporal changes in water quality dynamics of the Tonle Sap ecosystem. Water 13:2059. doi: 10.3390/w13152059
Suvarnaraksha, A., Lek, S., Lek-Ang, S., and Jutagate, T. (2012). Fish diversity and assemblage patterns along the longitudinal gradient of a tropical river in the Indo-Burma hotspot region (Ping-Wang River Basin, Thailand). Hydrobiologia 694, 153–169. doi: 10.1007/s10750-012-1139-4
Tongnunui, S., and Beamish, F. W. H. (2009). Habitat and relative abundance of fishes in small rivers in eastern Thailand. Environ. Biol. Fish 85, 209–220. doi: 10.1007/s10641-009-9483-6
Van Echelpoel, W., and Goethals, P. L. M. (2018). Variable importance for sustaining macrophyte presence via random forests: data imputation and model settings. Sci. Rep. 8:14557. doi: 10.1038/s41598-018-32966-2
Wang, Z., Lai, C., Chen, X., Yang, B., Zhao, S., and Bai, X. (2015). Flood hazard risk assessment model based on random forest. J. Hydrol. 527, 1130–1141. doi: 10.1016/j.jhydrol.2015.06.008
Winemiller, K., McIntyre, P., Castello, L., Fluet-Chouinard, E., Giarrizzo, T., Nam, S., et al. (2016). Balancing hydropower and biodiversity in the Amazon, Congo, and Mekong. Science 351, 128–129. doi: 10.1126/science.aac7082
Young, M., and Carr, M. H. (2015). Application of species distribution models to explain and predict the distribution, abundance and assemblage structure of nearshore temperate reef fishe. Biodivers Distrib 21, 1428–1440. doi: 10.1111/ddi.12378
Zhang, Y., Zhao, Q., and Ding, S. (2019). The responses of stream fish to the gradient of conductivity: a case study from the Taizi River, China. Aquat Ecosyst Heal Manag 22, 171–182. doi: 10.1080/14634988.2019.1622994
Ziv, G., Baran, E., So, N., Rodríguez-Iturbe, I., and Levin, S. A. (2012). Trading-off fish biodiversity, food security, and hydropower in the Mekong River Basin. Proc. Natl. Acad. Sci. 109, 5609–5614. doi: 10.1073/pnas.1201423109
Keywords: fish richness, fish abundance, diversity prediction, average model, ensemble model, statistical model, freshwater fisheries, Southeast Asia
Citation: Ngor PB, Uy S, Sor R, Chan B, Holway J, Null SE, So N, Grenouillet G, Chandra S, Hogan ZS and Lek S (2023) Predicting fish species richness and abundance in the Lower Mekong Basin. Front. Ecol. Evol. 11:1131142. doi: 10.3389/fevo.2023.1131142
Edited by:
Nese Yilmaz, Istanbul University, TürkiyeReviewed by:
Vineet Dubey, Wildlife Institute of India, IndiaKatrine Turgeon, University of Quebec in Outaouais, Canada
Copyright © 2023 Ngor, Uy, Sor, Chan, Holway, Null, So, Grenouillet, Chandra, Hogan and Lek. This is an open-access article distributed under the terms of the Creative Commons Attribution License (CC BY). The use, distribution or reproduction in other forums is permitted, provided the original author(s) and the copyright owner(s) are credited and that the original publication in this journal is cited, in accordance with accepted academic practice. No use, distribution or reproduction is permitted which does not comply with these terms.
*Correspondence: Peng Bun Ngor, cGVuZ2J1bi5uZ29yQGdtYWlsLmNvbQ==