 Francisco Cervantes1,2*
 Res Altwegg1Francis Strobbe3
 Andrew Skowno2
 Vernon Visser1
 Michael Brooks4Yvan Stojanov3
 Douglas M. Harebottle5
 Nancy Job2
- 1Department of Statistical Sciences, Centre for Statistics in Ecology, The Environment and Conservation, University of Cape Town, Cape Town, South Africa
- 2South African National Biodiversity Institute, Kirstenbosch Research Centre, Cape Town, South Africa
- 3Operational Directorate Natural Environment, Royal Belgian Institute of Natural Sciences, Brussels, Belgium
- 4Department of Biological Sciences, FitzPatrick Institute of African Ornithology, University of Cape Town, Cape Town, South Africa
- 5School of Natural and Applied Sciences, Risk and Vulnerability Science Centre, Sol Plaatje University, Kimberley, South Africa
Introduction: Efforts to collect ecological data have intensified over the last decade. This is especially true for freshwater habitats, which are among the most impacted by human activity and yet lagging behind in terms of data availability. Now, to support conservation programmes and management decisions, these data need to be analyzed and interpreted; a process that can be complex and time consuming. The South African Biodiversity Data Pipeline for Wetlands and Waterbirds (BIRDIE) aims to help fast and efficient information uptake, bridging the gap between raw ecological datasets and the information final users need.
Methods: BIRDIE is a full data pipeline that takes up raw data, and estimates indicators related to waterbird populations, while keeping track of their associated uncertainty. At present, we focus on the assessment of species abundance and distribution in South Africa using two citizen-science bird monitoring datasets, namely: the African Bird Atlas Project and the Coordinated Waterbird Counts. These data are analyzed with occupancy and state-space models, respectively. In addition, a suite of environmental layers help contextualize waterbird population indicators, and link these to the ecological condition of the supporting wetlands. Both data and estimated indicators are accessible to end users through an online portal and web services.
Results and discussion: We have designed a modular system that includes tasks, such as: data cleaning, statistical analysis, diagnostics, and computation of indicators. Envisioned users of BIRDIE include government officials, conservation managers, researchers and the general public, all of whom have been engaged throughout the project. Acknowledging that conservation programmes run at multiple spatial and temporal scales, we have developed a granular framework in which indicators are estimated at small scales, and then these are aggregated to compute similar indicators at broader scales. Thus, the online portal is designed to provide spatial and temporal visualization of the indicators using maps, time series and pre-compiled reports for species, sites and conservation programmes. In the future, we aim to expand the geographical coverage of the pipeline to other African countries, and develop more indicators specific to the ecological structure and function of wetlands.
1. Introduction
Freshwater ecosystems are among the most productive, biodiverse, and efficient at capturing and storing carbon (Convention on Wetlands, 2021). Unfortunately, they are also among the most impacted by human activity (Skowno et al., 2019; Convention on Wetlands, 2021), and climate change will likely exacerbate the pressure on freshwater resources. This is particularly true for the African continent, home to some of the largest wetlands, which not only host a wealth of freshwater species, but are also key in supporting human communities (Stephenson et al., 2020). Such critical issues have fueled unprecedented efforts to collect and mobilize freshwater biodiversity data (Wetzel et al., 2015; Dallas et al., 2021).
While we must strive to keep monitoring programmes that deliver data funded and alive, it is clear that data on their own are not enough (MacFadyen et al., 2022). If we are to take effective action to stop ecosystem degradation, it is important that data are analyzed to extract indicators that are meaningful for decision- and policy-making (Harebottle and Underhill, 2016; Stephenson et al., 2017b; Jetz et al., 2019). Furthermore, with continuous data collection, we need to implement workflows that update indicators and support decisions in a timely fashion (Yenni et al., 2019; MacFadyen et al., 2022). Automated data pipelines allow us to keep datasets updated and free of errors (Yenni et al., 2019), make model-based forecasts, and evaluate previous forecasts in light of new data (White et al., 2019). These modern and automated data workflows require multidisciplinary skills in ecology, statistics, data science, and software development, but their end products should ideally be free, accessible and easy to interpret (Stephenson et al., 2017b). It would also be desirable that they integrate multiple datasets and environmental layers to produce a holistic understanding of biodiversity structure and function (MacFadyen et al., 2022).
South Africa is leading the African continent in terms of biodiversity data availability (Barnard et al., 2017), with successful citizen-science programmes such as the Southern African Bird Atlas Project (Brooks et al., 2022), and biodiversity data platforms, such as the Biodiversity Advisor [South African National Biodiversity Institute (SANBI), 2023] or the Freshwater Biodiversity Information System (FBIS, Dallas et al., 2021). In contrast, dashboards and tools that facilitate the timely uptake of information and unlock the utility of current data are still limited. There is also an imbalance in data availability across taxonomic groups and habitats. Regular monitoring of the status, distribution, and condition of wetlands ecosystems is urgently required to understand environmental pressures on wetland habitats, but challenges associated with limited human and budget capacity hamper the collection of the necessary data. Conversely, available waterbird species data are rich in detail and coverage, and could provide a stronger basis for both adaptive management and reporting at priority wetland sites.
Here, we describe a data pipeline that implements a workflow of wetland- and waterbird-related biodiversity data, the South African Biodiversity Data Pipeline for Wetlands and Waterbirds (BIRDIE). At present, most of BIRDIE's functionality focuses on computing indicators related to waterbird distribution and abundance, which are considered the minimum set of variables necessary to study changes in species populations (Pereira et al., 2013; Jetz et al., 2019). BIRDIE utilizes two long-term citizen-science programmes that have collected waterbird data in South Africa for more than two decades, and are still active: the Southern African Bird Atlas Project (SABAP; Brooks et al., 2022) and the Coordinated Waterbird Counts (CWAC; FIAO, 2022). Apart from waterbird data, BIRDIE uses and serves ancillary environmental data for contextualizing the aforementioned waterbird population variables, and also for describing the state of the wetlands that support them. In a next phase, we plan to expand the functionality of the pipeline to provide indicators of wetland ecosystem structure and function.
BIRDIE is embedded into the South African National Biodiversity Institute (SANBI) biodiversity informatics infrastructure and it was conceived as a tool to inform environmental strategies, identify priorities for the protection and sustainable use of biodiversity, and to guide land-use management. Because such policy-linked objectives require updated and timely information, the pipeline was designed to run periodically (yearly in principle), and automatically (but supervised). Currently, BIRDIE provides indicators for South Africa only, but in the future we expect to expand its coverage to other African countries. In what follows we describe BIRDIE's data pipeline workflow from data acquisition to display of final outputs (Figure 1), as well as the technologies we have used and the general modeling frameworks adopted.
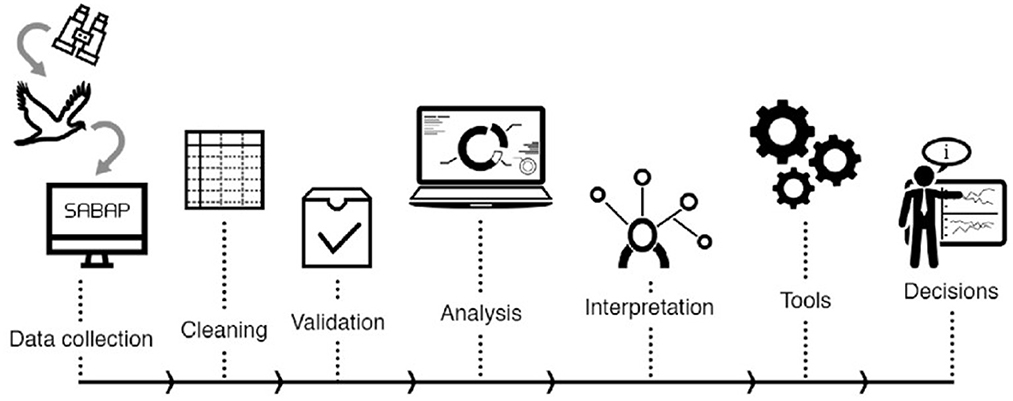
Figure 1. Basic workflow of the BIRDIE pipeline covering all steps from data collection, to analysis and presentation of digested, decision-ready indicators. Note that this is not a detailed sequence of all steps data go through, but rather a simplified view of the main processes.
2. Framework and target users
The main objective of BIRDIE is to provide information to support authorities that need to report on the state of wetlands or waterbird populations at multiple levels: (1) as required by national and international programmes and agreements, (2) provincial authorities, site managers and other stakeholders who need to make a range of decisions specific to certain wetlands, and (3) the general public could make use of BIRDIE's freely available outputs for a variety of reasons, including recreation and local conservation initiatives.
Indicators on the state of biodiversity have been adopted by a range of multilateral environmental agreements including the United Nations Convention on Biological Diversity (CBD, 2022) and Sustainable Development Goals (SDGs; United Nations, 2022). New indicators are under development and established processes, such as the International Union for the Conservation of Nature (IUCN, 2022) species red-listing efforts, are receiving renewed attention (Han et al., 2017). With these indicators come various global and national initiatives and targets for reducing rates of biodiversity loss (Mace et al., 2018). Essential Biodiversity Variables (EBVs) have been conceptualized and developed to help standardize and improve interoperability of biodiversity data and monitoring (Pereira et al., 2013). Within this framework, BIRDIE gives support to both national and international programs contributing information about the state of waterbird populations in South Africa, with a view to expand to the Southern Africa region. We focus primarily on species population EBVs, with the assessment of waterbird abundance, distribution and diversity, and changes of these over time (Kissling et al., 2018; Jetz et al., 2019).
At an international scale, the BIRDIE team has engaged in conversation with two strategic partners from the project outset: the Ramsar Convention Secretariat and the Technical Committee of the Agreement on the Conservation of African-Eurasian Migratory Waterbirds. South Africa is signatory to the Ramsar Convention (Convention on Wetlands, 2021), hosts 28 Wetlands of International Importance, and needs to produce reports on the state of these sites every 3 years. National reports must also be compiled for the Agreement on the Conservation of African-Eurasian Migratory Waterbirds (AEWA; United Nations Environmental Programme, 2022), an international agreement, framed under the Convention on Migratory Species, and focused on protecting migratory waterbirds and their habitats.The Ramsar Convention and AEWA both require information on changes in overall abundance and distribution of waterbirds, with AWEA focusing on migratory species. Both conventions also report on indicators such as change in wetland extent and condition. Engagement with the South African national government bodies for both of these conventions ensures the reporting component of the BIRDIE project responds directly to their needs.
At the national level, South Africa produces a National Biodiversity Assessment every 4 years, which constitutes the main reporting tool of the state of biodiversity in the country, and informs policy and conservation strategies (Skowno et al., 2019). At the same time, there are regular efforts to address the conservation status of South African species within the IUCN Red-List framework. Changes in abundance and distribution of species are key in these assessments to track and report on population trends, and shifts in species ranges and community diversity. BIRDIE is embedded within SANBI, which is the organization mandated to report on the state of biodiversity in South Africa. As such, the outputs produced by the pipeline have a direct connection to needs specified for National Biodiversity Assessments, the Freshwater Biodiversity Programme and other national decision processes regarding freshwater ecosystems and species.
Keeping these main reporting channels in mind, BIRDIE also intends to support local management actions and basic research. Site-scale wetland monitoring is severely limited in South Africa, lagging far behind monitoring of other aquatic ecosystems such as rivers and estuaries. Managers ideally need to report on the state of the wetland (e.g., wetland condition, flux in surface water extent) as well as the species that the wetland supports, including species of special concern. Local waterbird and wetland information can facilitate the development of site-specific management actions and management plans, and support permitting decisions. At the same time, linking the local manager inputs and feedback into the data pipeline closes the gap between large-scale assessments and local data collection. In this sense, throughout the development of the pipeline, we have engaged with stakeholders at a pilot site, the Barberspan Nature Reserve. These conversations were enormously insightful to understand the variety of questions that may arise when working at a local level. One key take-away message from these engagements was that we should favor a flexible online portal, where users can customize their queries, over a rich but fixed set of outputs.
Finally, we hope that the data pipeline will also allow citizen scientists to more actively interact with the data they have collected, and to see it taken up into the statistical analyses and data visualizations. The general public could also benefit from a flexible wetland and waterbird portal, with the right information to aid their interpretation.
3. Input data
In South Africa, we have a number of long-running citizen science projects that help monitor waterbird populations throughout the country. At its core, BIRDIE leverages two bird-related datasets: the Coordinated Waterbird Counts (CWAC, FIAO, 2022) and the second phase of the South African Bird Atlas Project (SABAP2, Brooks et al., 2022), which is part of the larger African Bird Atlas Project (ABAP). These datasets have well-established citizen scientist support and offer information about: (1) bird abundance, with waterbird counts taken twice a year at 731 water bodies across Southern Africa (mostly South Africa) since 1992, and (2) species occurrence, with visits to a grid of pentads (5′ × 5′ grid cells) initiated in 2007 and covering several African countries.
The Coordinated Waterbird Counts project provides regular counts of all waterbirds at just over 700 sites throughout South Africa. Counts are predominantly conducted by field observers from a set of observation points defined for each site, and that are visited twice a year; although in some sites other types of counts, such as count by boat, are also used (FIAO, 2022). The project was launched in 1992 and since then, it has accumulated a long time series for many sites. However, not all sites have been monitored since the start of the project, some regions are better represented than others, and not all sites have been monitored continuously (Figure 2). Waterbird species have diverse habitat requirements and life histories; some use the same sites year-round, whereas others are migratory or undergo local movements. To capture this diversity, CWAC counts are carried out twice per year: once in mid-summer and once in mid-winter. Although counts incorporate errors due to imperfect waterbird detection by observers, with appropriate statistical analyses, they can reveal long-term temporal trends and seasonal fluctuations in waterbird populations.
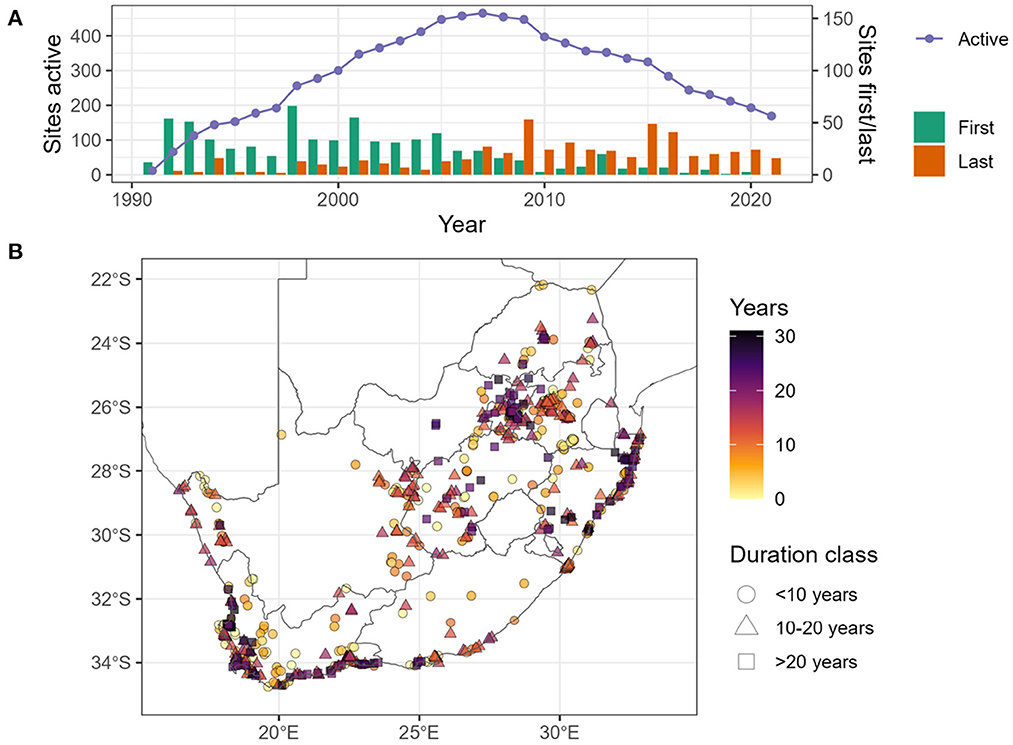
Figure 2. The graph (A) shows, the number of CWAC sites active (purple dots and line), number of sites firstly counted each year (green bars) and number of sites last counted each year (orange bars), between 1991 and 2021. Note that some of the sites that were last counted before 2021, might be counted again in the future, so orange bars do not represent sites removed from the programme. In map (B), we show the spatial distribution of CWAC sites in South Africa. The color gradient represent the duration of the period the site was counted for. To aid visualization, we show different shapes for different duration categories.
ABAP offers occurrence, rather than abundance data. In ABAP, volunteers collect checklists of all birds observed over a grid of pentads (5' × 5' minute grid) covering different African countries (Brooks et al., 2022). We are currently restricting our analysis to South Africa, and therefore we are using the SABAP2 component of ABAP (Figure 3). However, we plan to expand BIRDIE's functionality to cover other countries contributing data to ABAP, such as Kenya or Nigeria. Under the SABAP2 protocol, which started in 2007, observers need to spend at least 2 h of intensive birding at a pentad and are asked to visit as many habitats within it as possible. They can add new species for up to 5 days. SABAP2 currently has ca. 17 million records, and >2 million records are added per year. The structured sampling protocol, together with the spatial and temporal extent of SABAP2 allow us to examine how bird distributions are changing over time, although statistical modeling is required to account for imperfect detection and spatial sampling biases (Figure 3).
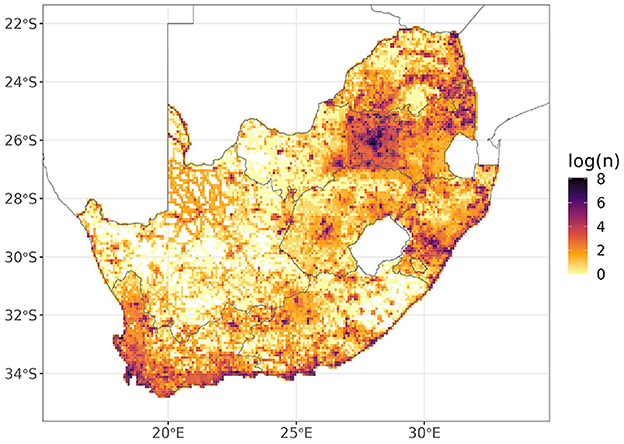
Figure 3. Number of SABAP2 cards recorded for the South African pentads between 2008 and 2021, in logarithmic scale. We can see how areas close to large cities in the Western Cape and Gauteng provinces, accumulate larger efforts. We can also appreciate sampling biased toward roads, particularly in the northwest of the country.
There are a variety of other data sources that BIRDIE uses for adding environmental information into its analytical workflows. Most of these data sources are conveniently accessed through Google Earth Engine, such as TerraClimate (Abatzoglou et al., 2018), the JRC surface water dataset (Pekel et al., 2016), MODIS Vegetation Indices (Didan, 2015), and Digital Elevation Models (DEM, Yamazaki et al., 2017). Other data not yet available on Google Earth Engine, such as the National Wetland Map (van Deventer et al., 2020) are managed independently.
4. Indicators and statistical methods
Capturing good quality raw data is a fundamental first step to monitor the state of biodiversity. However, raw data reflect not only the biological signal of interest but also the sampling process, which is typically spatially biased and subject to imperfect detection (Yoccoz et al., 2001). Therefore, some level of statistical analysis is required to estimate the state of the system of interest, and separate it from observational artifacts introduced by the observation process used for capturing the data (Yoccoz et al., 2001; Gimenez et al., 2014; King, 2014). The BIRDIE pipeline broadly uses two types of models: (1) occupancy models (MacKenzie et al., 2002; Altwegg and Nichols, 2019) to estimate the probability of a species being present at the different SABAP2 pentads, and (2) state-space models (Buckland et al., 2004; Newman et al., 2014) to estimate the number of individuals at the sites monitored by the CWAC programme. Contrary to raw observations (counts and detection/non-detection of a species), model-based estimates (abundance and occupancy probabilities) allow us to quantify uncertainty.
The variety of end-user needs requires a pipeline that provides waterbird population indicators at multiple spatial and temporal scales. Therefore, in addition to estimating basic occupancy and abundance at small scales (i.e., individual site/pentad), the BIRDIE pipeline produces other high-level indicators obtained by aggregation (Table 1). The idea is to follow a process whereby raw data are used to inform models that estimate indicators at the smallest temporal and spatial scales possible, and then to aggregate these estimates at larger scales, as required. For example, species abundance can be estimated for a set of regularly monitored wetlands in South Africa, and these site-specific estimates can then be combined to calculate an abundance index for all sites as a group. We can follow this procedure to estimate abundance and occupancy probabilities at national, regional and local levels, as well as for specific groups of wetlands (e.g., designated Ramsar sites, estuaries, or artificial sites).
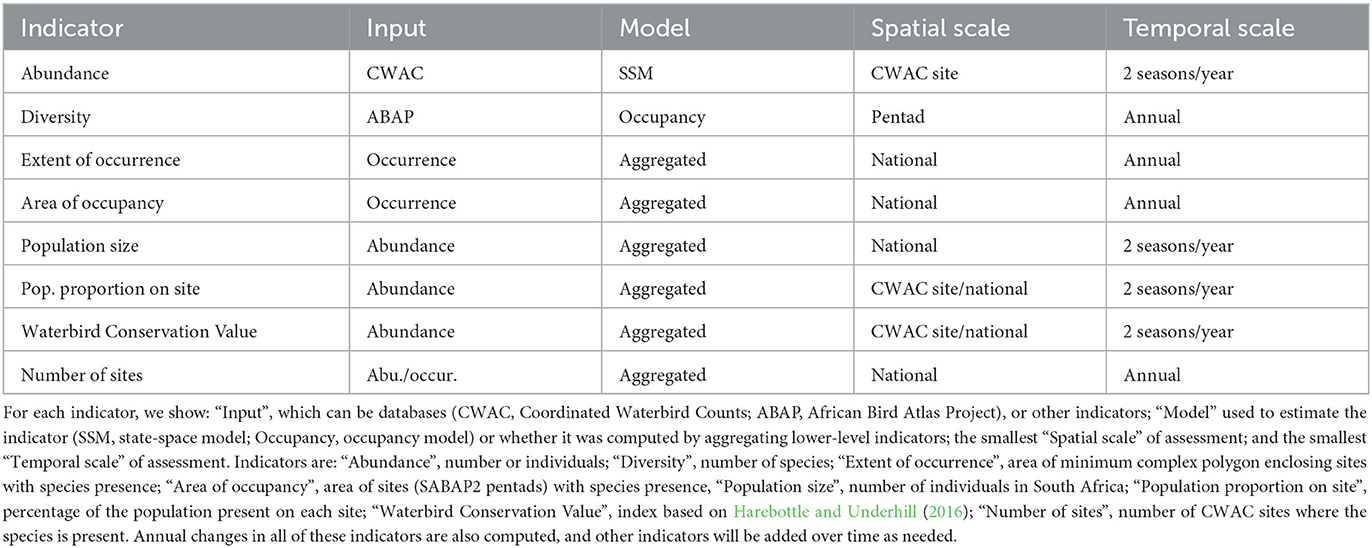
Table 1. Main indicators produced by the BIRDIE pipeline for waterbird species.
The main indicators computed by the BIRDIE pipeline for waterbird species are:
• Abundance: estimated for CWAC sites in two seasons per year. For each species, only those wetlands with at least a 10-year coverage between 1997 and 2021 are analyzed statistically.
• Occurrence: estimated for ABAP pentads on an annual basis.
• Diversity: the simplest and most easily understood metric is species richness. Species richness can be calculated based on the occupancy analysis, by summing occupancy probabilities of all species potentially present in each pentad, to estimate the expected number of species present.
• Important records: sightings of rarities, invasive species. Although this information does not require any statistical processing, it does make particular records more visible.
In addition to estimates of static indicators, the pipeline also estimates their associated dynamics, such as: changes in abundance, occupancy probabilities and diversity. The temporal reference for these dynamics can also vary ranging from a single season to multiple years (typically ca. 5 years, for short-term changes, and ca. 15 years for long-term changes).
It is important that uncertainty is correctly propagated when aggregating, and also when estimating dynamic indicators. We work in a Bayesian framework and use the posterior distribution of occupancy probabilities and species abundance to define indicators at the various scales. Working with full posterior distributions allows us to conveniently keep track of the uncertainty in the estimates used as building blocks for other derived indicators.
4.1. Delineating species distributions
Occupancy models are fitted to detection/non-detection data from SABAP2 to delineate the distribution of waterbird species and its dynamics over time. Within the SABAP2 framework, observers visit pentads and make a list of the bird species detected during the visit. We assume that observers identify species correctly and only list species observed (the rigorous vetting process of SABAP2 data justifies this assumption), but non-detections may be caused by either species not being present in the pentad or by observers not being able to detect them, when present. Therefore, occupancy models describe two processes simultaneously: (i) the underlying occupancy of the sites (pentads), and (ii) the observation process whereby species present might or might not be observed.
More precisely, we define zjt to be the true occupancy of site j in year t, which can be 1 (if species present) or 0 (if species absent) and has distribution:
where ψjt is the occupancy probability at site j and year t. The logit transformation of ψjt can be modeled as a linear combination of covariates and smooth functions of covariates, such that:
where fk(ujk) is a smooth function of the covariate uk, which is defined as
where the smooth function f is represented by a set of L basis functions Bl evaluated at the value of the covariates associated with site j at year t (Wood, 2006).
We can then write the likelihood of observation yij as:
The probability of detection of a species that is present in site j on visit i is denoted by pij. Following the same logic as for the probability of occupancy, the logit transformation of p is modeled as a linear combination of covariates and smooth functions:
Spatial, spatio-temporal, and unstructured random effects can be specified for either occupancy or detection probabilities to account for variation across sites, observers and visits, not accounted for by the covariates incorporated in the models.
Each checklist is treated as an independent survey, but occupancy is assessed on a yearly basis. This means that if a species is detected in any one survey it is considered present that year. Therefore, missing a species because it left the site is considered part of the observation process and not the occupancy process. Migratory birds, for example, are considered present at a site even if they are only there for part of the year.
We are fitting single-season occupancy models without spatial random effects to most species. However, all models incorporate random effects to account for pentad- and observer-specific detection probabilities. If model diagnostics indicate poor model fit (see Section 4.3 below), we assess models individually to understand the reasons, and if necessary we add spatial random effects for occupancy probabilities with an exponential decay function. Currently, we fit the models in R (R Core Team, 2022), in a Bayesian framework using the package spOccupancy (Doser et al., 2022), and running three MCMC chains for 20,000 iterations, with a thinning interval of 20. We use non-informative priors for all parameters when no information from other years is available, but we incorporate information obtained from other model fits if available, by centering the priors on the closest model's posterior means. However, it is important noticing that modeling details may differ among species and may be updated in future versions of BIRDIE.
4.2. Estimating abundance and population trends
State-space models (Buckland et al., 2004; Newman et al., 2014) are used to describe and understand dynamic systems that may not be perfectly observed. Within this framework, we consider waterbird abundance to be a process that evolves over time, and which we observe during visits to CWAC sites. However, counts conducted by observers are distorted by imperfect detection that translates into counting errors. By counting repeatedly over time, and assuming that abundance evolves smoothly over time compared to observation error, we can disentangle these two processes.
We consider that the observed counts (yi) at sampling occasion i (generally there were two sampling occasions per year, one in mid-summer and one in mid-winter), at any given site, arise from a Poisson (λi) distribution
And we model the log of the intensity λi as:
where μiis the mean abundance of waterbirds present at a site on sampling occasion i and σ2 is the corresponding variance of the observers counting error, both in the log scale. Therefore, counts depend both on the number of waterbirds present on site, and on errors in the counts of these birds.
To model changes in waterbird abundance between the two-seasons of year t, we define st to be the summer abundance and wt the winter abundance. Note that there might be multiple counts in a single year and season, but the underlying true abundance is considered to stay constant in any given year and season (for clarity, note also that while sampling occasions were indexed by i, years are indexed by t). Thus, the expected (log) abundance for any given count can be written as
where “summer” is an indicator variable that takes on the value 1 in summer and 0 in winter, and “winter” is the opposite. We then define abundance dynamics as:
where βt corresponds to the change in summer abundance from year t − 1 to year t, and ξt is the difference between summer and winter abundance, both in the log scale. If exponentiated, these parameters can be interpreted as the rate of change in the population and the winter-to-summer ratio of the population, respectively.
We impose relatively smooth changes in abundance by defining autocorrelation in βt and ξt terms over time. In addition, we define relationships between the rate of change in the population βt and environmental covariates. These relationships facilitate the estimation of abundance for those years in which counts are missing, and it is particularly useful to contain uncertainty in long periods with missing data between counts. Thus, we set
where ϕ lies between zero and one, and it defines an autoregressive term on βt−1; ηt captures the effect of covariates in the expected change in abundance, and can be expanded to γ⊺U, where U is a matrix of covariate values and γ a vector of coefficients; ζt and ϵt are random variables that represent change in abundance change, and change in winter to summer ratio, respectively.
We mentioned at the beginning that this model applies to each monitored site. However, we have multiple sites, and counts are often missing for some seasons or even full years. To facilitate the estimation of abundance with missing data, we borrow information from sites with counts, by defining a hierarchical structure such that:
Therefore, random changes at any site and year come from a common distribution of changes across all sites for that year. We thus ensure that variation is contained within similar values in most sites. These distributions are normal with variances and for changes in abundance and winter to summer ratio, respectively.
We fit these models in R (R Core Team, 2022) with the additional functionality provided by JAGS (Plummer, 2003) using the package jagsUI (Kellner, 2021). We work on a Bayesian framework, using non-informative priors, and running three chains for 10,000 iterations each. Similar to the occupancy models, these are the details of the models we are working with at the time of writing, and they are intended to give an idea of the type of model we are using. The modular nature of BIRDIE allows us to update these models when necessary and the updated modeling details will be published on the BIRDIE website.
4.3. Data and model diagnostics
The pipeline needs to run for a multitude of species, with different ecological requirements and geographical distributions. Therefore, finding a model that suits all species is challenging. Not only may a model not be a good fit for a particular species, but the algorithms used for fitting the model may fail to converge due to characteristics of the data.
In a first control stage, we have defined the minimum requirements that the data should meet to enter the model-fitting process. Species that have been observed in five or less pentads in a year are considered to not have enough data to inform an occupancy model. Similarly, we chose only those CWAC sites where the species of interest has been counted at least ten times between 1993 and 2021, to fit state-space models. Otherwise, data tend to be too sparse to assess trends in abundance reliably. These thresholds are based on our own experiences working with these data, and they are considered to be the minimum requirements for models to converge successfully. However, meeting these requirements does not guarantee model convergence or a good fit. To keep track of potential issues arising during model fitting, and to improve the algorithms of the pipeline, each time the pipeline runs it generates several reports that are later examined.
To decide whether any occupancy or state-space model converges, we calculate the Gelman-Rubin (Rhat) diagnostic (Gelman et al., 2014) for each estimated parameter. These diagnostics are then tabulated and stored for future revision. Any Rhat value above 1.1 or below 0.9 is considered to represent lack of convergence. Distinctive characteristics of the models with convergence issues are explored and addressed on a case by case basis, after the pipeline has finished running.
In addition to convergence, we assess goodness of fit using posterior predictive checks (Gelman et al., 2014; Doser et al., 2022). This procedure compares some quantity of interest calculated using pseudo-data simulated from the model posterior distribution, with that same quantity calculated from the observed data. In a well-fitting model we would expect real and synthetic data to produce similar values. For occupancy models, we produce simulated detection/non-detection data for each site, species and year and compute the expected number of detections out of as many visits as there were in the data. We compare the results of the simulations with the observed number of detections recorded in the data using Chi-square tests (Doser et al., 2022). For state-space models we follow a similar procedure, but instead of simulating detection/non-detection data for 1 year, we simulate count data for summer and winter, and aggregate these in a single annual count. Results from the goodness of fit Chi-square tests are also tabulated and stored for revision. Significant deviations detected with these tests are addressed for each case individually.
Due to the computational burden of the pipeline, it is not possible to run multiple models for each species, site and year, to perform model selection. Therefore, model selection is performed on a sample of species, selected to have representation of common and scarce taxa, but that are otherwise selected arbitrarily. Our general approach has been to include a rich set of variables that we believe can explain the main environmental gradients within our geographical range, without paying too much attention to multi-collinearity and overfitting. We are therefore cautious about making causal inference or predictions outside of the range of the data, and so should be other users.
5. Systems and technology
In this section, we describe the technology that underpins the flow of data along the pipeline until it is transformed into indicators that are presented to the BIRDIE user. BIRDIE's data, code and outputs are stored and run on three main systems (Figure 4): the Africa Bird Data servers, and the two BIRDIE servers (servers A and B).
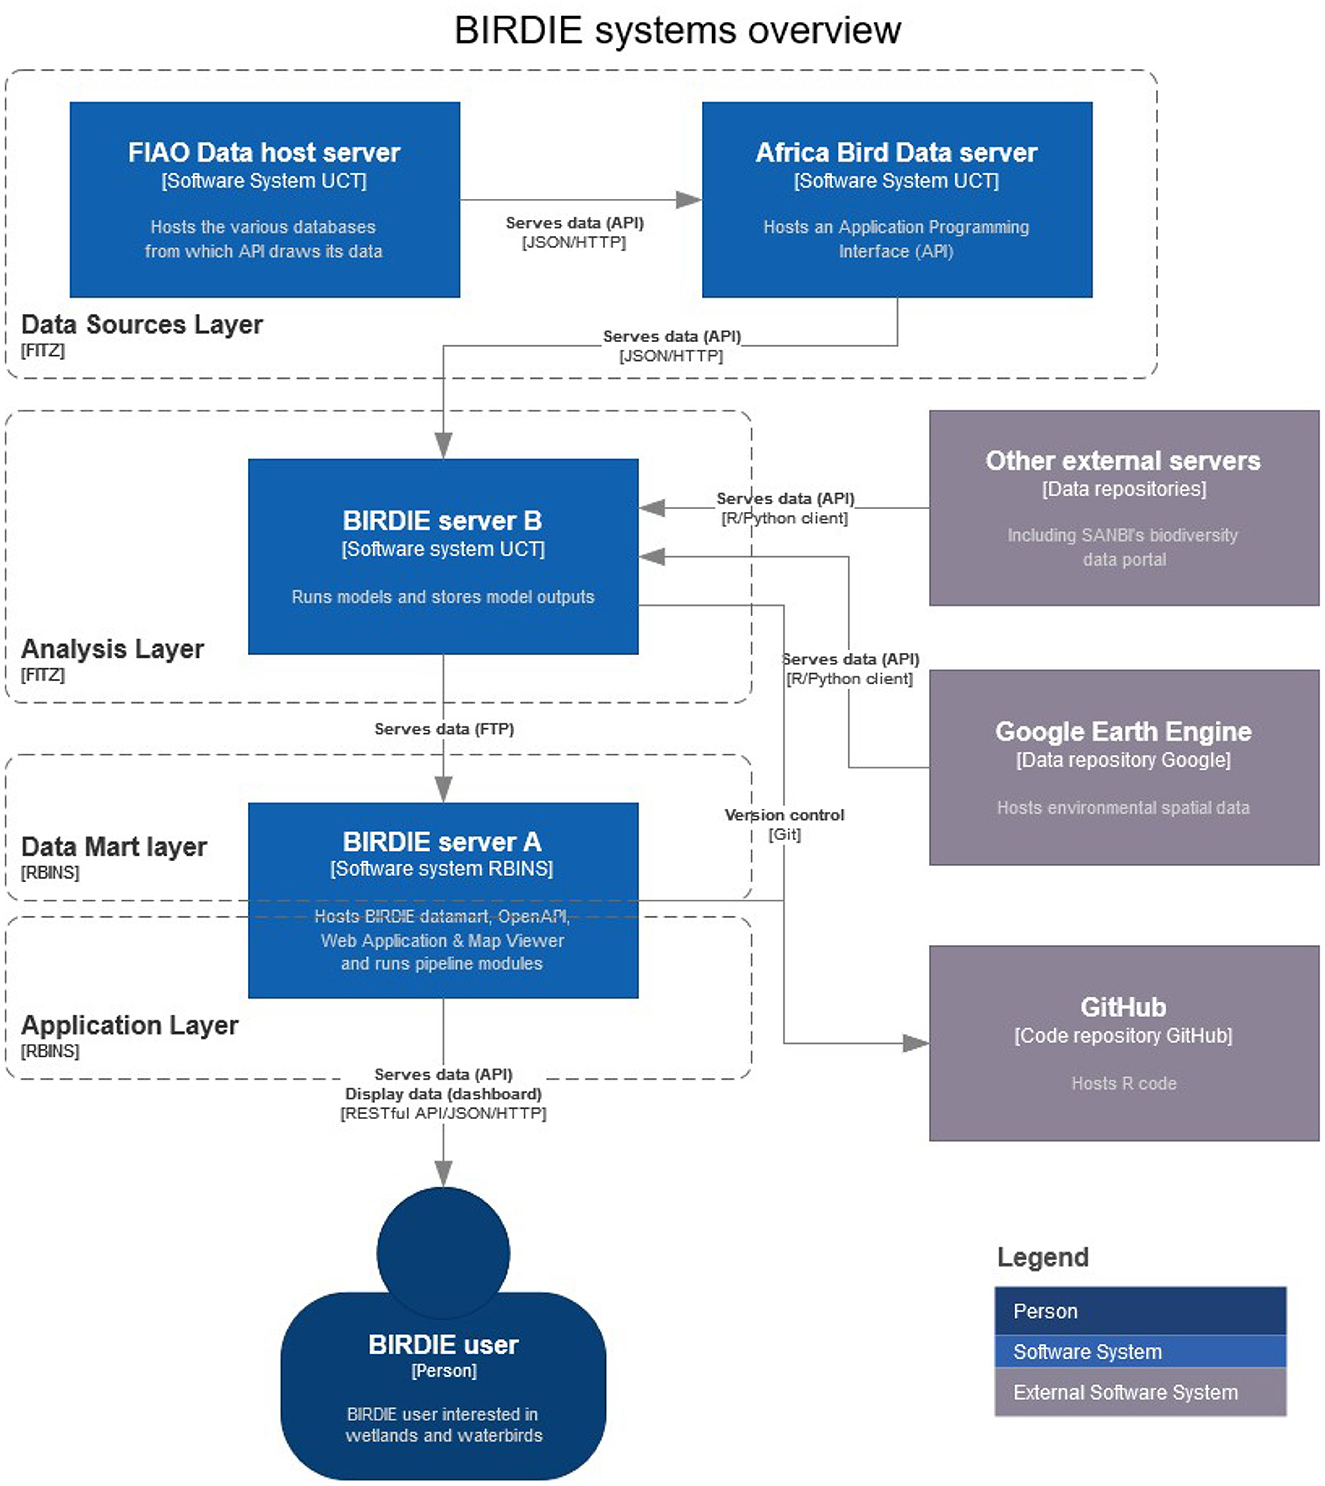
Figure 4. Overview of BIRDIE's server architecture. Data flows from CWAC, ABAP, and other external servers into BIRDIE server B to be processed and analyzed by the R modules, then these outputs move into the data mart in BIRDIE server A, which is the gateway for the dashboard and the final users (figure produced with www.diagrams.net).
The Africa Bird Data servers are hosted at the FitzPatrick Institute for African Ornithology, University of Cape Town, and contain the CWAC and ABAP databases. They also serve these data through an Application Programming Interface (API).
BIRDIE's server A is the access point of the final user to the information generated by the pipeline. This information is stored in a data mart, which in essence, is a MySQL database (version 8.0.27), a widely used, open source, relational database management system. Its main objective is to store the outputs of BIRDIE's data analyses and provide easy and flexible access to the final user. At the same time, the structure of the database ensures that inputs and outputs conform to a given standard, and creates security back-ups for the stored data. The main mechanism BIRDIE uses to present data to the user is through OpenAPI web services (OpenAPI Specification, Version 3.1.0), which was designed to provide a standard interface for documenting and exposing APIs. The public web services offered by the OpenAPI give users the flexibility to access and download data from the database without being constrained by the specific functionality of a web application. This technology facilitates the integration of BIRDIE's outputs into other workflows. However, for the user that is interested in readily accessing the information through a dashboard, we have deployed a web application, written in HTML5, CSS, and the most common and popular JavaScript libraries, including OpenLayers (https://openlayers.org/) and Plotly (https://plotly.com/). Among other elements (see Section 6), the web application features a map viewer, based on mviewer (https://mviewer.netlify.app/en/), a free and open-source cartographic application, that has an easy-to-use and intuitive interface.
If we thought of server A as being the face of the pipeline, server B would be the brain. All the functionality in this server revolves around statistical modeling. This server connects with the Africa Bird Data servers to obtain CWAC and ABAP data, and with other external systems, such as Google Earth Engine or SANBI servers to obtain environmental information. It then runs the main analytical modules of the pipeline, where occupancy and state-space models are fitted. At the time of writing, the analytical workflows were supported by an Intel Xeon Dual 8 core, with 64 GB RAM and an 8 TB hard drive. The model outputs are made available to server A, where they are incorporated into the data mart, used to compute derived high-level indicators by aggregation (see Section 4), and prepared to be presented to the final users.
In terms of code structure, the BIRDIE data pipeline consists of several fundamental building blocks or modules. The first module, which we call the data source layer (Figure 4) hosts and curates the raw data. The second module, the analysis layer, analyses the data and estimates the fundamental quantities of interest, like abundance and occurrence of each species at each wetland or pentad. The third module consists of the data mart where the outputs of the analyses are stored and indicators are aggregated or disaggregated to multiple scales. The final module serves the information to the user via APIs, web services and a web application. The modular structure of BIRDIE enables us to maintain and update individual parts independently. For example, we could replace the current statistical routines with more efficient ones without changing the other parts of the pipeline. Or we could add new indicators to the data mart layer without needing to change the statistical routines that produce the underlying components.
6. Web application
To cater for different user needs, BIRDIE's web application offers four main menus that provide access to the pipeline outputs in different ways (see Figure 5):
1. An exploration map. Through this menu the user can explore the different indicators BIRDIE computes on a map. This spatial framework can be configured to display information layers, such as occupancy probabilities for ABAP pentads or waterbird abundance at CWAC sites. Users can also zoom in and out to find the scale that best fits their needs. In addition to this, there are also environmental layers that can be overlaid to provide context and generate hypotheses on what might be driving the observed indicators.
2. Site and species summaries, are detailed reports elaborated for users focused on some sites or species in particular, rather than in general exploration. At the moment, site summaries are only available for those sites that have sufficient CWAC data to be included in BIRDIE's data analysis step. These reports contain a description of the site/species, links to other resources of interest (e.g., to criteria motivating declaration of Ramsar site or IUCN conservation status) and summaries prepared from BIRDIE's indicators. These reports can be exported as a document, and BIRDIE's data used for generating the reports can be accessed through the data mart and downloaded in common formats such as .json or .csv.
3. Reporting tools. We mentioned in Section 2 that BIRDIE was developed to support reports for national and international conservation programmes. In this menu, users interested in elaborating, or accessing the information underpinning these reports, will find this information conveniently packed in programme-specific summaries. Similar to site and species summaries, reports for conservation programmes can also be printed, and the data used to compute statistics and create plots can be downloaded.
4. Web services. Through this menu users can access BIRDIE's API and retrieve its outputs in the most flexible way. It is through BIRDIE's API that all maps and plots in the web application are produced. By accessing this functionality directly, users can download the data themselves and incorporate them into their own workflows.
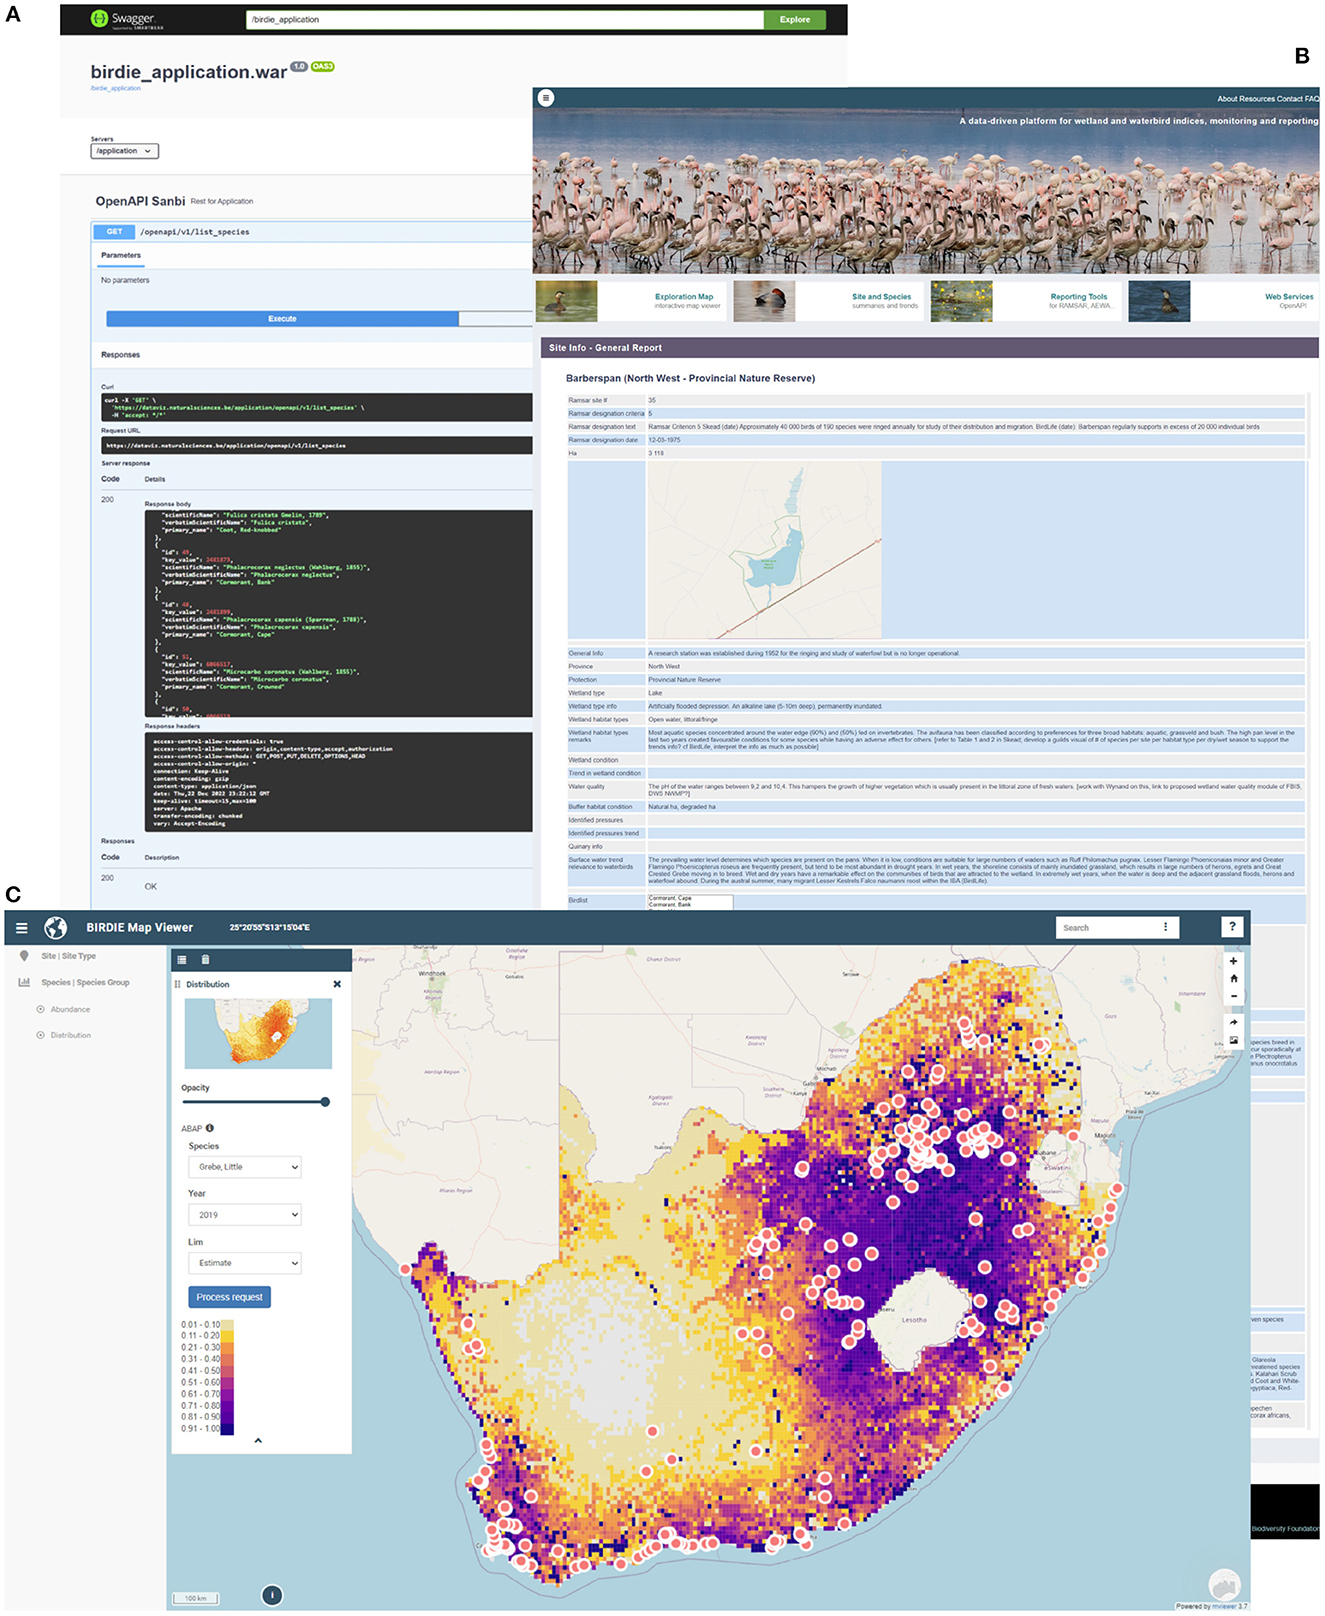
Figure 5. Basic elements of the BIRDIE web application: (A) the web services API offers a flexible framework to access the database, facilitating integration with other workflows and platforms, (B) bespoke reports for species, sites and conservation programmes and agreements such as Ramsar or AEWA, and (C) a map viewer that allows flexible exploration of the different BIRDIE indicators.
7. Discussion
Data on biodiversity and related environmental drivers are collected at increasingly faster rates. Although these data can be accessed to support decisions at various levels, it can be difficult for decision makers to extract relevant information in a timely fashion (Stephenson et al., 2017b; MacFadyen et al., 2022). Apart from data availability and accessibility, obstacles for using biodiversity data in decision-making include (Stephenson et al., 2017a; MacFadyen et al., 2022): lack of analysis and interpretation, lack of technical accessibility with excessive use of jargon, and timely use of data. Here, we introduce BIRDIE, the South African Biodiversity Data Pipeline for Wetlands and Waterbirds; a data pipeline that aims to provide the information needed for making evidence-based decisions on wetlands and waterbirds in southern Africa. Target users of BIRDIE include government and public entities that need to report on the status of wetlands and waterbirds, as well as site managers, and the general public (e.g., birdwatchers).
BIRDIE is the first African full biodiversity data pipeline (from raw data to indicators) that we are aware of at the time of writing. Although biodiversity data portals are proliferating (Saran et al., 2022), examples of fully operational workflows for computing and displaying biodiversity indicators are still scarce (but see Brlik et al., 2021; Boyd et al., 2022). Compared to other richer countries, long-term datasets from biodiversity monitoring programmes are still scarce in many African countries (Proença et al., 2017; Stephenson et al., 2017a). In South Africa we are lucky to have two good bird monitoring programmes that provide data on waterbirds. However, even these well established programmes can be hampered by lack of funds and qualified personnel in remote locations, as we can see by the decreasing coverage of the CWAC project in the last decade (Figure 2). Critical data on the location, structure and dynamics of freshwater ecosystems are still scarce and highly local. Thus, BIRDIE relies heavily on citizen science projects such as ABAP and CWAC, which poses clear challenges in terms of uneven efforts and imperfect detection, but also adds the advantage of having the support of a large community of observers that provides a continuous and steady flow of data. These data inputs allow us to run the pipeline periodically to keep the indicators updated and timely. Although we would like to update our indicators more often, at the time of writing we only update once per year due to the computational requirements of the pipeline, and certain characteristics of the data (e.g., CWAC counts are conducted only twice a year).
All data used by BIRDIE are freely available, so one of the main contributions of BIRDIE is to facilitate information uptake by statistically analyzing these data and filtering out observational artifacts introduced during data collection. Uneven sampling efforts, imperfect detection and missing data are all examples of how data collection methods can affect data (Yoccoz et al., 2001), and if undealt with, mislead decision making. Furthermore, statistical models also provide measures of uncertainty in their estimates, which must be clearly communicated to the stakeholders (Kissling et al., 2018). With all their benefits, these statistical analyses require technical knowledge and are time-consuming. Therefore, having their outputs pre-computed and readily available could dramatically increase the impact of the data. In this context, one of our main challenges was running models automatically and periodically for multiple species, which requires pre-defining and using similar models for all species. Therefore we faced a trade-off between having accurate models for individual species and having a pipeline that works reasonably well for all species in general. Users should keep in mind this compromise, and think of BIRDIE's outputs as useful approximations rather than accurate estimates. We recommend designing bespoke models for those species for which accuracy is required. Similarly, rare species are likely to appear too sparsely in datasets designed for monitoring common species for models to work well (Bellingham et al., 2020). For these species, we should design monitoring protocols and models that are tailored for them. Setting up feedback channels whereby users can suggest model improvements (e.g., relevant covariates) for certain species is a possible avenue for development in BIRDIE. However, in this first phase, the idea is to create a baseline pipeline in which the model structure is similar to all sites and species.
In addition, model structure was not designed for making causal inference and therefore confounders could mislead the user to believe that certain variables are driving emerging patterns, when there is only a correlation (Stewart et al., 2022). To avoid misinterpretation by the casual user, we favored displaying environmental layers that can overlay with model state estimations, rather than presenting marginal covariate effects estimated by the model. In future versions of BIRDIE, we might consider presenting this type of information in specific sections with extensive explanations on how to interpret it. The current version of BIRDIE has a portal that presents indicators that are easily accessed, visualized and interpreted, avoiding unnecessary jargon. At the same time, and for the interested user, we have allocated some space for clearly explaining the analytical routines used in all the analyses in dedicated sections. In BIRDIE, we followed the Findable, Accessible, Interoperable, Reusable (FAIR) principles (Wilkinson et al., 2016), making all processes reproducible and transparent. All the code used by the pipeline is public, freely available (https://github.com/AfricaBirdData) and based on open-source software.
In BIRDIE we envision several avenues for further development. Integration of multiple EBVs into a common assessment has important advantages for understanding drivers of change and designing conservation interventions (Bellingham et al., 2020). In the next phase, we intend to develop more profound links between waterbird population indicators and wetlands. Waterbirds are often regarded as good indicators of wetland biodiversity and condition. However, this assumption is rarely proven empirically, and it is apparent that it needs careful consideration on a case by case basis (Amat and Green, 2010). With advances in the accessibility to biodiversity data, we are now in a better position to investigate whether these claims hold, and if so, under which conditions. Data portals such as GBIF.org and in South Africa, the Freshwater Biodiversity Information System (FBIS), and SANBI's biodiversity data portal, could help us understand how waterbird occurrence, abundance and diversity relates to the general ecological condition of the hosting wetlands. However, we are aware that the integration of opportunistic data with different sampling schemes and scales poses additional challenges that we will need to carefully address (Kissling et al., 2018; Boyd et al., 2022).
We will also extend BIRDIE's functionality to cover other African countries with similar available data, such as Kenya and Nigeria that also use the ABAP protocol. There is also a wealth of information that BIRDIE has not yet used, such as eBird or iNaturalist, that could improve the outputs of the pipeline. While integrating data sources with different sampling designs, coverages and biases is not trivial, the modular design of BIRDIE allows us to update the modeling step as new statistical methods are being developed. Data integration is a very active topic in the field of statistical ecology (Isaac et al., 2020). Approaches to combining data range from pooling multiple data sources together disregarding their different assumptions and biases, to much more accurate integrated models in which characteristics of each data source are explicitly accounted for (Fletcher et al., 2019). Although at the expense of increased model complexity, with the application of newly-developed statistical methods for data integration, we can now explore how different species interrelate, and inform more effective and efficient conservation actions.
We wish BIRDIE can contribute to closing the existing gap between data providers and decision makers, facilitating effective conservation action. We also hope it will provide a feedback channel to SABAP, CWAC, SANBI's Freshwater Biodiversity Programme and other data providers. Not only serving as a platform to analyse the data collected, but also to investigate coverage deficiencies and potential new priorities. Finally, we would like to see that BIRDIE exposes the importance of existing monitoring programmes, and that it helps prioritize new data-driven initiatives to understand and protect freshwater biodiversity.
Data availability statement
Publicly available datasets were analyzed in this study. These data can be found here: https://sabap2.birdmap.africa/, https://cwac.birdmap.africa/, https://github.com/AfricaBirdData.
Author contributions
NJ was the project director. FC, RA, and VV developed the analyses of the pipeline. NJ, AS, and DH worked on reporting and indicators. FS and YS designed and implemented the data mart, APIs, web services and web application. MB managed the citizen science database. FC led the writing of the manuscript with contribution from all authors. All authors contributed to conception and design of the project. All authors contributed to the article and approved the submitted version.
Funding
This project was funded by the JRS Biodiversity Foundation, Grant Number 60908.
Acknowledgments
We are really grateful to other members of the BIRDIE team without whom this project would not be viable: Sediqa Khatieb, Monica Klass, and Carol Poole. We are also grateful for the support of the JRS Biodiversity Foundation, and to the many interested users that have engaged and shared useful insights with us. Finally, we would like to recognize the tremendous contribution of all the citizen scientists that devote their time and effort to collect the valuable data that we use.
Conflict of interest
The authors declare that the research was conducted in the absence of any commercial or financial relationships that could be construed as a potential conflict of interest.
Publisher's note
All claims expressed in this article are solely those of the authors and do not necessarily represent those of their affiliated organizations, or those of the publisher, the editors and the reviewers. Any product that may be evaluated in this article, or claim that may be made by its manufacturer, is not guaranteed or endorsed by the publisher.
References
Abatzoglou, J. T., Dobrowski, S. Z., Parks, S. A., and Hegewisch, K. C. (2018). TerraClimate, a high-resolution global dataset of monthly climate and climatic water balance from 1958–2015. Sci. Data 5, 170191. doi: 10.1038/sdata.2017.191
Altwegg, R., and Nichols, J. D. (2019). Occupancy models for citizen-science data. Methods Ecol. Evol. 10, 8–21. doi: 10.1111/2041-210X.13090
Amat, J. A., and Green, A. J. (2010). “Waterbirds as bioindicators of environmental conditions,” in Conservation Monitoring in Freshwater Habitats: A Practical Guide and Case Studies, eds C. Hurford, M. Schneider, and I. Cowx (Dordrecht: Springer), 45–52.
Barnard, P., Altwegg, R., Ebrahim, I., and Underhill, L. G. (2017). Early warning systems for biodiversity in southern Africa – How much can citizen science mitigate imperfect data? Biol. Conserv. 208, 183–188. doi: 10.1016/j.biocon.2016.09.011
Bellingham, P. J., Richardson, S. J., Gormley, A. M., Allen, R. B., Cook, A., Crisp, P. N., et al. (2020). Implementing integrated measurements of essential biodiversity variables at a national scale. Ecol. Solut. Evid. 1, e12025. doi: 10.1002/2688-8319.12025
Boyd, R., August, T., Cooke, R., Logie, M, Mancini, F., Powney, G., et al. (2022). An operational workflow for producing periodic estimates of species occupancy at large scales. EcoEvoRxiv [Preprint]. doi: 10.32942/osf.io/2v7jp
Brlik, V., Silarova, E., Skorpilova, J., Alonso, H., Anton, M., Aunins, A., et al. (2021). Long-term and large-scale multispecies dataset tracking population changes of common european breeding birds. Sci. Data 8, 21. doi: 10.1038/s41597-021-00804-2
Brooks, M., Rose, S., Altwegg, R., Lee, A. T., Nel, H., Ottosson, U., et al. (2022). The African bird atlas project: a description of the project and birdmap data-collection protocol. Ostrich 93, 223–232. doi: 10.2989/00306525.2022.2125097
Buckland, S. T., Newman, K. B., Thomas, L., and Koesters, N. B. (2004). State-space models for the dynamics of wild animal populations. Ecol. Model. 171, 157–175. doi: 10.1016/j.ecolmodel.2003.08.002
CBD (2022). Convention on Biological Diversity. Available online at: https://www.cbd.int/ (accessed December 22, 2022).
Convention on Wetlands (2021). Global Wetland Outlook: Special Edition 2021. Secretariat of the Convention on Wetlands, Gland.
Dallas, H., Shelton, J., Sutton, T., Tri Cuptura, D., Kajee, M., and Job, N. (2021). The Freshwater Biodiversity Information System (FBIS) –mobilising data for evaluating long-term change in South African rivers. Afr. J. Aquat. Sci. 47, 291–306. doi: 10.2989/16085914.2021.1982672
Didan, K. (2015). MOD13A2 MODIS/Terra Vegetation Indices 16-Day L3 Global 1km SIN Grid V006 [Data set]. NASA EOSDIS Land Processes DAAC. Available online at: https://doi.org/10.5067/MODIS/MOD13A2.006 (accessed February 28, 2023).
Doser, J. W., Finley, A. O., Kery, M., and Zipkin, E. F. (2022). spOccupancy: an R package for single-species, multi-species, and integrated spatial occupancy models. Methods Ecol. Evol. 13, 1670–1678. doi: 10.1111/2041-210X.13897
FIAO (2022). CWAC: Coordinated Waterbird Counts. Available online at: https://cwac.birdmap.africa/index.php (accessed December 21, 2022).
Fletcher, R. J., Hefley, T. J., Robertson, E. P., Zuckerberg, B., McCleery, R. A., and Dorazio, R. M. (2019). A practical guide for combining data to model species distributions. Ecology. 100, e02710. doi: 10.1002/ecy.2710
Gelman, A., Carlin, J., Stern, H., Dunson, D., Vehtari, A., and Rubin, D. (2014). Bayesian Data Analysis. Boca Raton, FL: CRC Press; Taylor and Francis Group.
Gimenez, O., Buckland, S. T., Morgan, B. J. T., Bez, N., Bertrand, S., Choquet, R., et al. (2014). Statistical ecology comes of age. Biol. Lett. 10, 20140698. doi: 10.1098/rsbl.2014.0698
Han, X., Josse, C., Young, B. E., Smyth, R. L., Hamilton, H. H., and Bowles-Newark, N. (2017). Monitoring national conservation progress with indicators derived from global and national datasets. Biol. Conserv. 213, 325–334. doi: 10.1016/j.biocon.2016.08.023
Harebottle, D. M., and Underhill, L. G. (2016). Assessing the value of wetlands to waterbirds: Exploring a population-based index at flyway and regional levels. Ostrich. 87, 7–21. doi: 10.2989/00306525.2015.1104396
Isaac, N. J. B., Jarzyna, M. A., Keil, P., Dambly, L. I., Boersch-Supan, P. H., Browning, E., et al. (2020). Data integration for large-scale models of species distributions. Trend. Ecol. Evolut. 35, 56–67. doi: 10.1016/j.tree.2019.08.006
IUCN (2022). International Union for the Conservation of Nature. Available online at: https://www.iucn.org/content/home-page (accessed December 22, 2022).
Jetz, W., McGeoch, M. A., Guralnick, R., Ferrier, S., Beck, J., Costello, M.J., et al. (2019). Essential biodiversity variables for mapping and monitoring species populations. Nat. Ecol. Evol. 3, 539–551. doi: 10.1038/s41559-019-0826-1
Kellner, K. (2021). jagsUI: A Wrapper Around “rjags” to Streamline “JAGS” Analyses. R package version 1.5.2. Available online at: https://CRAN.R-project.org/package=jagsUI
King, R. (2014). Statistical ecology. Annu. Rev. Stat. Appl. 1, 401–426. doi: 10.1146/annurev-statistics-022513-115633
Kissling, W.D., Ahumada, J.A., Bowser, A., Fernandez, M., Fernandez, N., Garcia, E.A., et al. (2018). Building essential biodiversity variables (EBVs) of species distribution and abundance at a global scale. Biol. Rev. 93, 600–625. doi: 10.1111/brv.12359
Mace, G. M., Barrett, M., Burgess, N. D., Cornell, S. E., Freeman, R., Grooten, M., et al. (2018). Aiming higher to bend the curve of biodiversity loss. Nat. Sustain. 1, 448–451. doi: 10.1038/s41893-018-0130-0
MacFadyen, S., Allsopp, N., Altwegg, R., Archibald, S., Botha, J., Bradshaw, K., et al. (2022). Drowning in data, thirsty for information and starved for understanding: a biodiversity information hub for cooperative environmental monitoring in South Africa. Biol. Conserv. 274, 109736. doi: 10.1016/j.biocon.2022.109736
MacKenzie, D. I., Nichols, J. D., Lachman, G. B., Droege, S., Andrew Royle, J., and Langtimm, C. A. (2002). Estimating site occupancy rates when detection probabilities are less than one. Ecology 83, 2248–2255. doi: 10.1890/0012-9658(2002)083%5B2248:ESORWD%5D2.0.CO;2
Newman, K. B., Buckland, S. T., Morgan, B. J. T., King, R., Borchers, D. L., Cole, D. J., et al. (2014). Modelling Population Dynamics: Model Formulation, Fitting and Assessment Using State-Space Methods. New York, NY: Springer.
Pekel, J.-F., Cottam, A., Gorelick, N., and Belward, A. S. (2016). High-resolution mapping of global surface water and its long-term changes. Nature 540, 418–422. doi: 10.1038/nature20584
Pereira, H. M., Ferrier, S., Walters, M., Geller, G. N., Jongman, R. H. G., Scholes, R. J., et al. (2013). Essential biodiversity variables. Science 339, 277–278. doi: 10.1126/science.1229931
Plummer, M. (2003). “JAGS: A program for analysis of Bayesian graphical models using Gibbs sampling,” in Proceedings of the 3rd International Workshop on Distributed Statistical Computing (Vienna).
Proença, V., Martin, L. J., Pereira, H. M., Fernandez, M., McRae, L., Belnap, J., et al. (2017). Global biodiversity monitoring: From data sources to essential biodiversity variables. Biol. Conserv. 213, 256–263. doi: 10.1016/j.biocon.2016.07.014
R Core Team. (2022). R: A Language and Environment for Statistical Computing. R Foundation for Statistical Computing, Vienna, Austria. Available online at: https://www.R-project.org/
Saran, S., Chaudhary, S. K., Singh, P., Tiwari, A., and Kumar, V. (2022). A comprehensive review on biodiversity information portals. Biodivers. Conserv. 31, 1445–1468. doi: 10.1007/s10531-022-02420-x
Skowno, A., Poole, C. J., Raimondo, D. C., Sink, K. J., Van Deventer, H., Van Niekerk, L., et al. (2019). National Biodiversity Assessment 2018: The Status of South Africa's Ecosystems and Biodiversity: Synthesis Report. South African National Biodiversity Institute, Department of Environment, Forestry and Fisheries, Pretoria.
South African National Biodiversity Institute (SANBI) (2023). Biodiversity Advisor. Available online at: http://biodiversityadvisor.sanbi.org/ (accessed December 21, 2022).
Stephenson, P. J, Brooks, T. M., Butchart, S. H., Fegraus, E., Geller, G. N., Hoft, R., et al. (2017b). Priorities for big biodiversity data. Front. Ecol. Environ. 15, 124–125. doi: 10.1002/fee.1473
Stephenson, P. J., Bowles-Newark, N., Regan, E., Stanwell-Smith, D., Diagana, M., Hoft, R., et al. (2017a). Unblocking the flow of biodiversity data for decision-making in Africa. Biol. Conserv. 213, 335–340. doi: 10.1016/j.biocon.2016.09.003
Stephenson, P. J., Ntiamoa-Baidu, Y., and Simaika, J. P. (2020). The use of traditional and modern tools for monitoring wetlands biodiversity in africa: challenges and opportunities. Front. Environ. Sci. 8, 61. doi: 10.3389/fenvs.2020.00061
United Nations (2022). Sustainable Development Goals. Available online at: https://sdgs.un.org/ (accessed December 22, 2022).
United Nations Environmental Programme (2022). AEWA: Agreement on the Conservation of African-Eurasian Migratory Waterbirds. Available online at: https://www.unep-aewa.org/ (accessed December 21, 2022).
van Deventer, H., van Niekerk, L., Adams, J., Dinala, M. K., Gangat, R., Lamberth, S. J., et al. (2020). National Wetland Map 5: An improved spatial extent and representation of inland aquatic and estuarine ecosystems in South Africa. Water SA. 46, 66–79. doi: 10.17159/wsa/2020.v46.i1.7887
Wetzel, F. T., Saarenmaa, H., Regan, E., Martin, C. S., Mergen, P., Smirnova, L., et al. (2015). The roles and contributions of Biodiversity Observation Networks (BONs) in better tracking progress to 2020 biodiversity targets: a European case study. Biodiversity 16, 137–149. doi: 10.1080/14888386.2015.1075902
White, E. P., Yenni, G. M., Taylor, S. D., Christensen, E. M., Bledsoe, E. K., Simonis, J. L., et al. (2019). Developing an automated iterative near-term forecasting system for an ecological study. Methods Ecol. Evol. 10, 332–344. doi: 10.1111/2041-210X.13104
Wilkinson, M. D., Dumontier, M., Aalbersberg, I. J., Appleton, G., Axton, M., Baak, A., et al. (2016). The FAIR Guiding Principles for scientific data management and stewardship. Sci. Data 3, 18. doi: 10.1038/sdata.2016.18
Wood, S. N. (2006). Generalized Additive Models: An Introduction with R, Chapman and Hall/CRC Text in Statistical Science. New York, NY: Chapman and Hall/CRC. doi: 10.1111/j.1467-985X.2006.00455_15.x
Yamazaki, D., Ikeshima, D., Tawatari, R., Yamaguchi, T., O'Loughlin, F., Neal, J. C., et al. (2017). A high-accuracy map of global terrain elevations: accurate global terrain elevation map. Geophys. Res. Lett. 44, 5844–5853. doi: 10.1002/2017GL072874
Yenni, G. M., Christensen, E. M., Bledsoe, E. K., Supp, S. R., Diaz, R. M., White, E. P., et al. (2019). Developing a modern data workflow for regularly updated data. PLoS Biol. 17, e3000125. doi: 10.1371/journal.pbio.3000125
Keywords: biodiversity informatics, citizen science, data pipeline, waterbirds, wetlands, species distribution, species abundance, diversity
Citation: Cervantes F, Altwegg R, Strobbe F, Skowno A, Visser V, Brooks M, Stojanov Y, Harebottle DM and Job N (2023) BIRDIE: A data pipeline to inform wetland and waterbird conservation at multiple scales. Front. Ecol. Evol. 11:1131120. doi: 10.3389/fevo.2023.1131120
Received: 24 December 2022; Accepted: 21 February 2023;
Published: 10 March 2023.
Edited by:
Sawaid Abbas, University of the Punjab, PakistanReviewed by:
Rakesh Bhutiani, Gurukul Kangri University, IndiaMichael Lorenzo Casazza, United States Geological Survey (USGS), United States
Kate Brandis, University of New South Wales, Australia
Muhammad Usman, University of the Punjab, Pakistan
Copyright © 2023 Cervantes, Altwegg, Strobbe, Skowno, Visser, Brooks, Stojanov, Harebottle and Job. This is an open-access article distributed under the terms of the Creative Commons Attribution License (CC BY). The use, distribution or reproduction in other forums is permitted, provided the original author(s) and the copyright owner(s) are credited and that the original publication in this journal is cited, in accordance with accepted academic practice. No use, distribution or reproduction is permitted which does not comply with these terms.
*Correspondence: Francisco Cervantes, Zi5jZXJ2YW50ZXNwZXJhbHRhJiN4MDAwNDA7Z21haWwuY29t