
94% of researchers rate our articles as excellent or good
Learn more about the work of our research integrity team to safeguard the quality of each article we publish.
Find out more
ORIGINAL RESEARCH article
Front. Ecol. Evol., 20 July 2023
Sec. Population, Community, and Ecosystem Dynamics
Volume 11 - 2023 | https://doi.org/10.3389/fevo.2023.1125775
This article is part of the Research TopicThe Impacts of Climate Change and Human Activities on the Structure and Function of Wetland/Grassland EcosystemsView all 18 articles
 Yuxin Sun1,2†
 Genghong Wu1,2†Mingjiang Mao1,2Xuanyu Duan1,2Jihan Hu1,2Yangyang Zhang1,2Yidan Xie1,2Xincai Qiu1,2
 Wenfeng Gong1,2*Tao Liu3*
 Tiedong Liu1,2*
Introduction: The plain marsh wetland ecosystems are sensitive to changes in the natural environment and the intensity of human activities. The Sanjiang Plain is China’s largest area of concentrated marsh wetland, the Small Sanjiang Plain is the most important component of the Sanjiang Plain. However, with the acceleration of the urbanization and development of large-scale agricultural reclamation activities in the Small Sanjiang Plain in Northeast China, the wetland has been seriously damaged. In light of this degradation this study examines the Small Sanjiang Plain.
Methods: From the four aspects of area, structure, function, and human activities, we try to construct a wetland degradation comprehensive index (WDCI) in cold region with expert scoring methods and analytic hierarchy process (AHP), coupled with network and administrative unit. The objective was to reveal the degradation of wetlands in Northeast China over three decades at a regional scale.
Results: The results showed that (1) the overall wetland area decreased between 1990 and 2020 by 39.26×103 hm2. Within this period a significant decrease of 336.56×10³ hm2 occurred between 1990 and 200 and a significant increase of 214.62×10³ hm2 occurred between 2010 and 2020. (2) In terms of structural changes, the fractal dimension (FRAC) has the same trend as the Landscape Fragmentation Index (LFI) with little change. (3) In terms of functional changes, the average above-ground biomass (AGB) increased from 1029.73 kg/hm2 to 1405.38 kg/hm2 between 1990 and 2020 in the study area. (4) In terms of human activities, the average human disturbance was 0.52, 0.46, 0.57 and 0.53 in 1990, 2000, 2010 and 2020, with the highest in 2010. (5) The composite wetland degradation index shows that the most severe wetland degradation was 49.61% in 2010 occurred between 1990 and 2020. (6) Among the severely deteriorated trajectory types in 2010–2020, mild degradation → serious degradation accounted for the largest area of 240.23×10³ hm2, and the significant improvement trajectory type in 1990–2000 accounted for the largest area of 238.50×10³ hm2.
Discussion: In brief, we conclude that the degradation of the Small Sanjiang Plain wetland was caused mainly by construction, overgrazing, deforestation, and farmland reclamation. This study can also provide new views for monitoring and managing wetland degradation by remote sensing in cold regions.
Wetlands are among the most important and valuable ecosystems on Earth (Dar et al., 2020). They play a critical role in protecting rare species and biodiversity, maintaining ecological balance, protecting water sources, regulating climate, and controlling soil erosion (Erwin, 2009; Myers et al., 2013). Moreover wetlands are one of the most important carbon reservoirs on Earth, absorbing huge amounts of atmospheric carbon dioxide and regulating regional climate (Sileshi et al., 2020; Slagter et al., 2020). However, studies have shown that up to 54% of the global wetland area has been lost since 1900 (Jie et al., 2021), and the severe situation of wetland degradation and area shrinkage has become globally recognized, with the natural environment and human activities often cited as the main drivers of wetland degradation (Rashid et al., 2022). In particular, the combined effects of human activities such as rapid urbanization and agricultural intensification have accelerated the shrinkage of natural wetland areas and the degradation of wetland ecological functions, seriously disturbing regional wetland ecosystems and increasing the vulnerability of wetlands (Liu et al., 2013; Dar et al., 2021). Therefore, it is of great importance for the sustainable development of the regional economy and environment to strengthen research on the characteristics of regional wetland degradation and its spatiotemporal patterns of change.
Wetland degradation assessment occupies an important position in the study of wetland restoration ecology, and is a fundamental work to carry out restoration and management of degraded wetlands. Initially, evaluation indicators were mainly focused on chemical and biological aspects (Van Dam et al., 1998), and as the understanding of ecosystem structure and function continued to improve, wetland degradation evaluation methods based on a variety of biological indicators, hydrogeomorphology, socioculture and policy factors gradually emerged (Miller and Wardrop, 2006; Gianopulos, 2018; Zekarias et al., 2021; Zhao et al., 2021) Currently, international studies on wetland degradation have mostly focused on the functional aspects of wetlands, mainly emphasizing the destruction of wetland functions and values by the impacts of human activities (Van Dam et al., 1998). Studies of wetland degradation in China have mostly focused on the dynamic processes of wetland degradation in time and space (Shen et al., 2019; Hu et al., 2020). However, most studies have neglected to combine the effects of human disturbance on the spatial and temporal patterns of regional wetland ecological degradation, ecosystem function and structure (Kotze et al., 2012; Behn et al., 2018; Niu et al., 2022). Therefore, under the background of human activity interference, it is particularly important to construct the unit, which combines the geographic grid with administrative division, to analyze the spatiotemporal differentiation of regional wetland degradation.
Multiband, multispectral, and high-resolution remote sensing technology and GIS have been widely used in monitoring wetland dynamics and to research the patterns and causes of wetland degradation (Held et al., 2003; Lhermitte et al., 2011; Houborg et al., 2015; Zhu et al., 2022). Some scholars have extracted the Land-Use/Land-Cover (LULC) databases based on remote sensing data and constructed remote sensing models to quantitatively and qualitatively explore and evaluate the spatial and temporal patterns of regional wetland shrinkage and degradation (Jiang et al., 2017; Lin et al., 2021; Cui et al., 2022). Cui et al. (2015) established a comprehensive model of wetland ecological degradation based on regional habitat succession and, combined with remote sensing images, proved that human disturbance and species invasion were the main causes of coastal wetland degradation in Jiangsu Province, China. Zhu et al. (2022) extracted the lake area, vegetation cover, and soil degradation from multitemporal remote sensing (TM, ETM and OLI) and constructed a new wetland degradation index to assess the degree of lake wetland degradation in the Bashang Plateau. Yang et al. (2021) used remote sensing and point of interest (POI) data to assess the ecological status of a wetland in Suzhou, China. It has been found that 3S technology (Geographic Information System, GIS; Global Positioning System, GPS; and Remote Sensing, RS) can accurately reveal the spatiotemporal variation in wetland ecological degradation across scales (Yin and Cheng, 2019). However, most studies have focused mainly on coastal wetlands from near-tropical to tropical regions. Due to the impact of different natural conditions and human activities, there is no unified evaluation index system to assess the dynamics and degradation of wetlands in cold areas, and there are relatively few studies on the spatiotemporal trends of wetland ecological degradation in cold areas.
Northeast China has the largest area of inland marshes in China, and thus, it represents a globally significant wetland region, particularly in relation to cold climate wetlands. The Sanjiang Plain in Northeast China is the largest and most concentrated, marsh wetland of its type in China (Luo et al., 2022). The wetlands of the Sanjiang Plain function to purify water, conserve soil, control pollution and provide habitat for wild animals and plants. The wetlands provide climate regulation, water conservation and flood disaster control in Northeast China, supporting industrial and agricultural production and people’s livelihoods. The region is also an important commodity grain base in China. Since the middle of the 20th century, under the dual influence of large-scale agricultural reclamation activities and regional natural environment changes in China (Yan, 2020). Natural landscapes such as grasslands, lakes, forests, and complex natural marshes were gradually transformed into single-structure sites, such as cultivated land (Liu and Ma, 2000). The reclamation of natural wetlands into paddy fields or dry fields leads to a significant decline in evaporation, an increase in the runoff coefficient, a downward trend in groundwater level in some areas, a weakening or loss of the “carbon sink” function and a transition into a “carbon source”, a decrease in CH4 flux and other negative effects. In the process of transforming from the “Northern Wilderness” to the “Northern Warehouse”, the wetland ecosystem has been severely damaged by wetland atrophy and degradation, and the plant community structure and function of degraded wetland have obviously changed, weakening the ecological function of the wetland (Chen et al., 2020).
The Small Sanjiang Plain is the most prominent area experiencing wetland ecological degradation within the Sanjiang Plain region. The regional natural ecosystem dominated by wetlands and grassland was gradually transformed into an agricultural ecosystem mainly consisting of farmland, and this change has resulted in a sharp shrinkage of the regional wetland area, land salinization, a decline in the area of landscape patches, and an increase in fragmentation (Wan et al., 2015). Furthermore, regional ecosystem stability and national food ecological security will be affected. Most current studies have focused on land use and landscape pattern change (Wan et al., 2015), the loss of ecosystem services (Chen et al., 2020) and biodiversity changes (Qu et al., 2022). However, there have been few comprehensive assessments of degraded wetlands in terms of wetland area, structure, and function in combination with human activity. Currently, there is no international standard methods or comprehensive index used to assess the degradation status of wetlands in the cold areas of Northeast China (Shen and Liu, 2021). Therefore, based on the wetland changes and human disturbance in the study area, this paper analyzes the spatiotemporal variation in long-term wetland degradation as well as the main causes of and the response mechanism to human disturbance activities. In so doing, the study provides a scientific basis for the ecological restoration of degraded wetlands and the promotion of the regional ecological security.
Based on the aforementioned background, this study focuses on the Small Sanjiang Plain and attempts to construct a wetland degradation comprehensive index (WDCI) for cold region wetlands based on four components of wetland character: area, structure, function, and human activities, to reveal spatial and temporal patterns in relation to the degradation status of the wetlands in the cold region of Northeast China at a regional scale. The specific research objectives were: 1) study the changes in the spatial distribution pattern of wetlands in the Small Sanjiang Plain and the mechanisms driving the observed spatiotemporal patterns; 2) construct a comprehensive index to assess the degree of wetland degradation due to human disturbance; 3) use the geo-atlas to develop a conceptual model describing spatiotemporal variation in wetland degradation; 4) explore the mechanisms linking wetland response to human activity and disturbance intensity over time; and 5) provide a technical reference and theoretical basis for the protection, restoration, and development and utilization of regional wetlands.
The Small Sanjiang Plain is located in the Sanjiang Plain north of the Wanda Mountains in Heilongjiang Province, China (nd) (46°20′40″~ 48°27′40″N, 129°11′20″~ 135°05′26″E). The total area is 4.55×10⁴ km2, with 78.4% plain region and 21.6% mountainous region. The overall topography is high in the southwest and low in the northeast (Figure 1). The Small Sanjiang Plain is an alluvial plain formed by the alluvial deposits of the Heilongjiang, Ussuri and Songhua Rivers. It is rich in freshwater marshes and wetlands. Its annual precipitation ranges from 500 to 600 mm. The soil air permeability is between 0.0013 and 0.00066 cm s−1. Due to abundant rainfall and special soil characteristics, a large area of wetlands has formed in this area (Liu et al., 2016). The Small Sanjiang Plain is also listed as a major wetland reserve in Asia and China, with several nature reserves, such as the Sanjiang Nature Reserve and Honghe Nature Reserve (Luo et al., 2022).
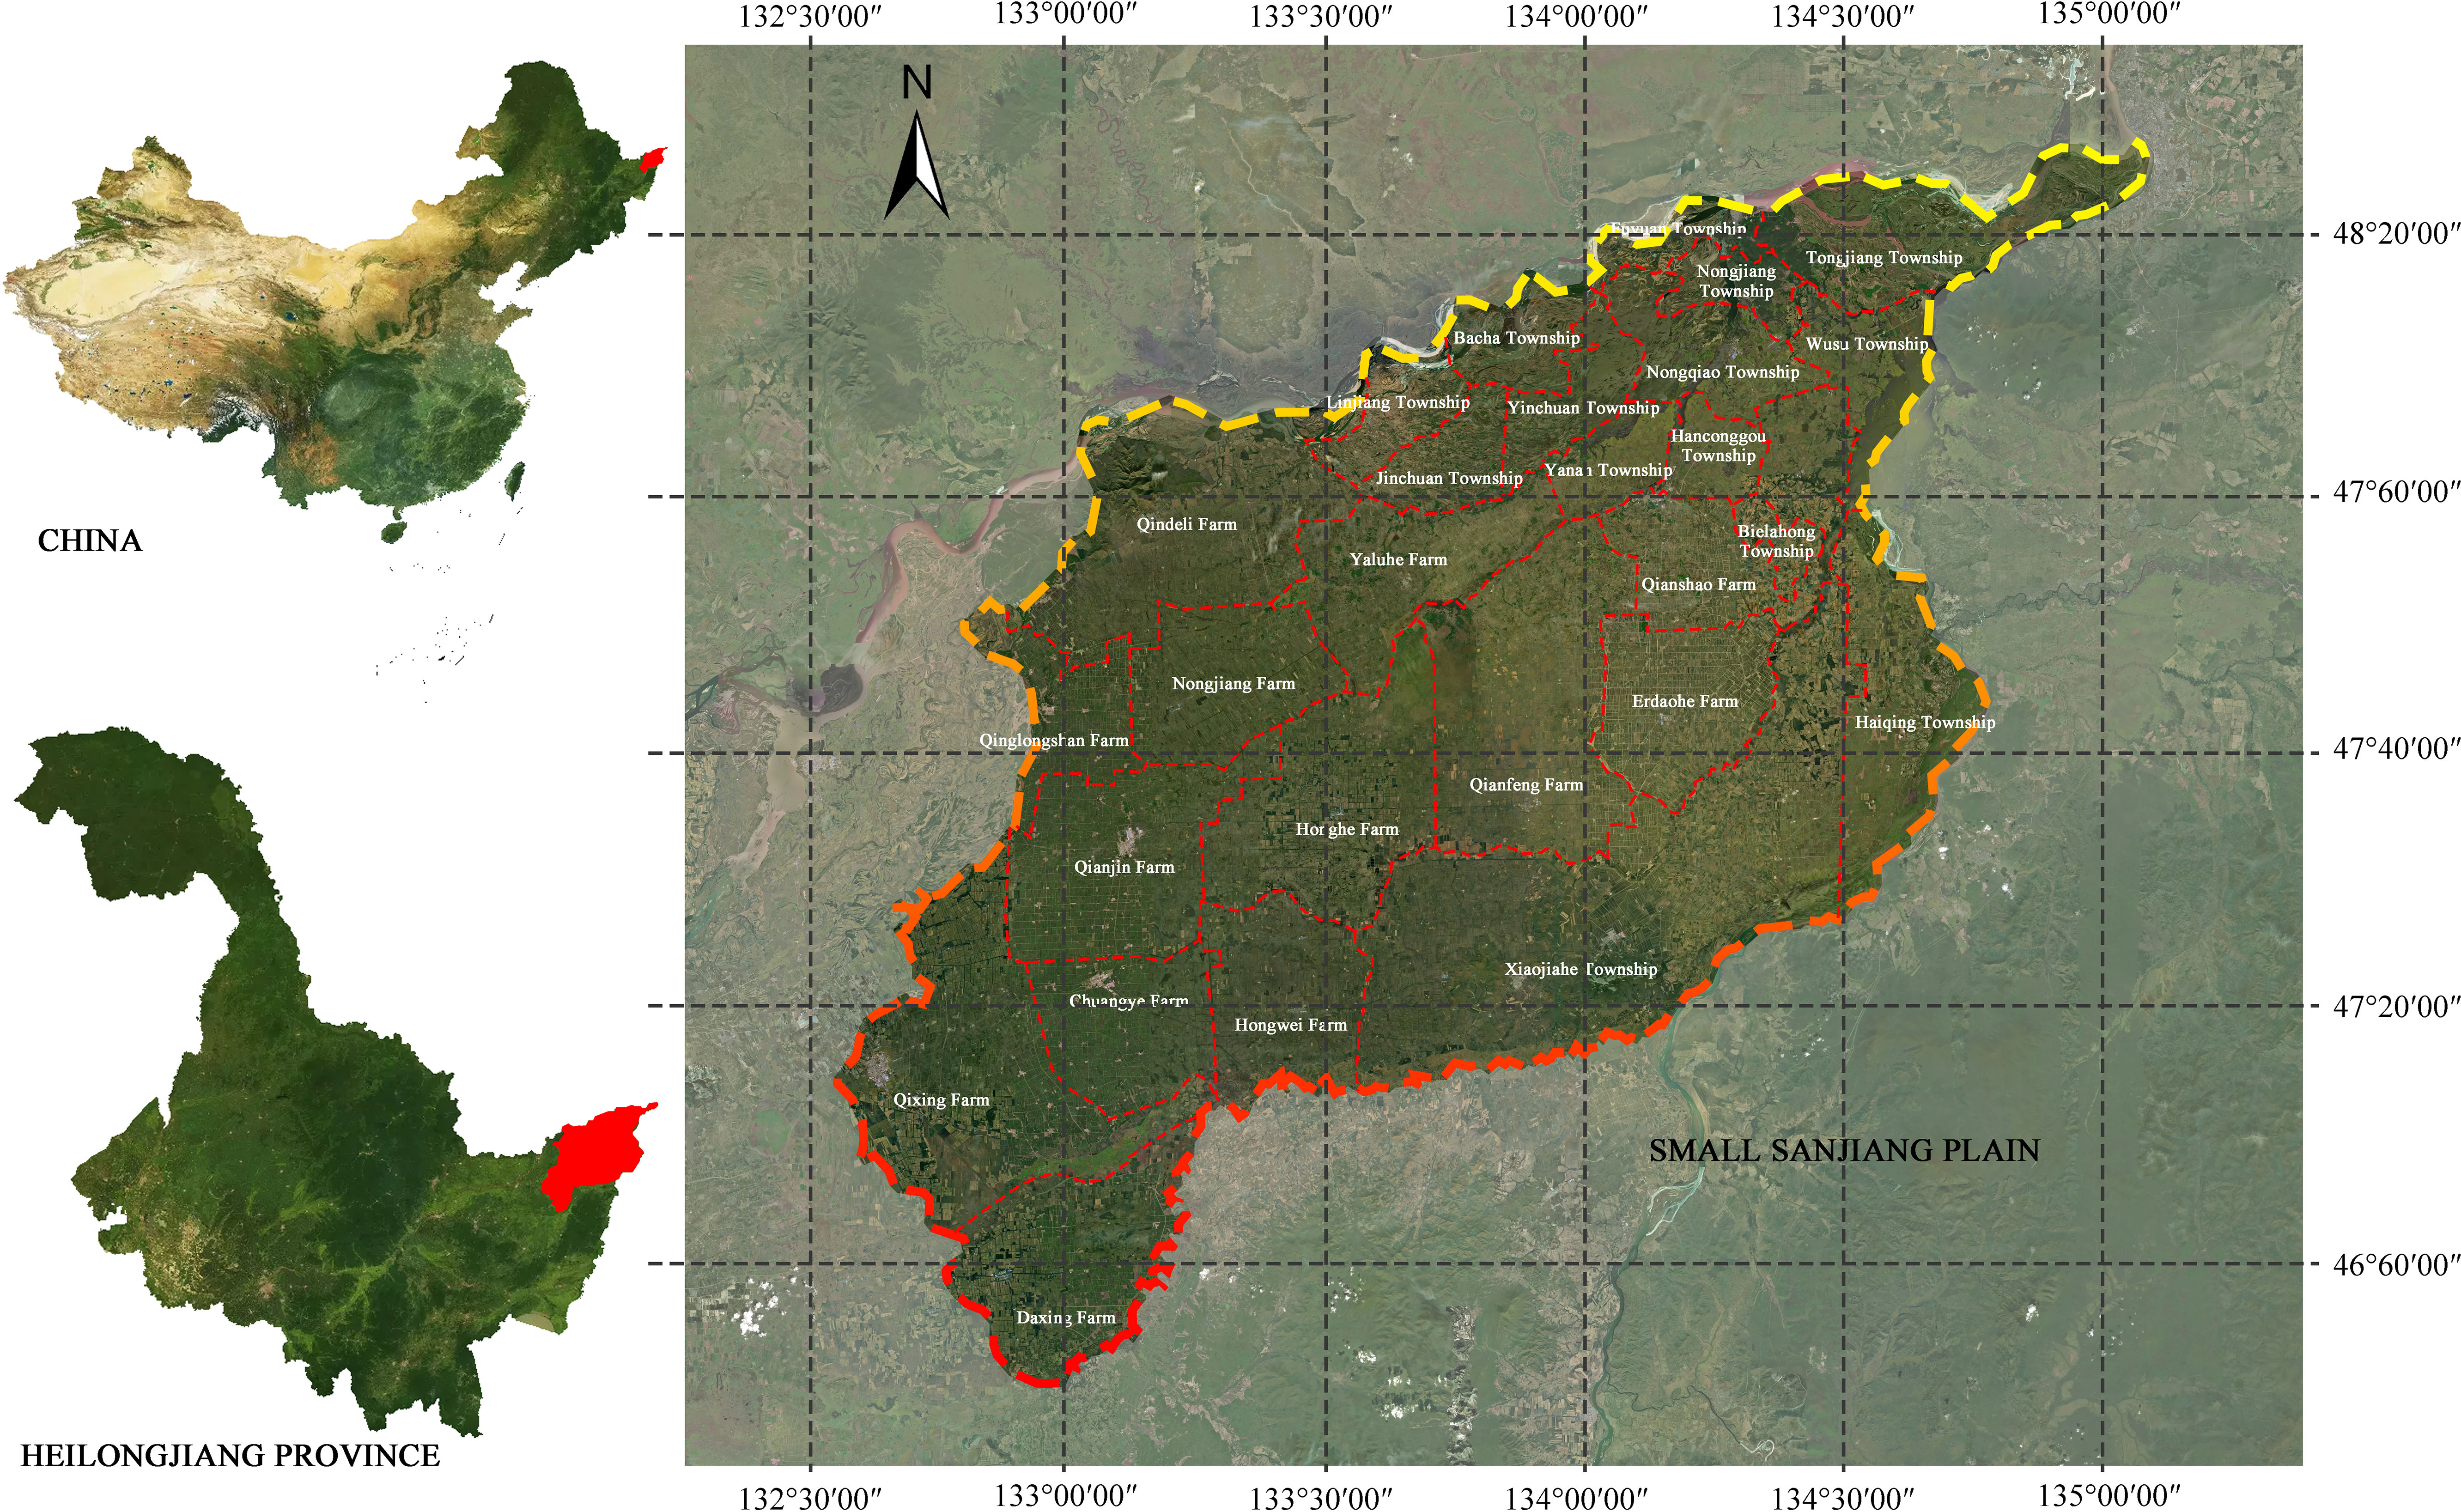
Figure 1 Location of the Small Sanjiang Plain Region in Heilongjiang Province.
In this study, the satellite remote sensing data of Landsat 5 (1990, 2000 and 2010) and Landsat TM8 (2020) were used as the main data source (30 m×30 m), and both were from the geospatial data Cloud platform (https://www.gscloud.cn/). Remote sensing data were selected from mid-May to mid-September. Remote sensing images in this period have high quality, zero or very few clouds, and meet the requirements of reflecting surface information to the maximum extent (Wang, 2021).
Other data mainly included 1:50,000 topographic maps, drainage maps, hydrogeological maps, some soil distribution maps, geomorphological maps, some field survey data, some land use maps, and administrative division maps of state farms in the study area, which were obtained from local government databases. Various statistical yearbook data (socioeconomic) and historical information were also collected (http://tjj.hlj.gov.cn/tjsj/).
Complete pre-processing was conducted using the image processing software ENVI5.4 (Exelis Visual Information Solutions, Inc.), e.g., radiometric correction, geometric correction, image enhancement, mosaicking and image cropping of remote sensing images in different periods. Based on China’s land classification system and the actual land use situation in the Small Sanjiang Plain, the land use types in the study area were classified into cropland, forestland, grassland, water area, built-up land and wetland. With the help of field survey data and collected land use data, the land use interpretation of the study area was completed based on maximum likelihood classification (MLC) and human–computer interaction. With reference to Google Earth (Google, Inc.) and field survey data, the accuracy of the image classification was evaluated using the statistical accuracy verification method of sampling, and the overall classification accuracy was guaranteed to be greater than 85%; data were stored in ArcGIS10.8 (Environmental Systems Research Institute) in GRID format.
In addition, the quantitative extraction of the normalized difference vegetation index (NDVI), difference vegetation index (DVI) and ratio vegetation index (RVI) was achieved by ENVI 5.4. This study also extracted quantitative remote sensing information variables such as individual principal components (PC1, PC2, PC3) and individual components of tassel hat transformation (BRIGHT, GREEN, WET), based on which the aboveground biomass model was constructed.
To investigate the spatial heterogeneity of wetland degradation in the Small Sanjiang Plain (Li et al., 2021; Wu et al., 2021), this study used a 5 km×5 km grid for equally spaced sampling of the study area. The study area was divided into 732 sampling grid cells, and a comprehensive model of wetland degradation based on the characteristics of wetland attributes such as area, structure, function, and human activities was constructed. The spatial interpolation of wetland degradation was carried out based on kriging interpolation, and the grid was used to analyze the regional wetland degradation status and its spatial and temporal differentiation patterns.
The reduction in wetland area is the most direct embodiment and an important indicator of wetland ecosystem degradation. In this paper, the rate of change in wetland area (RAC) was used to reveal the change in wetlands (Shen et al., 2019). The formula is as follows:
where EA is the wetland area at the end of the study period, and IA is the initial wetland area in the study period.
The quantitative analysis of wetland landscape pattern dynamics is helpful for grasping the characteristics of regional wetland resources and provides a basis for effective wetland planning, protection and management (Wang et al., 2000; Gong et al., 2020). Therefore, the fractal dimension (FRAC) and landscape fragmentation index (LFI) were selected to characterize the degradation of wetland landscape structure in this study. The FRAC is described quantitatively in terms of the core area landscape, patch size, and study area boundary line curvature, expressed by the mean patch fractional dimension (MPFD), as shown in the formula:
where Pijis the perimeter (m) of computing unit ij, aij is the area (m2) of computing unit ij, N is the number of patches in the landscape, m is the number of landscape types, and n is the number of patches of a certain type of landscape.
The LFI reflects the complexity of landscape spatial structure and the degree of landscape fragmentation, as shown in the formula:
where t is the start time of the study period, t+1 is the end time of the study period, NPt is the number of plaques at the beginning of the study period in the calculation unit, NPt+1 is the number of plaques at the end of the study period in the calculation unit, A is the total area (m2) of the calculation unit, and (i,j) is the location of the calculation unit.
The wetland ecosystem provides a range of ecosystem services in relation to water conservation, biodiversity maintenance, and climate regulation, and wetland vegetation is important to these wetland ecosystem functions and an important component of wetland ecosystems generally. The aboveground biomass (AGB) and vegetation cover density (VCD) of wetland vegetation are not only essential indicators that can be used to reflect the function of the wetland ecosystem but also key elements that can be used to scientifically evaluate degradation and reveal the mechanisms driving this degradation. Moreover, AGB and VCD can reflect the proportion of vegetation in a certain area from a macroscopic perspective, which can more intuitively show the extent of the role of wetland ecosystem function and the degree of restoration. With reference to relevant research (Han et al., 2014), this study used a regression model best suited to the inverse model of the AGB of vegetation in the Small Sanjiang wetland, with the following formula:
where TM1-3, TM5 and TM7 are band reflectances, and WET is the humidity component of the tasseled cap transformation. NDVI and RVI are the normalized difference vegetation index and ratio vegetation index, respectively; PC2 is the second principal component.
The NDVI is the best indicator of vegetation growth status and VCD (Pu et al., 2008). The pixel dichotomous model is widely used in the remote sensing estimation of vegetation coverage, and the NDVI data are mostly used in estimation, as shown in the formula:
where VCDi is the vegetation coverage of the ith period, NDVIi is the normalized difference vegetation index of the i period, NDVIsoil is the normalized difference vegetation index of a bare ground (or bare sand) observation pixel, and NDVIveg is the normalized difference vegetation index of a pixel completely covered by vegetation.
Human disturbance to wetlands caused by rapid urbanization and excessive industrial and agricultural development is visually reflected by the structure and composition of wetland ecosystems (Zeng and Liu, 1999). Negative human disturbances have led to a drastic reduction in the area of natural wetlands and significant changes in the type of wetland and the distribution of wetlands in the landscape. In this study, the extent of human activity was mainly realized using the Hemeroby index (HI) and the human disturbance index (HD), which have been widely used in a range of settings, including wetlands, towns and mountains (Zhou et al., 2018). Based on existing research results (Hill et al., 2002; Chen et al., 2010; Liu et al., 2016), to reveal the extent of regional human disturbance activities on the wetland ecosystems of the Small Sanjiang Plain or the impact of damaged ecosystems and their composition, this study coupled regional administrative units and sampling grids and combined them with the landscape types and actual conditions of wetland ecosystems in the cold region of China (Table 1) (Liu et al., 2004a; Wang Z. et al., 2011; Song et al., 2014). The human disturbance index was assigned to six landscape types in the study area, and a comprehensive degree of human disturbance model based on the weight of the surface coverage area was used to calculate and assess the intensity of human activities (HD′) within different evaluation units.
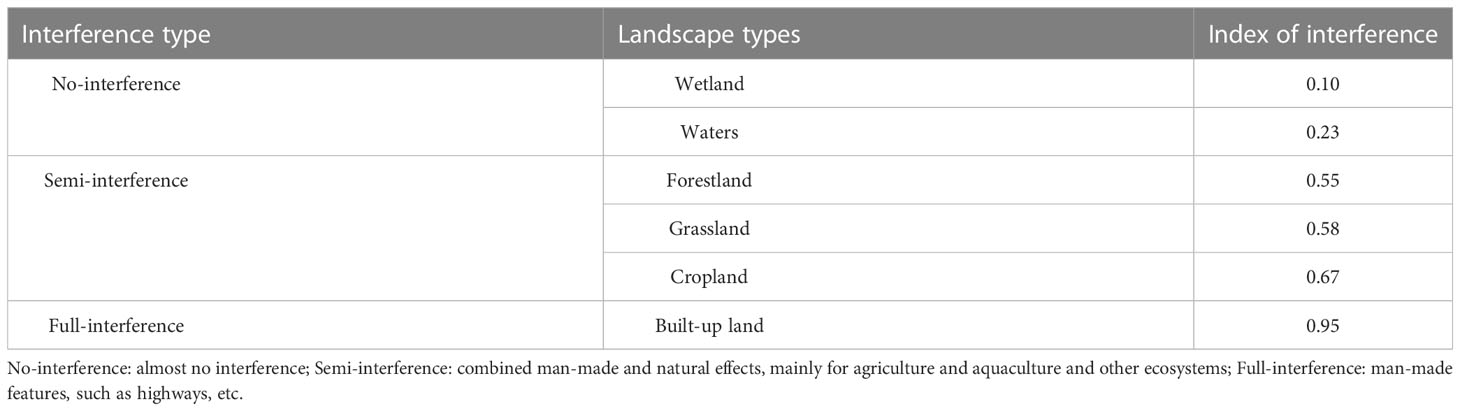
Table 1 Landscape type considered interference degree assignment table (Liu et al., 2016).
The following formulas were used to calculate the degree of human disturbance in grid cells and human activities in grid cells:
where HD is the degree of human interference, HIi is the interference index of the class i landscape type, Si is the area of the class i landscape type, S is the total area of grid cells, m is the number of landscape types in the calculation unit, Ai is the area of the ith type of landscape type in the calculation unit, A is the total area of the calculation unit, and Ci is the disturbance index corresponding to the ith type of landscape type.
where HDi is the normalized index of the human interference degree in period i.
The Small Sanjiang Plain wetlands belong to the mid-latitude cold region in Northeast China and have a fragile ecological environment. Moreover, there is no unified evaluation index system for wetland degradation risk assessment in cold regions. This study was based on the actual condition of wetlands in cold areas, and the relevant wetland degradation assessment studies were conducted in concert with the “Technical Specification of Ecological Effects Assessment of Ecosystem Protection and Recovery in San Jiang Yuan Region” (DB 63/T1342-2015,2015) (Shen et al., 2019) from the perspective of natural and human coercion and wetland area, ecosystem structure, function, stress coercion and degradation. After expert identification and screening of four characterization wetland degradation evaluation systems, wetland area degradation, structural degradation, functional degradation and human activities, the weights of the evaluation systems were determined based on the analytic hierarchy process (AHP) and expert evaluation method, and the resulting values were 0.3019, 0.2250, 0.3240 and 0.1490, respectively. Based on this, wetland area degradation (area change rate), structural degradation (landscape fractal dimension, landscape fragmentation), functional degradation (vegetation aboveground biomass, vegetation cover) and human activities (human disturbance degree) were the six indicators, and their indicator weights were determined (Malekmohammadi and Blouchi, 2014; Fang et al., 2021; Sun et al., 2021) as 0.3019, 0.1575, 0.0675, 0.2430, 0.0810 and 0.1490, respectively. These values were used to construct a regional WDCI to carry out a quantitative assessment of wetland degradation in cold regions.
where WDCI is the wetland degradation composite index, RAC is the area change rate, FRAC is the landscape fractal dimension, LFI is the landscape fragmentation index, VAB is the vegetation aboveground biomass, VCD is the vegetation cover, and HD is the human disturbance.
The geological information mapping method is a comprehensive spatiotemporal composite analysis method supported by RS, GIS, computer mapping and spatial information technology (Wang D. et al., 2011). While the mapping unit was constructed by superimposing different periods of land use at different spatiotemporal scales, the ecogeographic processes and spatiotemporal variation of regional land use cover could be revealed in time series. In this paper, with the support of ArcGIS 10.8, the land use data of the region from 1990 to 2000, 2000 to 2010, and 2010 to 2020 were analyzed by spatial overlay, and the land use information maps of the three periods were finally synthesized (Gong et al., 2015). The spatial and temporal trends in land use, and their driving mechanisms, were established quantitatively so as to explore their impact on ecosystems over the past 30 years. The calculation formula of the atlas is as follows:
where C is the atlas element grid of the land use succession model in the research stage, and A and B are the raster attribute values of the land use atlas at the beginning and end of the study. Then, based on ArcGIS, according to the difference in degradation levels in different periods, the situation of increasing levels was defined as improvement, such as 1→2, 2→3, and 3→4; adding two or more levels was defined as a significant improvement, for example, 1→3, 1→4, and 2→4. However, a reduction in rank was defined as deterioration, such as 4→3, 3→2, and 2→1; a reduction of two or more grades was defined as serious deterioration, such as 4→1, 4→2, and 3→1. Stable indicates that the level does not change.
From 1990 to 2020, land use in the study area underwent significant changes (Table 2). The area of forest land decreased most, which was 147.2×10³ hm2, and the area of wetland decreased 39.26×10³ hm2. The areas of cropland, grassland, built-up land and water area increased by 145×103 hm2, 27.16×10³ hm2, 8.87×10³ hm2 and 6.57×10³ hm2, respectively. The areas of grassland and built-up land increased significantly, with area percentage changes of 646.76% and 79.5%, respectively.
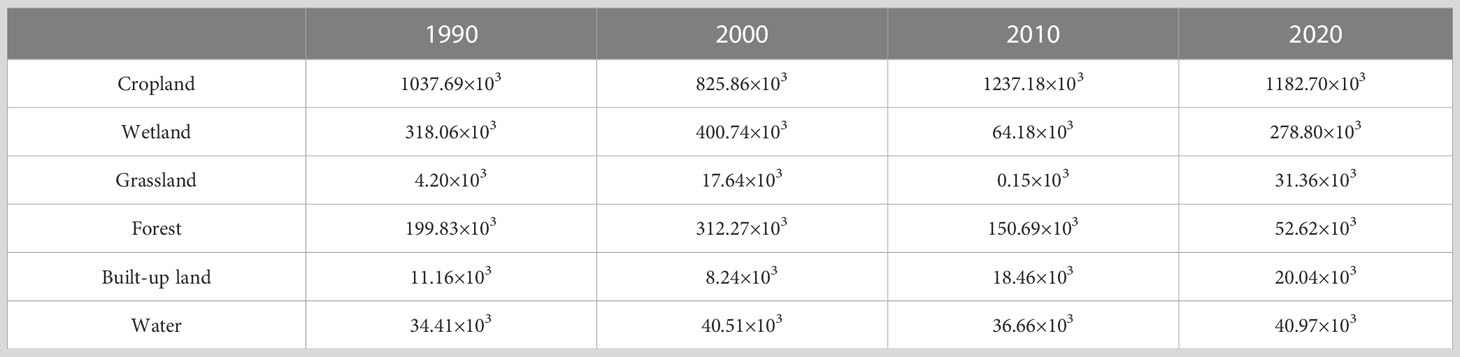
Table 2 Area of land use types in the study area from 1990 to 2020 (hm2).
During the 30-year period, cropland showed an initial decreasing trend followed by a significant increase and slight decline, with decreases of 211.83×10³ hm2 and 54.48×10³ hm2 in 1990–2000 (first phase) and 2010–2020 (third phase), respectively, and an increase of 411.32×10³ hm2 in 2000–2010 (second phase). The dynamic attitude of the three periods was −20.41%, 49.81% and −4.40%, respectively. Grassland and wetland showed a change trend of first increasing, then significantly decreasing, and finally increasing again, with increases of 82.68×10³ hm2 and 13.44×10³ hm2, respectively, from 1990 to 2000. Cropland was the main source of the increase in wetlands, which was due to the ecological protection by the state, which actively promoted the return of cropland to wetlands and grassland. The reduction in wetlands and grasslands from second phase reached 236.56×10³ hm2 and 17.49×10³ hm2, with dynamic trends of −59.03% and −99.18%, respectively. As a consequence of the development of agricultural mechanization, the dramatic increase in population and the combined effect of agricultural reclamation activities, many wetlands, grasslands and wastelands that were previously not easily exploitable have been continuously reclaimed into cropland. A total of 63.25% of wetlands and 59.23% of grasslands were converted into cropland (Figure 2), and wetlands were the main source of increases in cropland. From 2010 to 2020, the areas of wetlands and grasslands increased by 114.62×10³ hm2 and 31.22×10³ hm2, respectively, of which 21.48% and 13% of cropland was transformed into wetlands and grasslands, respectively. The increase in wetland area was related to the continuous improvement of the national policy of returning farmland to wetlands, and the establishment of wetland parks and nature reserves has effectively curbed the reclamation and encroachment of wetlands. The area of forestland expanded by 112.44×10³ hm2 in the first phase, and cropland was the main source of forestland increase, with 92.55×10³ hm2 of cropland changing to forestland. However, the forestland decreased in area by 161.58×10³ hm2 and 98.07×10³ hm2 in the second and third phases, respectively, with 48.73% and 28.25% of forestland being converted to cropland, and unsustainable land use such as deforestation in some areas still exists. The built-up land showed a trend of continuous increase, with the largest increase from 2000 to 2010, reaching 10.21×10³ hm2. The overall area of the water did not change much.
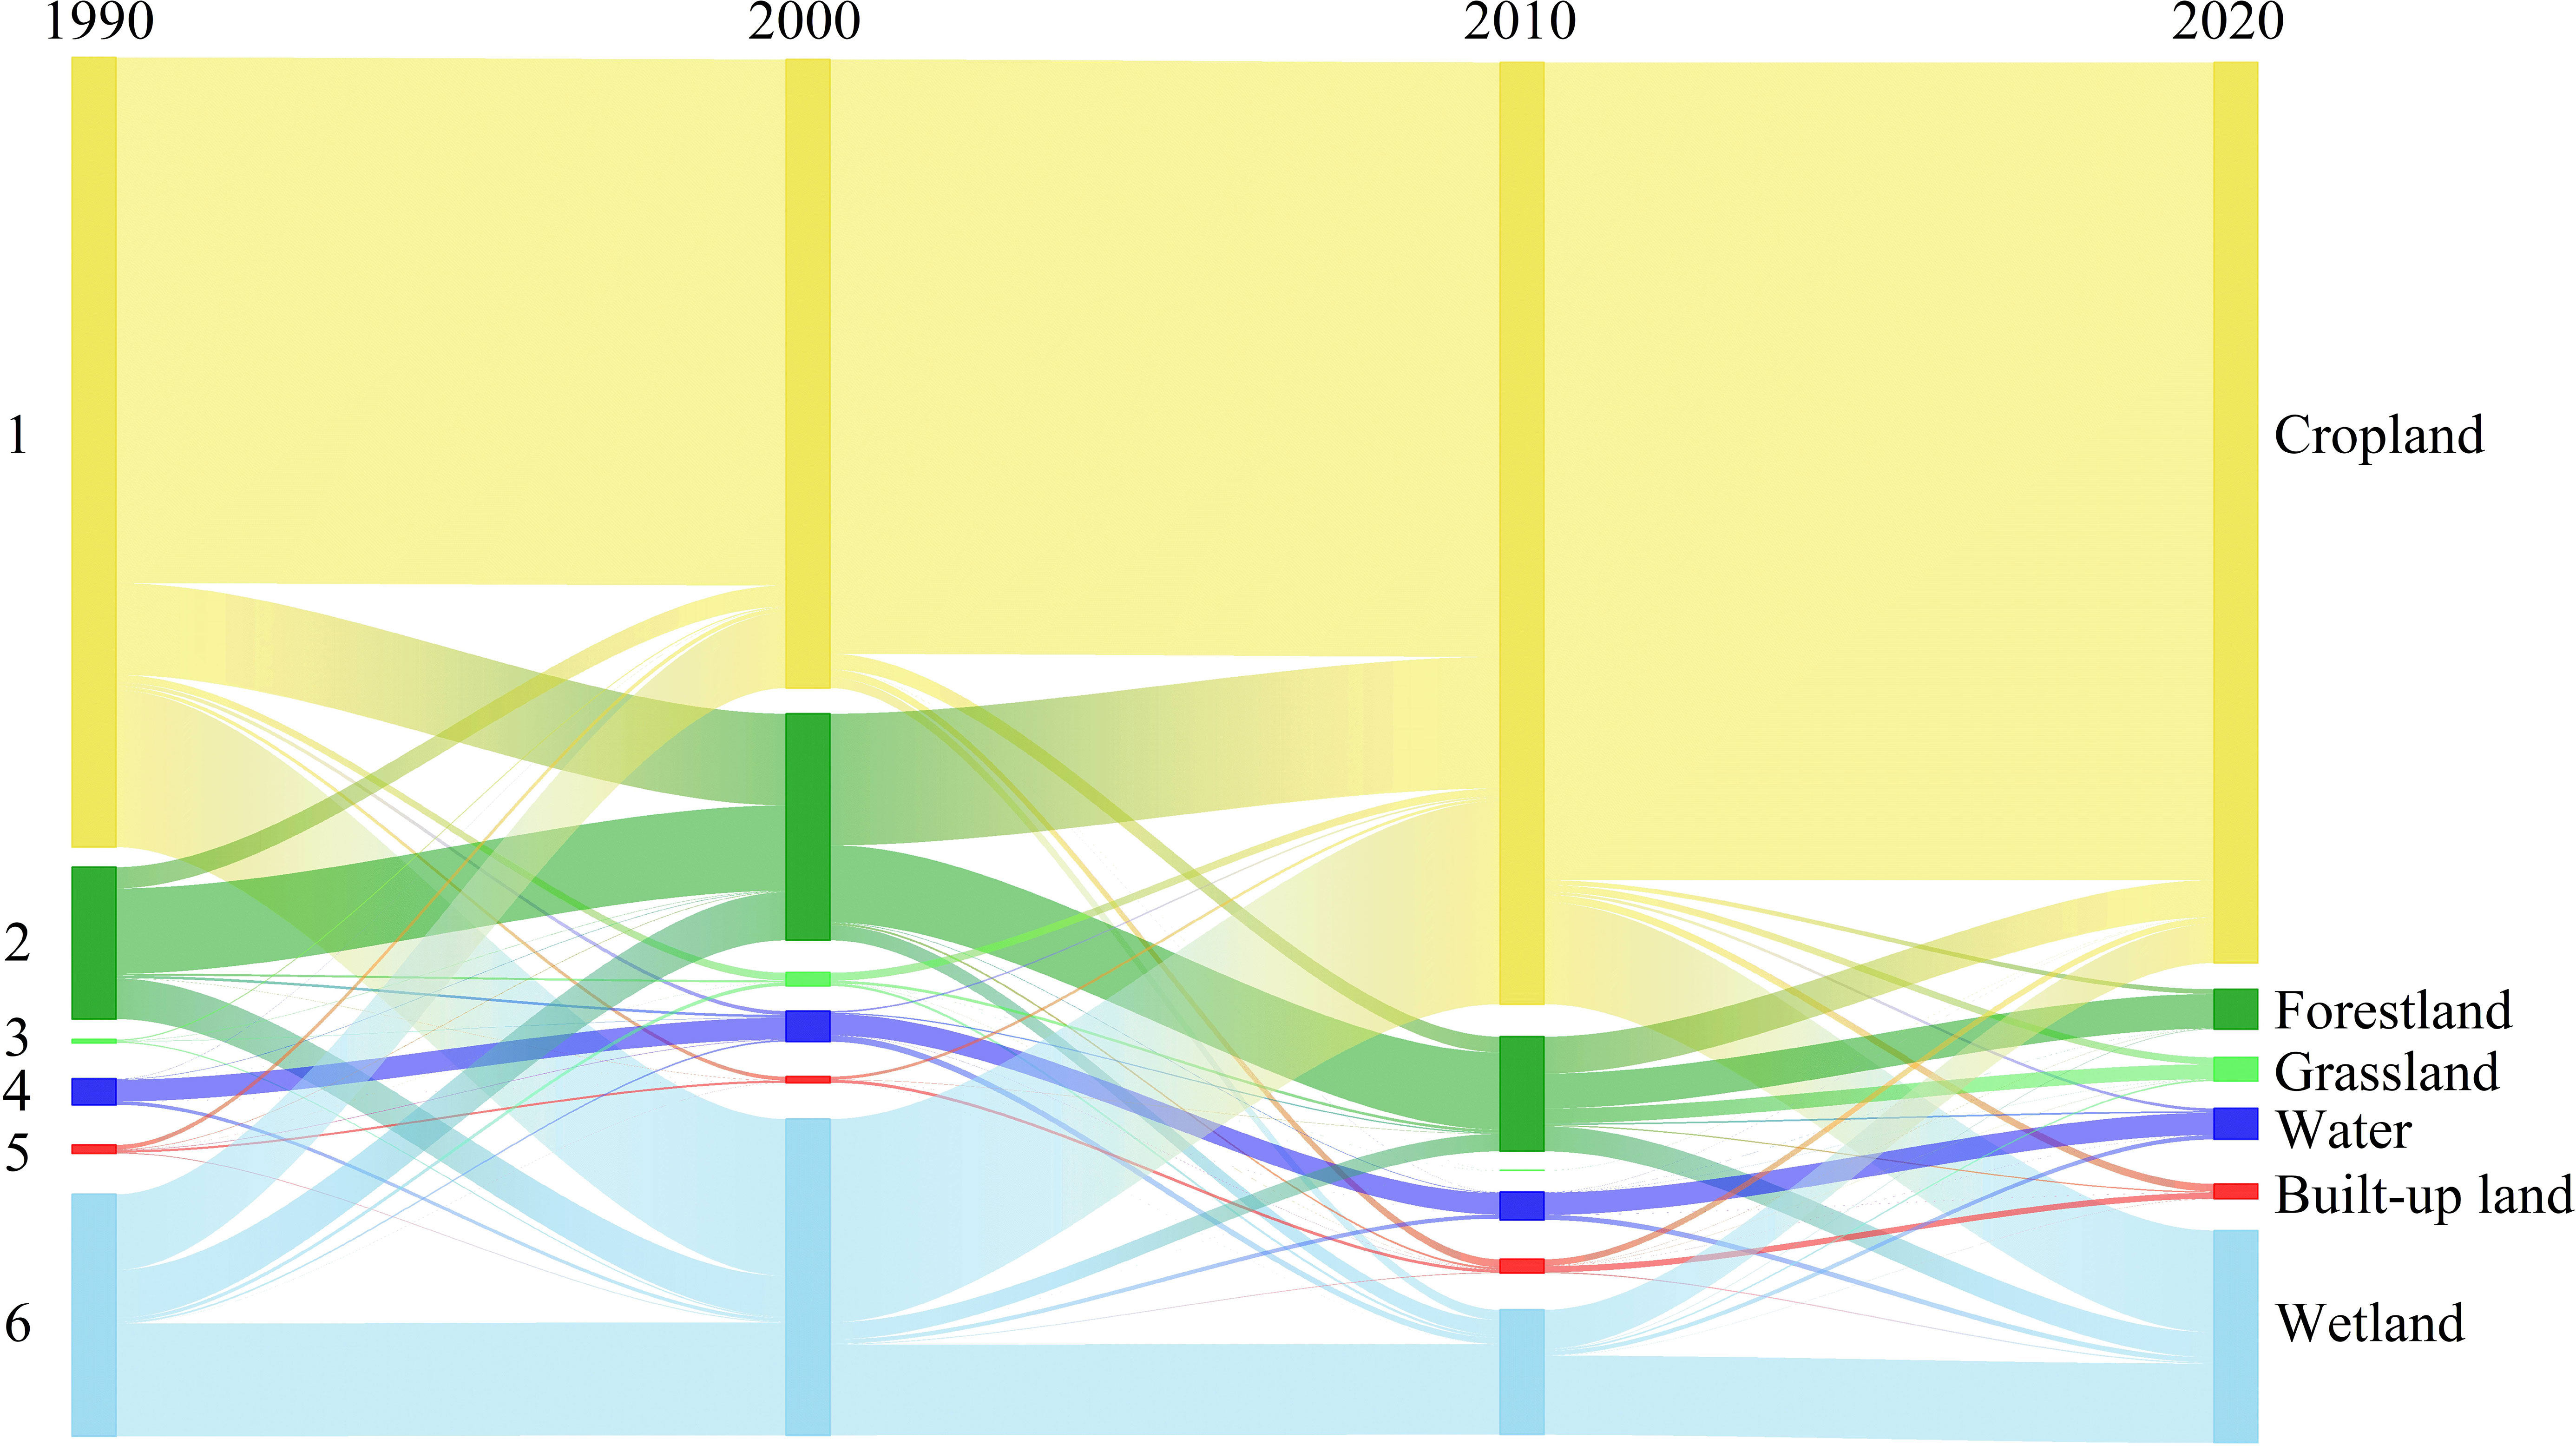
Figure 2 Land use type area conversion sankey map for the study area from 1990 to 2020.
The changes in the overall wetland area in the three stages were (+) 82.68×10³ hm2, (−) 336.56×10³ hm2 and (+) 214.62×10³ hm2, respectively. The area of increased wetland area in the first phase was distributed mainly in the eastern and central parts of Haiqing Township, Qianfeng Farm and Erdaohe Farm and concentrated in the townships of Linjiang, Bacha, Jinchuan, Yinchuan and Fuyuan in the northwest region in the third phase (Figure 3), which was largely due to the implementation of the national wetland ecological protection policy. The most serious degradation of the wetland area in the second phase stemmed from 2000, when the government encouraged a fourth investment in the development of wetlands, especially in the renovation and use of remaining wetlands after previous development. Moreover, several water conservancy facilities, such as drainage ditches and reservoirs, were constructed during the development of wetlands, with 422.4 km of main river channels dug throughout the Sanjiang Plain, as well as 2,800 km of drainage canals, 362 drainage structures, 25 large and medium-sized reservoirs, and 138 small reservoirs (Liu et al., 2014). These hydraulic facilities disrupted the natural hydrological pattern of the region, isolated the connection between natural rivers and wetlands such as lakes and marshes, accelerated wetland desiccation, led to changes in wetland hydrology, and eventually resulted in the loss of wetlands (Wang and Li, 2015). The interplay of natural factors and human disturbances was the main factor affecting the ecological degradation of wetlands during this period.
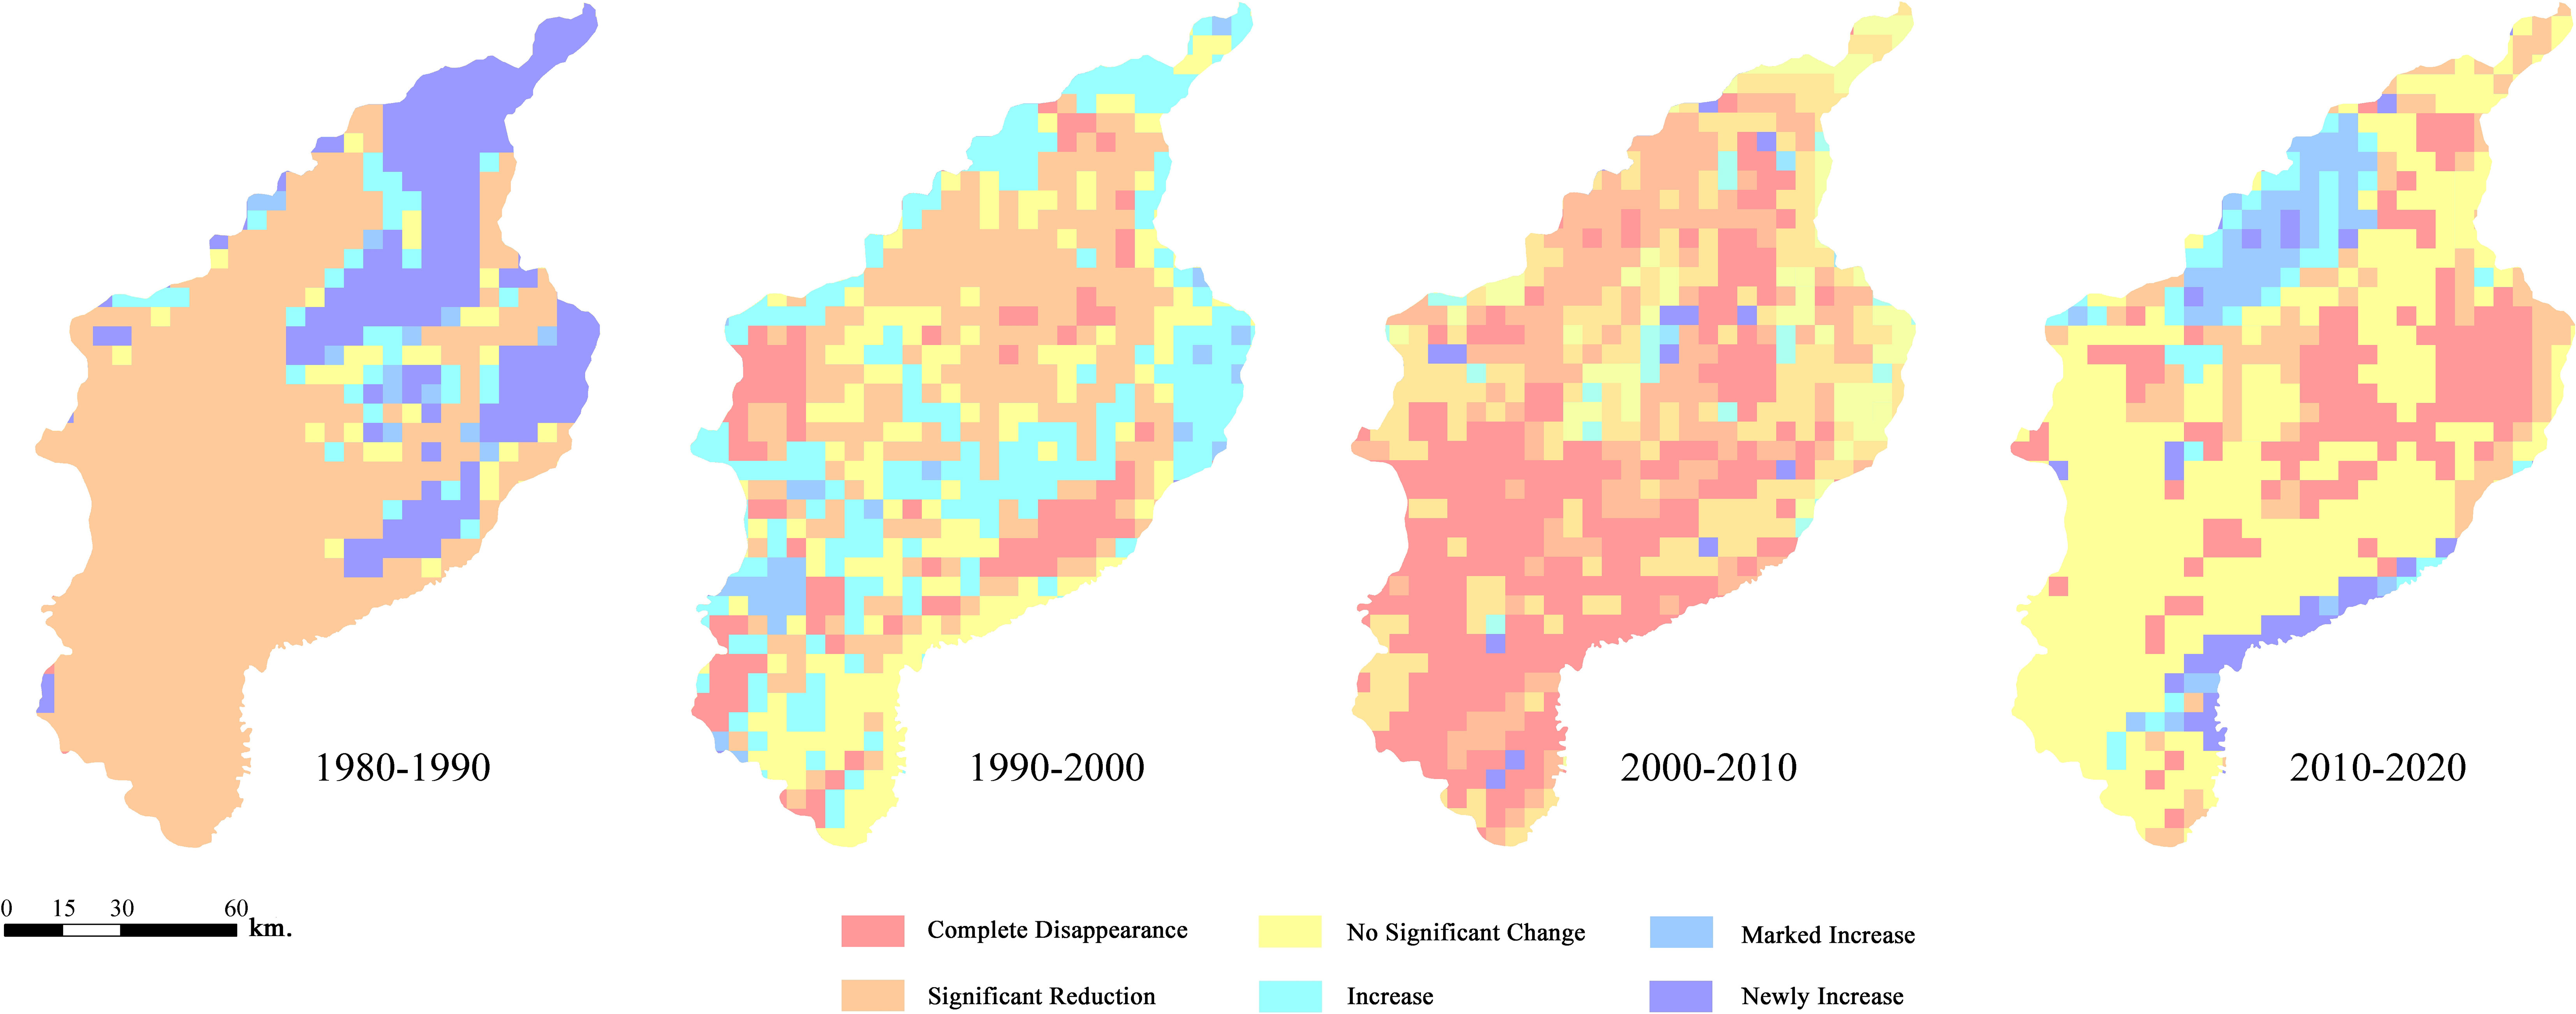
Figure 3 The change rate of wetland area in the study area.
In conclusion, the wetlands in the study area were mainly growing and stable from 1990 to 2000 (Figure 3), with area proportions of 37.14% and 30.04%, respectively. During, 2000–2010 and 2010–2020, the wetlands were mainly degraded and stable, with area proportions of 41.2% and 42.81%, respectively, and the wetland areas with significant growth were 14.84%, 8.44%, and 13.71% in the three phases, respectively, indicating that the degradation of wetlands has been reduced in the last decade.
As shown in Figure 4, the FRAC values in 1990, 2000, 2010, and 2020 were distributed between 1.00 and 1.13, which indicated that the study area was subjected to different degrees of human disturbance. The lowest overall FRAC occurred in 1990 and was in the range of 1.04–1.06 for all years, while 2000 had the highest FRAC in the range of 1.06–1.13 overall. The overall FRAC in the study area slowed between 2000 and 2020. In this period, the human disturbance to wetlands decreased, and the wetland environment improved in stages due to the active promotion of national ecological policies.
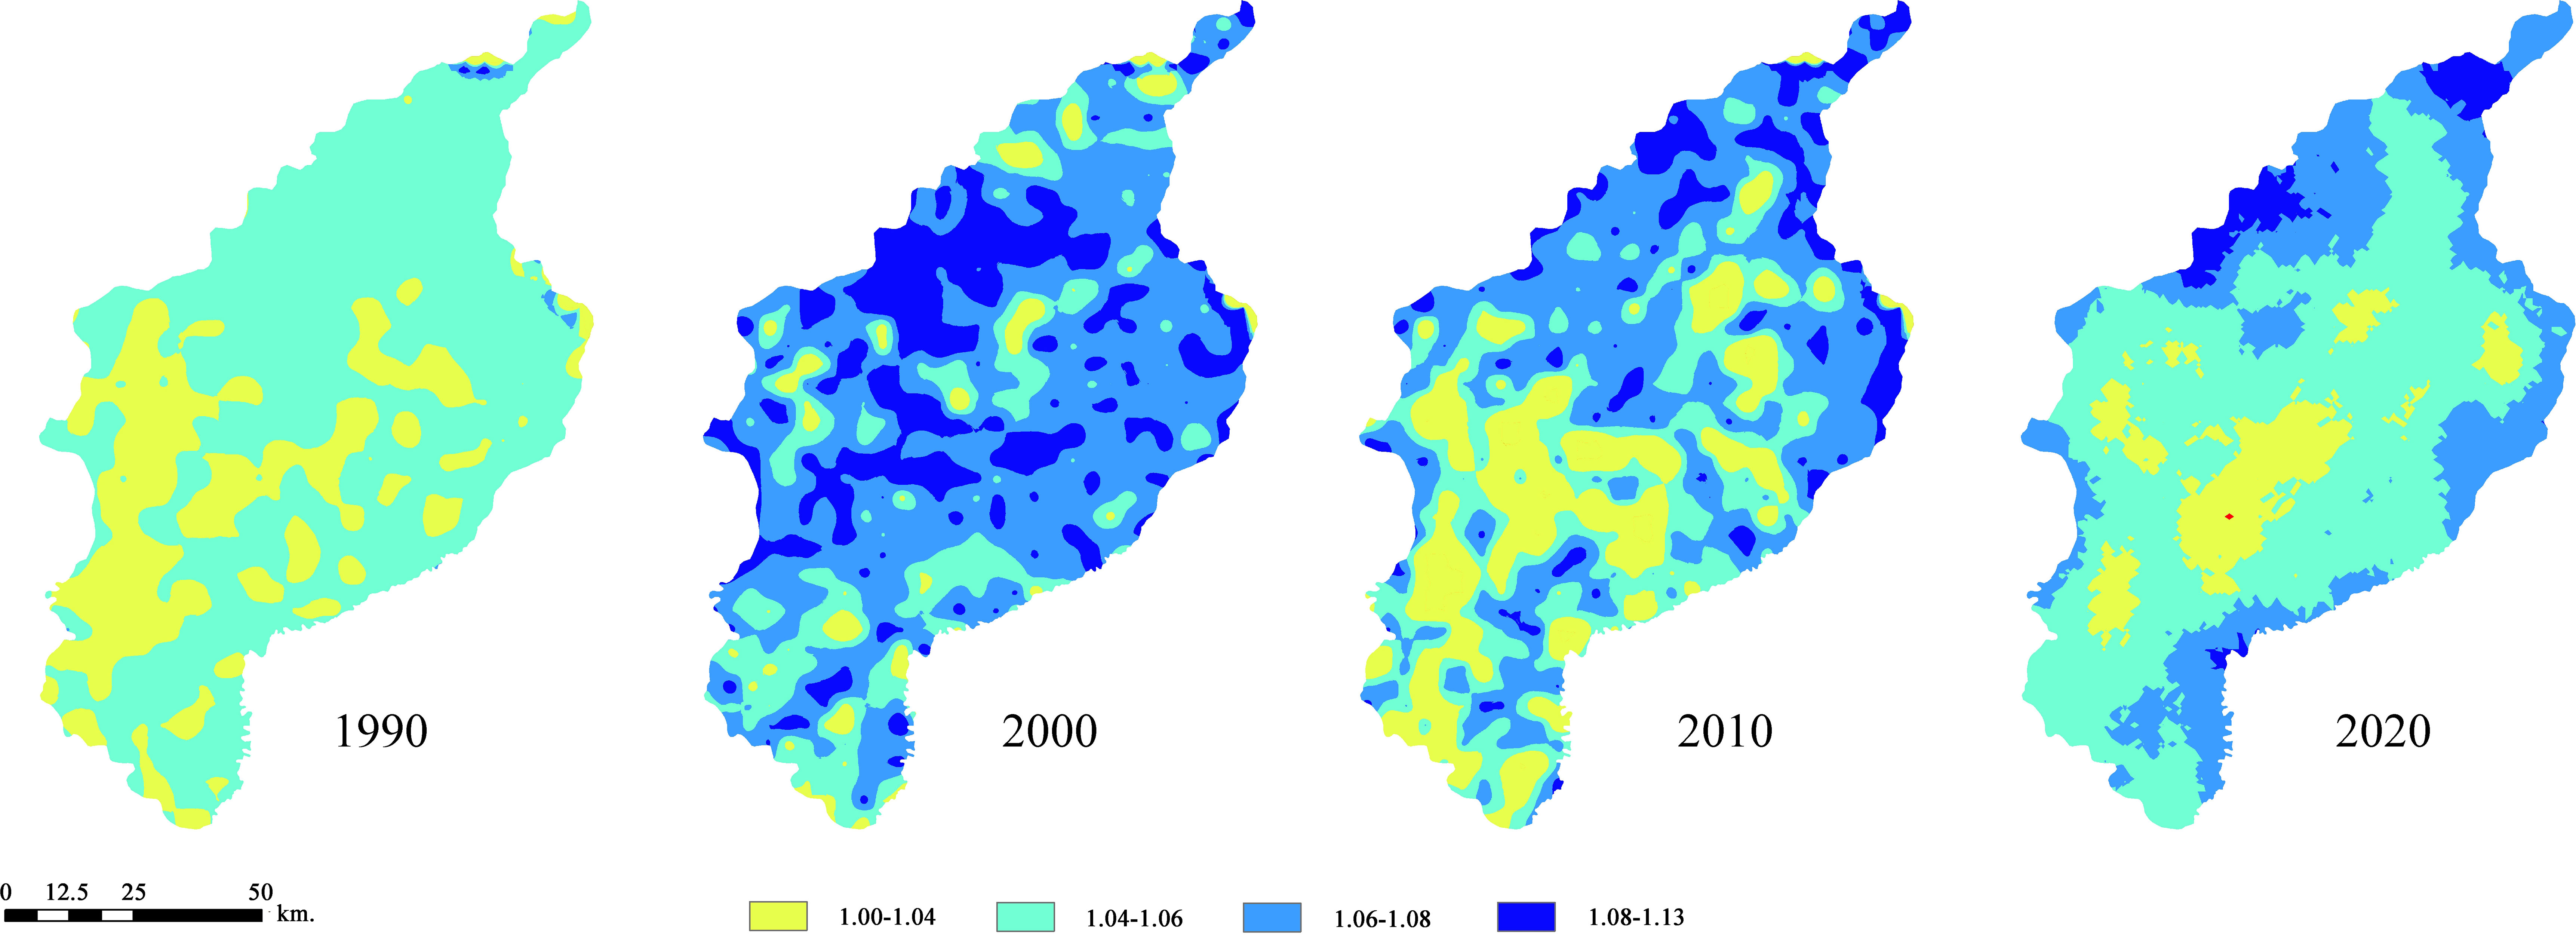
Figure 4 The distribution of wetland FRAC in the study area.
The FRAC values were relatively high in the river valley areas in the northwest and east of the study area and relatively low in the central and southern parts. Due to the low and flat topography, favorable reclamation conditions and fertile soil in the river valley area, these areas are the preferred places for the residents distributed in the nearby area. The residual wetlands were reclaimed on a large scale, and a large number of farming activities caused the natural vegetation to be replaced by artificial landscapes. Fragmentation of the natural landscape was exacerbated by the impact of human activities, making the shape of the regional patches more irregular, with a high number of subdimensions in some areas. The southern and central parts were concentrated in large areas of cropland, which constituted a local regional matrix landscape with a relatively regular shape and decreasing landscape fragmentation, making the FRAC relatively low.
Overall, the number of landscape patches was the largest in 1990, and the LFI was the largest; the LFI was smaller in 2000 and 2010, and the distribution of landscape patches was more concentrated; from 2010 to 2020, the LFI showed an increasing trend (Figure 5).
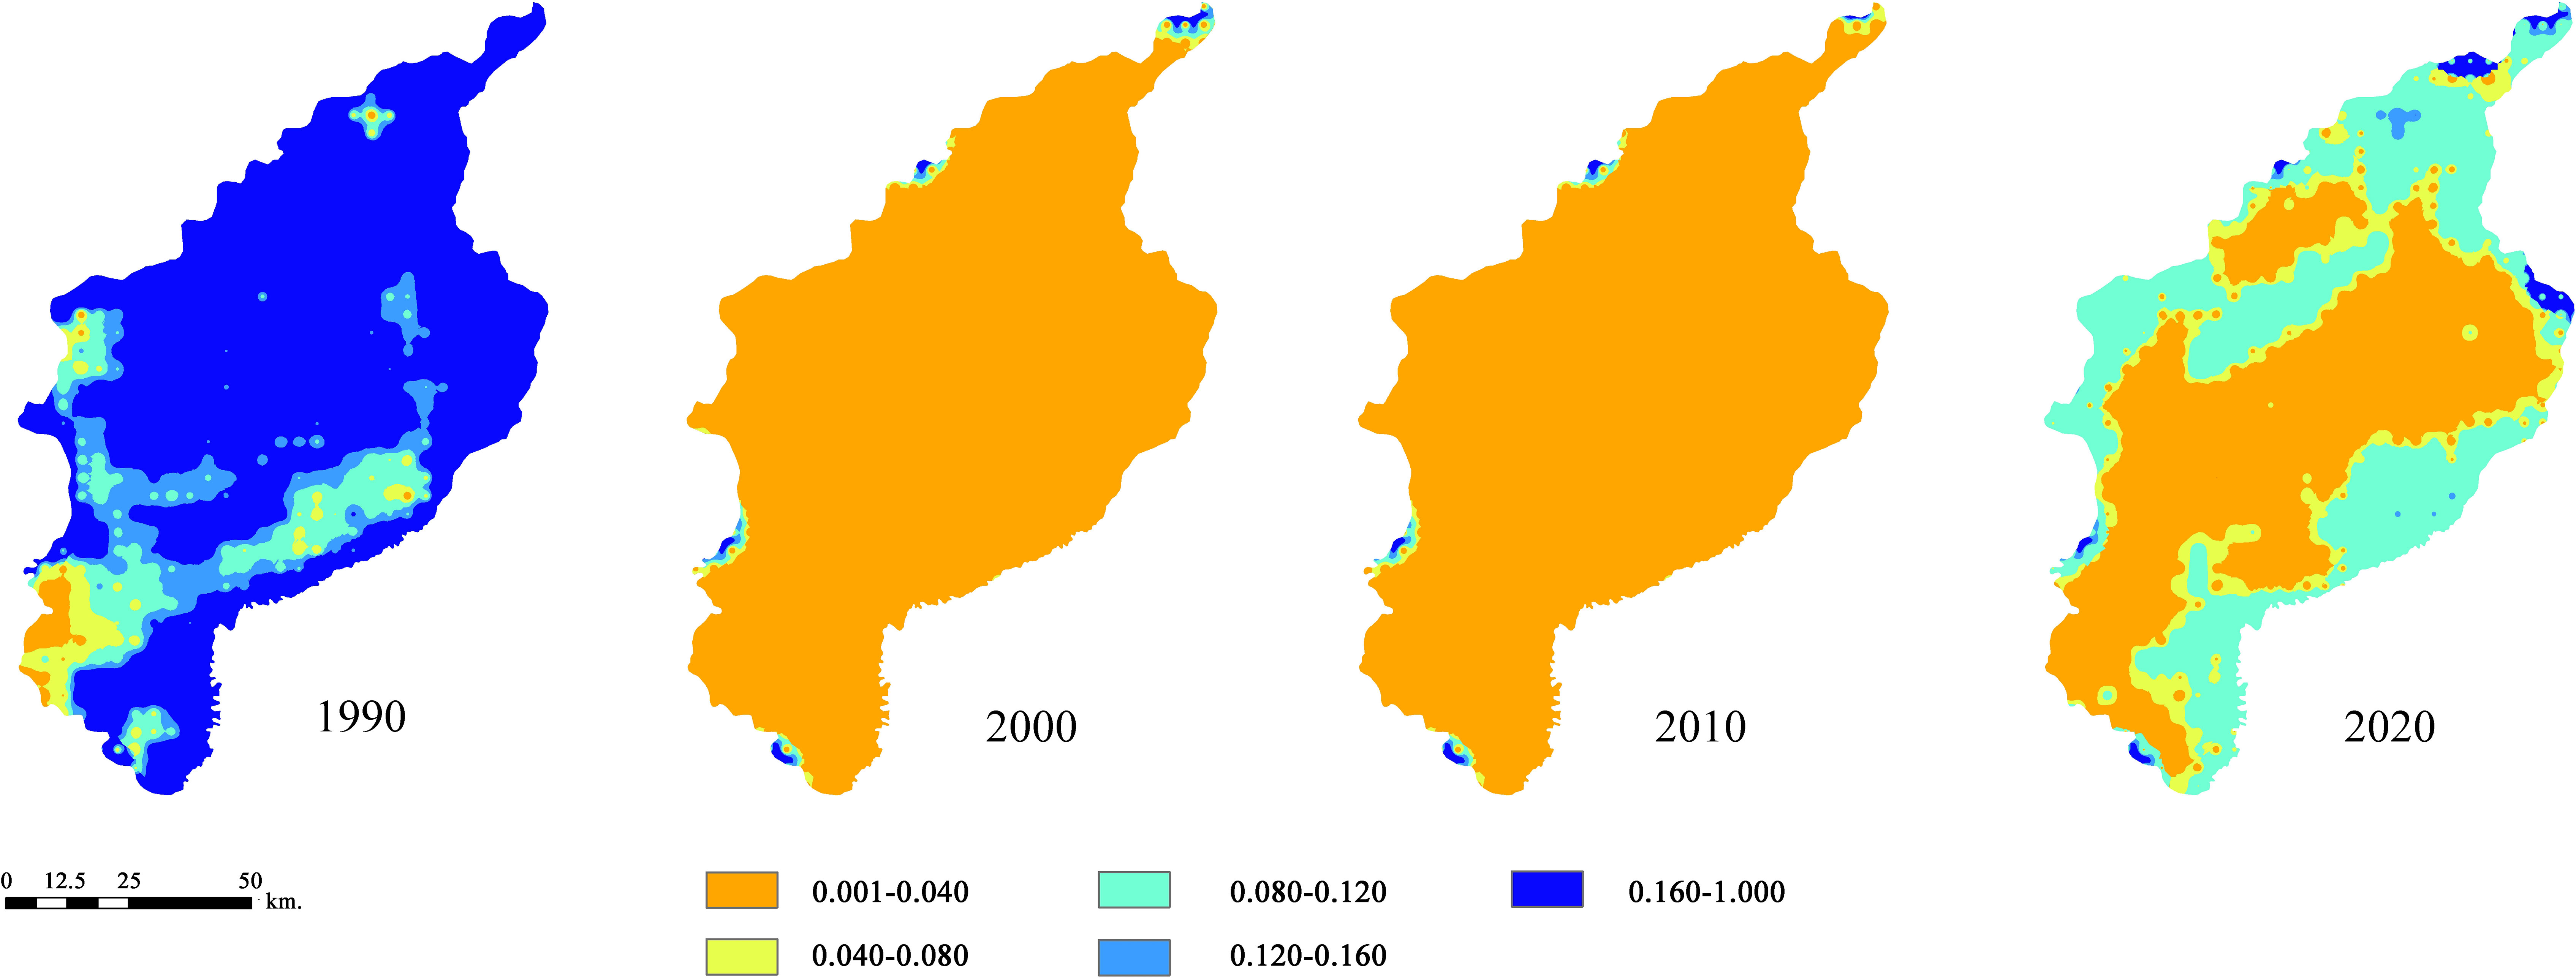
Figure 5 The distribution of wetland LFI in the study area.
The results of vegetation AGB and VCD in the study area are shown in Table 3. The average AGB in the study area increased from 1029.73 kg/hm2 to 1405.38 kg/hm2, with an overall increase of 375.65 kg/hm2 and a growth rate of 36.48%. The overall biomass growth increased in some townships in the northern part of the study area, while some areas in the central part showed negative biomass growth, and the AGB in farm areas was higher than that in township areas.
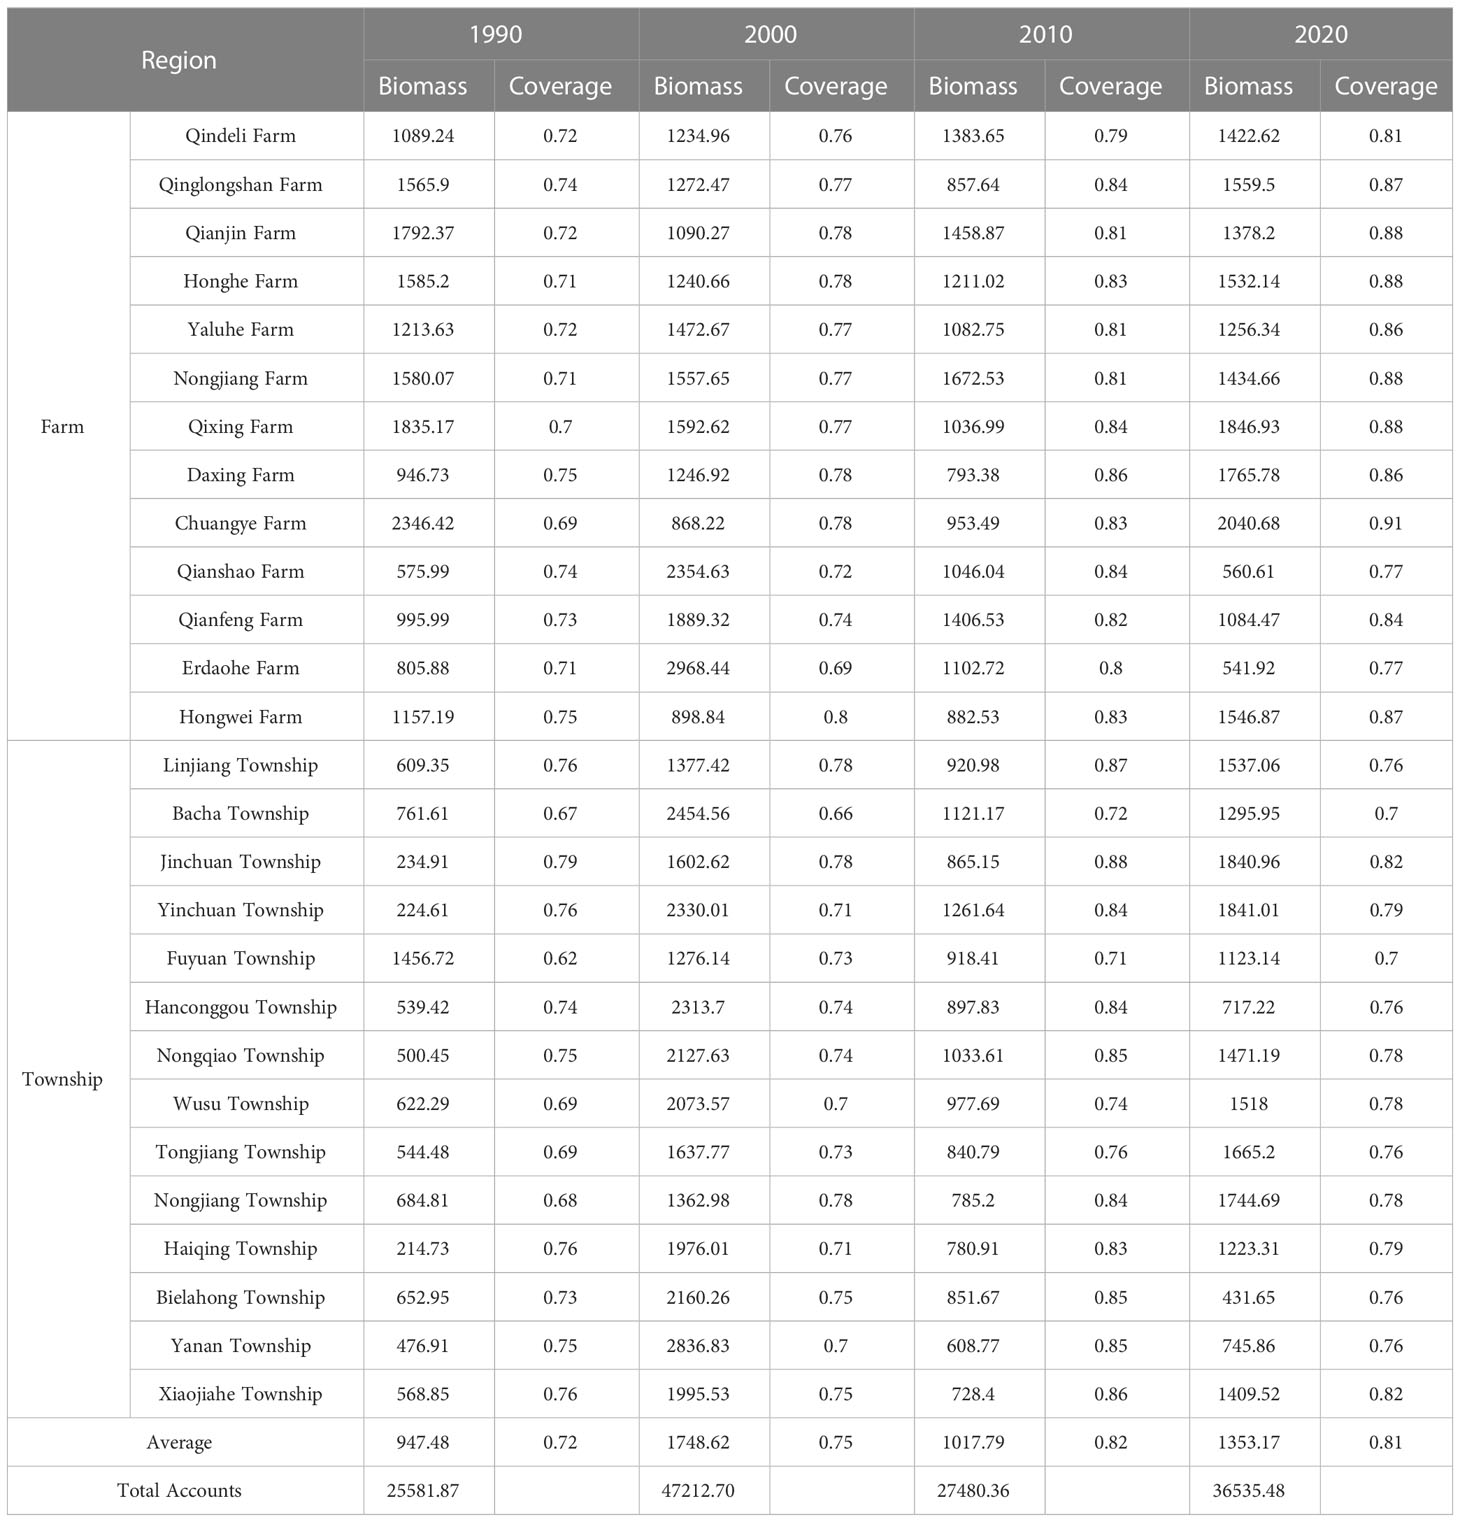
Table 3 Vegetation above-ground biomass (kg/hm2) and vegetation coverage results in 1990–2020.
In 1990, the average biomass yield was 1029.73 kg/hm2, which was significantly higher in the southwest than in the northeast, and the highest yield was in Chuangye Farm and the lowest was in Haiqing Township, at 2346.42 kg/hm2 and 214.73 kg/hm2, respectively. The average biomass yield reached 1683.58 kg/hm2 in 2000, with a growth rate of 63.5% over the decade, and the largest growth rate of 2359.92 kg/hm2 was in Yanan Township. In 2010, the average aboveground biomass yield was 1045.18 kg/hm2, and it was higher in the central area, lower in the surrounding areas, and higher in the southwestern area than in the northeastern area. From 2010 to 2020, the average biomass yield increased by 350.2 kg/hm2 to 1405.38 kg/hm2. The overall biomass was relatively high, but the biomass in some areas (Erdaohe Farm, Qianshao Farm, Beilahong Township, Hanconggou Township and Yainan Township) was much lower than the average biomass per unit area.
The average VCD in 1990, 2000, 2010 and 2020 was 0.72, 0.75, 0.82 and 0.81, respectively. In general, the VCD was high and stable in the four periods. It had an overall increasing trend from 1990 to 2010, with relatively small changes in 2010 and 2020.
The ArcGIS natural break method was used to classify the degree of human interference in the study area into five types: slight interference [0.1,0.2], mild interference [0.2,0.4], moderate interference [0.4,0.5], severe interference [0.5,0.6], and extremely heavy interference [0.6,0.7] (Figure 6).
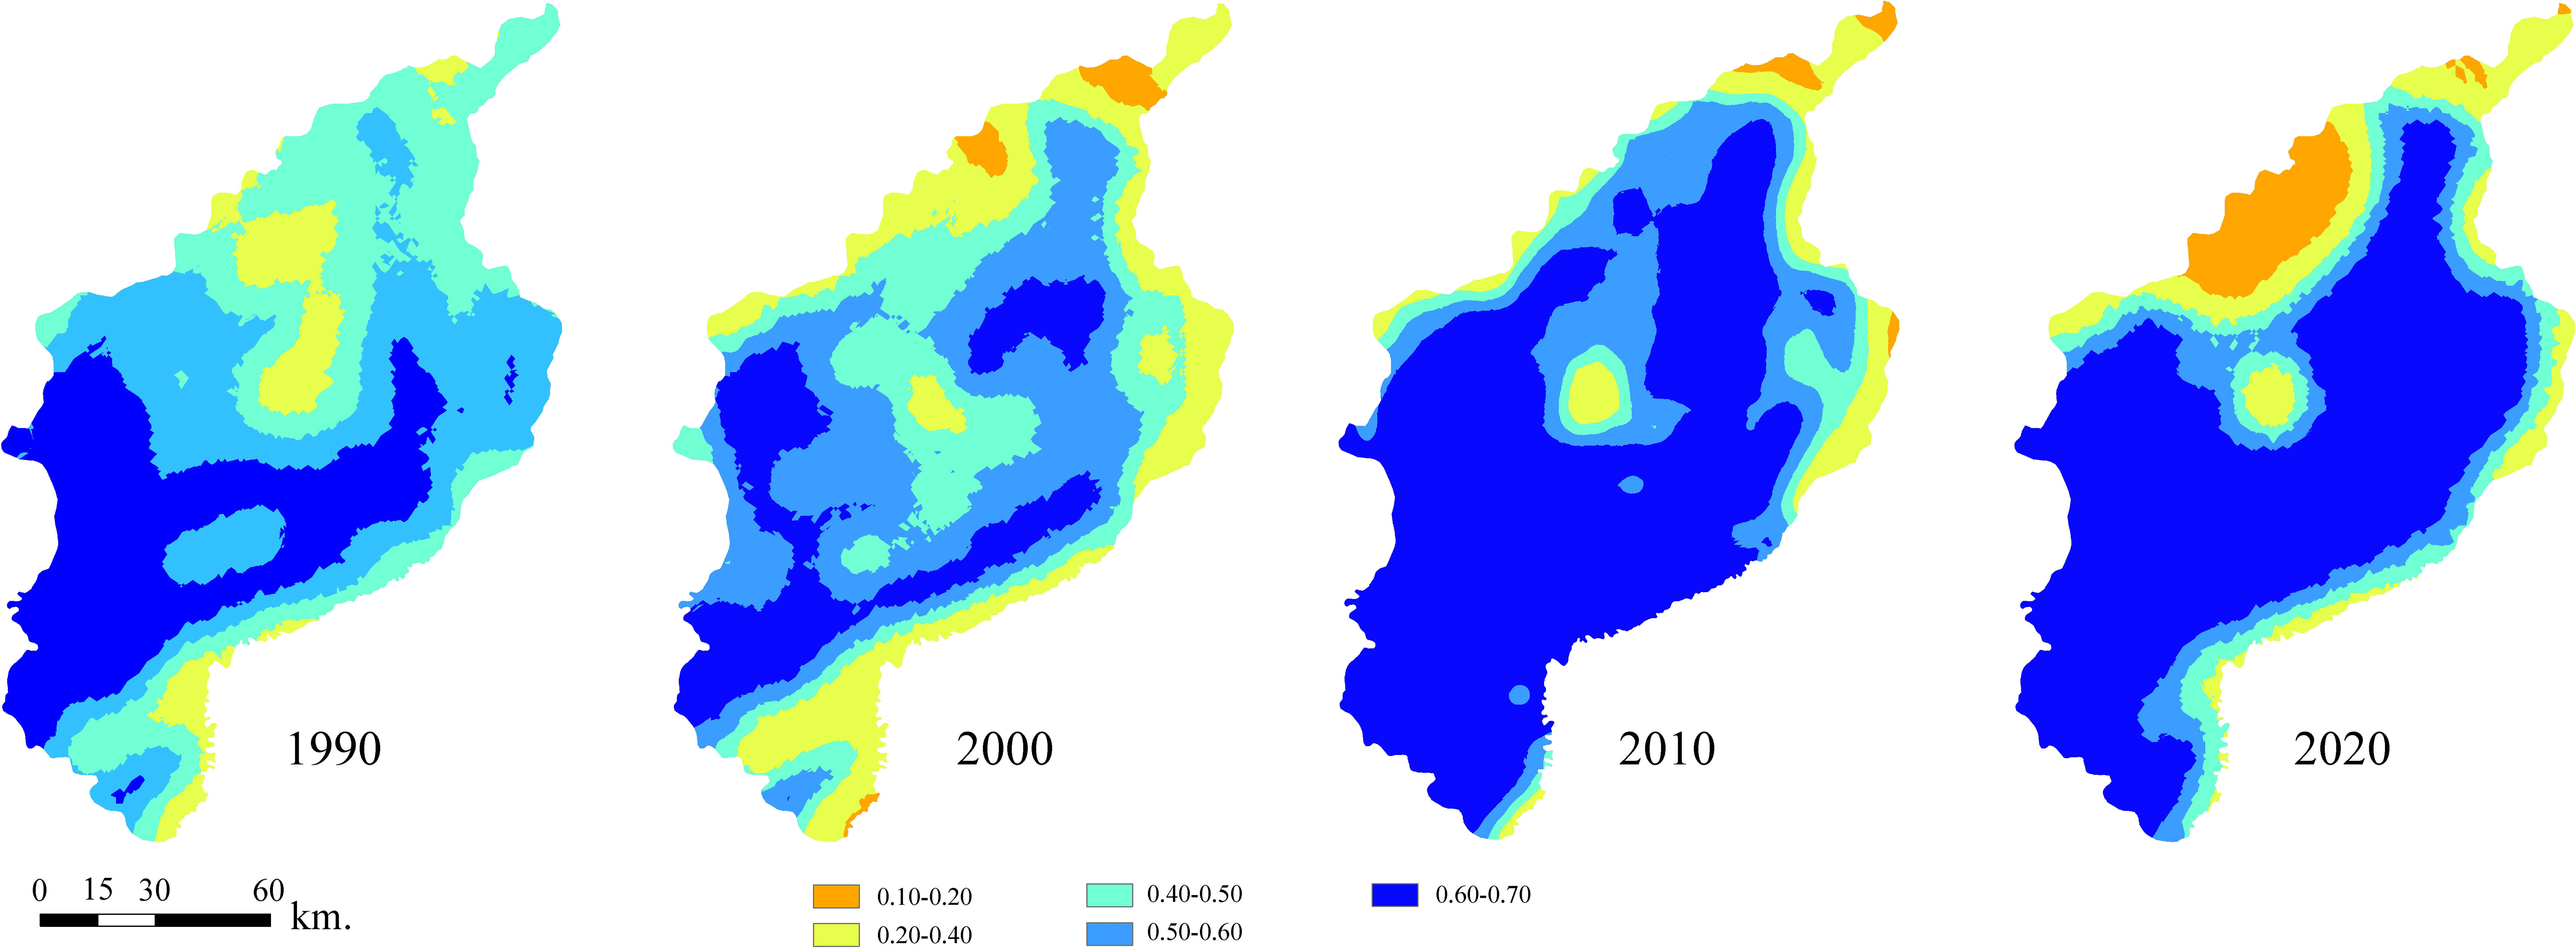
Figure 6 The distribution of human interference in the study area.
The average human interference in 1990, 2000, 2010 and 2020 resulted in HD values of 0.52, 0.46, 0.57 and 0.53, respectively. Human interference decreased in the first phase, and the average HD decreased by 12.61%. The HD underwent a large increase from 2000 to 2020, and the average HD increased by 19.16% in the 10 years. The areas of slight interference in the study area fluctuated greatly, showing a pattern of a large increase, followed by a small decline and ending with a considerable increase, with the area expanding 2300% during the first phase, shrinking by two-thirds to 52.76×10³ hm2 during the second phase, and then growing by 300% during the third phase. The areas of Mild interference remained relatively consistent. The areas of moderate interference and severe interference showed an overall downward annual trend. The proportion of extremely heavy interference areas was the highest, with 39.82%, 32.00%, 70.88% and 69.58% in 1990, 2000, 2010 and 2020 (Table 4). Although the country has introduced ecological protection projects such as returning farmland to forest and grassland, the large fraction of extremely heavy interference areas indicates that human interference with regional land has been intensifying, and unsustainable activities such as land reclamation and deforestation have not been effectively curbed. Some root causes of this phenomenon include the combined influence of certain interests, increasing population pressure and intensifying human activities. As a result, the quality of the regional ecological environment has tended to deteriorate. The interference areas were mainly concentrated in the west and south, including Deli Farm, Qinglongshan Farm, Qixing Farm, Qianjin Farm, Chuangye Farm, Hongwei Farm, Xiaojiahe Town and Qianshao Farm, and the intensity of disturbance gradually increased from southwest to northeast, with the center of gravity gradually shifting northward.
Table 4 Area of human interference degree type in the study area from 1990 to 2020 (hm2).
Based on the “Evaluation Specification of Wetland Ecosystem in Heilongjiang Province” (DB 23/T 2378-2019, 2019), the equal interval method was used to divide the calculated results of the WDCI into four degradation levels (Uyan, 2014; Glanville and Chang, 2015; Lobatskaya and Strelchenko, 2016; Patriche et al., 2016), which were as follows: severe degradation (WDCI ≤ 0.335), moderate degradation (0.335 < WDCI ≤ 0.470), mild degradation (0.470 < WDCI ≤ 0.605), and no degradation (0.605 < WDCI ≤ 0.740), and the corresponding degradation grades were assigned 1, 2, 3 and 4, respectively.
The severely degraded areas in 1990, 2000, 2010 and 2020 accounted for 42.50%, 20.52%, 49.61% and 41.14% of the total area, respectively (Figure 7). The severely degraded areas in 1990, 2010 and 2020 accounted for a large proportion, and the overall degradation was the most serious in 2010. In the first stage, the severely degraded area decreased by approximately 50%, while in the second stage, the severely degraded area increased by 140%. The severely degraded area was mainly distributed in the southwest of the study area, including the Gendeli Farm, Qinglongshan Farm, Qixing Farm, Qianjin Farm, Honghe Farm, Chungye Farm and Hongwei Farm. Qinglongshan Farm, Qianjin Farm and Qixing Farm were the most representative, and the severely degraded areas in the four periods accounted for 85.52%, 40.28%, 94% and 52.33% of the whole area, respectively. The moderately and mildly degraded areas accounted for 75.74%, 87.12%, 74% and 69.42% of the total area in the four periods, respectively. The proportion of moderately degraded areas was the largest in 2000 and the smallest in 2020. The moderately degraded areas were distributed mainly in the southeastern part of the study area, and the overall area showed a downward trend, with a large decline from 2000 to 2010. The slightly degraded area showed an overall upward trend, and the area of slightly degraded area accounted for the largest proportion of the total area, which was 40.43%. The area change of the nondegraded area was relatively stable and concentrated in the central region, which was due to the distribution of a certain number of wetland nature reserves (Table 5).
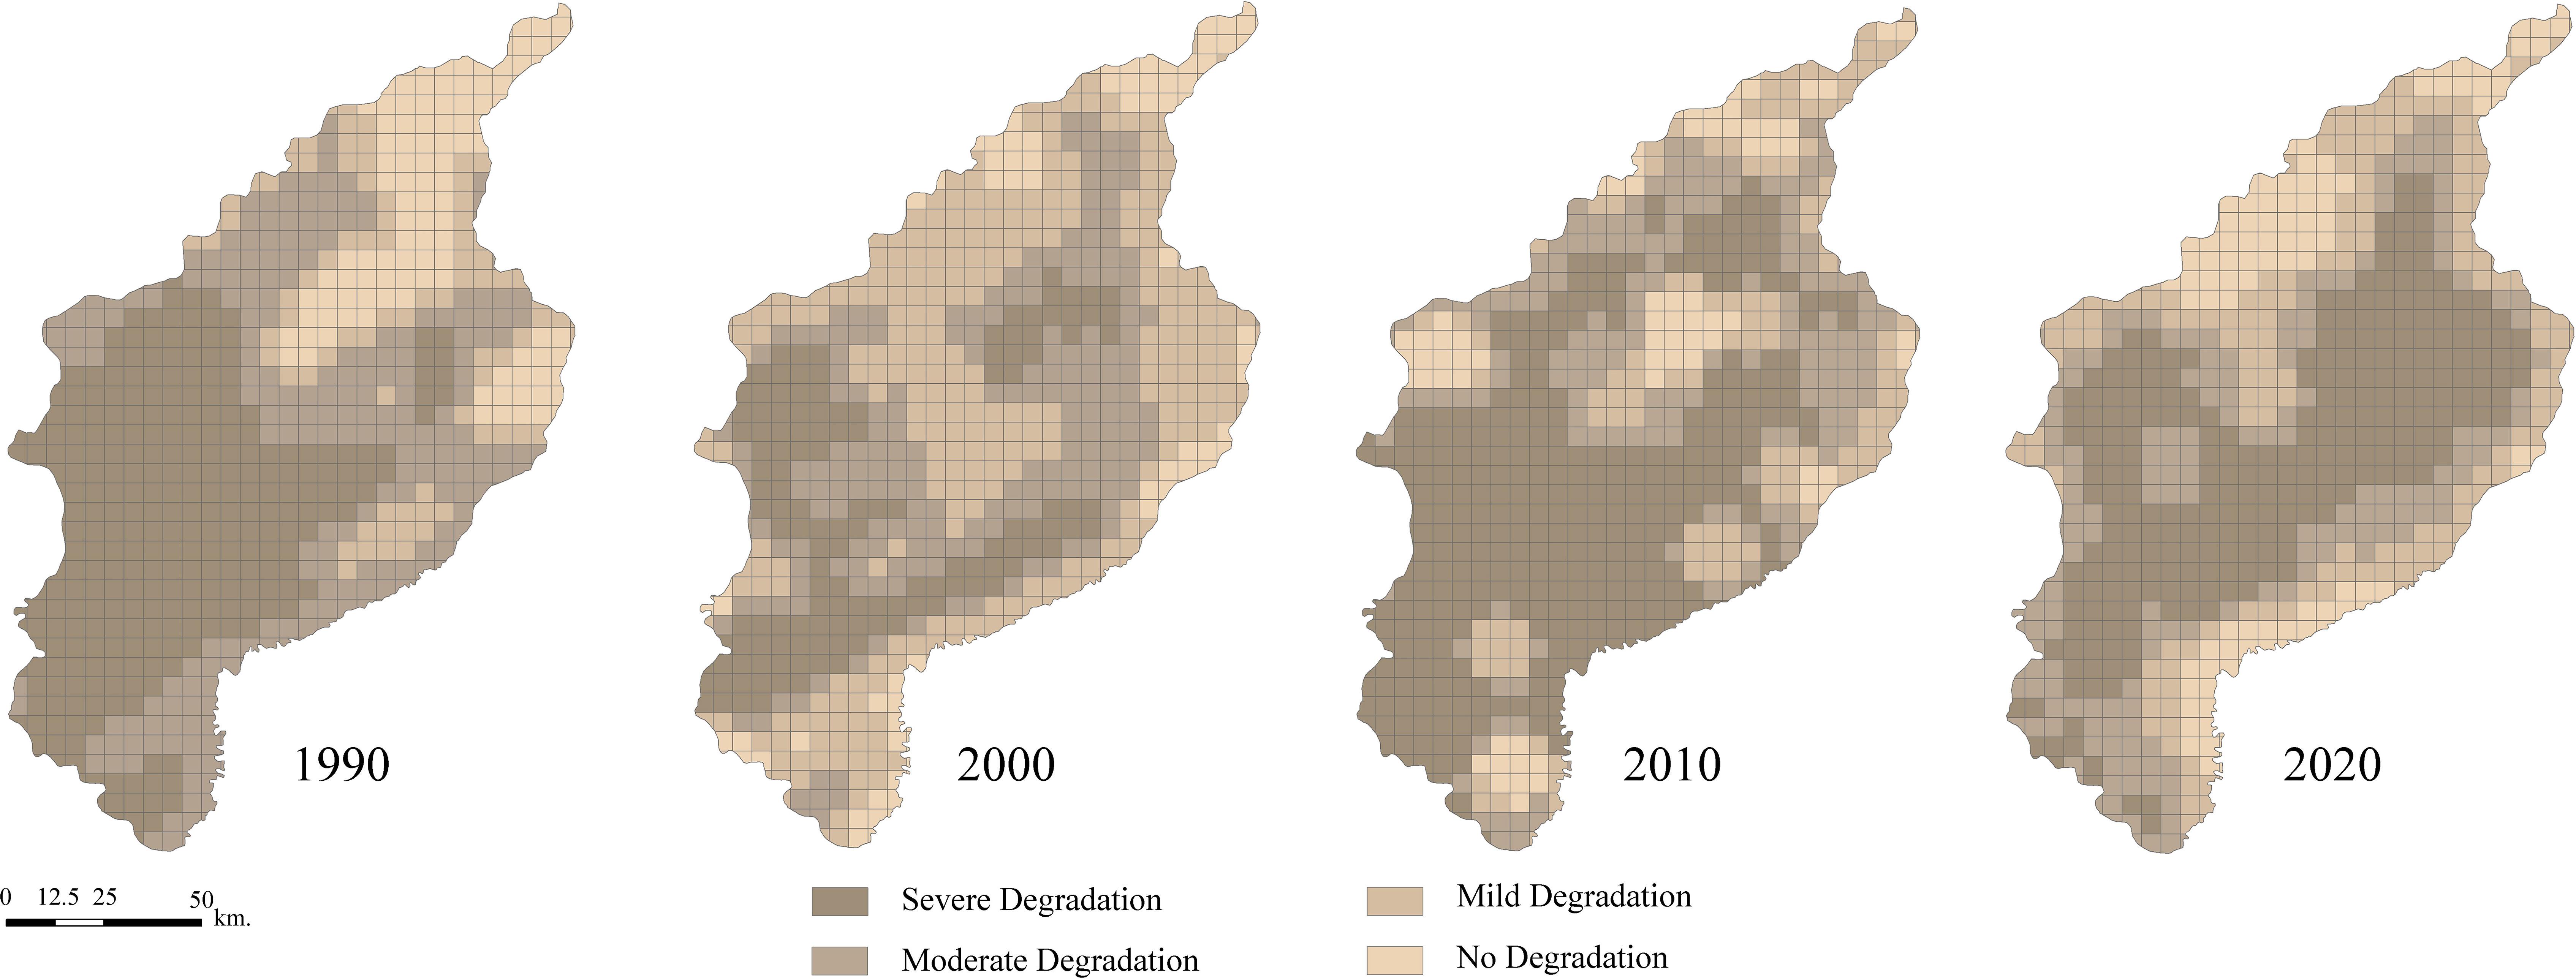
Figure 7 The distribution of wetland degradation characteristics in the study area.
Table 5 Area of wetland degradation comprehensive index from 1990 to 2020 in the study area (hm2).
To better visually reveal the spatial and temporal variation of wetland ecological degradation in the Small Sanjiang Plain from 1990 to 2020, a spatial overlay analysis of wetland degradation in different periods was completed using ArcGIS, and three stages of wetland degradation mapping were generated from 1990–2000, 2000–2010 and 2010–2020 (Table 6).
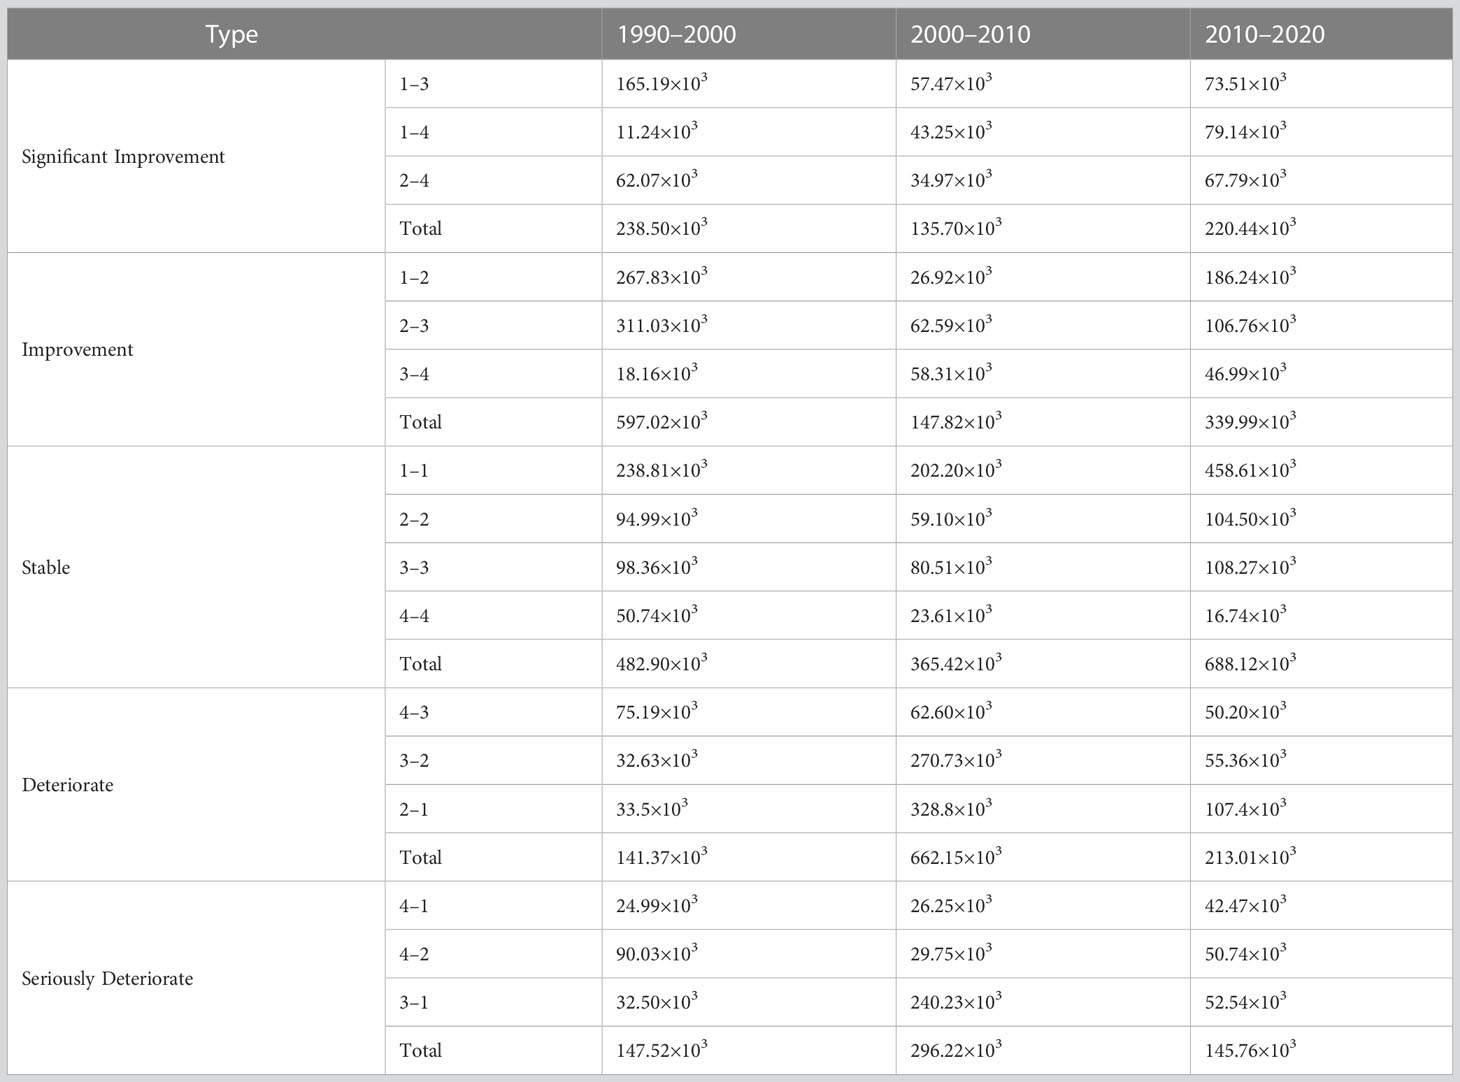
Table 6 Proportional distribution of degraded wetland areas in townships and farms of the study area(hm2).
The areas of significant improvement in the three periods were 238.50×10³ hm2, 135.70×10³ hm2 and 220.44×10³ hm2, respectively. The severe degradation → mild degradation (Code13) transition was the largest area change mapped in the first period, and the transformation area reached 165.19×10³ hm2, mainly concentrated in Yaluhe Farm and Honghe Farm, which was largely attributed to the promotion of the Heilongjiang Honghe Nature Reserve from the provincial to national level in 1996. Under the implementation of the national wetland protection policy, some regional wetlands have been effectively protected, and degradation has been alleviated to some extent. Change over the second period was mainly concentrated in the northern area of Qianqiang Farm and Qianfeng Farm, and the maximum area mapped was still heavily degraded → lightly degraded (Code13) 57.47×10³ hm2, which was mainly attributed to the establishment of the Naoli River and Qixing River Nature Reserve in the central part of the area, which has preserved a large number of marsh wetlands. Change over the third period was mainly concentrated in Bacha Township, Linjiang Township, Jinchuan Township, Yinchuan Township and the southern area of Xiaojiahe Township. The largest area mapped was severe degradation → no degradation (Code14), which covered an area of 79.14×10³ hm2. The region’s wetlands were mostly river mudflat wetlands distributed on both sides of the Yalu River. After 2010, the local government began to pay attention to wetland protection and implemented scientific wetland protection policy, actively implemented the project of returning farmland to wetlands and grass, and strictly restricted human interference activities of regional cropland and built-up land encroaching on the wetland. The wetland has been well protected, and its ecological condition has been improved to a great extent, which is also directly related to the establishment of the Bacha Island Nature Reserve in the area. A total of 97.32% of the heavily degraded wetland area in 1990 was restored to 88.32% of the nondegraded state in 2020. The areas with improvement were 597.02× 10³ hm2, 147.82×10³ hm2 and 339.99×10³ hm2, with a more dispersed overall distribution. Change over the first period was concentrated mainly in some areas in the central and southern parts of the country and in the areas of Linjiang Township, Jinchuan Township and Yinchuan Township in the northwest, with the largest area mapped as moderate degradation → mild degradation (Code23), and the area was 311.03×10³ hm2. Change over the third period with the largest area mapped was severe degradation → moderate degradation (Code12). This change was directly related to the local government’s protection of wetlands and farmers’ increased awareness of the ecological value of wetlands (Figure 8).
Figure 8 Degradation transform classification in the study area.
The stable areas of the three periods were 482.90×10³ hm2, 365.42×10³ hm2 and 688.12×10³ hm2, respectively. The area proportions of continuous severe degradation (Code11) were 49.45%, 55.33% and 66.65%, respectively, accounting for the highest proportion in the past 30 years, concentrated mainly in the areas of Qindeli Farm, Qinglongshan Farm, Qixing Farm, Qianjin Farm, Honghe Farm, Chuangye Farm and Hongwei Farm. The main land types in this area were cultivated land. The enhancement of the degree of human interference increased the disturbance to wetlands, resulting in the transformation of wetland into cultivated land, and the serious degradation of the regional wetland was aggravated while the area of cultivated land increased. Mild degradation and no degradation areas were concentrated mainly in Honghe Farm, Qianfeng Farm and Yaluhe Farm of the central region and in Tongjiang township of the north, near the Honghe wetland nature reserve and Heixiazi Island Wetland Park, China. The overall ecological condition was stable under mild degradation and no degradation conditions.
The deteriorated areas of the three stages were 141.37×10³ hm2, 662.15×10³ hm2 and 213.01×10³ hm2, respectively. In the second stage, the areas of mild degradation → moderate degradation (Code32) and moderate degradation → severe degradation (Code21) were relatively large, concentrated mainly in Nongjiang Farm, Honghe Farm, Xianfeng Farm, Erdaohe Farm, Qianshao Farm, Hanconggou town and Haiqing township in the central and northern parts of the country. The areas of serious deterioration were 147.52×10³ hm2, 296.22×10³ hm2 and 145.76×10³ hm2, respectively, and the proportions of no deterioration → serious deterioration (Code 41) areas were 16.94%, 8.86% and 29.14%, respectively. In the third stage, which was mild degradation → serious degradation (Code31), the area ratios were 22.03%, 81.10% and 36.05%, respectively, and a maximum was reached in the second stage. Seriously deteriorated areas radiated mainly from the northern part of Qianshao Farm. The second and third stages of marsh wetland transitioning into cultivated land were still the main regional land process, and wetland protection policy played a role; however, human activities and the drive for economic benefits caused farmland reclamation activity to intensify, and the transition of wetlands to farmland continued, the center of gravity of the cultivated land expansion constantly moved north, and natural landscape fragmentation continued.
The protection and restoration of degraded wetlands have become important issues at present, and exploring the root causes of wetland degradation can provide a more scientific and targeted basis for wetland conservation policies and actions.
In the late 1980s, continuous agricultural modernization and rapid increases in population drove increased development activities in the wetlands in this area, including unsustainable human activities such as grassland and wetland reclamation (Zhou et al., 2009). As a result, the natural landscape, which was mainly composed of wetlands and grassland, was replaced by an artificial landscape (farmland), and the natural ecosystem gradually transformed into an agricultural ecosystem, and the natural landscape became fragmented. Especially after 1983, the government intensified the construction of farmland water conservancy projects such as the water intake project and the project supporting field drainage and diversion in the Small Sanjiang Plain so that irrigation water for farmland was fully guaranteed. Under large-scale agricultural development activities (Liu et al., 2004b), paddy field areas increased rapidly, a large amount of natural vegetation was replaced by paddy fields, and some regional natural ecosystems gradually transformed into agricultural ecosystems. According to statistics, during the decade from 1980 to 1990, the rapid expansion of agriculture and the rapid development of cities and towns resulted in a reduction of 340.32×10³ hm2 of wetland. In parallel, the increased population generated domestic sewage that entered the wetland ecosystem, which resulted in an intensification of regional ecological environment pollution, a change in vegetation type, a reduction in biomass and the fragmentation of large-scale wetland landscapes (Sun et al., 2014). Regional marshe wetlands changed from carbon sinks to carbon sources (Song et al., 2008). The transformation of wetland to cropland can produce huge economic benefits in a short period of time, but it has degraded natural ecosystems. Therefore, agricultural policy changes and wetland ecological are necessary for sustainable development in China (Lai et al., 2020; Ma et al., 2020).
In the late 1990s, the trend of wetland area reduction in the study area was somewhat curbed with the introduction of the national policy of restoring wetlands such as returning farmland to wetlands and the establishment of ecological reserves, especially the establishment of the Honghe Protected Area and Sanjiang Protected Area (Du et al., 2023). From 1990 to 2000, the wetland area of the study area increased by 82.68×10³ hm2, and the average biomass per unit area increased by 653.85 kg/hm2, indicating that wetland degradation was alleviated to a certain extent during this period. However, the encroachment of some regional wetlands occurred, and there was still encroachment of wetlands in the northeastern part of the study area. This condition showed the demand for farmland expansion and was a direct reflection of human interference activities on wetland resources (Li et al., 2023).
In 2003, the “Heilongjiang Wetland Protection Regulations” strengthened the protection of wetland resources. However, from 2000 to 2010, the wetland area of the Small Sanjiang Plain decreased by 236.56×10³ hm2, and the average biomass per unit area decreased by 638.4 kg/hm2. In the national agricultural policy adjustment, various investments and changes in climate, the government encouraged people to increase the drainage network and construct road systems, artificially increasing the development and utilization of the last remaining marsh wetland area, which not only caused vast areas of wetlands to gradually become atrophic and for fragmentation to increase but also accelerated the degeneration of the remaining wetland ecosystems (Du et al., 2018). As a result, some of the marshes-wetlands degraded into marshy meadows and dry meadows (Liu et al., 2017), the forest swamps in some areas almost disappeared, and the mixed landscape dominated by farmland and wetland gradually transformed into a landscape based on farmland.
Compared with 2010, the wetland area in 2020 increased by 114.62×10³ hm2, and the average biomass per unit area increased by 360.20 kg/hm2. This was due to a range of factors, including the adjustment of national agricultural policies, the implementation of ecological measures such as returning farmland to forests and wetlands, the introduction of the national ecological protection red line by the government and rationalization of land use in the study area. The study area has curbed wetland degradation to varying degrees by establishing Bacha Island National Nature Reserve in 1999, Heilongjiang Naoli River National Nature Reserve in 2002 and Heixizi Island National Wetland Park in 2012. In the future, the “14th Five-Year Plan for Ecological and Environmental Protection of Heilongjiang Province” released in 2021 will comprehensively promote the protection and restoration of wetland habitats and improve the quality of wetland ecosystems. In the same year, the “Construction Plan of Major Projects for Ecological Protection and Restoration of the Northeast Forest Belt (2021–2035)” was implemented, which established five ecological restoration zones of “three Rivers and two original fields” and clearly stipulated the restoration of natural wetlands in the Sanjiang Plain. The “Wetland Protection Law of the People’s Republic of China”, implemented in 2022, emphasized the protection of wetland functions, sustainable use and the integration of ecological, social and economic benefits. Therefore, the decreasing trend of wetland area in the study area was curtailed to a certain extent and policy settings have been put in place in an attempt to continue this trend.
In summary, human activities and national policy adjustments are important causes of wetland degradation in the Small Sanjiang Plain, revealing a positive correlation between the degradation status of wetlands and the degree of human interference in the study area. Although the current wetland protection and restoration work has been largely effective, the protection of wetlands requires reduced unsustainable agricultural development, strict compliance with the national ecological protection red line, improvements and enhancements of ecological service functions to promote high-quality socioecological and social development to build a sustainable development pattern in the Sanjiang Plain.
Wetlands are one of the most important environments for human beings, so it is important to assess the status and degradation trend in wetland resources to evaluate the effectiveness of wetland management (Song et al., 2014). Small Sanjiang Plain is a concentrated area of marsh wetland in China, which is also one of the richest and most critical areas of wetland resources and biodiversity. The studies of Li et al. (2020) and Yan (2020) on the dynamic changes in the core wetlands in the Small Sanjiang Plain showed that the wetlands were degraded and fragmentation was intensified. The studies of Chen et al. (2014) and Yan and Zhang (2019) also showed that the expansion of agricultural activities in the Small Sanjiang Plain in the past 30 years has reduced the value of ecosystem services provided by the wetlands. Therefore, the model constructed in this study provides an important new method for the quantitative evaluation of wetland ecosystems, that can be used to effectively explore the response mechanisms of wetlands to human activity and disturbance intensity over time and provide a scientific reference and theoretical guidance for the task of achieving balance between the sustainable development of wetlands and land development and utilization.
Moreover, compared with most of the documents with the unit as the research unit at the county level (Shen et al., 2019), this study combines the advantages of the geographic grid with administrative division to complete a longtime series of the wetland degradation variation law and human interference on the response mechanism of wetland degradation research (Yin et al., 2022; Chai et al., 2023). It makes the research results more accurate and reliable, and can provide a certain basis for the government in wetland conservation and restoration decisions.
The evaluation method employed in this study has certain limitations. First, this study uniformly used medium-resolution remote sensing data (30m resolution), so the classification accuracy of the land use data obtained was limited to some extent, and there are some uncertainties. Second, the primary land use classification adopted in this study is not able to explore the impact of secondary land use classifications, such as paddy fields and dry fields, in more detail. Finally, although the aboveground biomass of the Small Sanjiang Plain was calculated based on the relevant model, the process was proven to be feasible, and the results were credible, long-term positioning experimental data are still lacking, and it was impossible to verify the model more accurately, so estimation error still occurred. In summary, future research will continue to accumulate experimental data, continue to monitor the changes in wetlands in the Small Sanjiang Plain through remote sensing, and strive for a more accurate evaluation in the direction of a multidimensional and comprehensive assessment. Remote sensing images with a higher spatial resolution will be added to investigate wetland shrinkage and spatiotemporal pattern changes in the Small Sanjiang Plain, and more attention will be given to the transformation between wetlands and other land classes, as well as to further explore wetland changes outside the protected area.
This study combined the structure, function and changes in human activities of the Small Sanjiang Plain wetland ecosystem and set up the WDCI model in the study area to comprehensively and quantitatively assess wetland degradation from 1990 to 2020. Through a wetland degradation assessment, we provide a database for the recovery of degraded wetlands and related follow-up work. The results showed that the overall wetland degradation trend in the study area was severe in 1990 and 2010, and the degradation trend was alleviated in 2020. Moreover, the wetland degradation index in the southwest was significantly higher than that in the northeast, which was confirmed by the development trend of the overall ecological status of the study area. Therefore, the method was reasonable. In addition, the Small Sanjiang Plain is a typical marsh wetland in cold area in China that is subject to intense human disturbance. In this study, the WDCI model was optimized and the parameters were revised to construct the wetland degradation comprehensive index based on the characteristics of wetland ecosystems such as area, structure, function and human activities, and the index of human disturbance degree was added on the basis of retaining the original area, structure and function. And the applicability and reliability of WDCI on wetlands in cold areas are confirmed. Therefore, this study can also provide a new perspective for the selection of indicators and model construction for the comprehensive evaluation of wetland degradation in other cold regions.
The original contributions presented in the study are included in the article/supplementary material. Further inquiries can be directed to the corresponding authors.
WG conceived the research route; WG, YS, XD, MM, JH, GW, YZ, YX, XQ, TL, and TDL designed, and performed the experiments; WG, YS, and XD analyzed the data and wrote the main manuscript. All authors contributed to the article and approved the submitted version.
This research was supported by Hainan Provincial Natural Science Foundation of China, grant number 621RC507 and 421MS013; Hainan Ecological Environment Monitoring Project of China Meteorological Administration, grant number ZQC-J20142; the Science and Technology Project of Haikou City, China, grant number 2020-057; and the Natural Science Foundation of Hainan University, grant numbers KYQD (ZR) 20058, 1863 and 20057.
We appreciate the staff of the 3S laboratory of Hainan University, the Key Laboratory of Germplasm Resources of Tropical Special Ornamental Plants of Hainan Province, and the Haikou Urban Forestry Engineering Technology Development and Research Center. We also want to express our respect and thanks to the anonymous reviewers and the editors for their helpful comments in improving the quality of this paper.
The authors declare that the research was conducted in the absence of any commercial or financial relationships that could be construed as a potential conflict of interest.
All claims expressed in this article are solely those of the authors and do not necessarily represent those of their affiliated organizations, or those of the publisher, the editors and the reviewers. Any product that may be evaluated in this article, or claim that may be made by its manufacturer, is not guaranteed or endorsed by the publisher.
Behn K., Becker M., Burghof S., Möseler B. M., Willy D. K., Alvarez M. (2018). Using vegetation attributes to rapidly assess degradation of East African wetlands. Ecol. Indic. 89, 250–259. doi: 10.1016/j.ecolind.2018.02.017
Chai C., Zhang B., Li Y., Niu W., Zheng W., Kong X., et al. (2023). A new multi-dimensional framework considering environmental impacts to assess green development level of cultivated land during 1990 to 2018 in China. Environ. Impact Assess. Rev. 98, 106927. doi: 10.1016/j.eiar.2022.106927
Chen J., Sun B.-M., Chen D., Wu X., Guo L.-Z., Wang G. (2014). Land use changes and their effects on the value of ecosystem services in the Small Sanjiang Plain in China. Sci. World J. 2014, 752846. doi: 10.1155/2014/752846
Chen J., Yu L., Yan F., Zhang S. (2020). Ecosystem service loss in response to agricultural expansion in the small sanjiang plain, northeast China: process, driver and management. Sustainability 12, 2430. doi: 10.3390/su12062430
Chen A., Zhu B., Chen L., Wu Y., Sun R. (2010). Dynamic changes of landscape pattern and eco-disturbance degree in Shuangtai estuary wetland of Liaoning Province, China. Chin. J. Appl. Ecolog. 21, 1120–1128. doi: 10.13287/j.1001-9332.2010.0191
Cui L., Li G., Liao H., Ouyang N., Li X., Liu D. (2022). Remote sensing of coastal wetland degradation using the landscape directional succession model. Remote Sens. 14, 5273. doi: 10.3390/rs14205273
Cui L., Li G., Liao H., Ouyang N., Zhang Y. (2015). Integrated approach based on a regional habitat succession model to assess wetland landscape ecological degradation. Wetlands 35, 281–289. doi: 10.1007/s13157-014-0617-z
Dar S. A., Bhat S. U., Rashid I., Dar S. A. (2020). Current status of wetlands in srinagar city: threats, management strategies, and future perspectives. Front. Environ. Sci. 7. doi: 10.3389/fenvs.2019.00199
Dar S. A., Rashid I., Bhat S. U. (2021). Land system transformations govern the trophic status of an urban wetland ecosystem: perspectives from remote sensing and water quality analysis. Land Degradation Dev. 32, 4087–4104. doi: 10.1002/ldr.3924
Du C., Gong L., Zhang Z., Zhao H., Wu S., Tian B., et al. (2018). Characteristics and effects on crop production of heat resources changes in heilongjiang province. Chin. J. Ecol. Agric. (in English Chinese) 26, 242–252. doi: 10.13930/j.cnki.cjea.170621
Du G., Xie J., Hou D., Yu F. (2023). Regional differences in the green use level of cultivated land in the heilongjiang reclamation area. Front. Environ. Sci. 11. doi: 10.3389/fenvs.2023.1134271
Erwin K. L. (2009). Wetlands and global climate change: the role of wetland restoration in a changing world. Wetlands Ecol. Manage. 17, 71–84. doi: 10.1007/s11273-008-9119-1
Fang X.-S., Liu S., Chen W.-Z., Wu R.-Z. (2021). An effective method for wetland park health assessment: a case study of the guangdong xinhui national wetland park in the pearl river delta, China. Wetlands 41, 1–16. doi: 10.1007/s13157-021-01418-5
Gianopulos K. (2018). Performance of rapid floristic quality assessment indices for increasing cost-effectiveness of wetland condition evaluation. Ecol. Indic. 95, 502–508. doi: 10.1016/j.ecolind.2018.08.003
Glanville K., Chang H.-C. (2015). Mapping illegal domestic waste disposal potential to support waste management efforts in Queensland, Australia. Int. J. Geographical Inf. Sci. 29, 1042–1058. doi: 10.1080/13658816.2015.1008002
Gong M., Wen W., Zhang W., Zhao Q., Wang J., Li H., et al. (2020). A study of patterns of wetland landscapes in fangshan district of Beijing. WETLAND Sci. Manage. 16, 41–44. doi: 10.3969/j.issn.1673-3290.2020.04.10
Gong W., Yuan L., Fan W., Stott P. (2015). Analysis and simulation of land use spatial pattern in Harbin prefecture based on trajectories and cellular automata–Markov modelling. Int. J. Appl. Earth Observation Geoinformation 34, 207–216. doi: 10.1016/j.jag.2014.07.005
Han Y., Pei L., Du J. (2014). Remote sensing inversion of aboveground biomass over the honghe wetland. Remote Sens. Technol. Appl. 29, 224–231. doi: 10.11873/j.issn.1004-0323.2014.2.0224
Held A., Ticehurst C., Lymburner L., Williams N. (2003). High resolution mapping of tropical mangrove ecosystems using hyperspectral and radar remote sensing. Int. J. Remote Sens. 24, 2739–2759. doi: 10.1080/0143116031000066323
Hill M. O., Roy D. B., Thompson K. (2002). Hemeroby, urbanity and ruderality: bioindicators of disturbance and human impact. J. Appl. Ecol. 39, 708–720. doi: 10.1046/j.1365-2664.2002.00746.x
Houborg R., Fisher J. B., Skidmore A. K. (2015). Advances in remote sensing of vegetation function and traits. Int. J. Appl. Earth Obs. Geoinf. 43, 1–6. doi: 10.1016/j.jag.2015.06.001
Hu T., Liu J., Zheng G., Zhang D., Huang K. (2020). Evaluation of historical and future wetland degradation using remote sensing imagery and land use modeling. Land Degradation Dev. 31, 65–80. doi: 10.1002/ldr.3429
Jiang W., Lv J., Wang C., Chen Z., Liu Y. (2017). Marsh wetland degradation risk assessment and change analysis: a case study in the zoige plateau, China. Ecol. Indic. 82, 316–326. doi: 10.1016/j.ecolind.2017.06.059
Jie W.-H., Xiao C.-L., Zhang C., Zhang E., Li J.-Y., Wang B., et al. (2021). Remote sensing-based dynamic monitoring and environmental change of wetlands in southern Mongolian plateau in 2000–2018. China Geology 4, 353–363. doi: 10.31035/cg2021032
Kotze D., Ellery W., Macfarlane D., Jewitt G. (2012). A rapid assessment method for coupling anthropogenic stressors and wetland ecological condition. Ecol. Indic. 13, 284–293. doi: 10.1016/j.ecolind.2011.06.023
Lai Z., Chen M., Liu T. (2020). Changes in and prospects for cultivated land use since the reform and opening up in China. Land Use Policy 97, 104781. doi: 10.1016/j.landusepol.2020.104781
Lhermitte S., Verbesselt J., Verstraeten W. W., Coppin P. (2011). A comparison of time series similarity measures for classification and change detection of ecosystem dynamics. Remote Sens. Environ. 115, 3129–3152. doi: 10.1016/j.rse.2011.06.020
Li G., Fang C., Qi W. (2021). Different effects of human settlements changes on landscape fragmentation in China: evidence from grid cell. Ecol. Indic. 129, 107927. doi: 10.1016/j.ecolind.2021.107927
Li Z., Liu M., Hu Y., Xue Z., Sui J. (2020). The spatiotemporal changes of marshland and the driving forces in the sanjiang plain, northeast China from 1980 to 2016. Ecol. processes 9, 1–13. doi: 10.1186/s13717-020-00226-9
Li X., Wu K., Yang Q., Hao S., Feng Z., Ma J. (2023). Quantitative assessment of cultivated land use intensity in Heilongjiang Province, China 2001 -2015. Land Use Policy 125, 106505. doi: 10.1016/j.landusepol.2022.106505
Lin S., Li X., Yang B., Ma Y., Jiang C., Xue L., et al. (2021). Systematic assessments of tidal wetlands loss and degradation in shanghai, China: from the perspectives of area, composition and quality. Global Ecol. Conserv. 25, e01450. doi: 10.1016/j.gecco.2020.e01450
Liu J., Dong C., Sheng L., Liu Y. (2016). Landscape pattern change of the marsh and its response to human disturbance in the Small Sanjiang Plain 1955-2010. Scientia Geographica Sin. 36, 879–887. doi: 10.13249/j.cnki.sgs.2016.06.010
Liu J., Du B., Sheng L., Tian X. (2017). Dynamic patterns of change in marshes in the sanjiang plain and their influential factors. Adv. Water Sci. 28, 22–31. doi: 10.14042/j.cnki.32.1309.2017.01.003
Liu W., Liu G., Liu H., Song Y., Zhang Q. (2013). Subtropical reservoir shorelines have reduced plant species and functional richness compared with adjacent riparian wetlands. Environ. Res. Lett. 8, 44007. doi: 10.1088/1748-9326/8/4/044007
Liu X., Ma X. (2000). Influence of Large-scale reclamation on natural environment and regional environmental protection in the sanjiang plain. SCIENTIA GEOGRAPHICA Sin. 20, 14–19. doi: 10.3969/j.issn.1000-0690.2000.01.003
Liu H., Zhang S., Li Z., Lu X., Yang Q. (2004a). Impacts on wetlands of large-scale land-use changes by agricultural development: the Small Sanjiang Plain, China. AMBIO: A J. Hum. Plain Environ. 33, 306–310. doi: 10.1579/0044-7447-33.6.306
Liu H., Zhang S., Lu X. (2004b). Wetland landscape structure and the spatial-temporal changes in 50 years in the Sanjiang Plain. Acta Geographica Sin. 59, 391–400. doi: 10.3321/j.issn:0375-5444.2004.03.009
Liu J., Zhao D., Tian X., Zhao L., Liu J. (2014). Landscape pattern dynamics and driving forces analysis in the Sanjiang Plain from 1954 to 2010. Acta Ecologica Sin. 34, 3234–3244. doi: 10.5846/stxb201306101639
Lobatskaya R., Strelchenko I. (2016). GIS-based analysis of fault patterns in urban areas: a case study of Irkutsk city, Russia. Geosci. Front. 7, 287–294. doi: 10.1016/j.gsf.2015.07.004
Luo C., Fu X., Zeng X., Cao H., Wang J., Ni H., et al. (2022). Responses of remnant wetlands in the Sanjiang Plain to farming-landscape patterns. Ecol. Indic. 135, 108542. doi: 10.1016/j.ecolind.2022.108542
Ma L., Long H., Tu S., Zhang Y., Zheng Y. (2020). Farmland transition in China and its policy implications. Land Use Policy 92, 104470. doi: 10.1016/j.landusepol.2020.104470
Malekmohammadi B., Blouchi L. R. (2014). Ecological risk assessment of wetland ecosystems using multi criteria decision making and geographic information system. Ecol. Indic. 41, 133–144. doi: 10.1016/j.ecolind.2014.01.038
Miller S. J., Wardrop D. H. (2006). Adapting the floristic quality assessment index to indicate anthropogenic disturbance in central Pennsylvania wetlands. Ecol. Indic. 6, 313–326. doi: 10.1016/j.ecolind.2005.03.012
Myers S., Clarkson B. R., Reeves P., Clarkson B. D. (2013). Wetland management in new Zealand: are current approaches and policies sustaining wetland ecosystems in agricultural landscapes? Ecol. Eng. 56, 107–120. doi: 10.1016/j.ecoleng.2012.12.097
Niu L., Zou G., Guo Y., Li Y., Wang C., Hu Q., et al. (2022). Eutrophication dangers the ecological status of coastal wetlands: a quantitative assessment by composite microbial index of biotic integrity. Sci. Total Environ. 816, 151620. doi: 10.1016/j.scitotenv.2021.151620
Patriche C. V., Pirnau R., Grozavu A., Rosca B. (2016). A comparative analysis of binary logistic regression and analytical hierarchy process for landslide susceptibility assessment in the dobrov river basin, Romania. Pedosphere 26, 335–350. doi: 10.1016/s1002-0160(15)60047-9
Pu R., Gong P., Tian Y., Miao X., Carruthers R. I., Anderson G. L. (2008). Using classification and NDVI differencing methods for monitoring sparse vegetation coverage: a case study of saltcedar in Nevada, USA. Int. J. Remote Sens. 29, 3987–4011. doi: 10.1080/01431160801908095
Qu Y., Zheng Y., Gong P., Shi J., Li L., Wang S., et al. (2022). Estimation of wetland biodiversity based on the hydrological patterns and connectivity and its potential application in change detection and monitoring: a case study of the sanjiang plain, China. Sci. Total Environ. 805, 150291. doi: 10.1016/j.scitotenv.2021.150291
Rashid I., Dar S. A., Bhat S. U. (2022). Modelling the hydrological response to urban land-use changes in three wetland catchments of the Western Himalayan region. Wetlands 42, 64. doi: 10.1007/s13157-022-01593-z
Shen M., Liu X. (2021). Assessing the effects of lateral hydrological connectivity alteration on freshwater ecosystems: a meta-analysis. Ecol. Indic. 125, 107572. doi: 10.1016/j.ecolind.2021.107572
Shen G., Yang X., Jin Y., Xu B., Zhou Q. (2019). Remote sensing and evaluation of the wetland ecological degradation process of the zoige plateau wetland in China. Ecol. Indic. 104, 48–58. doi: 10.1016/j.ecolind.2019.04.063
Sileshi A., Awoke A., Beyene A., Stiers I., Triest L. (2020). Water purifying capacity of natural riverine wetlands in relation to their ecological quality. Front. Environ. Sci. 8. doi: 10.3389/fenvs.2020.00039
Slagter B., Tsendbazar N.-E., Vollrath A., Reiche J. (2020). Mapping wetland characteristics using temporally dense sentinel-1 and sentinel-2 data: a case study in the st. Lucia wetlands, south Africa. Int. J. Appl. Earth Observation Geoinformation 86, 102009. doi: 10.1016/j.jag.2019.102009
Song K., Liu D., Wang Z., Zhang B., Jin C., Li F., et al. (2008). Land use change in Sanjiang Plain and its driving forces analysis since 1954. Acta Geographica Sin. 01, 93–104. doi: 10.3321/j.issn:0375-5444.2008.01.010
Song K., Wang Z., Du J., Liu L., Zeng L., Ren C. (2014). Wetland degradation: its driving forces and environmental impacts in the sanjiang plain, China. Environ. Manage. 54, 255–271. doi: 10.1007/s00267-014-0278-y
Sun B., Chen Q., Wu X., Chen D., Zhang Y., Guo L. (2014). Ecosystem services value based on land-use changes in the small sanjiang plain. J. Irrigation Drainage 33, 261–265. doi: 10.13522/j.cnki.ggps.2014.04/05.057
Sun J., Han Y., Li Y., Zhang P., Liu L., Cai Y., et al. (2021). Construction of a near-natural estuarine wetland evaluation index system based on analytical hierarchy process and its application. Water 13, 2116. doi: 10.3390/w13152116
Uyan M. (2014). MSW landfill site selection by combining AHP with GIS for konya, Turkey. Environ. Earth Sci. 71, 1629–1639. doi: 10.1007/s12665-013-2567-9
Van Dam R., Camilleri C., Finlayson C. (1998). The potential of rapid assessment techniques as early warning indicators of wetland degradation: a review. Environ. Toxicol. Water Quality: Int. J. 13, 297–312. doi: 10.1002/(sici)1098-2256(1998)13:4<297::aid-tox3>3.0.co;2-2
Wan L., Zhang Y., Zhang X., Qi S., Na X. (2015). Comparison of land use/land cover change and landscape patterns in honghe national nature reserve and the surrounding jiansanjiang region, China. Ecol. Indic. 51, 205–214. doi: 10.1016/j.ecolind.2014.11.025
Wang Y. (2021). Evaluation of lake wetland ecotourism resources based on remote sensing ecological index. Arabian J. Geosciences 14, 1–8. doi: 10.1007/s12517-021-06892-z
Wang D., Gong J., Zhang L. (2011). "Joint rectification of image series classification results based on trajectory analysis", in Remote Sensing of the Environment: The 17th China Conference on Remote Sensing. (Zhejiang, China: SPIE) 59–66. doi: 10.1117/12.910366
Wang S., Li S. (2015). Wetland ecosystem health and disturbance factors analysis on the sanjiang plain based on SEM theory. J. Northeast Forestry Univ. 43, 101–101. doi: 10.3969/j.issn.1000-5382.2015.02.024
Wang Z., Song K., Ma W., Ren C., Zhang B., Liu D., et al. (2011). Loss and fragmentation of marshes in the sanjiang plain, northeast chin–2005. Wetlands 31, 945–954. doi: 10.1007/s13157-011-0209-0
Wang R., Wang Y., Yang Q., Yang G., Zhang G., Liu B. (2000). The current situation, problems and countermeasures of wetland resources in China. Resour. Sci. 22, 9–13. doi: 10.3321/j.issn:1007-7588.2000.01.003
Wu T., Zha P., Yu M., Jiang G., Zhang J., You Q., et al. (2021). Landscape pattern evolution and its response to human disturbance in a newly metropolitan area: a case study in jin-yi metropolitan area. Land 10, 767. doi: 10.3390/land10080767
Yan F. (2020). Large-Scale marsh loss reconstructed from satellite data in the small sanjiang plain since 1965: process, pattern and driving force. Sensors 20, 1036. doi: 10.3390/s20041036
Yan F., Zhang S. (2019). Ecosystem service decline in response to wetland loss in the sanjiang plain, northeast China. Ecol. Eng. 130, 117–121. doi: 10.1016/j.ecoleng.2019.02.009
Yang Z., Bai J., Zhang W. (2021). Mapping and assessment of wetland conditions by using remote sensing images and POI data. Ecol. Indic. 127, 107485. doi: 10.1016/j.ecolind.2021.107485
Yin L., Cheng Z. (2019). "Study on 3S technology applied in law enforcement of satellite image", in Proceedings of the 2019 2nd International Conference on Geoinformatics and Data Analysis, NY, America. 104–109. doi: 10.1145/3318236.3318244
Yin T., Feng Y., Liang S., Wang G., Yuan N., Yan D., et al. (2022). A suitable method for alpine wetland delineation: an example for the headwater area of the yellow river, Tibetan plateau front. Environ. Sci. doi: 10.3389/fenvs.2022.1062954
Zekarias T., Govindu V., Kebede Y., Gelaw A. (2021). Degradation of wetlands and livelihood benefits of Lake Abaya-Chamo wetland, southern Ethiopia. Curr. Res. Environ. Sustainability 3, 100060. doi: 10.21203/rs.3.rs-165097/v1
Zeng H., Liu G. (1999). Analysis of regional ecological risk based on landscape structure. China Environ. Sci. 19, 454–457. doi: 10.3321/j.issn:1000-6923.1999.05.017
Zhao Y., Liao J., Bao X., Ma M. (2021). Soil seed bank dynamics are regulated by bird diversity and soil moisture during alpine wetland degradation. Biol. Conserv. 263, 109360. doi: 10.1016/j.biocon.2021.109360
Zhou D., Gong H., Wang Y., Khan S., Zhao K. (2009). Driving forces for the marsh wetland degradation in the honghe national nature reserve in sanjiang plain, northeast China. Environ. modeling Assess. 14, 101–111. doi: 10.1007/s10666-007-9135-1
Zhou Y., Ning L., Bai X. (2018). Spatial and temporal changes of human disturbances and their effects on landscape patterns in the jiangsu coastal zone, China. Ecol. Indic. 93, 111–122. doi: 10.1016/j.ecolind.2018.04.076
Keywords: wetland, ecological degradation assessment, remote sensing, land use, Small Sanjiang Plain, Northeast China
Citation: Sun Y, Wu G, Mao M, Duan X, Hu J, Zhang Y, Xie Y, Qiu X, Gong W, Liu T and Liu T (2023) Remote sensing and environmental assessment of wetland ecological degradation in the Small Sanjiang Plain, Northeast China. Front. Ecol. Evol. 11:1125775. doi: 10.3389/fevo.2023.1125775
Received: 16 December 2022; Accepted: 03 July 2023;
Published: 20 July 2023.
Edited by:
Zhongqing Yan, Chinese Academy of Forestry, ChinaReviewed by:
Michael Alister Reid, University of New England, AustraliaCopyright © 2023 Sun, Wu, Mao, Duan, Hu, Zhang, Xie, Qiu, Gong, Liu and Liu. This is an open-access article distributed under the terms of the Creative Commons Attribution License (CC BY). The use, distribution or reproduction in other forums is permitted, provided the original author(s) and the copyright owner(s) are credited and that the original publication in this journal is cited, in accordance with accepted academic practice. No use, distribution or reproduction is permitted which does not comply with these terms.
*Correspondence: Wenfeng Gong, OTk0MjA2QGhhaW5hbnUuZWR1LmNu; Tao Liu, ZGFsaXVfMTk3OEAxMjYuY29t; Tiedong Liu, bGl1QGhhaW5hbnUuZWR1LmNu
†These authors have contributed equally to this work
Disclaimer: All claims expressed in this article are solely those of the authors and do not necessarily represent those of their affiliated organizations, or those of the publisher, the editors and the reviewers. Any product that may be evaluated in this article or claim that may be made by its manufacturer is not guaranteed or endorsed by the publisher.
Research integrity at Frontiers
Learn more about the work of our research integrity team to safeguard the quality of each article we publish.