
95% of researchers rate our articles as excellent or good
Learn more about the work of our research integrity team to safeguard the quality of each article we publish.
Find out more
ORIGINAL RESEARCH article
Front. Ecol. Evol. , 15 May 2023
Sec. Paleoecology
Volume 11 - 2023 | https://doi.org/10.3389/fevo.2023.1120460
This article is part of the Research Topic Paleolimnology: Insights from Sedimentary Archives View all 14 articles
 Kelly L. Kirsten1,2†
 Lauren Pretorius3†
 Michael E. Meadows4,5*Rieneke Weij1,2Marco Aquino-López6Helen G. Antonopoulos5
 Yakhuluntu Dubazana5
 Abdul Qadeer7Jemma Finch3
 Kunshan Bao8
Introduction: Estuaries are highly vulnerable systems and increasingly exposed to a number of environmental, climatic and human-induced stressors. The Knysna estuary and lagoon complex, on the south coast of South Africa, is regarded as environmentally and economically important, yet faces regional impacts resulting from ongoing urbanisation and land use change as well as the significant global threats of rising sea levels and changing climate. Although the estuary has been reasonably well studied in terms of modern ecological processes, little is known of how the system has responded to changes in the longer term, not least the impact of European colonization and subsequent population growth and economic development.
Methods: In order to address this shortcoming, a series of shallow (<1 m) cores was extracted from a range of representative habitats and marine influences in the estuary and three of these (namely KNY-19A, KNY-19B, KNY-19G) selected for detailed analysis, including organic matter content, magnetic susceptibility, selected elemental analysis and particle size.
Results and Discussion: Notwithstanding the challenges of dating estuarine sediments due to the possibility of erosion and resuspension, combined modelling of 210Pb and 14C ages is successfully deployed to develop an age-depth relationship for each core, providing a chronological framework for late Holocene environmental changes. Sedimentary characteristics of the three cores, taken in contrasting estuarine conditions, yield insights as to how different parts of the estuary responded to changes in sea level and anthropogenic activities in and around the Knysna basin, as well as in the wider catchment.
Estuaries are dynamic, turbulent and extremely productive systems that provide a multitude of ecosystem services, including nutrient regulation, storm protection, food provision, recreation and education (Warwick et al., 2018). The estuarine zone is spatially and temporally variable in response to, inter alia, changes in mixing regimes and a range of other environmental processes (Hayton, 1991). As such, estuaries are susceptible to an assortment of perturbations related to hydroclimate, tidal regime and human activities (Warwick et al., 2018). Sediments, and the processes by which they accumulate or erode, represent key elements of the estuarine system, and offer important opportunities to explore the longer-term system behavior in response to environmental, climate, sea-level and anthropogenic changes (Newton et al., 2020). Indeed, the relationship between people and environment in coastal wetlands globally has deteriorated rapidly (Kirwan and Megonigal, 2013) and there is a clear need for their protection.
Sediments in these dynamic systems are subject to a high degree of reworking that makes obtaining a chronology of the sediment profile extremely challenging and, thereby, hindering potentially valuable environmental reconstructions (Andersen, 2017). The Knysna Estuary, a microtidal system on the south coast of South Africa [Figure 1; tidal range 0.4–2.0 m (Largier et al., 2000)], is widely regarded for its scientific and socioeconomic importance owing to, among other attributes, its exceptional biodiversity (Marker, 2003). Although the Knysna Estuary is a functioning estuary from an ecological perspective, it is already significantly threatened by anthropogenic activities, including urban expansion, tourism development and land use change (Marker and Miller, 1993; CES, 2007). Instances of high nutrient influx, sourced from surface runoff and catchment inflow which raises inorganic nitrogen and phosphorus concentrations, are noted across the system but particularly in the Ashmead Channel (Human et al., 2020). The rise in nutrients has led to algal blooms, notably in the lower reaches, that are indicative of eutrophication (Human et al., 2016). Seagrass patches are continuously disturbed in the search for bait by subsistence and recreational fishers (Claassens et al., 2020; Barnes, 2021).
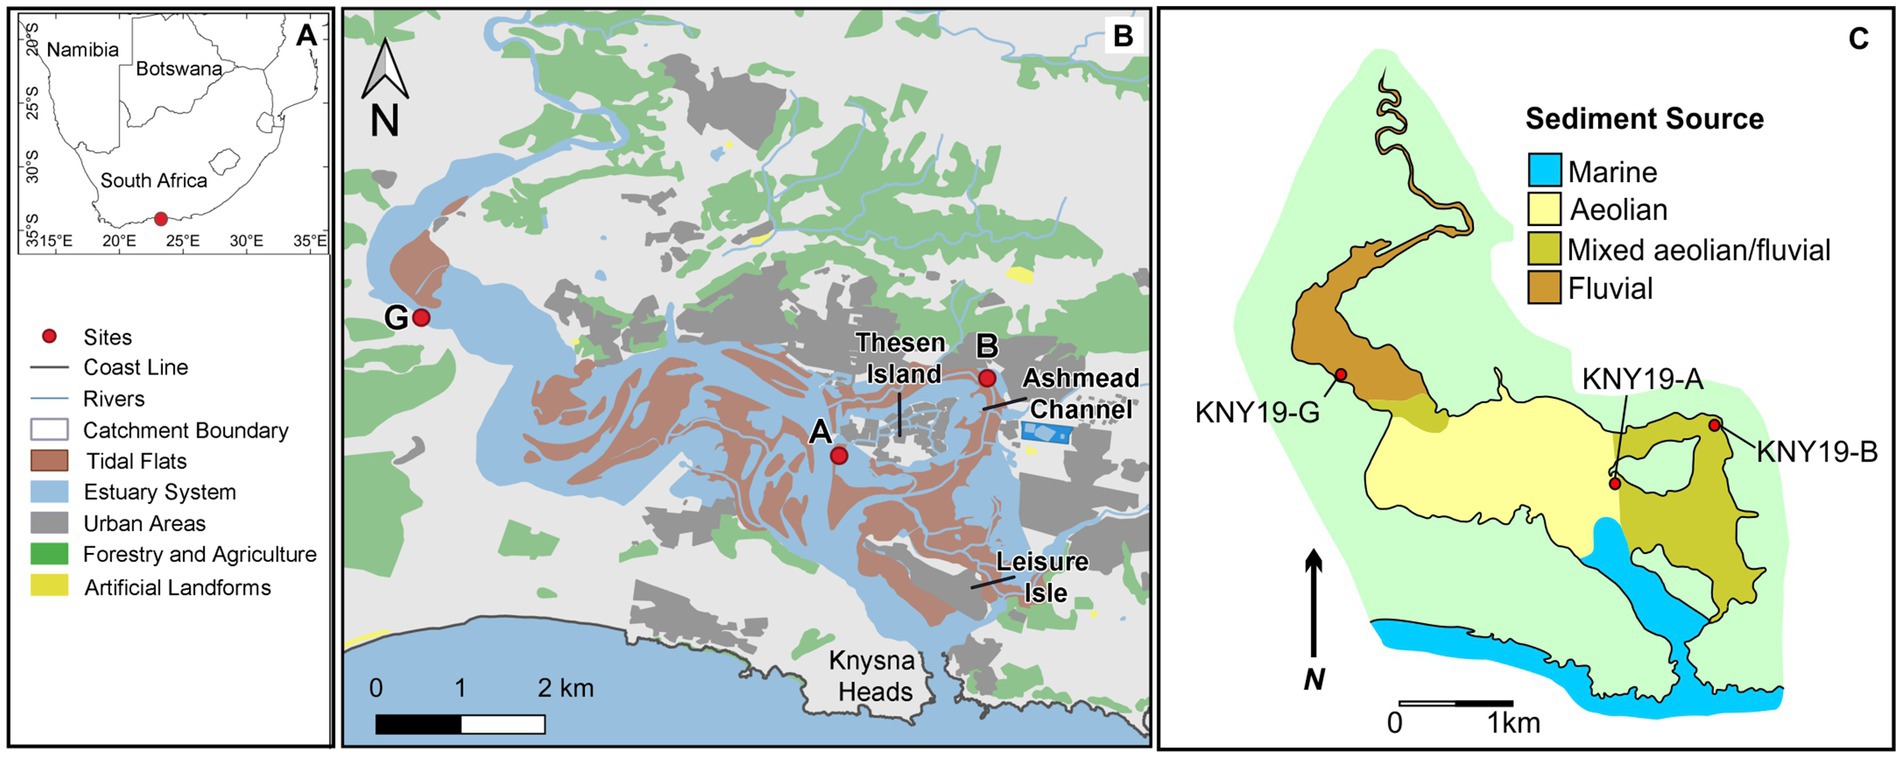
Figure 1. (A) The south coast of South Africa, (B) The Knysna Estuary and surrounding land-use practices, also indicated are the three core sites in the middle and upper reaches of the system, located along (C) Sediment sources of the Knysna Estuary after Reddering and Esterhuysen (1987).
With contemporary dynamics mind, several representative localities in the estuary were selected with a view to resolve system response to long-term environmental dynamics, both natural and anthropogenic, in the geologically recent past. Therefore, the aim of this study is to investigate the depositional history of the Knysna estuary based on its recent sedimentary history and to interpret the observed changes in the context of environmental and anthropogenic factors. The aim is achieved through the following objectives: (a) to obtain a series of shallow (<1 m) sediment cores from a selected range of habitats and geomorphic settings in the estuary; (b) to obtain age estimates using radiometric methods based on 14C, 210Pb, and 137Cs and, through the application of appropriate chronological modelling, develop age models for the selected cores and determine the robustness of each model; (c) to analyze, on three cores selected representing contrasting estuarine habitats, a range of physico-chemical characteristics, including organic matter content, magnetic susceptibility, particle size and selected elements; (d) to provisionally interpret the physico-chemical parameters and chronology in the context of reconstructed environmental changes of the late Holocene/Anthropocene in the Knysna estuary. The study highlights the problems and prospects for dating and interpretation of sedimentary sequences from estuarine environments.
The Knysna estuarine system is a biologically diverse, permanently open estuarine bay on the south coast of South Africa (Reddering and Esterhuysen, 1987; Claassens et al., 2020). The catchment is approximately 400 km2, arising in the Cape Fold Mountain range, draining through primarily quartzitic sandstones of the Table Mountain Group (Grindley, 1985; Reddering and Esterhuysen, 1987). The Outeniqua Mountains, which form the northernmost boundary, are characterized by steep, rugged terrain to a maximum elevation of ±1,500 m (Helgren and Butzer, 1977; Marker, 2003; Figure 1A). The valley is deeply incised into resistant Cape Supergroup rocks, before transitioning into the coastal platform of 200–240 m altitude (Marker and Miller, 1993; Marker, 2003). To the south of the estuary, a substantial coastal dune complex is an important source of sediment, although it has been stabilised by vegetation (Reddering and Esterhuysen, 1987).
Sediments in the system are therefore of aeolian, marine and fluvial origin. Cover sands in the middle catchment area are very easily mobilised, especially when disturbed by human activities, such as construction and quarrying activities (Grindley, 1985; Marker, 2000). Sediment loads are elevated during rainfall events causing higher levels of silt and sand to enter the basin (Marker, 2000; Human et al., 2020). Sediments of a marine origin typically do not extend much beyond the distal reaches of the estuary (Cooper, 2001). However, the estuary acts as a sediment trap as a slow ebb tide hinders terrestrial sediment loss (Grindley, 1985; Marker, 2000) and they also build-up at the rock-bound headlands as the tidal inlet is constrained by the absence of accommodation space (Cooper, 2001). The catchment geology is a relatively minor contributor to the sediment load due to the fact that the sandstones are highly resistant to weathering, producing quartz sand and quartzite pebbles, and only the Cederberg Formation is fine-grained (Reddering and Esterhuysen, 1987). The primary rivers draining the catchment are the Knysna and Gouna Rivers and their tributaries (Marker and Miller, 1993; Marker, 2000). The freshwater springs and the sediment-laden Salt River are additional sources (Russell, 1996). Water flows through an S-shaped channel of shallow depth ranging between 2 and 5 m below mean low water, which is flanked by extensive sandy intertidal and supratidal flats (Reddering and Esterhuysen, 1987; Largier et al., 2000). The Knysna River waters are clear, low in both nutrients and sediment load (Grindley, 1985; Allanson et al., 2000). The estuarine part of the system is characterized by three hydrographical regimes, viz. the lower bay regime, the middle lagoon regime and the upper estuary regime, with the boundaries being transitional in terms of fluvial and marine water inputs (Largier et al., 2000). A shallow, tidal branch of the estuary, the Ashmead Channel, surrounds Thesen Island (Human et al., 2016; Claassens et al., 2020; Figure 1B). Tidal influence can reach 19 km upstream and results in consistent flushing of the system (Reddering and Esterhuysen, 1987; Petermann et al., 2018). The local tidal gauge record is limited to the past 43 years (Rautenbach et al., 2019).
Initially, eight shallow (<1 m) cores were obtained using aluminum pipes forced manually into the surface, which resulted in good sediment recovery, from sites representing different estuarine regimes and habitats. Three of these cores (KNY19-A, KNY19-B, and KNY19-G) were selected for more detailed analysis of sediments at sites representing distinct environmental settings, namely direct exposure to marine influences, tidal flats and wetlands, respectively. The remaining five cores retrieved from the system were either duplicates to the cores presented here or sediment retrieval depth was minor. The lower bay regime would have been a desirable coring location, however marine inflow and sediment re-circulation makes the area highly disturbed. The cores were transported to the Department of Environmental and Geographical Sciences, University of Cape Town (UCT), split lengthwise and documented according to established standard protocols. Lithology was described using the Troels-Smith sediment classification scheme (Troels-Smith, 1955), and a Munsell Soil Color chart was used to describe colouration. Sub-samples at 1 cm intervals were taken for subsequent analysis.
KNY19-A (34.05 S; 23.05 E) was recovered from the tidal flats west of Thesen Island, in the vicinity of the main channel. The sediment core penetrated to a depth of 100 cm, while the retrieved sediment measured 44 cm, with a compaction factor of 55%. KNY19-B (34.04 S; 23.07 E) was recovered from the outer bend of the lower section of the Ashmead Channel on mudflats. The sediment core penetrated to a depth of 60 cm while the retrieved sediment measured 57 cm, thus experiencing a compaction factor of <5%. The site of core KNY19-G (34.03 S; 22.99 E) lies at the distal end of the estuary, where the river widens considerably, and was extracted from an area vegetated with Phragmites australis. The sediment core penetrated to a depth of 48 cm, while the retrieved sediment measured 37 cm, indicating a compaction factor of approximately 20%.
Dry bulk density (g/cm3) of the samples was determined by weighing a volumetric subsample of each 1 cm interval of the sediment cores prior and post overnight freeze drying. Loss on ignition (LOI), as an estimate of total organic matter content (OM; %), was measured by weighing dry subsamples before and after ashing at 550°C for 6 h. Mass magnetic susceptibility was quantified from the homogenised, dried samples using a Bartington Instruments MS2 sensor. The particle size spectra were determined using a Malvern automated laser-optical particle-size analyzer (Mastersizer-2000; Malvern Instruments Ltd., Worcestershire, United Kingdom) after the removal of organic matter by 10% hydrogen peroxide (H2O2) and of carbonate by 10% hydrochloric acid (HCl). This instrument has a measurement range of 0.02 to 2,000 μm and an error of <3% with repeated measurement (Bao et al., 2017).
The Calcium (Ca) and Strontium (Sr) bulk concentrations were evaluated to determine marine influences on the system. The elements we measured using a Spectro Xepos XRF spectrophotometer at the Department of Biological Sciences, at UCT, and were expressed as a percentage of composition when they are in their oxidised condition. To achieve homogeneity, the samples were pulverised using a mortar and pestle. The powder was collected through a < 200 μm sieve mesh. A standard 32 mm XRF sample cup was used to hold around 4–5 g of the sample. As per standard practices, Ca is stated in percentage, while Sr concentrations were reported in mg kg-1, which is equivalent to parts per million (ppm).
A total of six radiocarbon samples, near the base and mid-core, were submitted for AMS radiocarbon analysis (Beta Analytic Inc., Miami) (Supplementary Table S1). Plant macrofossil samples were dated where available, but the majority of samples were based on bulk sediments. For calibration purposes, the Marine20 calibration curve was employed for the five bulk samples (Heaton et al., 2020), withthe SHCal20 calibration curve employed for the one plant macrofossil sample (Hogg et al., 2020). The regional marine reservoir correction for the south coast of South Africa was applied to the bulk radiocarbon samples, namely ∆R = 187 ± 18 14C yr (Maboya et al., 2018). In an estuarine setting, there remains uncertainty regarding carbon source pathways contributing to bulk sediment samples, hence we applied the marine reservoir correction to account for marine offsets. Where plant and bulk sample ages were available from the same depth, the plant samples were considered more reliable in constructing the age model (see Supplementary Table S1).
Weighed, dry samples (approximate 5 g) were sealed in plastic test tubes and sent to the State Key Laboratory of Lake Science and Environment, Nanjing Institute of Geography and Limnology, Chinese Academy of Sciences, for 210Pb and 137Cs dating. Total 210Pb, 226Ra, and 137Cs radioactivities were measured using a low-background ᵞ-ray spectrometer with a high pure Ge semiconductor (ORTEC Instruments Ltd., United States). Total 210Pb was determined at 46.5 keV, and 226Ra was determined at 295 keV and 352 keV by its daughter nuclide 214Pb after 3 weeks storage in sealed containers to allow radioactive equilibrium, 137Cs was determined at 662 keV. The standard sources and sediment samples of known activity were provided by the China Institute of Atomic Energy and used to calibrate the absolute efficiencies of the detectors. Counting times of 210Pb and 137Cs typically ranged from 50,000 to 86,000 s, and measurement precision was between ±5 and ± 10% at the 95% confidence level. The unsupported 210Pb activity was determined from the difference between the total 210Pb and supported 210Pb activity which was assumed to be in equilibrium with in situ 226Ra.
210Pb, in combination with the radiocarbon ages were calibrated using the Bayesian age-depth modelling of cores dated by 210Pb and 14C in the Python package Plum v.0.8.5 (Aquino-López et al., 2018). Plum is a Bayesian forward model that simultaneously integrates two different processes: (1) the behavior of the 210Pbflux and the variation of 210Pbsup with depth and (2) an age-depth function which incorporates a Bayesian piece-wise linear model constrained by prior information on accumulation rate and variability (Aquino-López et al., 2020). This is in contrast to the Constant Rate of Supply (CRS) model, which is based on 210Pbex flux being constant. Plum can model the 210Pb and 14C simultaneously, avoiding multiple calibration and modelling of data. Therefore, radiocarbon ages can be incorporated during the analysis to guide the model output. Sediment accumulation rates (SAR) were also determined for all three cores at a 1 cm resolution.
Grain size measurement outputs from the laser diffractometer were analyzed using the G2Sd package (Fournier et al., 2014) in the R Software environment. Grain size statistics were calculated using the logarithmic (Folk and Ward, 1957) Method (phi scale) with outputs of mean, standard-deviation, skewness, and kurtosis. A combined dataset was collated using the grain size statistic outputs, LOI, dry bulk density, and magnetic susceptibility of cores A, B, and G. The final stratigraphic plots were produced using the tidypaleo, ggplot2 and patchwork packages in the R software environment.
Activities for the three Knysna cores range from 37.13 to 168.4 Bq/kg for 210Pbtot, from 22.62 to 64.10 Bq/kg for 226Ra (equivalent to the supported 210Pb) and from 1.72 to 122.7 Bq/kg for 210Pbxs (unsupported 210Pb) (Figure 2). 226Ra is assumed to be in equilibrium with the supported 210Pb portion inherited from the sediments themselves. The unsupported 210Pb, or 210Pbxs, is derived from subtracting the supported 210Pb portion from 210Pbtot. 210Pbxs forms the basis for the 210Pb age-depth models. 210Pbtot and 210Pbxs should generally decrease exponentially with depth (Andersen et al., 2000; Barsanti et al., 2020) due to the natural decay of 210Pb. KNY19-A and B display a decreasing trend in 210Pbtot, but not obviously exponential. The 210Pbtot in KNY19-G, on the other hand, does decrease exponentially downcore. In none of the cores does 210Pbtot decrease monotonically (Figure 2). In KNY19-A and B, the decrease in 210Pbtot results from both 226Ra and 210Pbxs decreasing downcore. In KNY19-G, 210Pbxs decreases exponentially with depth, while 226Ra remains relatively constant. The 210Pbtot in the Knysna estuary sediments results from the rainout of 210Pb in the atmosphere, in situ ingrowth of 210Pb by the decay of 222Rn, and possibly from marine sediment supply due to the tidal hydrodynamics. The 137Cs activities were zero along the depth profiles of all three cores.
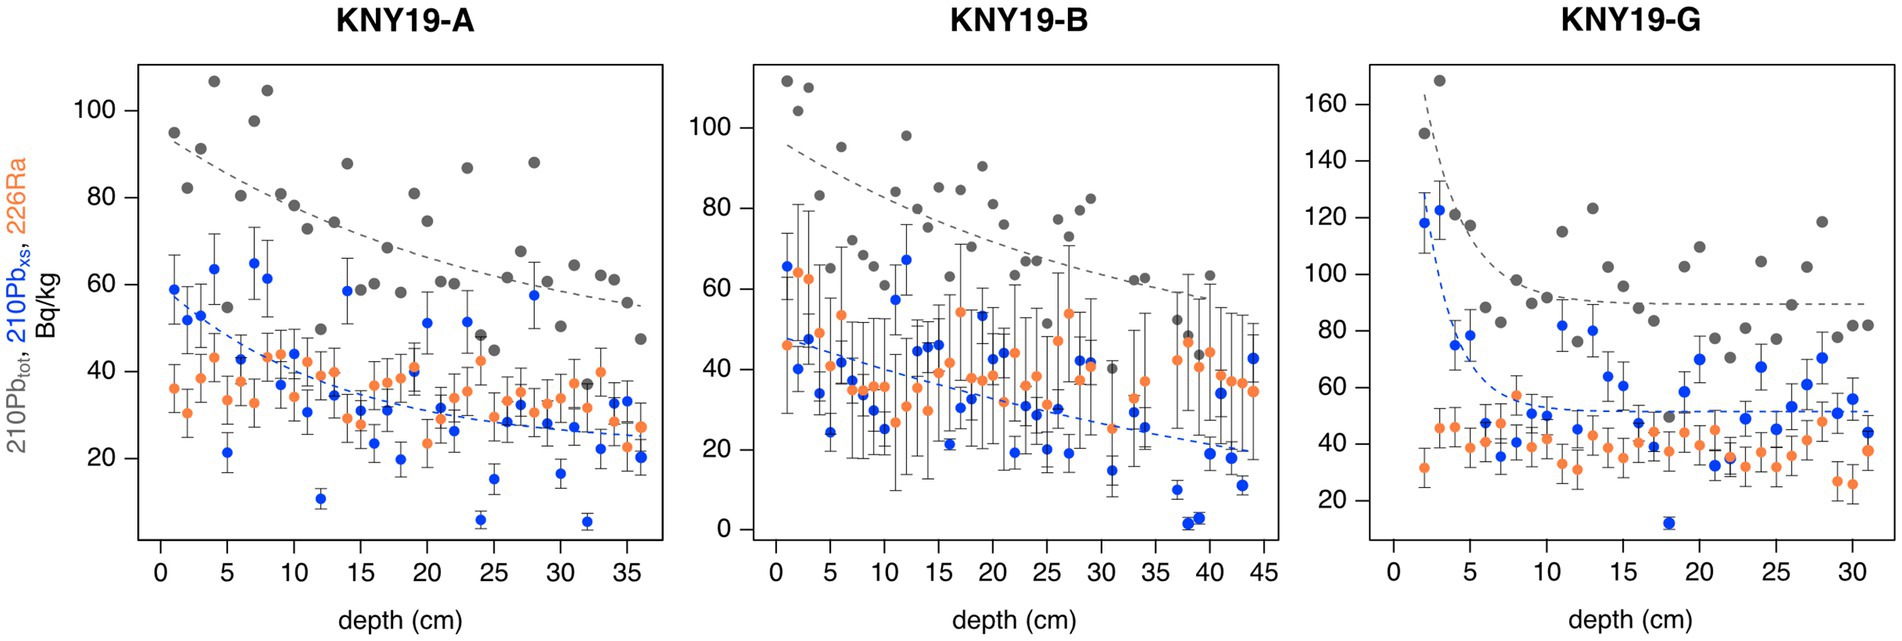
Figure 2. Activities of 210Pbtot (gray), 210Pbxs (blue), and 226Ra (orange) for cores KNY19-A, KNY19-B, and KNY19-G. Stippled lines are exponential fits of 210Pbtot and 210Pbxs. Note independent scaling of x and y axes.
Age-depth models (ADM) for the Knysna Estuary system show deposition occurred from the Holocene, as early as 4,050 cal yr BP to present, based on 210Pb and radiocarbon ages. Because 137Cs was not detectable in this area, the 210Pb age-depth models were supported by radiocarbon dates. The radiocarbon ages from bulk samples in Supplementary Table S1, with the exception of the plant sample at the base of KNY19-G, were corrected for the marine reservoir effect, which is greater in the case of the more recent sediments.
Core KNY19-A sediments accumulated from 4,050 cal yr BP to present. Three corrected radiocarbon ages (Supplementary Table S1) are in good agreement with the 210Pb age-depth model (Figure 3). A hiatus occurs at 31 cm depth, identified by an erosional surface, and introduces uncertainty in the age-depth model. Core KNY19-B sediments accumulated from ~700 to 0 cal yr BP. The single radiocarbon age at the base of the core (Supplementary Table S1) is consistent with the 210Pb age-depth model (Figure 3). The upper portion, however, cannot be validated fully due to the lack of a radiocarbon age. The age-depth model for Core KNY19-G suggests these sediments were deposited from ~125 cal yr BP. Two bulk sample radiocarbon ages, at 36 cm and 16 cm are supplemented by a separate plant sample at the base (36 cm). The basal bulk sample radiocarbon age was excluded in favor of the plant sample; the two radiocarbon ages incorporated into the model are in good agreement with the 210Pb age-depth model (Figure 3).
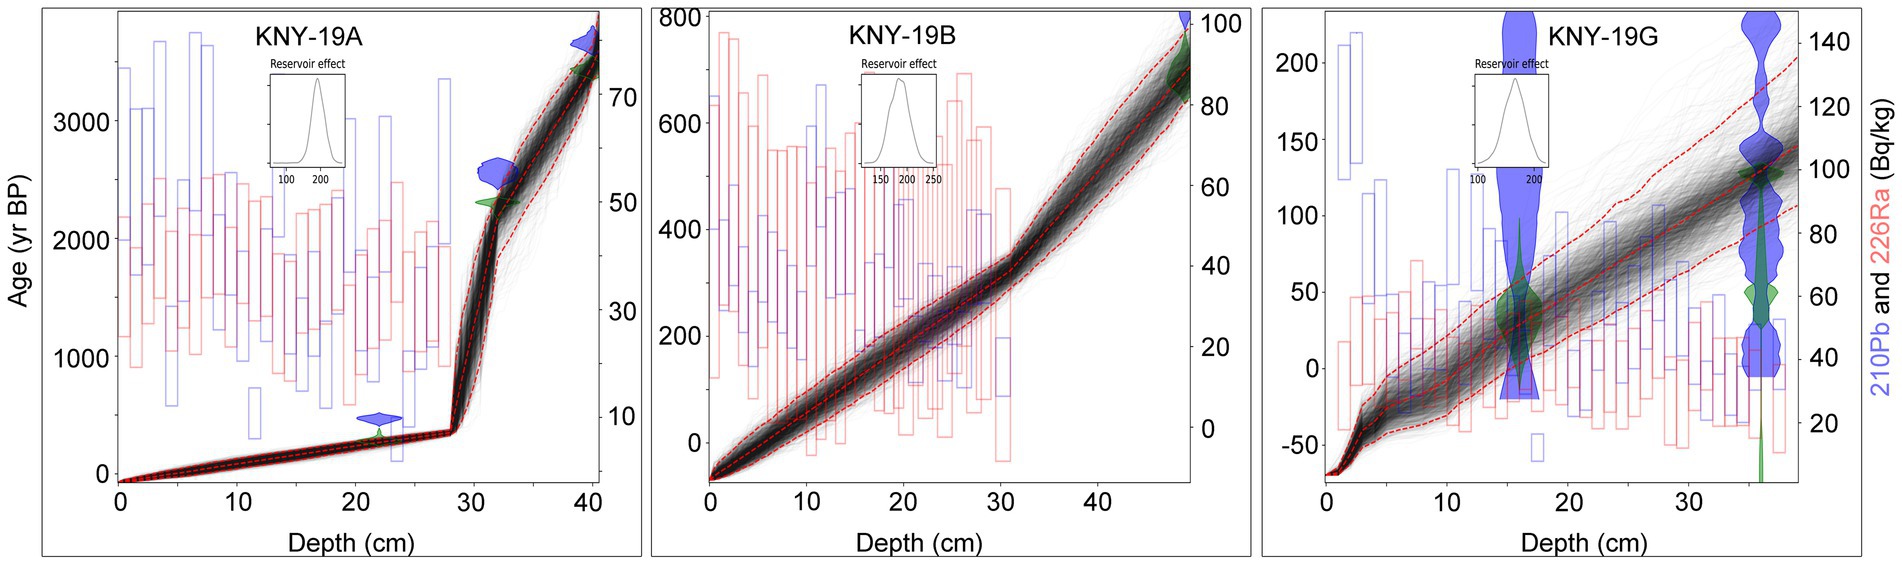
Figure 3. Age-depth models for cores KNY19-A, KNY19-B, and KNY19-G as produced by Plum, showing the 210Pb (blue rectangles), 226Ra (red rectangles), calibrated radiocarbon ages (blue distribution), and marine reservoir corrected, calibrated ages (green distribution) against depth (cm). KNY19-A experiences a loss and reworking of sediments defined by unit A2 and represented by the orange rectangle.
Core KNY19-A can be subdivided into four lithological units based on changes in sedimentary characteristics and spans 4,050 years. Given the likely presence of a hiatus or condensed section, the chronology of this record should be treated with caution. Two anomalies occur and are evident in all sedimentological parameters at 14–11 cm (150–100 cal yr BP) and 30–27 cm (1275–340 cal yr BP) depth, although the effect on magnetic susceptibility is most pronounced. Core KNY19-A exhibits a relatively uniform grain size distribution (GSD) with sand being the dominant grain size (Figure 4). Bulk density generally remains stable throughout the sedimentary sequence, with the exception of a decline between 30 and 27 cm. A sharp increase in the sediment accumulation rate (SAR) occurs at 27 cm (~340 cal yr BP) from 0.002 to 0.075 cm/yr, which represents sedimentation accelerated markedly above this depth (Figure 4). The increase in SAR is associated with an increase in the sand size fraction and corresponding reduction in silt and clay content.
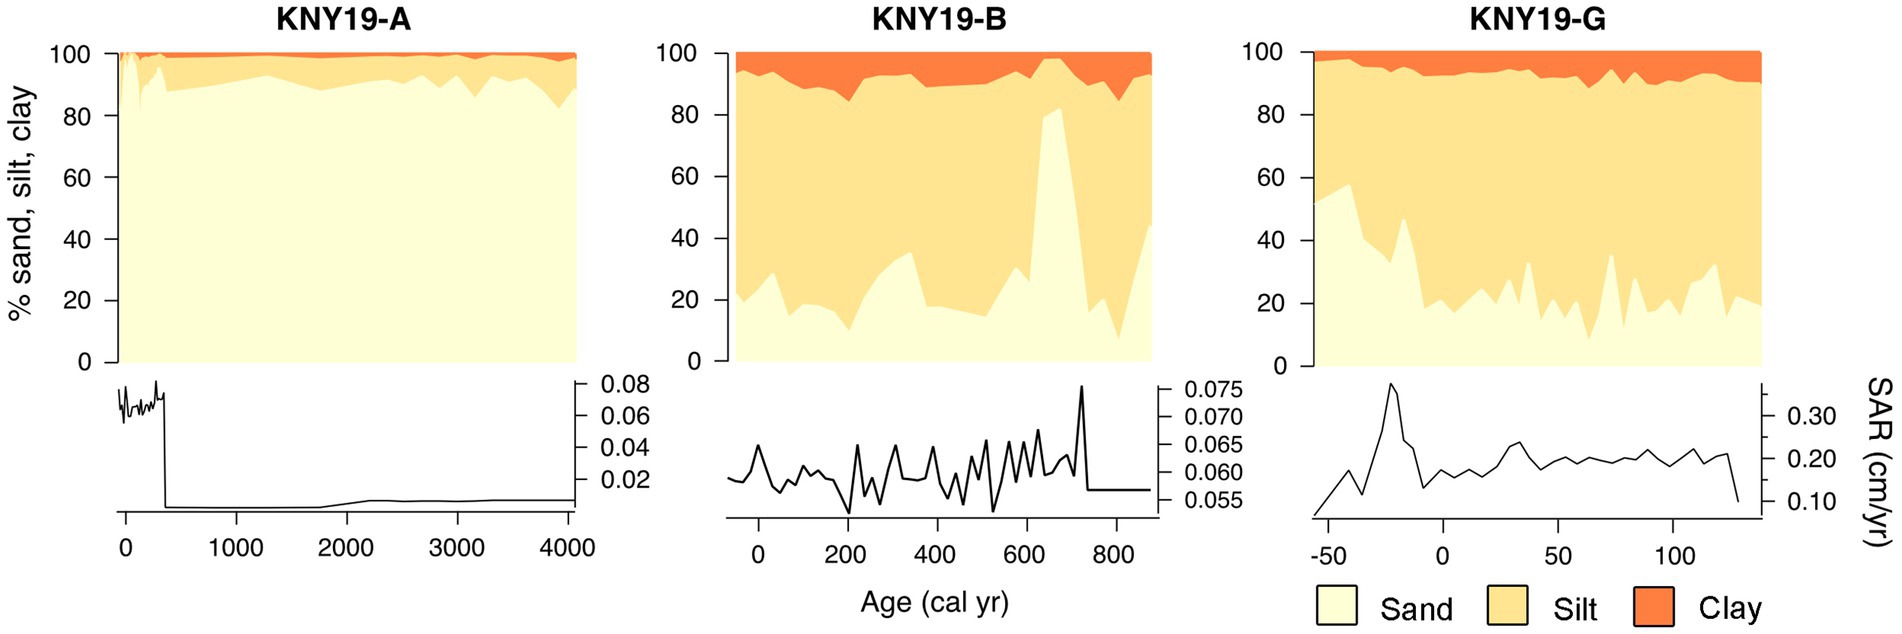
Figure 4. Grain size distribution (%) and sediment accumulation rate (cm/yr) versus age (cal yr BP) for KNY19-A, KNY19-B, and KNY19-G.
Unit A1 is characterized by low levels of organic matter ranging from 1 to 6%, with a mean of 3%. Sediments are classified as medium sand (2 Phi), strongly fine skewed and very poorly sorted. This unit has a weak overall magnetic susceptibility signal. The core lithology shows the presence of intact marine molluscan shells, primarily Dosinia hepatica (Lamarck, 1818) and Loripes clausus (Philippi, 1849), lying horizontally in a sandy matrix.
The transition between Unit A1 and A2, is marked by an abrupt increase in magnetic susceptibility, peaking at 380 × 10−8 m3/kg. Similarly, LOI peaks, reaching a maximum of 5% at 26 cm within this unit. Dry bulk density decreases from 1.4 to 1.3 g/cm3. The observed core lithology for this unit shows sandy material with an increasing frequency of marine shell fragments.
Unit A3 is characterized by poorly to very poorly sorted medium sand with a low but stable magnetic susceptibility signal. LOI remains relatively low, fluctuating around 6%. The lithology is predominantly medium sand with little shell debris and the occasional presence of more organic rich material.
The base of Unit A4 is marked by a distinct peak in magnetic susceptibility (83 ×10−8 m3/kg), as well as a shift to very well sorted, near-symmetrical grain size distribution. LOI (~4%) and mean grain size (medium sand) are consistent, except for the top 2 cm (about −40 cal yr BP) where grain size decreases and LOI increases.
The core features two distinct changes in sediment characteristics, thereby forming three distinct sedimentary units referred to here as B1, B2 and B3 at intervals 57–40 cm, 39–19 cm and 18–0 cm, respectively. The core spans the last 900 years. Sediments are of variable grain size distribution but are dominated by silt. Bulk density remains relatively stable throughout the sedimentary sequence. The SAR is relatively constant (~0.058 cm/yr), except for a peak at 47 cm (~720 cal yr BP) of ~0.076 cm/yr This peak in SAR coincides with a peak in the sand-sized fraction at the expense of silt and clay. The SARs for this core are similar to the youngest section (<310 cal yr BP) of core KNY19-A (Figure 4).
LOI fluctuates between 4 and 11%, averaging 6%. Mean grain size fluctuates between medium and fine silt (5–6 φ) from 48 to 44 cm (~735–675 cal yr BP) where a coarsening upwards to fine sand (2–3 φ) towards the top of the unit. In parallel, grain size distribution transitions from finely skewed to strongly finely skewed. The magnetic susceptibility signal remains low but also gradually increases upwards. Lithology is relatively homogeneous throughout the unit.
The base of Unit B2 is marked by a peak in magnetic susceptibility and an abrupt decrease in LOI at 39–37 cm (590–560 cal yr BP), whereafter the sediments are high in organic content, fluctuating between ~7 and 24%, and averaging 13.4%, although gradually decreasing towards the top of the unit. Mean grain size coarsens upwards from fine silt (6 φ) to medium silt (5 φ), remaining finely skewed throughout. Sediments are consistently poorly sorted, even more so towards the boundary with the overlying unit. Magnetic susceptibility is low, and rather constant, above 37 cm (from 250 cal yr BP onwards). Overall, the unit is homogeneous, with no clear sedimentary structures or evidence of bioturbation present.
LOI decreases from 9% at the base of unit B3, to 2% in the upper 2 cm (from ~ −35 cal yr BP). Mean grain size coarsens upward from very fine silt (7 φ) to medium silt (5 φ), decreasing to fine silt at the surface (2–0 cm; from ~ −35 cal yr BP to present). Skewness shifts from being almost symmetrical at the base to strongly finely skewed at the top. Sorting is poor throughout, becoming very poorly sorted near the surface, while lithology is again basically homogeneous.
Core KNY19-G covers the last 210 years and has a consistently low magnetic susceptibility signal throughout, ranging from 5.1–13.5 ×10⁻⁸ m3/kg with a mean of 7.5 ×10⁻⁸ m3/kg. The core is subdivided into three units, units, G1 – G3 at 36–19 cm, 18–6 cm and 5–0 cm, respectively. The sediments are in general dominated by silt, and relatively constant until 5 cm (−25 cal yr BP). Similarly, the SAR is constant (~0.19 cm/yr) but increases towards the top. This increase coincides with an increase in sand at the expense of silt. The SAR in KNY19-G is an order of magnitude higher than in KNY19-B and the top of KNY19-A (Figure 4).
Unit G1 is characterized by low LOI content, ranging from 6.2 to 14.5%, averaging 9%. LOI gradually increases upwards, while mean grain size fluctuates between medium and fine silt (5–6 φ) for poorly- to very poorly sorted sediments. The grain size distribution is near-symmetrical at the base, trending toward a finely skewed distribution towards the top of the unit. Bulk density is higher on average here than in the other units, fluctuating around an average of 1.1 g/cm3.
LOI fluctuates between 12 and 14%, but falls to 8.4% at 9 cm, whereafter it increases to 16% at the top of the unit. Bulk density exhibits an inverse relationship with LOI, peaking at 1.13 g/cm3 at 8 cm depth. Mean grain size lies within the medium silt size class (5–6 φ) to 9 cm (~ −13 cal yr BP), at which point it increases to coarse silt (4–5 φ) at 7 cm (~ −20 cal yr BP). Sediment sorting varies between poorly to very poorly sorted. Grain size distribution is finely skewed throughout but increases from 8 cm upwards.
LOI achieves maximum values in Unit G3, increasing from 22% at the base to 27% at the core surface. Mean grain size coarsens upwards from medium silt to coarse silt (5–4 φ) and on the whole the sediments are very poorly sorted. Grain size is less finely skewed towards the top of the core where it is near-symmetrically distributed. Bulk density increases to 0.91 g/cm3 at 3 cm (~ −40 cal yr BP), before decreasing to 0.86 g/cm3 at the surface.
Sr and Ca are strongly correlated with each other in all cores (KNY19-A = 0.97, KNY19-B = 0.78, KNY19-G = 0.86). Ca and Sr concentrations are initially high with values over 10% and 300 ppm, respectively, in KNY19-A, before sharply declining at 39 cm (Figure 5). Moderate concentrations are maintained until 27 cm. Upcore of 27 cm, concentrations are low although higher than at the other two sites. Concentrations at site KNY19-B remain relatively low, fluctuating between 0.25 and 0.09% for Ca and 32.5 and 14.6 ppm for Sr At KNY19-G, concentrations appear to be steadily increasing from the base of the core until ~8 cm, after which a sharp rise in both elements are recorded to the surface.
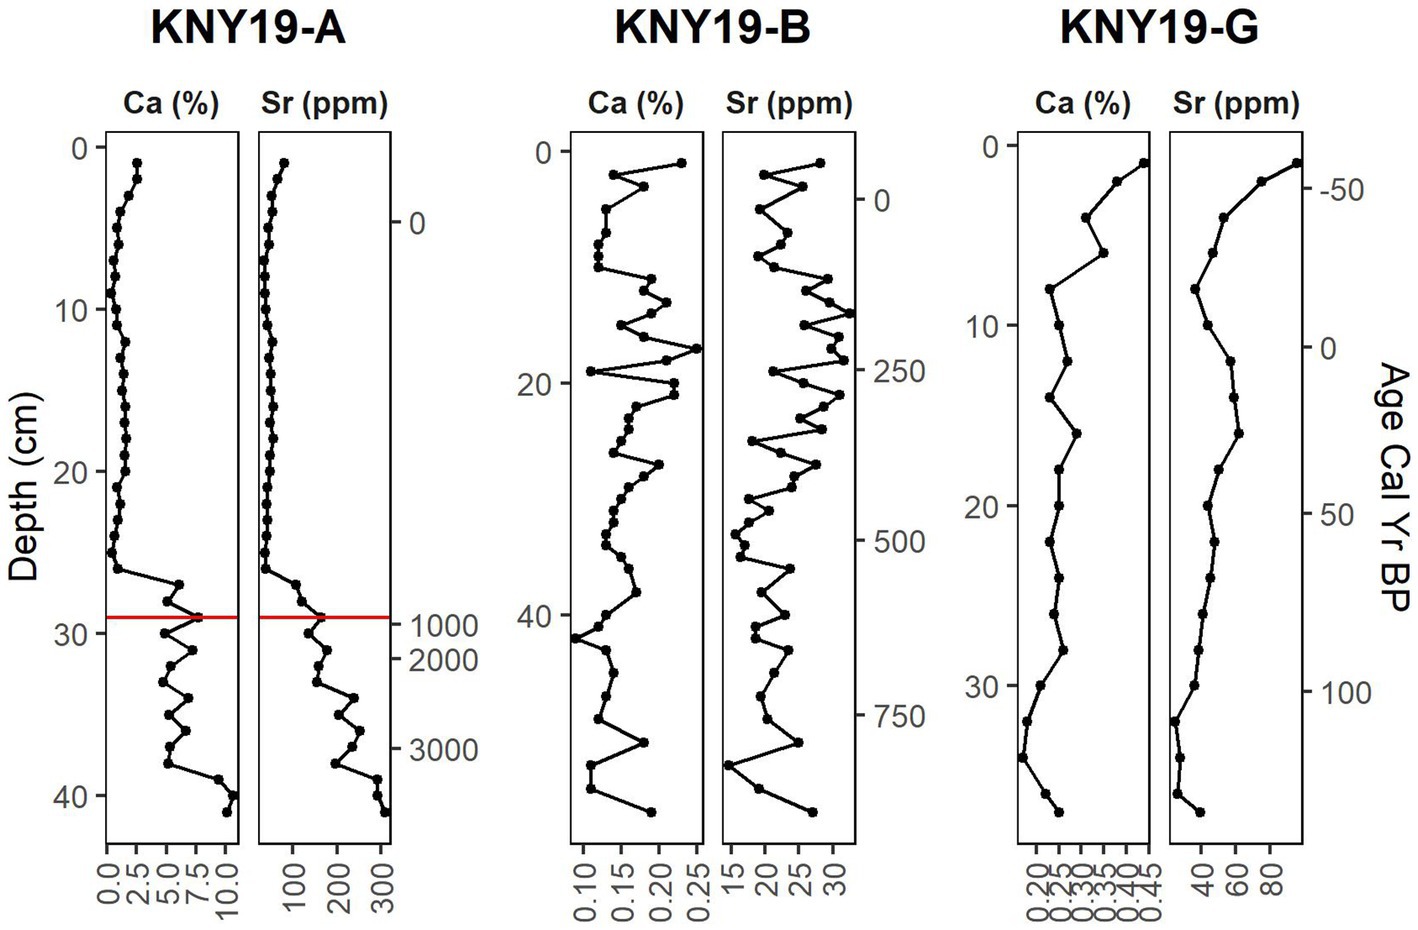
Figure 5. Variations in Ca (%) and Sr (ppm) concentrations at each core location against Depth (cm) and age (cal yr BP).
Carbon-14 samples were taken from the bottom of the core to provide a basal limit for the depositional period. Basal ages of the three cores appear to be highly dependent on local site conditions. Deposition at Core KNY19-A covers the last 4,000 years; however, it is evident here that sediment reworking has occurred with a possible condensed section. Such situations are to be expected in coastal systems where the combined effects of fluvial discharge and tidal forcing are dynamic in nature. The initial phase, between 4,050 and 1750 cal yr BP, exhibits a slow sedimentation rate before an apparent hiatus/condensed section in the sedimentary sequence occurs. This is likely due to the location of the site proximal to the mouth and the entering marine waters leading to erosion or redistribution of sediments in response to changing sea levels and tidal regimes. Two additional samples were taken above and below the fragmented shell layer to constrain the discontinuity in deposition. Continuous sedimentation is initiated again from 340 cal yr BP, and at a much higher rate of accumulation. The position of core KNY19-B is more protected from wave action and deposition and appears to be continuous from 900 cal yr BP to present, although surface sediments do appear to have been bioturbated. Core KNY19-G spans only the last 200 years and has by far the highest sediment accumulation rate. The basal sample from KNY19-G is the sole sample with sufficient plant material for analysis. This age is seen as more reliable than the bulk sample at this site. Since the core site lies further up the estuary, it is reasonable to suppose that sediment dynamics may be more strongly influenced by fluvial processes (Reddering and Esterhuysen, 1987) and the declines in transport energy of the river as it reaches the estuarine basin.
The reliability of 210Pb activity, and thus the quality of the age-depth models, depends on several factors (Sanchez-Cabeza and Ruiz-Fernández, 2012), including the conceptual model used, validation with an independent chronometer, mobility of Pb within the sediment, grain size variation and the extent of sediment reworking by biological (bioturbation) and physical (waves and currents) processes. The degree of compaction, particularly in KNY19-A, may provide some uncertainty to the age model by disturbing the 210Pb profile as well as affecting calculated SAR (Barsanti et al., 2020). The inclusion of radiocarbon samples within the modelling approach supports the age-depth model and validates the 210Pb data, thus contributing to the reliability of the age model and given reasonable margins of error, broadly supports our interpretation of the 210Pb ages (Figure 3). In addition, the modelling approach employed in this study, the recently developed Plum package for R and Python (Aquino-López et al., 2020), is more flexible using a forward modelling approach that is able to handle potentially disturbed 210Pb profiles. The Knysna Estuary system is dominated by marine water influx due to the large tidal prism. KNY19-A and KNY19-B are located in the lower reaches of the system and experience a mix water regime, whereas KNY19-G is closer to the fluvial inflow, leading to brackish water conditions depending on the state of tide and discharge from the Knysna River. Thus, there is some potential of lead mobility within a saline system, but this is limited to generally <0.02% (Zhao et al., 2013) and therefore, lead mobility can be considered negligible in this instance. Grain size variation may be an influencing factor on the reliability of the models, however there is no clear correlation between 210Pbxs and the clay content of each core, suggesting that the influence of preferential absorption of lead onto fine particles is not a crucial factor in the Knysna system.
Considering the dynamic and highly productive nature of estuarine systems, reworking and bioturbation that disturb the sedimentary column are highly likely. Much of the estuary is generally protected from strong marine wave action, but currents are present due to river flow and tidal influences, which may indeed rework or resuspend sediments over time. Cores KNY19-B and KNY19-G were retrieved from relatively low energy environments, while KNY19-A is adjacent to the main channel, which may have altered its course at various stages in the past. Nevertheless, analysis of each core reveals generally homogeneous sedimentary structures, with little evidence of disturbance. An exception to this is unit A2 in core KNY19-A, where it is related to the marine shells found in this unit but does not seem to have influenced the sedimentation very much (3 cm perhaps). Samples for dating, including those subsampled for 210Pb analysis, were not taken from potentially disturbed sediments. Furthermore, the radiocarbon age for unit A2 indicates that these sediments are younger than the equilibrium depth of 210Pbxs. This unit therefore does not affect the 210Pb component of the age-depth model.
Core KNY19-A, located on the western shore of Thesen Island, is the most proximal of the three sites and is exposed to stronger marine influences in being most proximal to the inlet of the estuary with little shielding from geomorphological features (Figure 1). The basal unit spans the interval 4,050–1750 cal yr BP (Figures 5, 6), and is characterized by medium sand, prevalent whole marine bivalve shells and gastropods, suggesting a shallow marine environment (Figure 7A), and supported by elevated Sr and Ca concentrations (Figure 6). The concentration of Ca and Sr are globally and regionally recognised as marine indicators (Peterson et al., 2000; Wündsch et al., 2016, 2018). The decline in marine influences is in temporal agreement with lakes along the coast of South Africa, e.g. Eilandvlei (Kirsten et al., 2018; Wündsch et al., 2018), Verlorenvlei (Kirsten et al., 2020), Lake St Lucia (Benallack et al., 2016; Gomes et al., 2017). When placed in the context of the sea-level history for the southern African coastline, this unit corresponds to a highstand of up to 2 m above present mean sea level (Cooper et al., 2018). Marker and Miller (1993) traced shell deposits of what they concluded to be a product of the mid-Holocene highstand and determined that during that interval, the shoreline of the lagoon would have extended 400 m inland from the present day. Miller et al. (1995) constrained the mid-Holocene highstand to be approximately 2.4–2.8 m above present mean sea level between 6,000–4,000 cal yr BP, this would imply higher wave energy during the mid-Holocene highstand followed by a rapid regression.
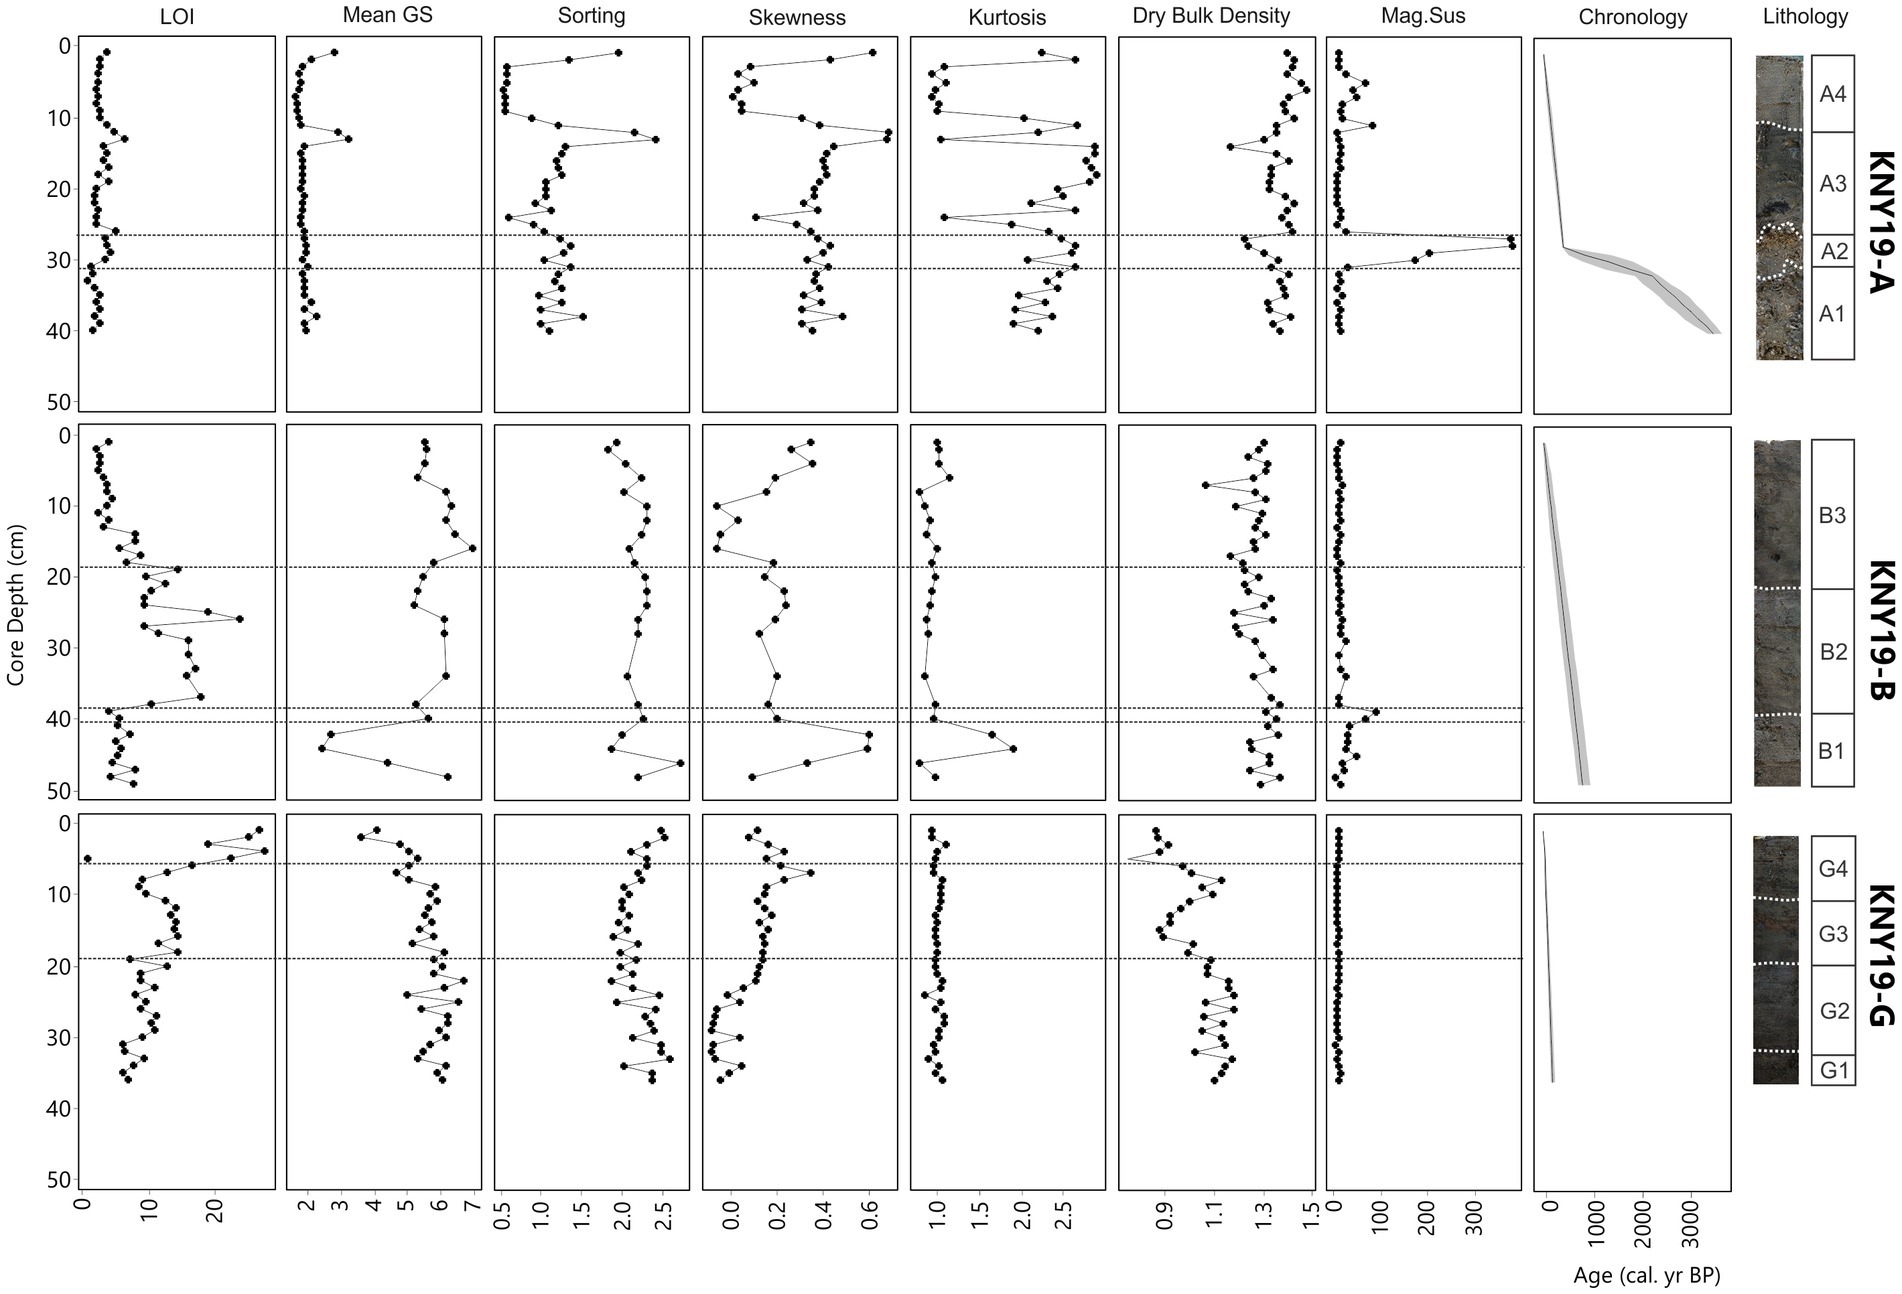
Figure 6. Sediment profile for KNY19-A, KNY19-B and KNY19-G against depth indicating sedimentary horizons and associated sediment characteristics, from left to right, loss-on-ignition (%), the mean, sorting, and skewness of grain size, kurtosis, the bulk density (g/cm3), magnetic susceptibility (83×10−8 m3/kg). Dotted horizontal lines indicate changes in sedimentary character.
Surface deposits (Units A3 and A4) at KNY19-A are separated from the basal unit (Unit A1) by an undulating, erosional/reworked shell lag package (Unit A2) which has a lower bulk density than Unit A1 (Figures 7B,C). This unit consists of similar bioclastic material as recorded in Unit A1; however, it has undergone fragmentation likely due to reworking or transportation under changing marine energy conditions associated with relative sea-level change. When considered relative to the underlying unit (A1) and the association with higher than present sea level, followed by a period of regression and transgression, this interval most likely represents a period of shoreface retreat (Bruun, 1962; Swift, 1968). When the base of a shoreface translates landward in response to transgression, it truncates pre-existing deposits due to wave and tidal processes producing a ravinement surface draped with lag deposits (Cattaneo and Steel, 2003). Given the proximity of KNY19-A to the mouth of the estuary, the overlying high-energy reworked deposits (Unit A2) are followed by tidally influenced sediment (Units A3 and A4), this depositional unit likely represents a tidal ravinement surface produced as an effect of steady sea level rise between 500 cal yr BP to present (Figure 7D). Cores KNY19-A and KNY19-B capture different portions of sea-level history with KNY19-B recording a larger duration record of the latest transgression due to availability of accommodation space created by underlying antecedent topography. KNY19-A captures older records due to its proximal position within the basin however less of the overlying equivalent tidal sediment due less accommodation space created by the underlying topography (Figure 7).
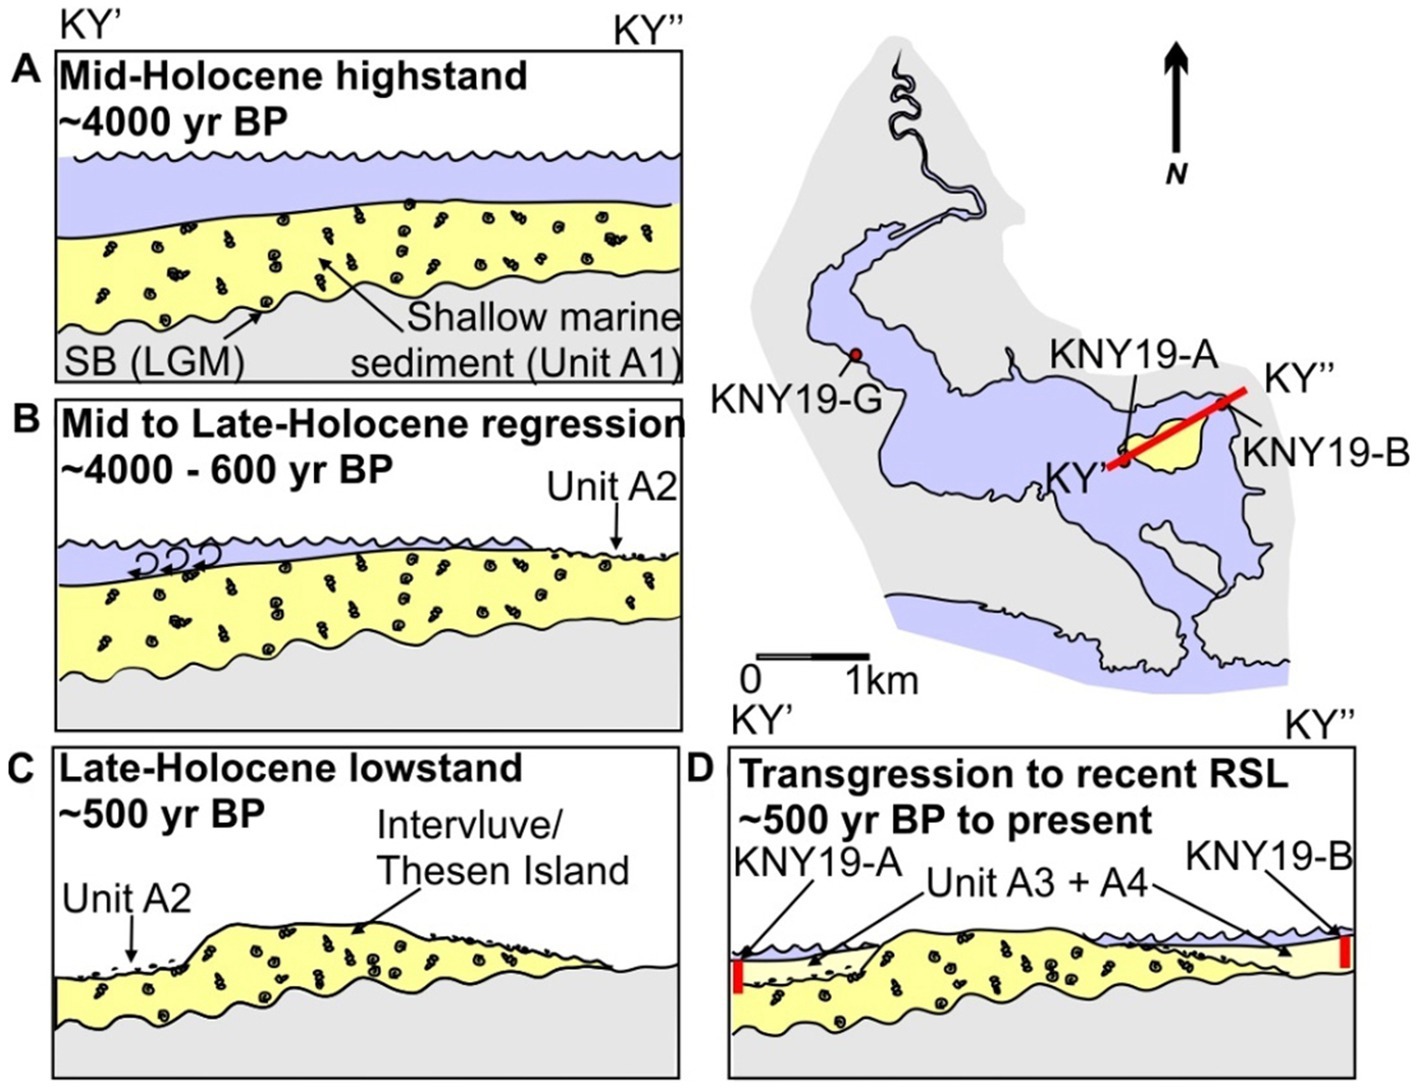
Figure 7. Conceptual figure describing the depositional history of the Knysna estuary from the late Holocene to present. Cross-sectional profile KY’-KY” is depicted in insets (A–D) showing different stages of sea-level history and associated sediment depositional and erosional processes. (A) Shallow marine sediment (Unit A1) is deposited on top of the Last-Glacial Maximum (LGM) Pleistocene deposits (grey) under higher than present sea level conditions. (B) Sea level falls in the mid to late Holocene. Interaction with receding wave base results in minor reworking of underlying unit A1, producing a shell lag (unit A2) composed of unit A1 material. (C) As regression continues to a lowstand, a drop in base level causes incision/channelisation of Unit A1, forming a relative topographical high (presently known as Thesen Island) and further stripping of sediment. (D) Transgression from ~500 yr. BP resulted in further reworking of Unit A2 by tidal ravinement processes, and subsequent deposition of estuarine sediment (Units A3 and A4).
The falling sea level following the Holocene highstand would have exposed subaerially many parts of the estuary previously submerged, particularly in the intertidal zone, possibly resulting in reworking by aeolian processes before an increase in source waters could sustain open water conditions. A period of lower sea level, up to 2 m below modern mean sea level (Miller et al., 1995) occurred between 900 and 500 cal yr BP and would have had a substantial impact on the Knysna estuary system. Thesen Island would have been somewhat larger at the time and the greater expanse of subaerially exposed sediments may have been subject to erosion and reworking. An increase in coarser grained sediment in the Ashmead Channel (Core KNY19-B) is also noted during this interval and is also likely related to reworking of relict marine sands from the mid-Holocene highstand. From 900 to 600 cal yr BP, the channel transitions from very platykurtic to less platykurtic indicating a brief evolution from less mobile sand sheet deposits to more mobile dune deposits (Marker and Holmes, 2002; Holmes et al., 2007).
The geology of the catchment comprises primarily quarzitic sandstones with a high silicate composition of the Table Mountain Group (Grindley, 1985). These lithologies are therefore diamagnetic in nature (Tite, 1972) implying that variations in magnetic susceptibility, especially along the shore of Thesen Island (KNY19-A), are unexpected. Sediment sources in the system are either fluvial, aeolian or marine in origin (Figure 1C), therefore either one or a combination of the latter must supply the magnetisable material. The Enon formation, which is composed of thickly bedded conglomerates, sandstone lenses and mudstone units within a sandy clay matrix, surrounds the southern perimeter of the Knysna Estuary (Muir et al., 2017). There are also outcrops of shale in the upper catchment that may also have trace deposits of magnetisable materials, implying that the catchment is indeed a potential source. Negligible sediments of marine origin are delivered into the estuary, and only in the very lower reaches of the estuary, although wave energy is not completely dissipated due to the lack of barrier development at the mouth (Cooper, 2001) so that marine inputs cannot be excluded. The southern Cape coast is highly susceptible to large swells along its wave-dominated coastline, and, under storm conditions, marine inputs of sediment may increase. Neighbouring systems to the west and east drain through Gneissic granite and bentonite deposits, which could be a source of trace deposits of magnetisable material into Knysna should wave propagation transport the material into the estuary during more turbulent seas. The supply of aeolian deposits is generally from the coastal dunes but these have the least potential for magnetisable materials. Highest magnetic susceptibility values occur closer to the mouth (KNY19-A and KNY19-B) decreasing in magnitude towards the upper reaches.
Analysis of surface samples reveals that sites near Leisure Isle and the Heads (Figure 1) have higher concentrations of cadmium, copper, nickel, cobalt and chromium, attributed to a localised source of heavy metals (Watling and Watling, 1982), which is primarily governed by anthropogenic impacts on the system. However, the elevated magnetic susceptibility signal between 700 and 590 cal yr BP (unit B1) occurs at a time that pre-dates any probable major human influences in the area, suggesting a natural phenomenon may be the underlying mechanism for this trend. Thus, a potential combination of augmented inputs both from the wider catchment, possibly from greater runoff under higher precipitation, and from a marine source during a period of more turbulent oceanic conditions may underlie this observation. The influx of turbulent source waters would have made for an unstable environment and limit submerged and emergent vegetation growth (Adams, 2016), an interpretation consistent with the rather low OM%. Palaeoflooding evidence is recorded all along the southern Cape coast between 650 and 300 cal yr BP. Sediments deposited on the continental shelf near the Gouritz River, 110 km to the west, reveal torrential rains and flash flooding in the catchment after 650 cal yr BP under more humid climatic conditions (Hahn et al., 2016). Additionally, high energy floods and higher lake levels occurred in the Wilderness and Groenvlei catchments, 35 km, and 11 km to the west, respectively, between 700 and 500 cal yr BP (Reinwarth et al., 2013; Wündsch et al., 2018).
The period between 660 and 250 cal yr BP appears to have been relatively stable across the lower reaches of the system (KYN19-A and KNY19-B), as the higher LOI values suggests a phase of vegetation colonization and expansion, particularly in the area of Ashmead Channel (KNY19-B). The presence of organic matter suggests that this environment may have been partially vegetated. The structure of the middle and lower reaches of the estuary and the vegetation it hosts are governed by the large tidal prism (Maree, 2000). Currently, Knysna has one of the most extensive Zostera beds of all estuaries in South Africa and the community is widespread in the Ashmead Channel. Zostera is unable to withstand turbulent water (Adams, 2016). Expansion of salt marsh vegetation, which is especially productive (Maree, 2000), on the landward limits of the intertidal zones would be expected under stable environmental conditions. The characteristics of the sediments accumulating at this time are consistent with a period of relative equilibrium where water levels in the estuary are either stable or rising but at a rate that does not exceed sedimentation. The environmental conditions in this phase contrast markedly with prior conditions when sediments were clearly intertidal. The lower reaches of the estuary around Thesen Island (KNY19-A and KNY19-B) show a notable reduction in LOI and productivity accompanied by a sharp increase in the sediment accumulation rate (SAR) at ~340 cal yr BP, along with a rise in sand. The decline in organic matter and changes in sediment characteristics, namely fluctuations in bulk density, magnetic susceptibility and a coarsening of mean grain size at KNY19-B, may indicate a transition from marsh back to tidal flat deposits following a rise in water levels. Between 320 and 150 cal yr BP, sediments in the Ashmead Channel (KNY19-B) exhibit a rapid decrease in grain size, which suggests a shift to a period of lower overall environmental energy. Regional records from Wilderness and the Gouritz River, suggest relatively humid conditions and rising lake levels at this time (Hahn et al., 2016; Wündsch et al., 2016, 2018; Kirsten et al., 2018; Quick et al., 2018).
During the last 200 years or so, there are notable trends in sediment characteristics, particularly around Thesen Island and the Ashmead channel. A marked decline in organic matter accumulation is recorded to levels not previously evident at those sites. There is evidence also of increases in magnetisable material, as coarser grained sediments in the Ashmead Channel occur at approximately the same time as the expansion of human activity in the region (Russell, 1996). The early European settlers engaged, inter alia in felling forests in the catchment, along with constructing a harbour, causeways, roads and bridges. Mining operations, which included alluvium, lignite and gold, began in the late 1800s and continued until 1950 (Grindley, 1985). Gold mining began in the upper reaches of the catchment in the 1860s before collapsing in 1894, such activities greatly impact water quality and can lead to a greater concentration of metals contaminants (Abdul-Wahab and Marikar, 2011). Both Leisure Isle and Thesen Island have been considerably modified over the last 250 years through reclamation and stabilisation (Reddering and Esterhuysen, 1987). The land-use changes associated with the expansion of the urban areas under a growing population and deforestation in the greater Knysna Basin would increase the area of impermeable surfaces and enhance surface runoff, while the construction itself would lead to accelerated erosion (Reddering and Esterhuysen, 1987; Marker, 2000). Fire-induced erosion has contributed to the transference of finer sediments into the Knysna estuary channel through aeolian processes. The Knysna Basin has inherited a high degree of landscape sensitivity as a consequence of its geomorphological history and anthropogenic pressures (Marker, 2003). All of these processes potentially increase the rate of erosion, remobilisation of sediments and lead to a higher sediment load in the rivers. The resulting higher inputs of magnetisable material from the industries established in the estuary since the late 1880s. In fact, Thesen Island hosted a sawmill and boat building factory in the 1920s before being converted into a residential marina estate in 2005, while Leisure Isle was converted to a residential development in the 1930s (Reddering and Esterhuysen, 1987; Claassens et al., 2020; Human et al., 2020).
Sediment accumulation rates in the lower reaches of the estuary remain relatively consistent over time. However, at core site KNY19-G, which represents only the last 125 years or so of the record, SAR is an order of magnitude higher than elsewhere in the system. The position of this site and its greater exposure to fluvial processes reflects changes in the river catchment more broadly. Notably, the exponential increase in organic matter indicates an expansion of the wetlands in the upper reaches of the estuary. Wetland encroachment is controlled by factors associated with vegetation productivity, sediment supply and subsurface processes (Reed, 1990). Accordingly, the observed changes in sediment supply and discharge arising through the construction of the Charlesford Weir upstream of the Knysna River may have played a vital role in the establishment of wetland at this locality (Chmura and Hunt, 2004; Switzer, 2008). In addition, the increased use of urea-based fertilizer in the catchment may contribute to the increased organic content of downstream sediments (Switzer, 2008). The coarsening of mean grain size at KNY19-G implies either an increase in energy, or anthropogenic disturbance. Residential developments on the flanking Brenton dune along the western shores and in the upper catchment, increased erosion of significant natural sediment sources to the system leading to greater deposition of sandy silt in the estuary (Reddering and Esterhuysen, 1987; Marker, 2000). All things considered, human activities since the arrival of colonial settlers in the 1700s to present have greatly modified the system.
Multi-proxy evidence from three sediment cores reveals that the microtidal environment of the Knysna Estuary has been heavily influenced by marine transgressions and regressions, but also suggests changes in character that may be linked to human activities in the geologically recent past. Although sediment accumulation rates have not changed dramatically since the European colonization of the region in the late 1700s, rapid changes in organic matter content are recorded. The study demonstrates the feasibility and value of combined age-depth modelling of 210Pb and 14C, that underpins the comparison of environmental conditions across the estuary basin and provides greater chronological control when attributing possible causes for the changes observed. Sites selected for the three sediment cores provide a window into past environmental conditions in a range of geomorphological settings. Core KNY19-A, for example, yields insights into past sea level changes and its impacts on the system, although such high energy environments are more prone to erosion and consequently the sedimentary sequence is less continuous. KNY19-B was sampled from the mudflats of the Ashmead channel, a low energy environment additionally protected by the sandy-silt deposition zone of Thesen Island, and the sediments here offer a glimpse into changing conditions in the estuary and the impact of storm events over time. The low energy environment of the wetland of the upper estuary (KNY19-G) yield a record of catchment dynamics, including increased anthropogenic impacts. The upper reaches are likely to experience higher sedimentation rates, as fluvial inputs enter the system and settle, offering an opportunity for future high-resolution sedimentological and physicochemical studies to further unravel the evolution of this vulnerable and valuable estuarine system.
The raw data supporting the conclusions of this article will be made available by the authors, without undue reservation.
KK: conceptualisation, methodology, investigation, writing, project administration, drafting and revising, analysis, and interpretation of data. MM: conceptualisation, methodology, investigation, writing, project administration, drafting and revising, and fund acquisition. LP: conceptualisation, methodology, investigation, writing, drafting and revising, analysis, and interpretation of data. RW and MA-L: methodology, investigation, writing, drafting and revising, analysis, and interpretation of data. HA and YD: investigation, writing, drafting, and revising. AQ: writing, drafting, and revising. JF: drafting and revising, writing, and interpretation of data. KB: methodology, investigation, writing, project administration, drafting and revising, funds acquisition, analysis, and interpretation of data. All authors contributed to the article and approved the submitted version.
This study was funded by the National Natural Science Foundation of China (41761144062, 41730646, 41725002, and 41771506) and by the National Research Foundation of South Africa (Grant no: 110776) under SANParks Permit Number: MEAD-ME/2018–007. KK acknowledges the DSI-NRF Centre of Excellence in Palaeosciences (Grant Ref#: COE2021NGP-KD), the NRF CPRR (Grant Ref#: 120806), the UCT #AdvancingWomxn funding for HERI and the UCT VC2030 Leadership grant scheme. LP acknowledges the support from the NRF (Grant ID: 129531). RW was funded by the Oppenheimer Memorial Trust and VC2030 Scholar Postdoctoral Fellowship awards.
Field assistance of S. Hess, M. Armitage and numerous students is gratefully acknowledged.
The authors declare that the research was conducted in the absence of any commercial or financial relationships that could be construed as a potential conflict of interest.
All claims expressed in this article are solely those of the authors and do not necessarily represent those of their affiliated organizations, or those of the publisher, the editors and the reviewers. Any product that may be evaluated in this article, or claim that may be made by its manufacturer, is not guaranteed or endorsed by the publisher.
The Supplementary material for this article can be found online at: https://www.frontiersin.org/articles/10.3389/fevo.2023.1120460/full#supplementary-material
Abdul-Wahab, S., and Marikar, F. (2011). The environmental impact of gold mines: pollution by heavy metals. Open Eng. 2, 304–313. doi: 10.2478/s13531-011-0052-3
Adams, J. B. (2016). Distribution and status of Zostera capensis in South African estuaries — a review. S. Afr. J. Bot. 107, 63–73. doi: 10.1016/j.sajb.2016.07.007
Allanson, B. R., Maree, B., and Grange, N. (2000). An introduction to the chemistry of the water column of the Knysna estuary with particular reference to nutrients and suspended solids. Trans. R. Soc. South Africa 55, 141–162. doi: 10.1080/00359190009520440
Andersen, T. J. (2017). “Some practical considerations regarding the application of 210Pb and 137Cs dating to estuarine sediments” in Applications of Paleoenvironmental techniques in estuarine studies. eds. K. Weckström, K. M. Saunders, P. A. Gell, and C. G. Skilbeck (Dordrecht, The Netherlands: Springer Nature), 121–140.
Andersen, T. J., Mikkelsen, O. A., Moller, A. L., and Pejrup, M. (2000). Deposition and mixing depths on some European intertidal mudflats based on 210Pb and 137Cs activities. Cont. Shelf Res. 20, 1569–1591. doi: 10.1016/S0278-4343(00)00038-8
Aquino-López, M. A., Blaauw, M., Christen, J. A., and Sanderson, N. K. (2018). Bayesian analysis of 210 Pb dating. J. Agric. Biol. Environ. Stat. 23, 317–333. doi: 10.1007/s13253-018-0328-7
Aquino-López, M. A., Ruiz-Fernández, A. C., Blaauw, M., and Sanchez-Cabeza, J. A. (2020). Comparing classical and Bayesian 210Pb dating models in human-impacted aquatic environments. Quat. Geochronol. 60:101106. doi: 10.1016/j.quageo.2020.101106
Bao, K., Shen, J., and Sapkota, A. (2017). High-resolution enrichment of trace metals in a west coastal wetland of the southern Yellow Sea over the last 150 years. J. Geochem. Explor. 176, 136–145. doi: 10.1016/j.gexplo.2015.09.010
Barnes, R. S. K. (2021). Patterns of seagrass macrobenthic biodiversity in the warm-temperate Knysna estuarine bay, Western cape: a review. Aquat. Ecol. 55, 327–345. doi: 10.1007/s10452-021-09848-3
Barsanti, M., Garcia-Tenorio, R., Schirone, A., Rozmaric, M., Ruiz-Fernández, A. C., Sanchez-Cabeza, J. A., et al. (2020). Challenges and limitations of the 210Pb sediment dating method: results from an IAEA modelling interlaboratory comparison exercise. Quat. Geochronol. 59:101093. doi: 10.1016/j.quageo.2020.101093
Benallack, K., Green, A. N., Humphries, M. S., Cooper, J. A. G., Dladla, N. N., and Finch, J. M. (2016). The stratigraphic evolution of a large back-barrier lagoon system with a non-migrating barrier. Mar. Geol. 379, 64–77. doi: 10.1016/j.margeo.2016.05.001
Bruun, P. (1962). Sea level rise as a cause of shore erosion. J. Waterways Harb. Division 88, 117–130. doi: 10.1061/JWHEAU.0000252
Cattaneo, A., and Steel, R. J. (2003). Transgressive deposits: a review of their variability. Earth Sci. Rev. 62, 187–228. doi: 10.1016/S0012-8252(02)00134-4
Chmura, G. L., and Hunt, G. A. (2004). Controls on salt marsh accretion: a test in salt marshes of eastern Canada. Estuaries 27, 70–81. doi: 10.1007/BF02803561
Claassens, L., Barnes, R. S. K., Wasserman, J., Lamberth, S. J., Miranda, N. A. F., van Niekerk, L., et al. (2020). Knysna estuary health: ecological status, threats and options for the future. Afr. J. Aquat. Sci. 45, 65–82. doi: 10.2989/16085914.2019.1672518
Cooper, J. (2001). Geomorphology of tide-dominated and river-dominated, barred, microtidal estuaries: a contrast. J. Coast. Res. 34, 428–436. doi: 10.2307/25736309
Cooper, J. A. G., Green, A. N., and Compton, J. S. (2018). Sea-level change in southern Africa since the last glacial maximum. Quat. Sci. Rev. 201, 303–318. doi: 10.1016/j.quascirev.2018.10.013
Folk, R. L., and Ward, W. C. (1957). Brazos River bar [Texas]; a study in the significance of grain size parameters. J. Sediment. Res. 27, 3–26. doi: 10.1306/74D70646-2B21-11D7-8648000102C1865D
Fournier, J., Gallon, R. K., and Paris, R. (2014). G2Sd: a new R package for the statistical analysis of unconsolidated sediments. Geomorphol. Relief Process. Environ. 20, 73–78. doi: 10.4000/geomorphologie.10513
Gomes, M., Humphries, M. S., Kirsten, K. L., Green, A. N., Finch, J. M., and de Lecea, A. M. (2017). Diatom-inferred hydrological changes and Holocene geomorphic transitioning of Africa’s largest estuarine system, Lake St Lucia. Estuar. Coast. Shelf Sci. 192, 170–180. doi: 10.1016/j.ecss.2017.03.030
Grindley, J. R. (1985). “Estuaries of the cape: Knysna (CMS 13)” in CSIR research. eds. H. J. Heydorn and J. R. G. Stellenbosch (Pretoria: Council for Scientific and Industrial Research)
Hahn, A., Schefuß, E., Andó, S., Cawthra, H. C., Frenzel, P., Kugel, M., et al. (2016). Linking catchment hydrology and ocean circulation in late Holocene southernmost Africa. Clim. Past Discuss. 13, 649–665. doi: 10.5194/cp-2016-100
Heaton, T. J., Köhler, P., Butzin, M., Bard, E., Reimer, R. W., Austin, W. E. N., et al. (2020). Marine20 - the marine radiocarbon age calibration curve (0-55,000 cal BP). Radiocarbon 62, 779–820. doi: 10.1017/RDC.2020.68
Helgren, D. M., and Butzer, K. W. (1977). Paleosols of the southern Cape Coast, South Africa: implications for laterite definition, genesis, and age. Geogr. Rev. 67, 430–445. doi: 10.2307/213626
Hogg, A. G., Heaton, T. J., Hua, Q., Palmer, J. G., Turney, C. S. M., Southon, J., et al. (2020). SHCal20 southern hemisphere calibration, 0-55,000 years cal BP. Radiocarbon 62, 759–778. doi: 10.1017/RDC.2020.59
Holmes, P., Marker, M., Bateman, M., and Carr, A. (2007). The place of aeolian coversands in the geomorphic evolution of the southern Cape coast, South Africa. S. Afr. J. Geol. 110, 125–136. doi: 10.2113/gssajg.110.1.125
Human, L. R. D., Adams, J. B., and Allanson, B. R. (2016). Insights into the cause of an Ulva lactuca Linnaeus bloom in the Knysna estuary. S. Afr. J. Bot. 107, 55–62. doi: 10.1016/j.sajb.2016.05.016
Human, L. R. D., Weitz, R., Allanson, B. R., and Adams, J. B. (2020). Nutrient fluxes from sediments pose management challenges for the Knysna estuary, South Africa. Afr. J. Aquat. Sci. 45, 1–9. doi: 10.2989/16085914.2019.1671787
Kirsten, K. L., Haberzettl, T., Wündsch, M., Frenzel, P., Meschner, S., Smit, A. J. J., et al. (2018). A multiproxy study of the ocean-atmospheric forcing and the impact of sea-level changes on the southern cape coast, South Africa during the Holocene. Palaeogeogr. Palaeoclimatol. Palaeoecol. 496, 282–291. doi: 10.1016/j.palaeo.2018.01.045
Kirsten, K. L., Kasper, T., Cawthra, H. C., Strobel, P., Quick, L. J., Meadows, M. E., et al. (2020). Holocene variability in climate and oceanic conditions in the winter rainfall zone of South Africa—inferred from a high resolution diatom record from Verlorenvlei. J. Quat. Sci. 35, 572–581. doi: 10.1002/jqs.3200
Kirwan, M. L., and Megonigal, J. P. (2013). Tidal wetland stability in the face of human impacts and sea-level rise. Nature 504, 53–60. doi: 10.1038/nature12856
Largier, J. L., Attwood, C., and Harcourt-Baldwin, J. L. (2000). The hydrographic character of the Knysna estuary. Trans. R. Soc. South Africa 55, 107–122. doi: 10.1080/00359190009520437
Maboya, M. L., Meadows, M. E., Reimer, P. J., Backeberg, B. C., and Haberzettl, T. (2018). Late Holocene marine radiocarbon reservoir correction for the south and east coast of South Africa. Radiocarbon 60, 571–582. doi: 10.1017/RDC.2017.139
Maree, B. (2000). Structure and status of the intertidal wetlands of the Knysna estuary. Trans. R. Soc. South Africa 55, 163–176. doi: 10.1080/00359190009520441
Marker, M. E. (2000). A descriptive account of sand movement in the Knysna estuary. Trans. R. Soc. South Africa 55, 129–139. doi: 10.1080/00359190009520439
Marker, M. E. (2003). The Knysna Basin, South Africa: geomorphology, landscape sensitivity and sustainability. Geogr. J. 169, 32–42. doi: 10.1111/1475-4959.04971
Marker, M. E., and Holmes, P. J. (2002). The distribution and environmental implications of coversand deposits in the southern cape, South Africa. S. Afr. J. Geol. 105, 135–146. doi: 10.2113/105.2.135
Marker, M. E., and Miller, D. E. (1993). A Mid-Holocene high stand of the sea at Knysna. S. Afr. J. Sci. 89, 100–101.
Miller, D. E., Yates, R. J., Jerardino, A., and Parkington, J. E. (1995). Late Holocene coastal change in the southern cape. South Africa. Quat. Int. 29–30, 3–10. doi: 10.1016/1040-6182(95)00002-Z
Muir, R. A., Bordy, F. M., Reddenng, J. S. V., and Viljocn, J. H. A. (2017). Lithostratigraphy of the enon formation (Uitenhage group) South Africa. S. Afr. J. Geol. 120, 273–280. doi: 10.25131/gssajg.120.2.273
Newton, A., Icely, J., Cristina, S., Perillo, G. M. E., Turner, R. E., Ashan, D., et al. (2020). Anthropogenic, direct pressures on coastal wetlands. Front. Ecol. Evol. 8:e00144. doi: 10.3389/fevo.2020.00144
Petermann, E., Knöller, K., Rocha, C., Scholten, J., Stollberg, R., Weiß, H., et al. (2018). Coupling end-member mixing analysis and isotope mass balancing (222-Rn) for differentiation of fresh and recirculated submarine groundwater discharge into Knysna estuary, South Africa. J. Geophys. Res. Oceans 123, 952–970. doi: 10.1002/2017JC013008
Peterson, L. C., Haug, G. H., Hughen, K. A., and Röhl, U. (2000). Rapid changes in the hydrologic cycle of the tropical Atlantic during the last glacial. Science 290, 1947–1951. doi: 10.1126/science.290.5498.1947
Quick, L. J., Chase, B. M., Wündsch, M., Kirsten, K. L., Chevalier, M., Mäusbacher, R., et al. (2018). A high-resolution record of Holocene climate and vegetation dynamics from the southern cape coast of South Africa: pollen and microcharcoal evidence from Eilandvlei. J. Quat. Sci. 33, 487–500. doi: 10.1002/jqs.3028
Rautenbach, C., Barnes, M. A., and de Vos, M. (2019). Tidal characteristics of South Africa. Deep Sea res 1 Oceanogr res pap 150. doi: 10.1016/j.dsr.2019.103079,
Reddering, J. S. V., and Esterhuysen, K. (1987). Sediment dispersal in the Knysna estuary: environmental management considerations. S. Afr. J. Geol. 90, 448–457.
Reed, D. J. (1990). The impact of sea-level rise on coastal salt marshes. Prog. Phys. Geogr. 14, 465–481. doi: 10.1177/030913339001400403
Reinwarth, B., Franz, S., Baade, J., Haberzettl, T., Kasper, T., Daut, G., et al. (2013). A 700-year record on the effects of climate and human impact on the southern cape coast inferred from lake sediments of Eilandvlei, wilderness embayment, South Africa. Geogr. Ann. Ser. B 95, 345–360. doi: 10.1111/geoa.12015
Russell, I. A. (1996). Water quality in the Knysna estuary. Koedoe 39, 1–8. doi: 10.4102/koedoe.v39i1.278
Sanchez-Cabeza, J. A., and Ruiz-Fernández, A. C. (2012). 210Pb sediment radiochronology: an integrated formulation and classification of dating models. Geochim. Cosmochim. Acta 82, 183–200. doi: 10.1016/j.gca.2010.12.024
Swift, D. J. P. (1968). Coastal erosion and transgressive stratigraphy. J. Geol. 76, 444–456. doi: 10.1086/627342
Switzer, T. (2008). Urea loading from a spring storm-Knysna estuary, South Africa. Harmful Algae 8, 66–69. doi: 10.1016/j.hal.2008.08.005
Tite, M. S. (1972). The influence of geology on the magnetic susceptibility of soils on archaeological sites. Archaeometry 14, 229–236. doi: 10.1111/j.1475-4754.1972.tb00065.x
Warwick, R. M., Tweedley, J. R., and Potter, I. C. (2018). Microtidal estuaries warrant special management measures that recognise their critical vulnerability to pollution and climate change. Mar. Pollut. Bull. 135, 41–46. doi: 10.1016/j.marpolbul.2018.06.062
Watling, R. J., and Watling, H. R. (1982). Metal surveys in south African estuaries II. Knysna River. Water SA 8, 36–44.
Wündsch, M., Haberzettl, T., Cawthra, H. C., Kirsten, K. L., Quick, L. J., Zabel, M., et al. (2018). Holocene environmental change along the southern cape coast of South Africa – insights from the Eilandvlei sediment record spanning the last 8.9 kyr. Glob. Planet Change 163, 51–66. doi: 10.1016/j.gloplacha.2018.02.002
Wündsch, M., Haberzettl, T., Kirsten, K. L., Kasper, T., Zabel, M., Dietze, E., et al. (2016). Sea level and climate change at the southern cape coast, South Africa, during the past 4.2 kyr. Palaeogeogr. Palaeoclimatol. Palaeoecol. 446, 295–307. doi: 10.1016/j.palaeo.2016.01.027
Keywords: 210pb, 14C, grain size, magnetic susceptibility, loss-on-ignition, estuarine sediments, human impact, sedimentation rate
Citation: Kirsten KL, Pretorius L, Meadows ME, Weij R, Aquino-López M, Antonopoulos HG, Dubazana Y, Qadeer A, Finch J and Bao K (2023) The depositional history of the Knysna estuary since European colonization in the context of sea level and human impacts. Front. Ecol. Evol. 11:1120460. doi: 10.3389/fevo.2023.1120460
Edited by:
Luo Chuanxiu, Chinese Academy of Sciences (CAS), ChinaReviewed by:
Veronica Rossi, University of Bologna, ItalyCopyright © 2023 Kirsten, Pretorius, Meadows, Weij, Aquino-López, Antonopoulos, Dubazana, Qadeer, Finch and Bao. This is an open-access article distributed under the terms of the Creative Commons Attribution License (CC BY). The use, distribution or reproduction in other forums is permitted, provided the original author(s) and the copyright owner(s) are credited and that the original publication in this journal is cited, in accordance with accepted academic practice. No use, distribution or reproduction is permitted which does not comply with these terms.
*Correspondence: Michael E. Meadows, bWljaGFlbC5tZWFkb3dzQHVjdC5hYy56YQ==
†These authors share first authorship
Disclaimer: All claims expressed in this article are solely those of the authors and do not necessarily represent those of their affiliated organizations, or those of the publisher, the editors and the reviewers. Any product that may be evaluated in this article or claim that may be made by its manufacturer is not guaranteed or endorsed by the publisher.
Research integrity at Frontiers
Learn more about the work of our research integrity team to safeguard the quality of each article we publish.