
95% of researchers rate our articles as excellent or good
Learn more about the work of our research integrity team to safeguard the quality of each article we publish.
Find out more
ORIGINAL RESEARCH article
Front. Ecol. Evol. , 22 May 2023
Sec. Conservation and Restoration Ecology
Volume 11 - 2023 | https://doi.org/10.3389/fevo.2023.1119452
This article is part of the Research Topic Insect Conservation Behavior View all 11 articles
 Isaac P. Weinberg*†
 Jaya P. WetzelEleanor P. KucharAbigail T. KaplanRebecca S. Graham
 Jonah E. Zuckerman
 Philip T. Starks
Insect pollinators are vital to the stability of a broad range of both natural and anthropogenic ecosystems and add billions of dollars to the economy each year. Honey bees are perhaps the best studied insect pollinator due to their economic and cultural importance. Of particular interest to researchers are the wide variety of mechanisms honey bees use for thermoregulation, such as fanning cool air currents around the hive and careful selection of insulated nest sites. These behaviors help honey bees remain active through both winter freezes and summer heatwaves, and may allow honey bees to deal with the ongoing climate crisis more readily than other insect species. Surprisingly, little is known about how honey bee colonies manage chronic heat stress. Here we provide a review of honey bee conservation behavior as it pertains to thermoregulation, and then present a novel behavior displayed in honey bees—the alteration of comb arrangement in response to 6 weeks of increased hive temperature. We found that while overall quantities of brood remained stable between treatments, brood were distributed more diffusely throughout heated hives. We also found that heated hives contained significantly less honey and nectar stores than control hives, likely indicating an increase in energy expenditure. Our results support previous findings that temperature gradients play a role in how honey bees arrange their comb contents, and improves our understanding of how honey bees modify their behavior to survive extreme environmental challenges.
Understanding the way insect behavior is affected by changing environmental conditions is vital to developing effective conservation strategies. Arguably the most culturally and economically important insect species is the honey bee, which provides vital pollination services to crops and wild flowering plants, and contributes tens of billions of dollars to the United States economy and hundreds of billions to the world economy each year (Gallai et al., 2009; Calderone, 2012; Hung et al., 2018; Reilly et al., 2020). Honey bee colonies are affected by many stressors including pesticides, disease, parasites, poor forage quality, and aggressive management strategies (Potts et al., 2010; Goulson et al., 2015; Wood and Goulson, 2017; Sánchez-Bayo and Wyckhuys, 2019; Hristov et al., 2020; Panziera et al., 2022). No stressor, however, may be as threatening to honey bee colonies as increased global temperatures caused by the ongoing climate crisis. The behavioral strategies honey bees use to deal with acute bouts of heat stress are well documented (Jones and Oldroyd, 2006; Perez and Aron, 2020), but how honey bees respond to chronic heat stress, which is becoming more common, is less well understood. Improving our knowledge of how honey bee colonies are affected by chronic heat stress is vital, as the effectiveness of their response may impact their susceptibility to other stressors. In this manuscript, we provide a review of honey bee conservation behavior as it relates to their ability thermoregulate their hives. We then present a novel study on the effect of chronic heat stress on honey bee comb store arrangement.
Temperature maintenance is important for all individuals in a hive, but it is particularly important for brood (Wang et al., 2016). While adult worker bees can withstand brief exposure to temperatures between 46 and 50°C (Heinrich, 1980; Coelho, 1991; Gonzalez et al., 2022), worker brood develop optimally in a relatively tight temperature range between 32 and 36°C (Becher et al., 2009), with the ideal temperature generally stated as 35°C (Szentgyörgyi et al., 2018). Prolonged exposure to temperatures below 32°C increase the likelihood of workers developing malformed wings, legs and abdomens (Himmer, 1932; Chacon-Almeida et al., 1999), and even brief exposure to temperatures of 20°C significantly reduces brood survival, and decreases their lifespan as adults (Wang et al., 2016). High temperatures may be even more detrimental for brood health, as pupal survival drops to zero at incubation temperatures of just 38°C (Groh et al., 2004).
Within the optimal temperature range, even small differences can have lasting effects on adult physiology and behavior. Bees reared at the higher end of their optimal range show accelerated pupal development, forage earlier in life, dance more frequently, have improved short term memory, and are better at in-hive tasks (Lin and Winston, 1998; Tautz et al., 2003; Petz et al., 2004; Jones et al., 2005; Becher et al., 2009; Wang et al., 2016; Medina et al., 2018). Workers that develop at the lower end of the optimal range tend to be larger, and have longer adult lifespans (Szentgyörgyi et al., 2018). In addition, workers reared more than 1.5°C away 34.5°C have reduced number of olfactory microglomeruli (Groh et al., 2004) indicating rearing temperature affects adult neural function. Likely due to their sensitivity, honey bees more tightly regulate the temperature of their hives when brood are present (Kronenberg and Heller, 1982) and are more likely to thermoregulate brood comb than other hive areas (Simpson, 1961).
Unlike most insect species that live in temperate climates, honey bee colonies remain active throughout the cold winter months. To keep warm, honey bees cluster together and use metabolic energy to “shiver” by isometrically contracting their wing muscles to produce endothermic heat (Phillips and Demuth, 1914; Kronenberg and Heller, 1982). In broodless colonies, bees cluster when ambient temperatures fall to 14°C (Phillips and Demuth, 1914), but begin to cluster at 20°C in the presence of brood (Simpson, 1961; Kronenberg and Heller, 1982). The bees in the cluster’s core produce most of the endothermic heat, while bees on the mantle function mostly as insulation (Stabentheiner et al., 2003). In ambient temperatures as low as 2.5°C the core of a cluster can sustain temperatures greater than 35°C, high enough to incubate brood, while the mantle remains above 17°C (Simpson, 1961; Heinrich, 1981; Watmough and Camazine, 1995; Stabentheiner et al., 2003). To maintain a constant internal temperature as ambient temperatures decrease, the bees cluster closer together and consume more honey and nectar to facilitate heat production (Simpson, 1961). The tightening of the cluster results in a smaller area being maintained within the optimal temperature range for brood rearing. Even a single abnormally cold night can contract the cluster, which may explain why brood mortality is higher near the periphery of a hive (Fukuda and Sakagami, 1968). Given that rearing temperature can strongly affect an individual bee’s adult behavior and physiology, eggs laid in the center of the brood cluster may be more likely to develop into effective adults.
Since clustering begins nearly 15° below the optimal rearing temperature for brood, honey bees use more localized mechanisms to warm brood once temperatures drop below 32°C (Stabentheiner et al., 2021). Individual bees can warm brood using their own endothermic heat, either by pressing their thoraxes on individual capped brood cells (Bujok et al., 2002), or by entering an empty cell to warm brood in surrounding cells (Kleinhenz et al., 2003). Only bees older than about 2 days will actively heat brood, while bees under 2 days are much more likely to seek exothermic heat sources to help complete their own flight muscle development (Stabentheiner et al., 2010).
Honey bee colonies may also behaviorally increase their temperature to induce a “fever” which is hypothesized to be a generalized response to illness, particularly in large colonies (Simone-Finstrom et al., 2014; Bonoan et al., 2020). Colonies with the fungal infection Ascosphaera apis behaviorally increase their temperature (Starks et al., 2000), while individuals infected by Nosema ceranae seek high temperature areas within the colony (Campbell et al., 2010). It is also known that parasitic Varroa mites breed optimally at the same temperature as honey bees, with their reproductive success decreasing sharply above 36.5°C (Le Conte et al., 1990) and that colonies with high varroa load elevate their temperatures by 1.5°C (Hou et al., 2016). Artificially heating colonies to above 40°C has also been commonly suggested as an effective treatment for Varroa infestations (Hoppe and Ritter, 1987; Rosenkranz, 1987; Harbo, 2000).
Honey bees are more able to keep large sections of their colony cool than warm (Stabentheiner et al., 2021). This is because some of the primary behaviors used to cool the hive like fanning, where bees use their wings to drive cool air currents around the hive, paired with evaporative cooling, induced by regurgitating water across the hive, can cool the hive without requiring direct body contact (Heinrich, 1979; Kronenberg and Heller, 1982; Seeley, 1985). The temperature at which individuals begin fanning is genetically influenced, and multi-patriline colonies are more effective at regulating the temperature of their hive because the variation of the temperature at which individuals begin fanning is increased (Jones et al., 2004; Graham et al., 2006). Some bees begin to fan at temperatures as low as 20°C, possibly as a response to high levels of carbon dioxide within the hive (Seeley, 1974), and fanning probability rises quickly as temperatures increase (Cook and Breed, 2013; Cook et al., 2016). Social context also affects the likelihood of fanning, with the likelihood increasing if a bee is surrounded by other fanners (Kaspar et al., 2018).
The mechanism honey bees use to fan is strongly affected by the physical properties of the hive itself. If the hive has a small entrance, bees alternate between fanning warm air high in carbon dioxide out of the hive, and briefly stopping to let oxygen-rich air return by diffusion in what has been described as “slow breathing” of the colony (Seeley, 1974; Southwick and Moritz, 1987). In hives with large entrances, bees stand along one side of the entrance to fan air out, while others fan air in from the other side to create cyclic air currents within the hive (Peters et al., 2019). In cases of extreme heat, large numbers of bees will leave the hive to increase the area available for air circulation, creating a “beard” near the entrance (Winston, 1987).
When heat stress is localized, honey bees engage in a behavior known as “heat shielding” where individual bees position themselves between a heat source and developing brood, protecting brood by absorbing excess heat into their own bodies (Starks and Gilley, 1999; Siegel et al., 2005). Bees between age 12 and 14 are most likely to engage in heat shielding, indicating performance of this task is influenced by a bee’s developmental stage (Starks et al., 2005). Once individuals absorb enough heat they move toward the periphery of the nest, rapidly speeding up the diffusion of heat in a manner analogous to mammalian vascular dynamics in thermoregulation (Bonoan et al., 2014).
The aforementioned cooling methods are energy intensive making them best suited for managing acute heat stress. As extended heatwaves become more common worldwide (Marx et al., 2021) it is vital we improve our understanding of how honey bee colonies mange chronic heat stress in their hives. Wild honey bees tend to make their nests in insulated spaces like tree hollows that help preserve the temperature within their hives (Seeley and Morse, 1976). They also organize their comb with a central cluster of brood surrounded by thick layers of honey and nectar, which has been hypothesized to have an insulating effect on the brood (Seeley and Morse, 1976; Camazine et al., 1990). It has been speculated that bees may use natural thermal gradients in the hive to determine where they place their stores, which may help them more easily maintain the temperature of their brood (Camazine, 1991; Montovan et al., 2013). Previous work from our lab provides evidence that honey bees are able to alter comb arrangement in response to localized chronic heat stress in a way that thermally protects brood (Weinberg et al., 2022).
In the study presented here, we tested the hypothesis that comb phenotype is affected by chronic hive-wide heat stress in full-sized free-foraging honey bee colonies. We subjected honey bee colonies to chronic heat stress over 6 weeks and measured the phenotype of brood, carbohydrates (honey and nectar), pollen stored within the comb three times over 6 weeks by recording the area on each frame in each hive covered in each store. We hypothesized that exposure to chronic heat stress would cause comb to become arranged in a way that better insulates brood: a more densely clustered brood comb, with thicker stores of honey and nectar on the periphery. The goal of this study was to increase our understanding of how honey bee colonies behaviorally respond to mitigate chronic heat stress in their hives. These insights may allow for the creation of better strategies to mitigate the effect of chronic heat stress on managed honey bee colonies, which already suffer from high yearly mortality (Gregorc, 2020).
Five-frame nucleus colonies (n = 20) of Apis mellifera ligustica were used as subjects for this experiment. Twelve colonies were installed at the Cummings School of Veterinary Medicine in Grafton, MA (N 42°23′98″, W 71°68′67″) on June 2–21, and eight were installed at the Tufts University campus in Medford, MA (N 42°24′20″, W 71°06′51″) on June 3–21. Half of the colonies at each site were used as control hives, and the other half were outfitted to be experimentally heated. Two control hives from the Medford site, and one control hive and one experimental hive from the Grafton site were excluded due to having no brood stores at the end of the study, indicating the loss of the colony’s queen. This left seven control hives and nine experimentally heated hives. The size of each colony size was measured in week 1 and week 4 using a modified Liebenfield method (Imdorf et al., 1987; Dainat et al., 2020). Each frame was removed from each hive, and the proportion of each side of the frame covered in bees on was visually estimated to the nearest 25%. Colony size did not differ between treatments in week 1 (Welches two sample t-test p = 0.4, average full frames of bees = 3.1 for control and 2.8 for heated) or week 4 (Welches two sample t-test, p = 0.28, average full frames of bees = 2.67 for control and 3.4 for heated).
Two 15 cm × 20 cm heating pads (Zoo Med ReptiTherm®) were installed in each experimental hive. Each heating pad was fastened onto an empty frame and installed facing inwards on the left and right most side of the hive interior. We elected not to install heating pads on control hives since previous studies have shown that powered down heating pads to not affect honey bee behavior (Starks and Gilley, 1999; Weinberg et al., 2022). The installation of heating frames restricted experimental colonies to building on 8 frames. To maintain size consistency between groups, control colonies were also restricted to 8 frames using exclusion boards. Both heating pads in each experimental hive were powered by a single temperature controller (InkBird ITC-306 T). A probe from the temperature controller was fastened to one heating pad in each hive, which controlled power to both pads based on the temperature of the probe. The probe was set to maintain the temperature of the heating pad at 41 ± 2°C from 8 a.m. to 4 p.m. and 31 ± 2°C from 4 p.m. to 8 a.m. The heating pads were activated on June 17–21 (Week 0) in Grafton and June 15–21 (Week 0) in Medford.
Temperature gradients were measured at three timepoints in two hive of each treatment. Nine temperature probes were placed in each hive from which measurements were taken: one probe was placed between each frame, and one each on the outer edge of the left and right most frame. Probe position was recorded based on distance, in full frames, from the center of the hive. Since there were 9 probes, distances ranged from 0 to 4 frames from the center (Figure 1). To further validate that our method was sufficient to warm the hives, after the end of the field season we used temperature loggers (iButton DS1921H-F5) to take temperature readings in one control and one experimental hive every 15 min for 24 h (Figure 1). These readings were taken in empty colonies which were placed indoors, but were subjected to the same heat regimen as our experimental hives during the field season. A Welch two-sample t-test validated that temperatures were significantly elevated within heated hives during this validation (p < 0.00001).
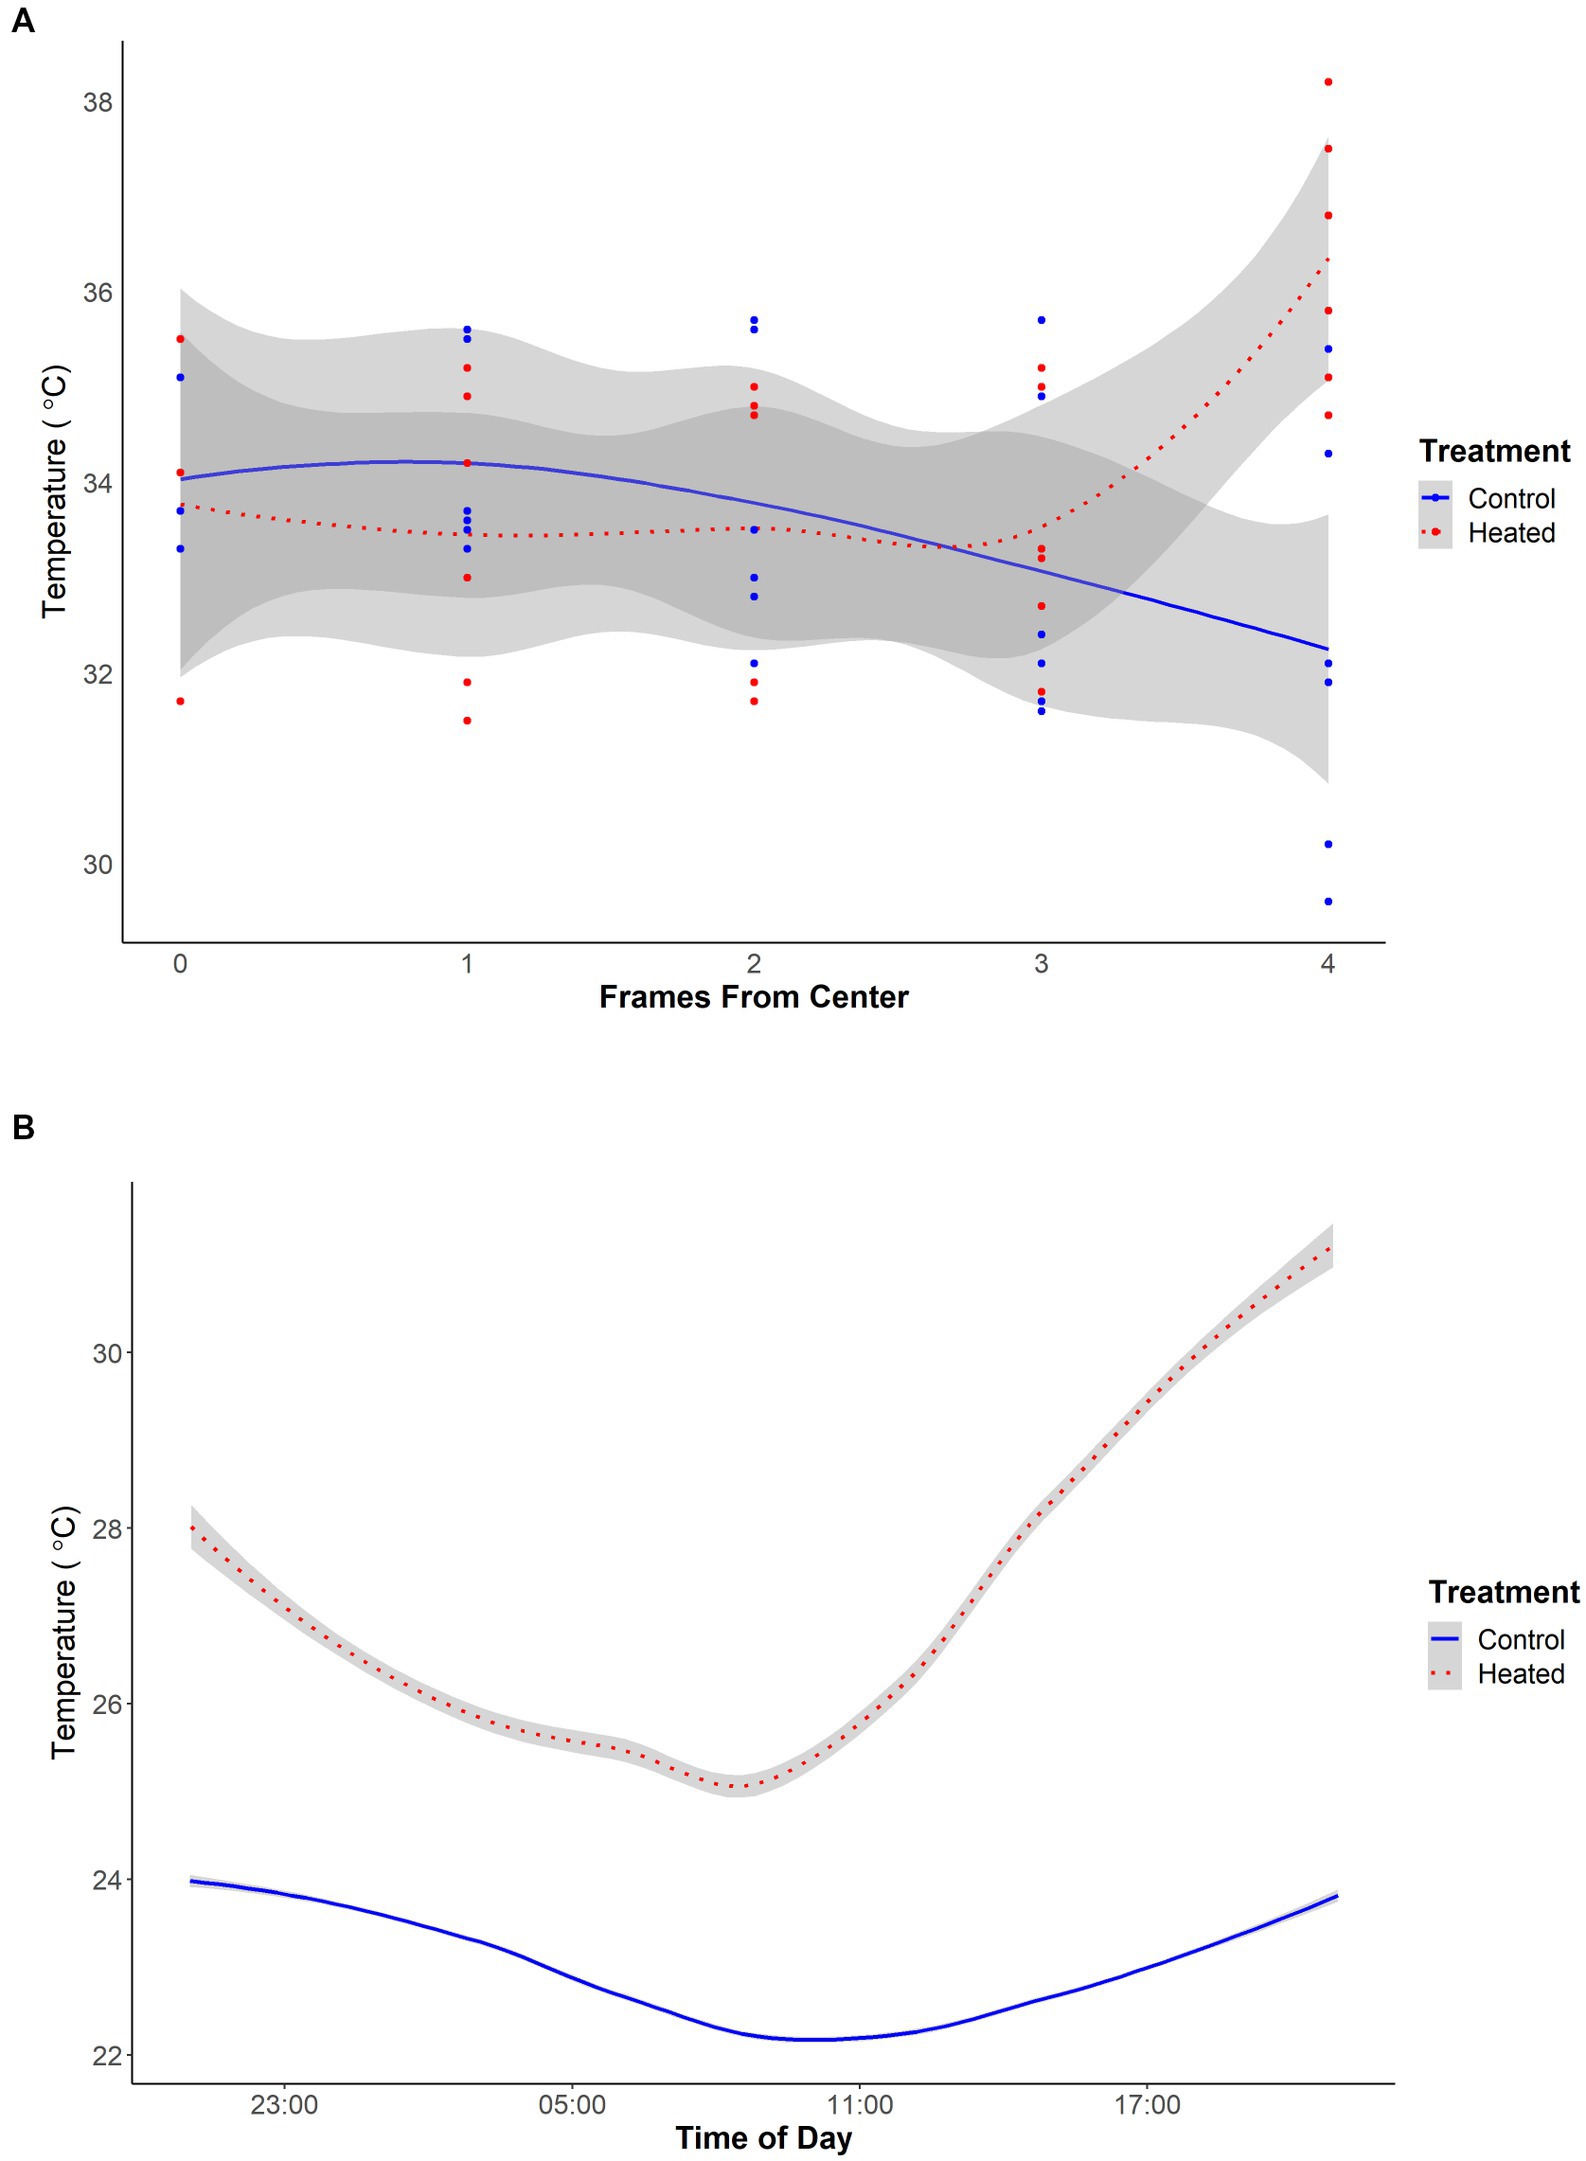
Figure 1. (A) Temperature gradient in degrees Celsius from the edge to the center of the hive in control (blue, solid) and heated (red, dotted) honey bee colonies (N = 3 for both treatments). Temperature was taken between each frame and on the outside of the left and right most frames. Each frame is approximately 38 mm wide. Gray lines represent standard error. All figures made using R. (B) Average temperature in degrees Celsius of empty hives in either control (blue, solid) or heated (red, dotted) colonies. Temperatures were taken every 15 min for 24 h from 4:00 p.m. to 4 p.m. using seven probes distributed in one hive of each treatment. Gray lines represent standard error.
Data were collected from the hives three times, at approximately three-week intervals. Previous research has shown that 3 weeks is a sufficient period of time for comb alteration to occur (Weinberg et al., 2022). In Grafton, data collection occurred on June 17–21 (Week 0), July 8–21 (Week 3) and August 2–21 (Week 6), and in Medford, data collection occurred on June 15–21 (Week 0), July 10–21 (Week 3), and July 28–21 (Week 6). To analyze comb phenotype, photographs were then taken of both sides of all eight frames in each colony, for a total of 320 comb sides imaged and analyzed each day. Each frame was lifted out of the hive one at a time. Any bees remaining on the frame were lightly brushed back into the hive before a photograph of both sides of the frame were taken. The frame was then inserted back into the hive in its previous position before the next frame was removed. Comb photographs were analyzed using Fiji (Schindelin et al., 2012). Cells containing honey, nectar, pollen, capped brood, and uncapped brood were traced to determine the total area filled by each store. For analysis, comb stores were split into three categories based on type: brood, which consisted of capped and uncapped brood; carbohydrates, which consisted of honey and nectar; and protein, which consisted of pollen (Weinberg et al., 2022).
Generalized linear mixed models created in R using the “glmmTMB” package (Magnusson et al., 2021; R Core Team, 2022) were used to evaluate the effect of heat stress on three separate response variables: Brood, honey and nectar, and pollen. Since comb storage across a colony tends to be symmetrical (Seeley and Morse, 1976), comb sections were grouped based on their distance, in half frames, from the center of the hive. Each side of a frame counted as a half integer, so distance ranged from 0 to 3.5 frames from the center. To ensure our hives were symmetrical, the side of the hive each frame was taken from was included as a predictor variable in our models. To account for the large number of zeros in our data, we used zero inflated models in our analysis (Yang et al., 2017).
To determine the effect of heat stress on comb phenotype, models were created for all three response variables for each week. Models used the interaction between distance from center of the hive and treatment as predictor variables, side as a predictor variable, colony as a random effect, and distance from center of the hive as a zero inflated effect. The most complex model was competed against all nested models using the Akaike information criterion (AIC). The model with the lowest AIC was selected as the best fit model for each week and response variable.
Generalized linear models were created in R using the base “stats” package (R Core Team, 2022) to evaluate the effect treatment had on internal hive temperature. Separate models were created for both the point readings taken during the experimental season, and the treatment validation performed after the end of the field season on empty hives. To determine the effect of treatment on hive temperature gradients during the field season, a model using temperature as the response variable, and the interaction between treatment and distance from the center of the hive as response variables was used for both response variables. These models were tested against all nested models using AIC, with the best model reported below.
In week 0 there was significantly more brood in heated colonies (χ2 = 6, p < 0.05) despite efforts to visually balance hives between treatment groups. There was no difference in brood quantity between treatments in week 3 (χ2 = 0.02, p = 0.87) or week 6 (χ2 = 0.67, p = 0.41) (Figure 2). Brood quantity was not affected by distance from the center of the hive within the hive in week 0 (χ2 = 2, p = 0.12), but was stored more densely in the center of hives of both treatments in week 3 (χ2 = 22, p < 0.0001), and week 6 (χ2 = 30, p < 0.00001) (Figure 3). This was expected given that honey bee colonies tend rear brood in the center of the colony (Seeley and Morse, 1976). Finally, brood quantity was not affected by the interaction between treatment and distance from the center of the hive in either week 0 (χ2 = 0.6, p = 0.42), or week 3 (χ2 = 0.1, p = 0.71), but was significantly affected by this interaction in week 6 (χ2 = 5, p < 0.05). This indicates differences in brood comb phenotype between heated and unheated colonies arise sometime between weeks 3 and 6, with the brood comb in heated hives being less densely clustered in the center than in control hives. This timeframe aligns well with natural brood development, which takes around 3 weeks (Winston, 1987). Side was never included in the winning model for brood quantity, indicating brood comb was symmetric across the hive at all timepoints in the study.
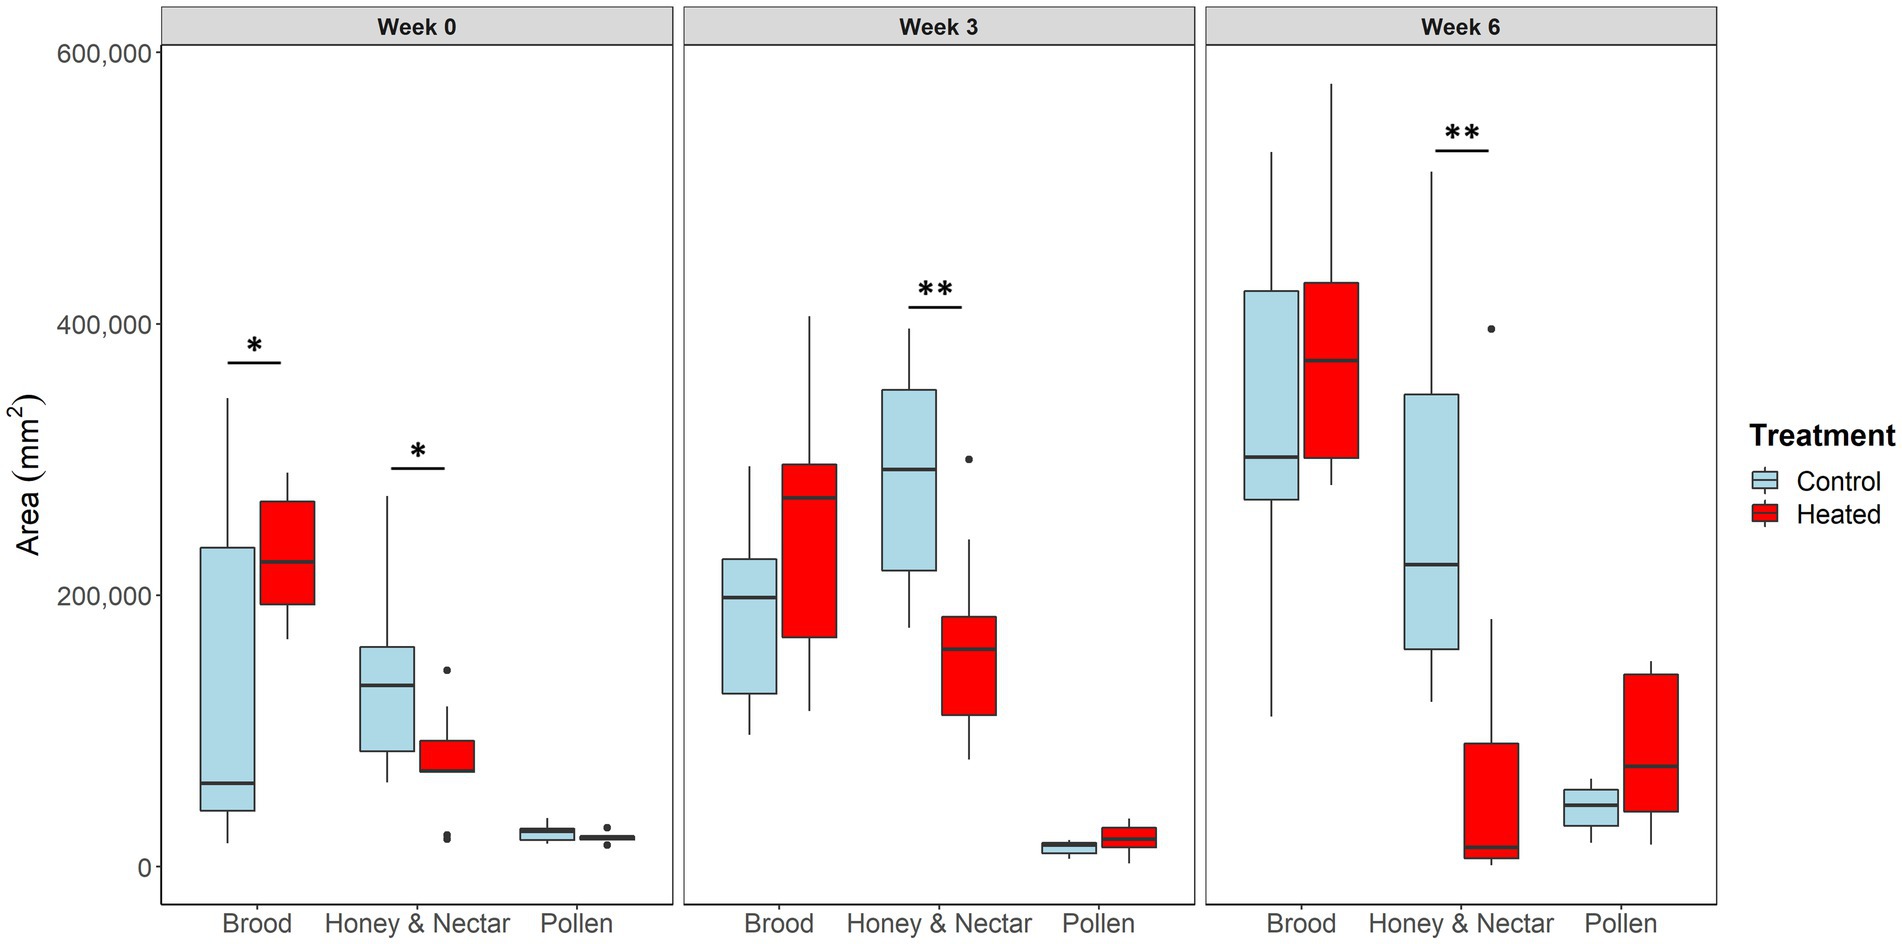
Figure 2. Box and whisker plot showing the average total area in mm2 of brood, honey, and nectar, and pollen in heated (red) and control (blue) hives (N = 7 control and 9 heated colonies) in weeks 0, 3, and 6 of the study. *p < 0.05; **p < 0.001.
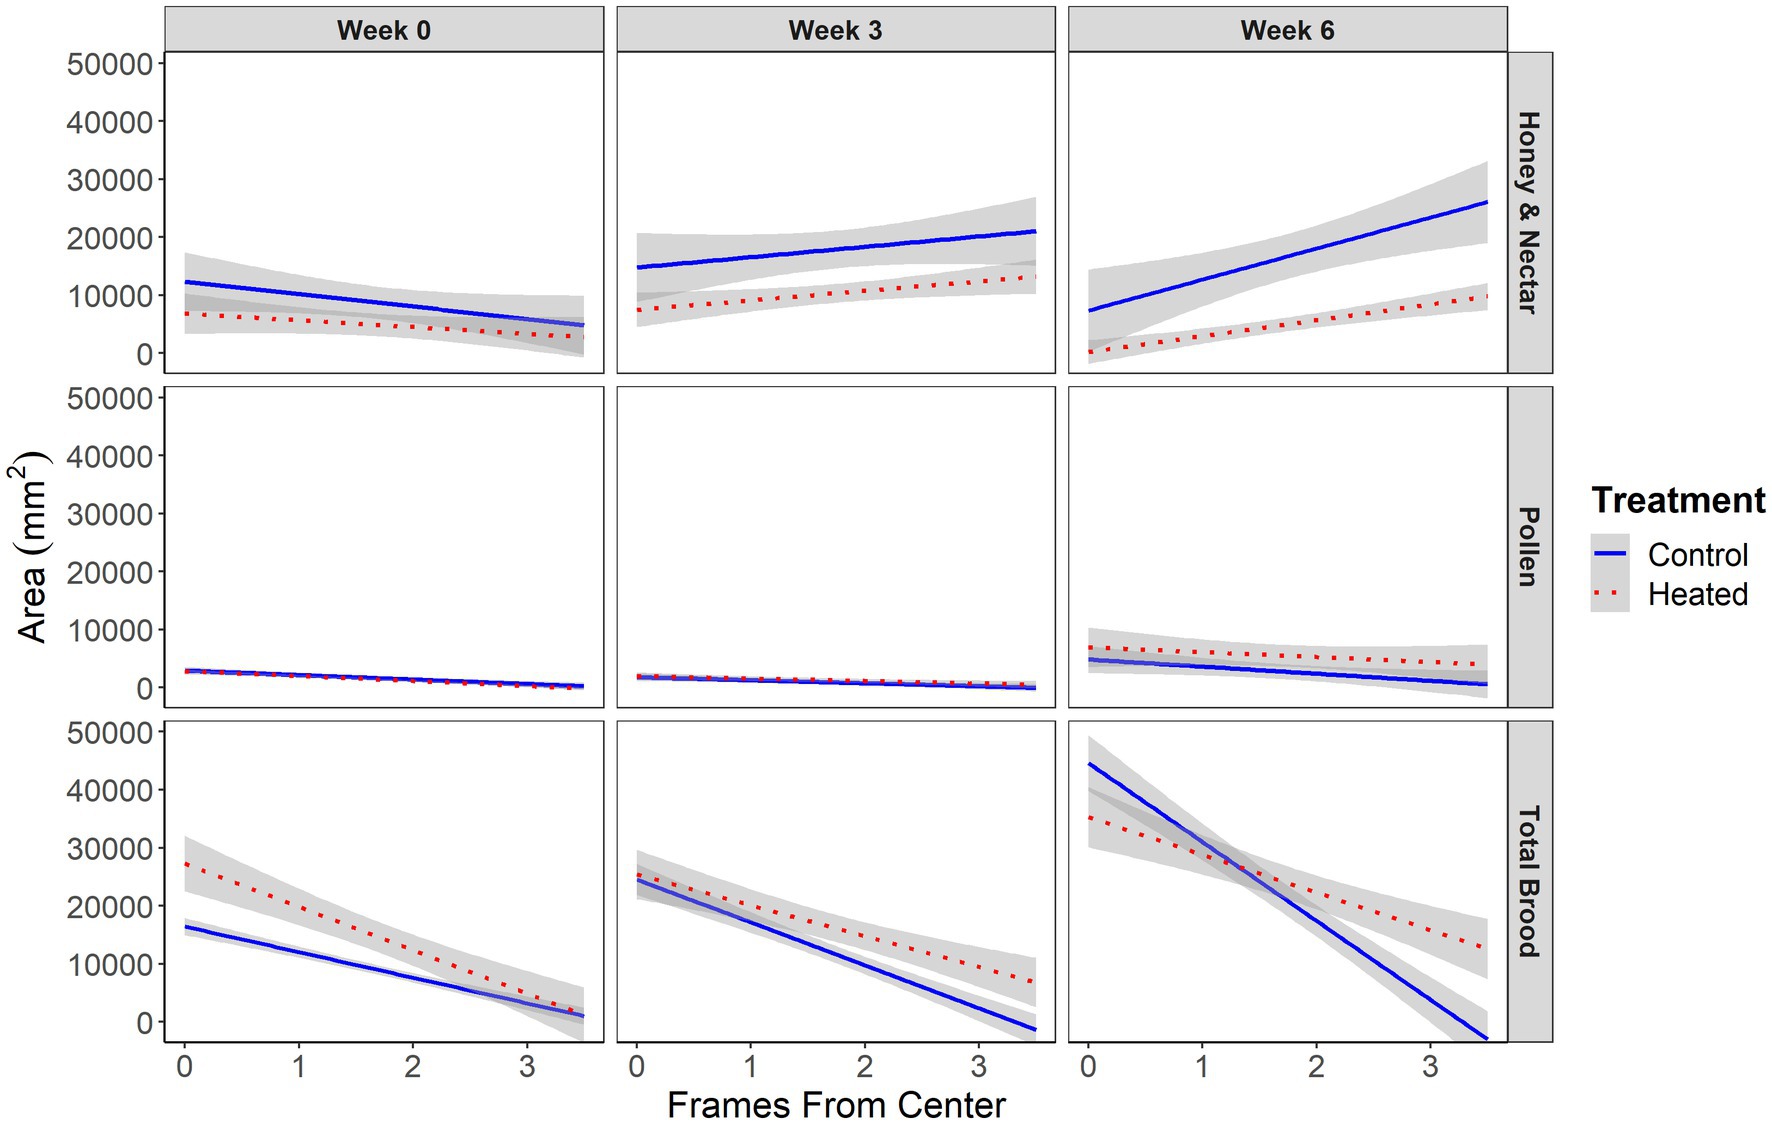
Figure 3. Total area in mm2 of total honey and nectar (top), pollen (middle), and brood (bottom) in control (blue, solid) and heated (red, dashed) honey bee colonies (N = 7 control and 9 heated colonies). X axis represents the distance from the center of the hive in frames. Each frame is approximately 38 mm wide. Vertical facets represent the week of the study measurements were taken. Gray outlines show standard error. Honey and nectar were located significantly closer to the periphery of the hive in both treatments during weeks 0 (χ2 = 13, p < 0.001), 3 (χ2 = 49, p < 0.00001), and 6 (χ2 = 136, p < 0.00001). Brood was stored closer to the periphery of hives in both treatments in week 3 (χ2 = 22, p < 0.0001), and 6 (χ2 = 30, p < 0.00001). Brood comb phenotype significantly differed between treatments in week 6 (χ2 = 5, p < 0.05), with brood comb more densely clustered in the center of control hives. Pollen storage did not differ between treatments at any point in the study.
There was significantly more honey and nectar in unheated colonies during weeks 0 (χ2 = 6, p < 0.05), 3 (χ2 = 11, p < 0.001), and 6 (χ2 = 8, p < 0.001) (Figure 2) of our study. Initial differences occurred despite attempts to visually balance treatment groups, however the differences between treatments continued to increase throughout the study, even as brood quantity converged, indicating starting differences alone were likely not responsible for differences at the end of the study. Honey and nectar were stored significantly closer to the hive periphery in weeks 0 (χ2 = 13, p < 0.001), 3 (χ2 = 49, p < 0.00001), and 6 (χ2 = 136, p < 0.00001) (Figure 3) which was expected (Seeley and Morse, 1976). Honey and nectar quantity was not affected by the interaction between treatment and distance from the center of the hive in weeks 0 (χ2 = 0.8, p = 0.369), 3 (χ2 = 0.3, p = 0.55), or 6 (χ2 = 42, p < 0.51), indicating honey and nectar phenotype was similar not different between treatments throughout the study. Side did have a significant effect on honey and nectar storage during week 0 (χ2 = 9, p = 0.01), indicating that carbohydrate storage was not symmetric across the hive at the beginning of the study. Side was not included in winning models in either 6, indicating carbohydrate storage did become symmetric as the study continued.
There was no difference in pollen quantity in weeks 0 (χ2 = 0.56, p = 0.45), 3 (χ2 = 0.16, p = 0.68), or 6 (χ2 = 2.4, p = 0.11) of the study. Pollen was stored closer to the center of the hive in weeks 0 (χ2 = 5.7, p < 0.05), and 3 (χ2 = 11, p < 0.001), but was not affected by hive location in week 6 (χ2 = 2.5, p = 0.098). Finally, the interaction between treatment and location was not significant in weeks 0 (χ2 = 0.11, p = 0.73), 3 (χ2 = 1.9, p = 0.016) or 6 (χ2 = 0.74, p = 0.38). Pollen storage was significantly affected by side in week 3 of the study (χ2 = 8.5, p < 0.01), indicating pollen storage was not symmetric across the hive. Side was not included in winning models in either week 0 or week 6, indicating pollen storage was symmetric across the hive at these timepoints.
Temperature gradient within the hive was not significantly predicted by treatment (χ2 = 3, p = 0.08) or distance from the center of the hive (χ2 = 0.09, p = 0.76) but was significantly predicted by the interaction of treatment and distance from the center of the hive (χ2 = 12, p < 0.001) (Figure 1). This indicates that bees were able to keep the temperature relatively stable within their hives, except on the very edges which were significantly hotter in heated colonies.
We found that after 6 weeks of treatment, brood comb became less clustered in the center of hives exposed to chronic heat stress (Figure 3) but overall brood quantity did not differ in overall quantity between treatments (Figure 2). These results support the hypothesis that honey bee comb phenotype is affected by chronic hive-wide heat stress, but are the opposite of our expectation that chronic heat stress would cause the brood cluster to become concentrated more tightly in the center of the hive, which would necessitate the thermoregulation of a smaller hive section. We also found that, while heated colonies began with smaller stores of honey and nectar, this difference consistently widened throughout the study (Figure 3), indicating that heated colonies were less able to build up carbohydrate reserves than unheated colonies (Figure 2). This likely indicates that hives exposed to chronic heat stress had higher energy requirements, and thus needed to consume more honey and nectar.
Our expectation was that in response to heat stress, brood would become more centrally clustered in order to improve the insulation provided by honey and nectar. Instead, we found brood comb became significantly less clustered and spread more toward the hive periphery (Figure 3). These results suggest that it may be the coldest temperatures colonies experience, not the hottest, which drive brood comb phenotype. Since honey bees possess effective diffuse cooling behaviors (Heinrich, 1979; Kronenberg and Heller, 1982; Peters et al., 2019), experimentally heated colonies were able to maintain a stable temperature throughout most of the hive during the day and prevent widespread brood death (Figure 1). However, all warming behaviors are localized and require endothermic heat transfer through direct contact (Simpson, 1961; Kronenberg and Heller, 1982; Watmough and Camazine, 1995). This means the ability of bees to keep their brood warm at night is likely a limiting factor for overall brood comb area. The minimum size of the nightly warming cluster, which gets smaller as ambient temperatures decrease (Simpson, 1961), is likely the maximum possible size of the brood cluster. This could explain why heated colonies, which were exposed to increased night time temperatures, had an increased amount of brood closer to the hive periphery. We found no significant difference in brood quantity between treatment groups, which indicates that heat did not affect rate of ovipositing, and that differences in brood quantity between treatment groups were not driving our results.
After 6 weeks, hives exposed to chronic heat stress contained significantly fewer carbohydrate stores than control hives, even after accounting for initial differences in carbohydrate quantity (Figure 2). It is likely that this decrease in carbohydrate stores is a direct result of an increased level of active thermoregulatory behaviors, like fanning, used by the bees to keep heated hives cool. These behaviors are energetically expensive (Peters et al., 2017) and increase the amount of honey and nectar a colony needs to eat in order to maintain temperature homeostasis, which would directly reduce carbohydrate store quantity. It is also possible that more workers were recruited to thermoregulate, leaving fewer available to forage for nectar (Ostwald et al., 2016), which would have resulted in fewer carbohydrate stores entering the colony. Finally, it is possible that a lack of honey and nectar stores contributed to the more diffuse layout of the brood comb, since areas typically occupied by honey and nectar became vacant, allowing space for the queen to oviposit. We believe it unlikely, however, that lack of carbohydrate stores alone would result in a more diffuse brood comb, since brood would still freeze to death in the hive periphery if left outside of the warming cluster. Interestingly, there was no difference in pollen quantity between treatments throughout the study. Since pollen is primarily used as a protein source to facilitate the growth of brood (Winston, 1987), lack of differences in pollen storage between treatments can be seen as a further indicator that brood rearing effort did not differ between treatments.
The most striking result of this study is the apparent tradeoff honey bee colonies make regarding brood survival and carbohydrate storage in response to chronic heat stress. Exposure to chronic heat did not affect brood quantity, but did significantly decrease the quantity of honey and nectar stored in the hive. This implies that in response to extreme temperatures, honey bees do not decrease investment in brood rearing and therefore must increase the energetic investment required to actively thermoregulate their brood. High summer temperatures have been found to increase winter mortality of honey bee colonies (Schweiger et al., 2010; Switanek et al., 2017; Calovi et al., 2021), and the tradeoff presented here may offer a mechanism that explains this occurrence. Decreases in carbohydrate stores likely result in decreased winter reservoirs, and therefore decreased winter survival for colonies exposed to chronic heat stress during the summer. Interestingly, this tradeoff may not be as detrimental for honey bee colonies kept at lower latitudes, where year round forage is more likely to be available. In these locations, colonies would be able to manage high temperatures without reducing the size of their brood comb, while not being as detrimentally affected by low quantities of carbohydrate stores. These results may, therefore, be seen as a positive for honey bee colonies kept in the tropics, or other areas where nectar can be collected year round.
This study suggests multiple avenues for future research, namely experiments that further elucidate the mechanism by which comb rearrangement is induced, and experiments that determine the physiological consequences of comb rearrangement on individual bees. Mechanistically, it would be interesting to test the hypothesis that the coolest temperatures a hive experiences determines the degree to which brood comb is clustered. This could be done by decreasing internal hive temperatures during the coldest parts of the night. If brood comb were affected primarily by the thermal minimum, we would expect cooled colonies to have a more clustered brood comb than control colonies. Physiologically, it would be interesting to determine if bees in colonies with a less clustered brood comb are more susceptible to defects associated with abnormal rearing temperatures. Brood reared on the outer edges the brood cluster likely have their temperature less well regulated and are therefore more susceptible to temperature fluctuations. This should be exacerbated in colonies with less clustered brood comb, since the heating cluster will likely encase less brood. Since even a single night below 20°C can seriously impact brood development (Wang et al., 2016) it is likely that abnormal comb phenotype would increase susceptibility to cold stress and therefore result in more abnormal adults. Finally, it would be valuable to determine the mechanism by which heated colonies were unable to build robust carbohydrate stores. Active measurements of colony energetic expenditure could confirm heated colonies had higher energetic expense and therefore consumed more honey and nectar. Additionally, measuring foraging effort by colonies could determine whether heated colonies were simply collecting less nectar resources as more bees were engaged in active thermoregulation.
As the climate crisis continues, studies that record the natural suite of behaviors animals use in response to environmental stressors are invaluable for developing effective conservation strategies. We found that while chronic heat stress may not reduce overall brood quantity, it does result in alterations to brood arrangement within the colony. Additionally, chronic heat stress results in a significant decrease in carbohydrate reserves, which likely negatively impacts winter survival. Our findings indicate that ensuring colonies have access to rich sources of carbohydrates may be particularly important during periods of abnormal heat. Studies that investigate the behavioral response of honey bees to heat will allow for the implementation of new effective management strategies as we attempt to prevent honey bee declines and ensure the services they provide to our food systems.
The raw data supporting the conclusions of this article will be made available by the authors, without undue reservation.
IW was the primary contributor to manuscript preparation and data analysis, and was a contributor to experimental design and data collection. JW contributed to the manuscript preparation, data collection, and data analysis. EK, AK, RG, and JZ were contributors to data collection and data analysis. PS contributed to the experimental design and manuscript preparation. All authors contributed to the article and approved the submitted version.
This work was supported by the National Science Foundation Research Experience for Undergraduates (NSF DBI 1852438).
The authors would also like to thank Jessie Thuma, Helen McCrery, and Angelle Antoun for help in editing early versions of this manuscript.
The authors declare that the research was conducted in the absence of any commercial or financial relationships that could be construed as a potential conflict of interest.
All claims expressed in this article are solely those of the authors and do not necessarily represent those of their affiliated organizations, or those of the publisher, the editors and the reviewers. Any product that may be evaluated in this article, or claim that may be made by its manufacturer, is not guaranteed or endorsed by the publisher.
The Supplementary material for this article can be found online at: https://www.frontiersin.org/articles/10.3389/fevo.2023.1119452/full#supplementary-material
Supplementary Figure 1 | Total change in area in mm2 of total honey and nectar (top), pollen (middle), and brood (bottom) in control (blue, solid) and heated (red, dashed) honey bee colonies (N = 7 control and 9 heated colonies). X axis represents the distance from the center of the hive in frames. The left column represents change in area between weeks 0 and 3, and the right column represents change in area between weeks 3 and 6.
Supplementary Figure 2 | Box and whisker plots displaying total area of brood, honey and nectar, and pollen in the left (green) and right (orange) side of hives in weeks 0, 3, and 6 of the study. *P < 0.01.
Becher, M. A., Scharpenberg, H., and Moritz, R. F. A. (2009). Pupal developmental temperature and behavioral specialization of honeybee workers (Apis mellifera L.). J. Comp. Physiol. A. 195, 673–679. doi: 10.1007/s00359-009-0442-7
Bonoan, R. E., Iglesias Feliciano, P. M., Chang, J., and Starks, P. T. (2020). Social benefits require a community: the influence of colony size on behavioral immunity in honey bees. Apidologie 51, 701–709. doi: 10.1007/s13592-020-00754-5
Bonoan, R., Goldman, R., RWong, P., and TStarks, P. (2014). Vasculature of the hive: heat dissipation in the honey bee (Apis mellifera) hive. Naturwissenschaften 101, 459–465. doi: 10.1007/s00114-014-1174-2
Bujok, B., Kleinhenz, M., Fuchs, S., and Tautz, J. (2002). Hot spots in the bee hive. Naturwissenschaften 89, 299–301. doi: 10.1007/s00114-002-0338-7
Calderone, N. W. (2012). Insect pollinated crops, insect pollinators and US agriculture: trend analysis of aggregate data for the period 1992–2009. PLoS One 7:e37235. doi: 10.1371/journal.pone.0037235
Calovi, M., Grozinger, C. M., Miller, D. A., and Goslee, S. C. (2021). Summer weather conditions influence winter survival of honey bees (Apis mellifera) in the northeastern United States. Sci. Rep. 11:1553. doi: 10.1038/s41598-021-81051-8
Camazine, S. (1991). Self-organizing pattern formation on the combs of honey bee colonies. Behav. Ecol. Sociobiol. 28, 61–76.
Camazine, S., Sneyd, J., Jenkins, M. J., and Murray, J. D. (1990). A mathematical model of self-organized pattern formation on the combs of honeybee colonies. J. Theor. Biol. 147, 553–571. doi: 10.1016/S0022-5193(05)80264-4
Campbell, J., Kessler, B., Mayack, C., and Naug, D. (2010). Behavioural fever in infected honeybees: parasitic manipulation or coincidental benefit? Parasitology 137, 1487–1491. doi: 10.1017/S0031182010000235
Chacon-Almeida, V. M. L., Soares, A. E. E., and Malheiros, E. B. (1999). Induction of the Split sting trait in Africanized Apis mellifera (Hymenoptera: Apidae) by cold treatment of pupae. Ann. Entomol. Soc. Am. 92, 549–555. doi: 10.1093/aesa/92.4.549
Coelho, J. (1991). Heat transfer and body temperature in honey bee (Hymenoptera: Apidae) drones and workers. Environ. Entomol. 20, 1627–1635. doi: 10.1093/ee/20.6.1627
Cook, C. N., and Breed, M. D. (2013). Social context influences the initiation and threshold of thermoregulatory behaviour in honeybees. Anim. Behav. 86, 323–329. doi: 10.1016/j.anbehav.2013.05.021
Cook, C. N., Kaspar, R. E., Flaxman, S. M., and Breed, M. D. (2016). Rapidly changing environment modulates the thermoregulatory fanning response in honeybee groups. Anim. Behav. 115, 237–243. doi: 10.1016/j.anbehav.2016.03.014
Dainat, B., Dietemann, V., Imdorf, A., and Charrière, J.-D. (2020). A scientific note on the ‘Liebefeld method’ to estimate honey bee colony strength: its history, use, and translation. Apidologie 51, 422–427. doi: 10.1007/s13592-019-00728-2
Fukuda, H., and Sakagami, S. F. (1968). Worker brood survival in honeybees. Popul. Ecol. 10, 31–39. doi: 10.1007/BF02514731
Gallai, N., Salles, J.-M., Settele, J., and Vaissière, B. E. (2009). Economic valuation of the vulnerability of world agriculture confronted with pollinator decline. Ecol. Econ. 68, 810–821. doi: 10.1016/j.ecolecon.2008.06.014
Gonzalez, V. H., Oyen, K., Ávila, O., and Ospina, R. (2022). Thermal limits of Africanized honey bees are influenced by temperature ramping rate but not by other experimental conditions. J. Therm. Biol. 110:103369. doi: 10.1016/j.jtherbio.2022.103369
Goulson, D., Nicholls, E., Botías, C., and Rotheray, E. L. (2015). Bee declines driven by combined stress from parasites, pesticides, and lack of flowers. Science 347:1255957. doi: 10.1126/science.1255957
Graham, S., Myerscough, M. R., Jones, J. C., and Oldroyd, B. P. (2006). Modelling the role of intracolonial genetic diversity on regulation of brood temperature in honey bee (Apis mellifera L.) colonies. Insect. Soc. 53, 226–232. doi: 10.1007/s00040-005-0862-5
Gregorc, A. (2020). Monitoring of honey bee Colony losses: a special issue. Diversity 12:403. doi: 10.3390/d12100403
Groh, C., Tautz, J., and Rössler, W. (2004). Synaptic organization in the adult honey bee brain is influenced by brood-temperature control during pupal development. Proc. Natl. Acad. Sci. U. S. A. 101, 4268–4273. doi: 10.1073/pnas.0400773101
Harbo, J. R. (2000). Heating adult honey bees to remove Varroa Jacobsoni. J. Apic. Res. 39, 181–182. doi: 10.1080/00218839.2000.11101041
Heinrich, B. (1979). Keeping a cool head: honeybee thermoregulation. Science 205, 1269–1271. doi: 10.1126/science.205.4412.1269
Heinrich, B. (1980). Mechanisms of body-temperature regulation in honeybees, Apis mellifera I. regulation of head temperature. J. Exp. Biol. 85, 61–72. doi: 10.1242/jeb.85.1.61
Heinrich, B. (1981). The regulation of temperature in the honeybee swarm. Sci. Am. 244, 146–160. doi: 10.1038/scientificamerican0681-146
Himmer, A. (1932). Die Temperaturverhältnisse bei den sozialen Hymenopteren. Biol. Rev. 7, 224–253. doi: 10.1111/j.1469-185X.1962.tb01042.x
Hoppe, H., and Ritter, W. (1987). Experiments using combined heat therapy to control Varroa disease. Apidologie 18, 383–385.
Hou, C. S., Li, B. B., Deng, S., and Diao, Q. Y. (2016). Effects of Varroa destructor on temperature and humidity conditions and expression of energy metabolism genes in infested honeybee colonies. Genet. Mol. Res. 15:gmr8997. doi: 10.4238/gmr.15038997
Hristov, P., Shumkova, R., Palova, N., and Neov, B. (2020). Factors associated with honey bee colony losses: a mini-review. Vet. Sci. 7:166. doi: 10.3390/vetsci7040166
Hung, K.-L. J., Kingston, J. M., Albrecht, M., Holway, D. A., and Kohn, J. R. (2018). The worldwide importance of honey bees as pollinators in natural habitats. Proc. R. Soc. B Biol. Sci. 285:20172140. doi: 10.1098/rspb.2017.2140
Imdorf, A., Buehlmann, G., Gerig, L., Kilchenmann, V., and Wille, H. (1987). Überprufung der schatzmethode zur ermittlung der brutflache und der anzhal arbeiterinnen in freifliegenden bienenvolkern. Apidologie 18, 137–146. doi: 10.1051/apido:19870204
Jones, J. C., Helliwell, P., Beekman, M., Maleszka, R., and Oldroyd, B. P. (2005). The effects of rearing temperature on developmental stability and learning and memory in the honey bee, Apis mellifera. J. Comp. Physiol. A. 191, 1121–1129. doi: 10.1007/s00359-005-0035-z
Jones, J. C., Myerscough, M. R., Graham, S., and Oldroyd, B. P. (2004). Honey bee nest thermoregulation: diversity promotes stability. Science 305, 402–404. doi: 10.1126/science.1096340
Jones, J., and Oldroyd, B. (2006). Nest thermoregulation in social insects. Adv. Insect Physiol. 33, 153–191. doi: 10.1016/S0065-2806(06)33003-2
Kaspar, R. E., Cook, C. N., and Breed, M. D. (2018). Experienced individuals influence the thermoregulatory fanning behaviour in honey bee colonies. Anim. Behav. 142, 69–76. doi: 10.1016/j.anbehav.2018.06.004
Kleinhenz, M., Bujok, B., Fuchs, S., and Tautz, J. (2003). Hot bees in empty broodnest cells: heating from within. J. Exp. Biol. 206, 4217–4231. doi: 10.1242/jeb.00680
Kronenberg, F., and Heller, H. C. (1982). Colonial thermoregulation in honey bees (Apis mellifera). J. Comp. Physiol. B. 148, 65–76. doi: 10.1007/BF00688889
Le Conte, Y., Arnold, G., and Desenfant, P. (1990). Influence of brood temperature and hygrometry variations on the development of the honey bee ectoparasite Varroa jacobsoni (Mesostigmata: Varroidae). Environ. Entomol. 19, 1780–1785. doi: 10.1093/ee/19.6.1780
Lin, H., and Winston, M. L. (1998). The role of nutrition and temperature in the ovarian development of the worker honey bee (Apis mellifera). Can. Entomol. 130, 883–891. doi: 10.4039/Ent130883-6
Magnusson, A., Skaug, H., Nielsen, A., Berg, C., Kristensen, K., Maechler, M., et al. (2021). glmm TMB: generalized linear mixed models using template model builder (1.1.2.3). Available at: https://CRAN.R-project.org/package=glmmTMB
Marx, W., Haunschild, R., and Bornmann, L. (2021). Heat waves: a hot topic in climate change research. Theor. Appl. Climatol. 146, 781–800. doi: 10.1007/s00704-021-03758-y
Medina, R. G., Paxton, R. J., De Luna, E., Fleites-Ayil, F. A., Medina Medina, L. A., and Quezada-Euán, J. J. G. (2018). Developmental stability, age at onset of foraging and longevity of Africanized honey bees (Apis mellifera L.) under heat stress (Hymenoptera: Apidae). J. Therm. Biol. 74, 214–225. doi: 10.1016/j.jtherbio.2018.04.003
Montovan, K. J., Karst, N., Jones, L. E., and Seeley, T. D. (2013). Local behavioral rules sustain the cell allocation pattern in the combs of honey bee colonies (Apis mellifera). J. Theor. Biol. 336, 75–86. doi: 10.1016/j.jtbi.2013.07.010
Ostwald, M. M., Smith, M. L., and Seeley, T. D. (2016). The behavioral regulation of thirst, water collection and water storage in honey bee colonies. J. Exp. Biol. 219, 2156–2165. doi: 10.1242/jeb.139824
Panziera, D., Requier, F., Chantawannakul, P., Pirk, C. W. W., and Blacquière, T. (2022). The diversity decline in wild and managed honey bee populations urges for an integrated conservation approach. Front. Ecol. Evol. 10:767950. doi: 10.3389/fevo.2022.767950
Perez, R., and Aron, S. (2020). Adaptations to thermal stress in social insects: recent advances and future directions. Biol. Rev. 95, 1535–1553. doi: 10.1111/brv.12628
Peters, J. M., Gravish, N., and Combes, S. A. (2017). Wings as impellers: honey bees co-opt flight system to induce nest ventilation and disperse pheromones. J. Exp. Biol. 220, 2203–2209. doi: 10.1242/jeb.149476
Peters, J. M., Peleg, O., and Mahadevan, L. (2019). Collective ventilation in honeybee nests. J. R. Soc. Interface 16:20180561. doi: 10.1098/rsif.2018.0561
Petz, M., Stabentheiner, A., and Crailsheim, K. (2004). Respiration of individual honeybee larvae in relation to age and ambient temperature. J. Comp. Physiol. B 174, 511–518. doi: 10.1007/s00360-004-0439-z
Phillips, E. F., and Demuth, G. S. (1914). The temperature of the honeybee cluster in winter Washington, D.C: U.S. Department of Agriculture.
Potts, S. G., Biesmeijer, J. C., Kremen, C., Neumann, P., Schweiger, O., and Kunin, W. E. (2010). Global pollinator declines: trends, impacts and drivers. Trends Ecol. Evol. 25, 345–353. doi: 10.1016/j.tree.2010.01.007
R Core Team. (2022). R: a language and environment for statistical computing. Vienna, Austria: R Foundation for Statistical Computing. Available at: https://www.R-project.org/
Reilly, J. R., Artz, D. R., Biddinger, D., Bobiwash, K., Boyle, N. K., Brittain, C., et al. (2020). Crop production in the USA is frequently limited by a lack of pollinators. Proc. R. Soc. B Biol. Sci. 287:20200922. doi: 10.1098/rspb.2020.0922
Rosenkranz, P. (1987). Temperature treatment of sealed worker brood as a method of controlling varroatosis. Apidologie 18, 385–388.
Sánchez-Bayo, F., and Wyckhuys, K. A. G. (2019). Worldwide decline of the entomofauna: a review of its drivers. Biol. Conserv. 232, 8–27. doi: 10.1016/j.biocon.2019.01.020
Schindelin, J., Arganda-Carreras, I., Frise, E., Kaynig, V., Longair, M., Pietzsch, T., et al. (2012). Fiji: an open-source platform for biological-image analysis. Nat. Methods 9, 676–682. doi: 10.1038/nmeth.2019
Schweiger, O., Biesmeijer, J. C., Bommarco, R., Hickler, T., Hulme, P. E., Klotz, S., et al. (2010). Multiple stressors on biotic interactions: how climate change and alien species interact to affect pollination. Biol. Rev. 85, 777–795. doi: 10.1111/j.1469-185X.2010.00125.x
Seeley, T. D. (1974). Atmospheric carbon dioxide regulation in honey-bee (Apis mellifera) colonies. J. Insect Physiol. 20, 2301–2305. doi: 10.1016/0022-1910(74)90052-3
Seeley, T. D. (1985). Honeybee ecology: a study of adaptation in social life, New Jersey: Princeton University Press.
Seeley, T. D., and Morse, R. A. (1976). The nest of the honey bee (Apis mellifera L.). Insect. Soc. 23, 495–512. doi: 10.1007/BF02223477
Siegel, A. J., Hui, J., Johnson, R. N., and Starks, P. T. (2005). Honey bee workers as mobile insulating units. Insect. Soc. 52, 242–246. doi: 10.1007/s00040-005-0805-1
Simone-Finstrom, M., Foo, B., Tarpy, D. R., and Starks, P. T. (2014). Impact of food availability, pathogen exposure, and genetic diversity on thermoregulation in honey bees (Apis mellifera). J. Insect Behav. 27, 527–539. doi: 10.1007/s10905-014-9447-3
Southwick, E. E., and Moritz, R. F. A. (1987). Social control of air ventilation in colonies of honey bees, Apis mellifera. J. Insect Physiol. 33, 623–626. doi: 10.1016/0022-1910(87)90130-2
Stabentheiner, A., Kovac, H., and Brodschneider, R. (2010). Honeybee colony thermoregulation--regulatory mechanisms and contribution of individuals in dependence on age, location and thermal stress. PLoS One 5:e8967. doi: 10.1371/journal.pone.0008967
Stabentheiner, A., Kovac, H., Mandl, M., and Käfer, H. (2021). Coping with the cold and fighting the heat: thermal homeostasis of a superorganism, the honeybee colony. J. Comp. Physiol. A. 207, 337–351. doi: 10.1007/s00359-021-01464-8
Stabentheiner, A., Pressl, H., Papst, T., Hrassnigg, N., and Crailsheim, K. (2003). Endothermic heat production in honeybee winter clusters. J. Exp. Biol. 206, 353–358. doi: 10.1242/jeb.00082
Starks, P. T., Blackie, C. A., and Seeley, T. D. (2000). Fever in honeybee colonies. Naturwissenschaften 87, 229–231. doi: 10.1007/s001140050709
Starks, P. T., and Gilley, D. C. (1999). Heat shielding: a novel method of colonial thermoregulation in honey bees. Naturwissenschaften 86, 438–440. doi: 10.1007/s001140050648
Starks, P. T., Johnson, R. N., Siegel, A. J., and Decelle, M. M. (2005). Heat shielding: a task for youngsters. Behav. Ecol. 16, 128–132. doi: 10.1093/beheco/arh124
Switanek, M., Crailsheim, K., Truhetz, H., and Brodschneider, R. (2017). Modelling seasonal effects of temperature and precipitation on honey bee winter mortality in a temperate climate. Sci. Total Environ. 579, 1581–1587. doi: 10.1016/j.scitotenv.2016.11.178
Szentgyörgyi, H., Czekońska, K., and Tofilski, A. (2018). Honey bees are larger and live longer after developing at low temperature. J. Therm. Biol. 78, 219–226. doi: 10.1016/j.jtherbio.2018.09.007
Tautz, J., Maier, S., Groh, C., Rössler, W., and Brockmann, A. (2003). Behavioral performance in adult honey bees is influenced by the temperature experienced during their pupal development. Proc. Natl. Acad. Sci. U. S. A. 100, 7343–7347. doi: 10.1073/pnas.1232346100
Wang, Q., Xu, X., Zhu, X., Chen, L., Zhou, S., Huang, Z. Y., et al. (2016). Low-temperature stress during capped brood stage increases pupal mortality, misorientation and adult mortality in honey bees. PLoS One 11:e0154547. doi: 10.1371/journal.pone.0154547
Watmough, J., and Camazine, S. (1995). Self-organized thermoregulation of honeybee clusters. J. Theor. Biol. 176, 391–402. doi: 10.1006/jtbi.1995.0207
Weinberg, I. P., Kuttner, I. L., Tyminski, A. E., Kalfus, R. L., and Starks, P. T. (2022). Comb phenotype of Apis mellifera ligustica is altered after exposure to chronic-localized heat stress. Insect. Soc. 69, 177–183. doi: 10.1007/s00040-022-00858-4
Winston, M. L. (1987). The biology of the honey bee Cambridge, Massachusettes: Harvard University Press.
Wood, T. J., and Goulson, D. (2017). The environmental risks of neonicotinoid pesticides: a review of the evidence post 2013. Environ. Sci. Pollut. Res. 24, 17285–17325. doi: 10.1007/s11356-017-9240-x
Keywords: conservation behavior, honey bees, insect architecture, thermoregulation, climate change
Citation: Weinberg IP, Wetzel JP, Kuchar EP, Kaplan AT, Graham RS, Zuckerman JE and Starks PT (2023) The organizational impact of chronic heat: diffuse brood comb and decreased carbohydrate stores in honey bee colonies. Front. Ecol. Evol. 11:1119452. doi: 10.3389/fevo.2023.1119452
Edited by:
Neelendra K. Joshi, University of Arkansas, United StatesReviewed by:
David Tarpy, North Carolina State University, United StatesCopyright © 2023 Weinberg, Wetzel, Kuchar, Kaplan, Graham, Zuckerman and Starks. This is an open-access article distributed under the terms of the Creative Commons Attribution License (CC BY). The use, distribution or reproduction in other forums is permitted, provided the original author(s) and the copyright owner(s) are credited and that the original publication in this journal is cited, in accordance with accepted academic practice. No use, distribution or reproduction is permitted which does not comply with these terms.
*Correspondence: Isaac Weinberg, SXNhYWMuV2VpbmJlcmdAdHVmdHMuZWR1
†ORCID: Isaac P. Weinberg https://orcid.org/0000-0002-6572-8890
Disclaimer: All claims expressed in this article are solely those of the authors and do not necessarily represent those of their affiliated organizations, or those of the publisher, the editors and the reviewers. Any product that may be evaluated in this article or claim that may be made by its manufacturer is not guaranteed or endorsed by the publisher.
Research integrity at Frontiers
Learn more about the work of our research integrity team to safeguard the quality of each article we publish.