- 1State Key Laboratory of Ecological Pest Control for Fujian and Taiwan Crops, College of Plant Protection, Fujian Agriculture and Forestry University, Fuzhou, China
- 2Fujian Provincial Key Laboratory of Insect Ecology, Fujian Agriculture and Forestry University, Fuzhou, China
The biogeography field benefits more and more from the growth and application of genetic data such as nucleotide sequences and whole genomes. It has been perceived by scientists that genetic data may be imbalanced among different geographical regions and taxonomic groups. However, the lack of empirical evidence prevents the understanding of current data volume and distribution of genetic data. Based on the construction of a dataset including records for 365 millions of nucleotide sequences of Animalia, Plantae, and Fungi kingdoms, 6 millions of COI sequences of insects, 77 thousands of COI sequences of mammals, 220 thousands of rbcl sequences of Magnoliopsida, and 44 thousands of ITS sequences of Dothideomycetes, here we present evidence on geographical and taxonomical imbalance of the genetic data, identify major gaps and inappropriate practices in the production, application and sharing of genetic data. We then discuss our perspectives on how to fill up gaps and improve the quantity and quality of genetic data.
Introduction
As genetic variations present within species, genetic diversity is one of the most important components of biological diversity. The maintenance of genetic diversity makes it possible for species to adapt under environmental changes and positively affects ecosystem function and resilience. Genetic diversity and evolutionary process can be presented and analyzed by different kinds of genetic data such as sequences of genes and genomes. As the most widely used genetic data, sequence data can help identify species and infer the relationship among biological groups (Tautz et al., 2002; Hebert et al., 2003; Alamouti et al., 2011), and together with species distributions, can provide important information for quantifying the geographical distribution of genetic variation within and among species and the evolution process of current biodiversity patterns (Ma et al., 2012; Miraldo et al., 2016; Toczydlowski et al., 2021). Large scale geographic data analysis provides an effective way to understand the extensive impact of geographic, geological and climatic changes on species distribution (Guralnick and Hill, 2009; Pope et al., 2015; Pelletier et al., 2022). The integration of sequence and distribution data can help reveal mechanisms underlying species spatial patterns and the historical evolutionary processes (Avise, 2000, 2009), as well as determine conservation units (Guo et al., 2019).
The development of sequencing technology in past decades has promoted the accumulation of genetic data (Sanger et al., 1977), and with the rise of the second and third generation sequencing technologies, genome sequencing becomes cheaper, faster and more efficient (Mardis, 2008a,b; Rhoads and Au, 2015). A large number of living species have been sequenced and placed in the context of tree of life (Hedges et al., 2015; Hinchliff et al., 2015). Genetic data are being archived at an alarming rate in public databases (Toczydlowski et al., 2021). The GenBank,1 a comprehensive repository for genetic data (Benson et al., 2012), and the Barcode of Life Data System (BOLD)2 mainly archiving DNA barcode sequences of metazoans (Ratnasingham and Hebert, 2007), are two examples. As of October 2022, more than 2.4 billion sequences have been available for download in the GenBank database, and more than 12 million barcode sequences are available in the BOLD database. However, although it has been perceived by many scientists that genetic data may be imbalanced among different geographical regions and taxonomic groups, the investigation on current data volume and distribution of genetic data itself and its application is very limited. To reveal the current status and possible existing problems of genetic data, here we present results of a comprehensive analysis and identify major gaps and inappropriate practices in the production, application and sharing of genetic data, and discuss our perspectives on how to improve the quantity and quality of genetic data in the future.
Genetic data volume
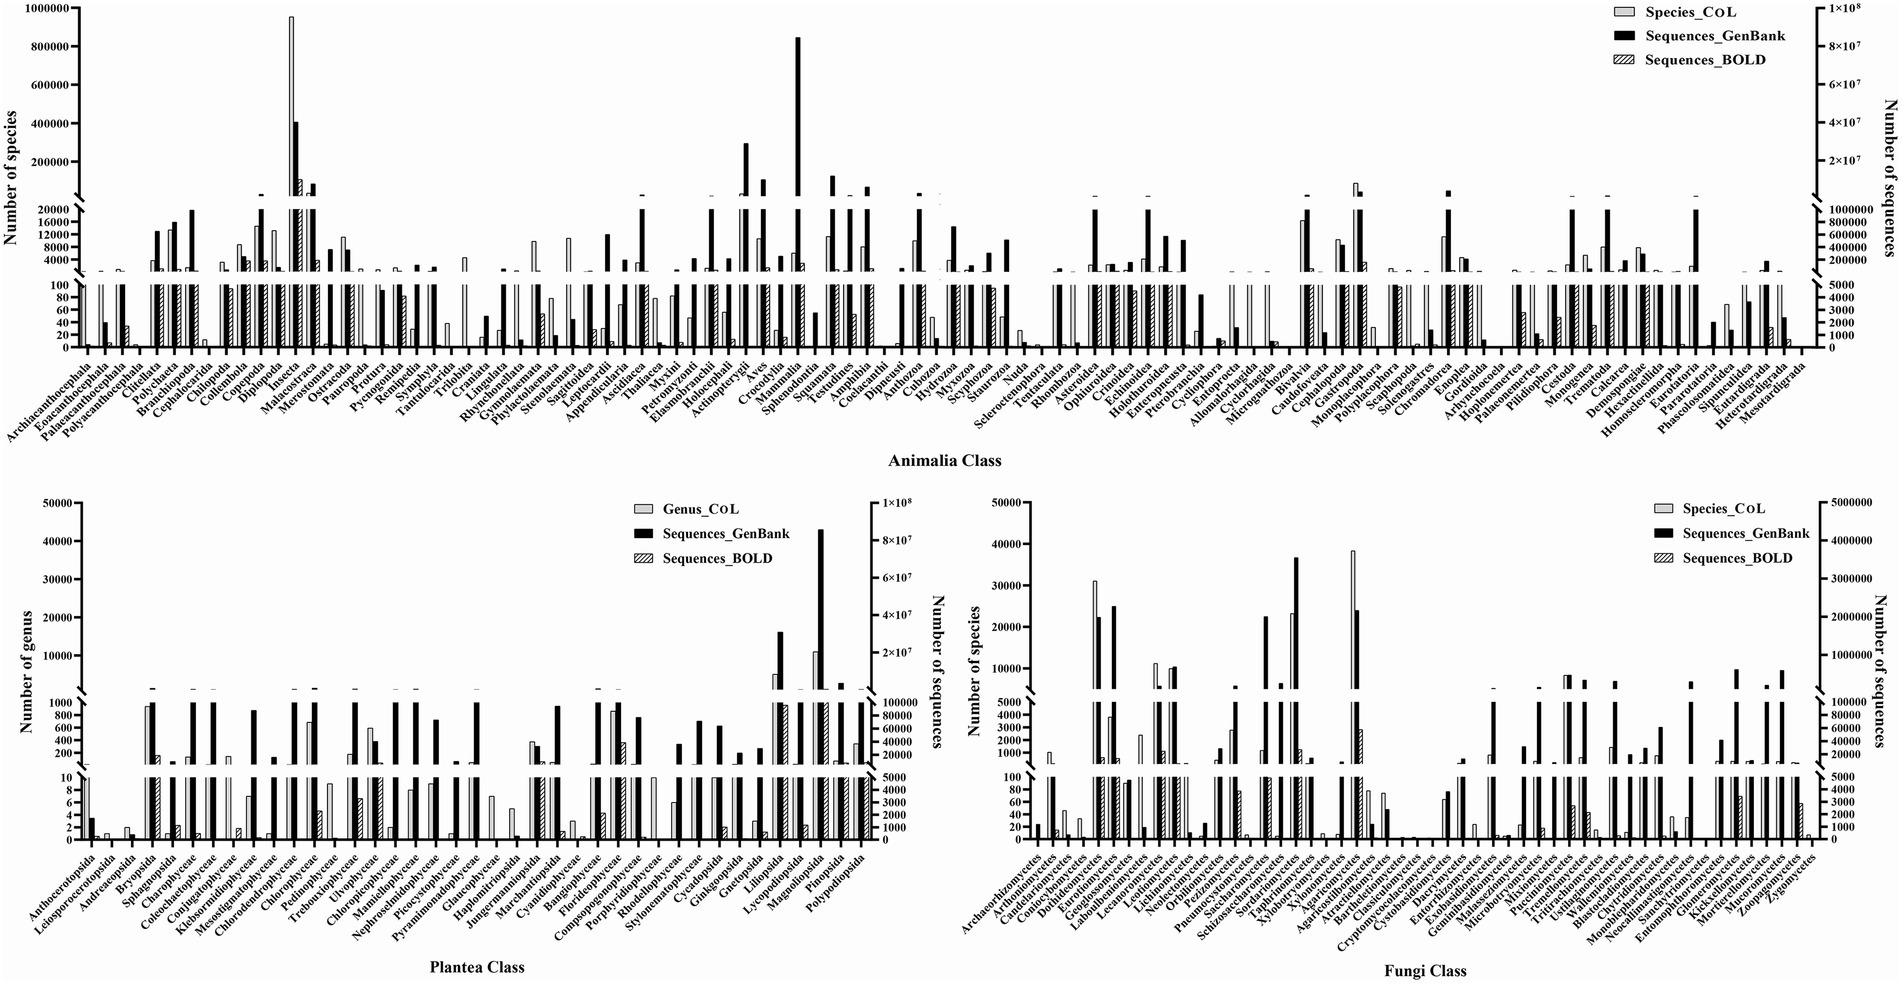
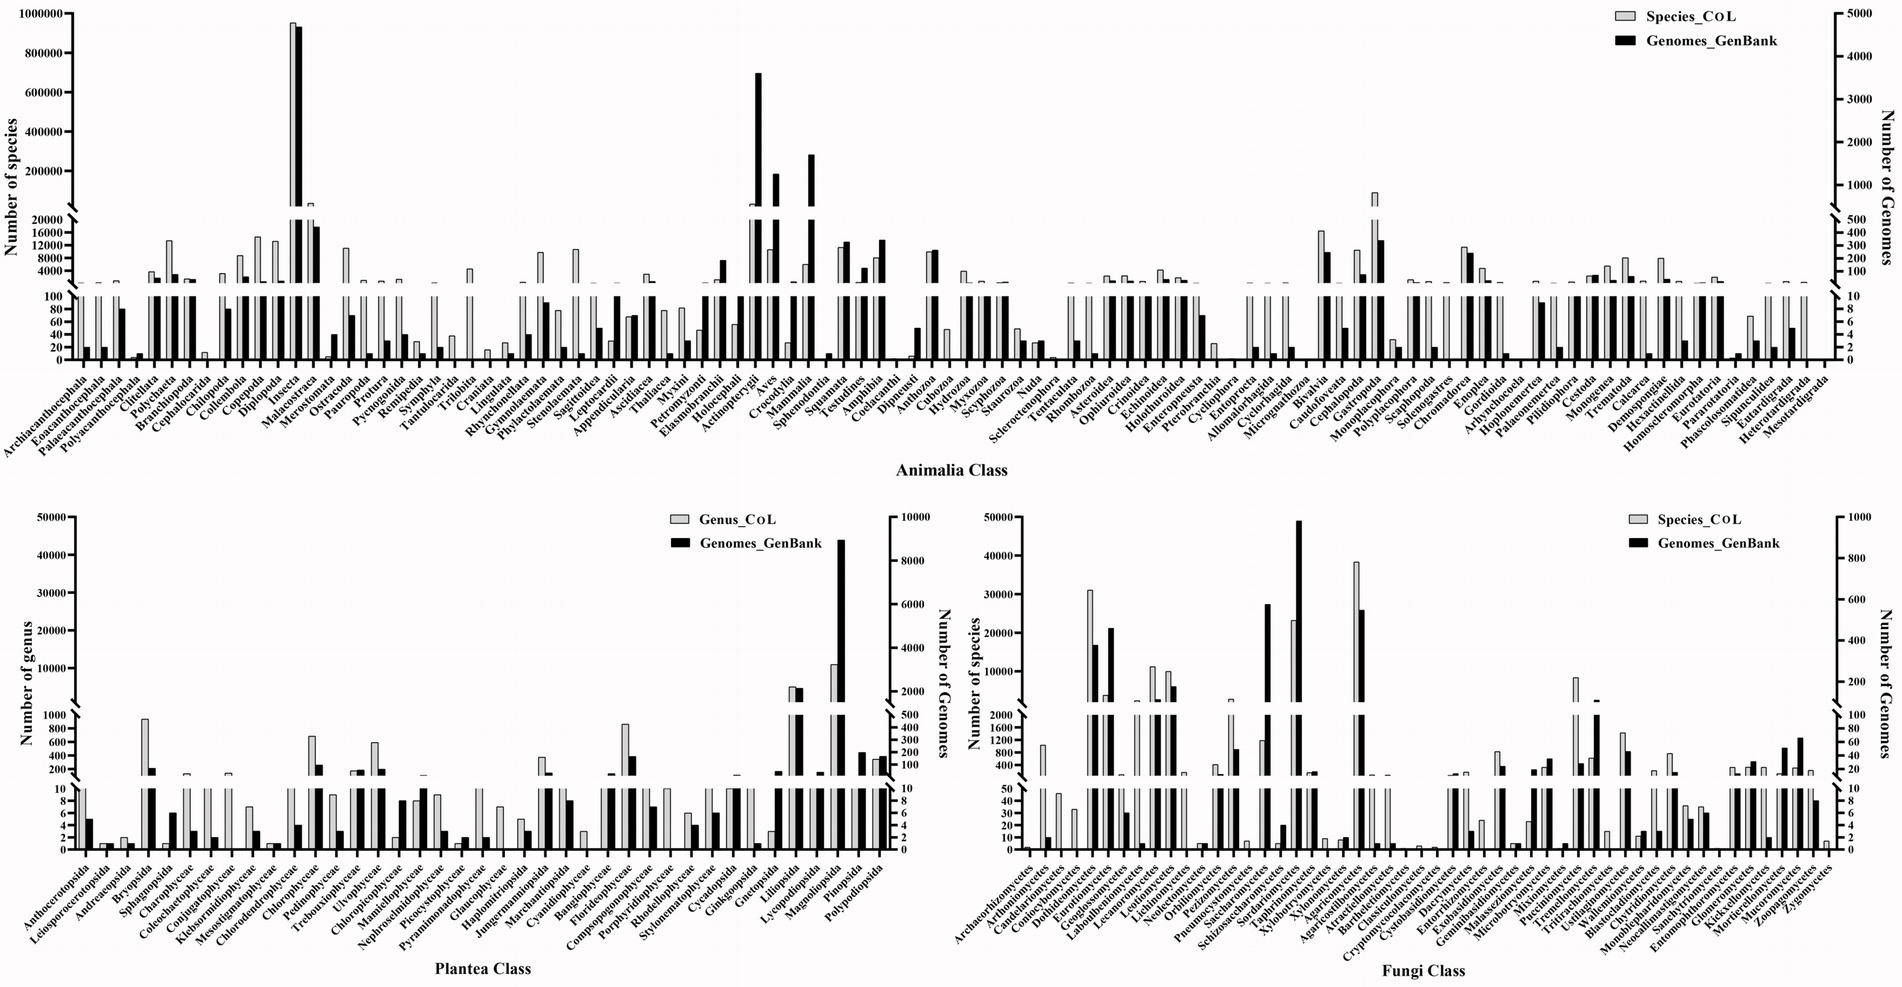
In order to explore the current data volume and distribution of genetic data of major biological groups in the public databases, we compiled statistics of the number of taxa (phylum, class, order, family, genus, and species) under the Animalia, Plantae, and Fungi based on the Catalog of Life database (CoL)3, and searched the amount of genetic data (gene and genome sequences) existing in the GenBank and BOLD databases (Table 1). The Animalia has the highest number of species and genetic data, followed by the Plantae and Fungi. Figure 1 shows the number of species/genus and gene sequences at the class level of the three major biological groups. In the Animalia, Insecta has the highest species richness, including 953,381 named species, accounting for 70.25% of the reported species in the Animalia. But its sequence data exhibits obvious difference between different databases. In the GenBank database, sequence data of Insecta only accounts for 17.94% (39,967,813) of that of the Animalia, while in the BOLD database, barcode sequences of Insecta account for 87.53% (9,810,338) of that of the Animalia. Although the species number of Mammalia only accounts for 0.44% (6,025) of the Animalia, this group has the highest amount of sequence data (84,446,193, 37.90%) in the GenBank. In the Plantae, Magnoliopsida has the highest numbers of genus (10,954) and sequences (85,734,539 in GenBank, 317,394 in BOLD), accounting for 53.14% (CoL), 68.25% (GenBank) and 61.19% (BOLD) of the total numbers of genus and sequences in the Plantae, respectively. In the Fungi, the classes with abundant species and sequence data include Dothideomycetes, Sordariomycetes, and Agaricomycetes. We then analyzed the data volume of whole genomes at the class level of different biological groups in the GenBank (Figure 2). In the Animalia, Insecta has the most genome data (4,691, 31.66%), while Mammalia has only 1,708 genomes (11.53%), which may be due to the small number of Mammalian species. In the Plantae, Magnoliopsida has the highest number of genomes (8,939, 73.68%), followed by Liliopsida (2,136, 17.60%). Among Fungi classes, Sordariomycetes has the most genomes (981, 25.78%).

Figure 1. Statistics of species/genus number and gene sequences at class level in Animalia, Plantae and Fungi.

Figure 2. Statistics of species/genus number and whole genomes at class level in Animalia, Plantae and Fungi.
Geographic distribution of genetic data
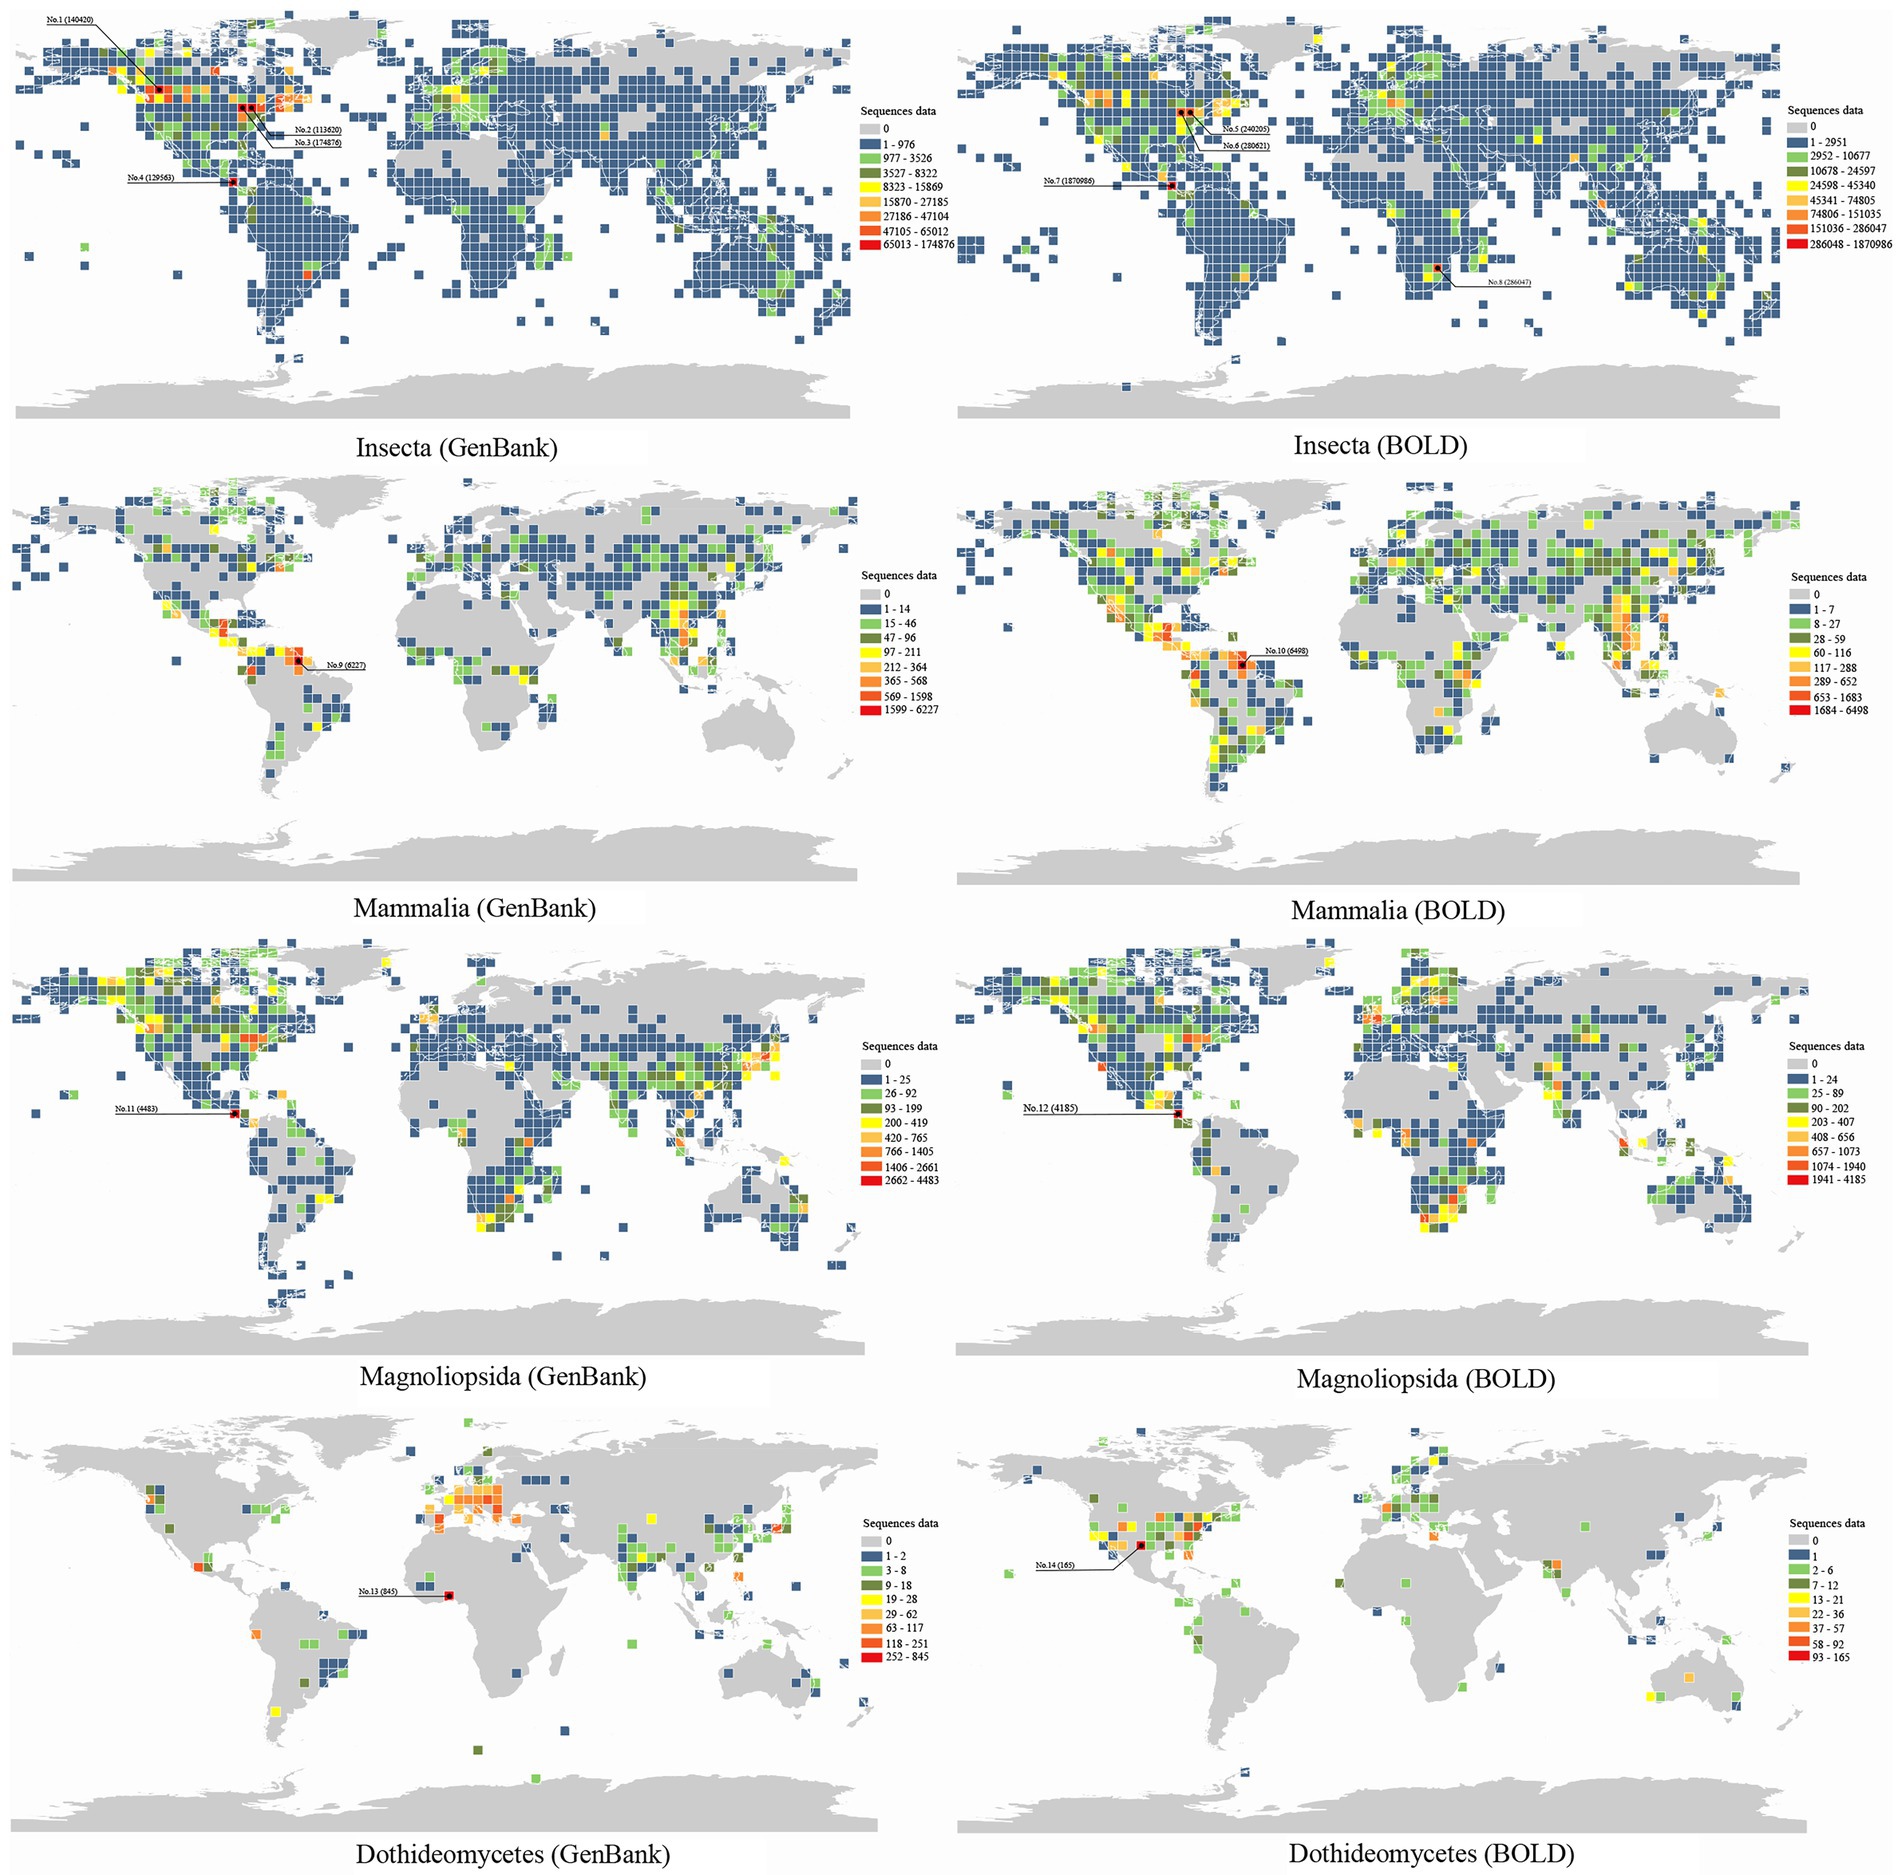
In order to explore the spatial pattern of genetic data, we selected the data of most commonly used molecular markers for four classes with rich genetic data as representatives. In total, 2,565,994 and 6,496,753 cytochrome oxidase subunit I (COI) sequences of Insecta, 220,532 and 98,061 rubisco large subunit (rbcl) sequences of Magnoliopsida, 46,521 and 77,439 COI sequences of Mammalia and 44,778 and 13,505 internally transcribed spacer (ITS) sequences of Dothideomycetes were downloaded from the GenBank and BOLD databases, respectively (access on September 21, 2022). It was found that 81.68% (GenBank) and 94.29% (BOLD) COI sequence data of Insecta were with longitude and latitude information, and that of rbcl of Magnoliopsida, COI of Mammalia and ITS of Dothideomycetes were 23.44% (GenBank) and 54.96% (BOLD), 52.87% (GenBank) and 42.70% (BOLD), and 8.07% (GenBank) and 8.60% (BOLD), respectively. After data screening, we obtained 8,390,003 longitude and latitude records from the GenBank and BOLD databases. We then used ArcMap v10.7 to present the global distributions of the sequence data with 4° grid maps (Figure 3).

Figure 3. The geographical patterns of sequence data of Insecta, Mammalia, Magnoliopsida and Dothideomycetes in the GenBank and BOLD database.
The sequences of Insecta are mainly distributed in North America and Europe, but less distributed in Africa and South America. For the GenBank data, two grids near Toronto, Canada have very high amount of sequences (No. 2, 113620 and No. 3, 174876), and one grid near Banff National Park, Canada (No. 1, 140420) also has high data volume. The BOLD data shows that the grid near Guanacaste National Park in Costa Rica has the highest number of sequences (No. 7, 1870986). The Mammalia COI sequences are mainly distributed in central and south America and southeast Asia, with most data in the grid near Guyana (GenBank: No. 9, 6227; BOLD: No. 10, 6498), but less in Africa and Australia. The sequence data of Magnoliopsida are mainly distributed in North America and South Africa, but less in South America. The grid near Guanacast National Park in Costa Rica has the highest amount of rbcl sequences of Magnoliopsida (GenBank: No. 11, 4483; BOLD: No. 12, 4185). The global distribution of Dothideomycetes ITS sequences is significantly different between databases. GenBank data of Dothideomycetes are mainly distributed in Benin, Africa (No. 13, 845) and Europe, while BOLD data are mainly in the United States and the grid near Texas has most sequences (No. 14, 165).
Obviously, the geographical distribution of sequence data of different biological groups is unbalanced. Due to the subjectivity of selection of sampling sites, a large number of sequence data are concentrated in a few geographical coordinate points. Most of these geographical coordinates are distributed in habitats with high biodiversity, such as national parks and natural reserves. For examples, in the GenBank database, 32,525 Insecta COI sequences are assigned with a single longitude and latitude point (49.001°N, 106.557°W) of Canada Grasslands National Park East Block; 327 Mammalia COI sequences are from a single longitude and latitude point (0.65°S, 76.45°W) in Ecuador Yasuni National Park; and 845 Dothideomycetes ITS sequences are from a longitude and latitude point (9.75°N, 2.2°E) in the African Benin national forest. In the BOLD database, 851,876 Insecta COI sequences are with the same longitude and latitude (10.763°N, 85.334°W) in Linkondela Beha Volcano National Park in Costa Rica, and 1,680 Magnoliopsida rbcl sequences are from a single longitude and latitude point (1.85°S, 102.65°E) in Bukit Duabelas National Park in Indonesia. However, we also found that some longitude and latitude points were located in schools or scientific research institutions rather than natural sampling sites. For examples, for the GenBank data, several longitude and latitude points located near the University of Guelph (43.528°N, 80.229°W; 43.537°N, 80.134°W; 43.5187°N, 80.1709°W; 43.5282°N, 80.229°W; 43.54°N, 80.14°W) contribute 71,616 Insecta COI sequences; and 64,680 Insecta COI sequences are with same longitude and latitude (27.4447°S, 54.9403°W) displaying as Antonio Ramos Research Center in Argentina. Also for the BOLD data, 42,998 Insecta COI sequences are with a same longitude and latitude (22.4685°N, 91.7808°E) as Chittagong University, Bangladesh, and 24,262 Insecta COI sequences with the longitude and latitude (3.1295°N, 101.657°E) of the University of Malaysia in Kuala Lumpur.
Published papers using genetic data
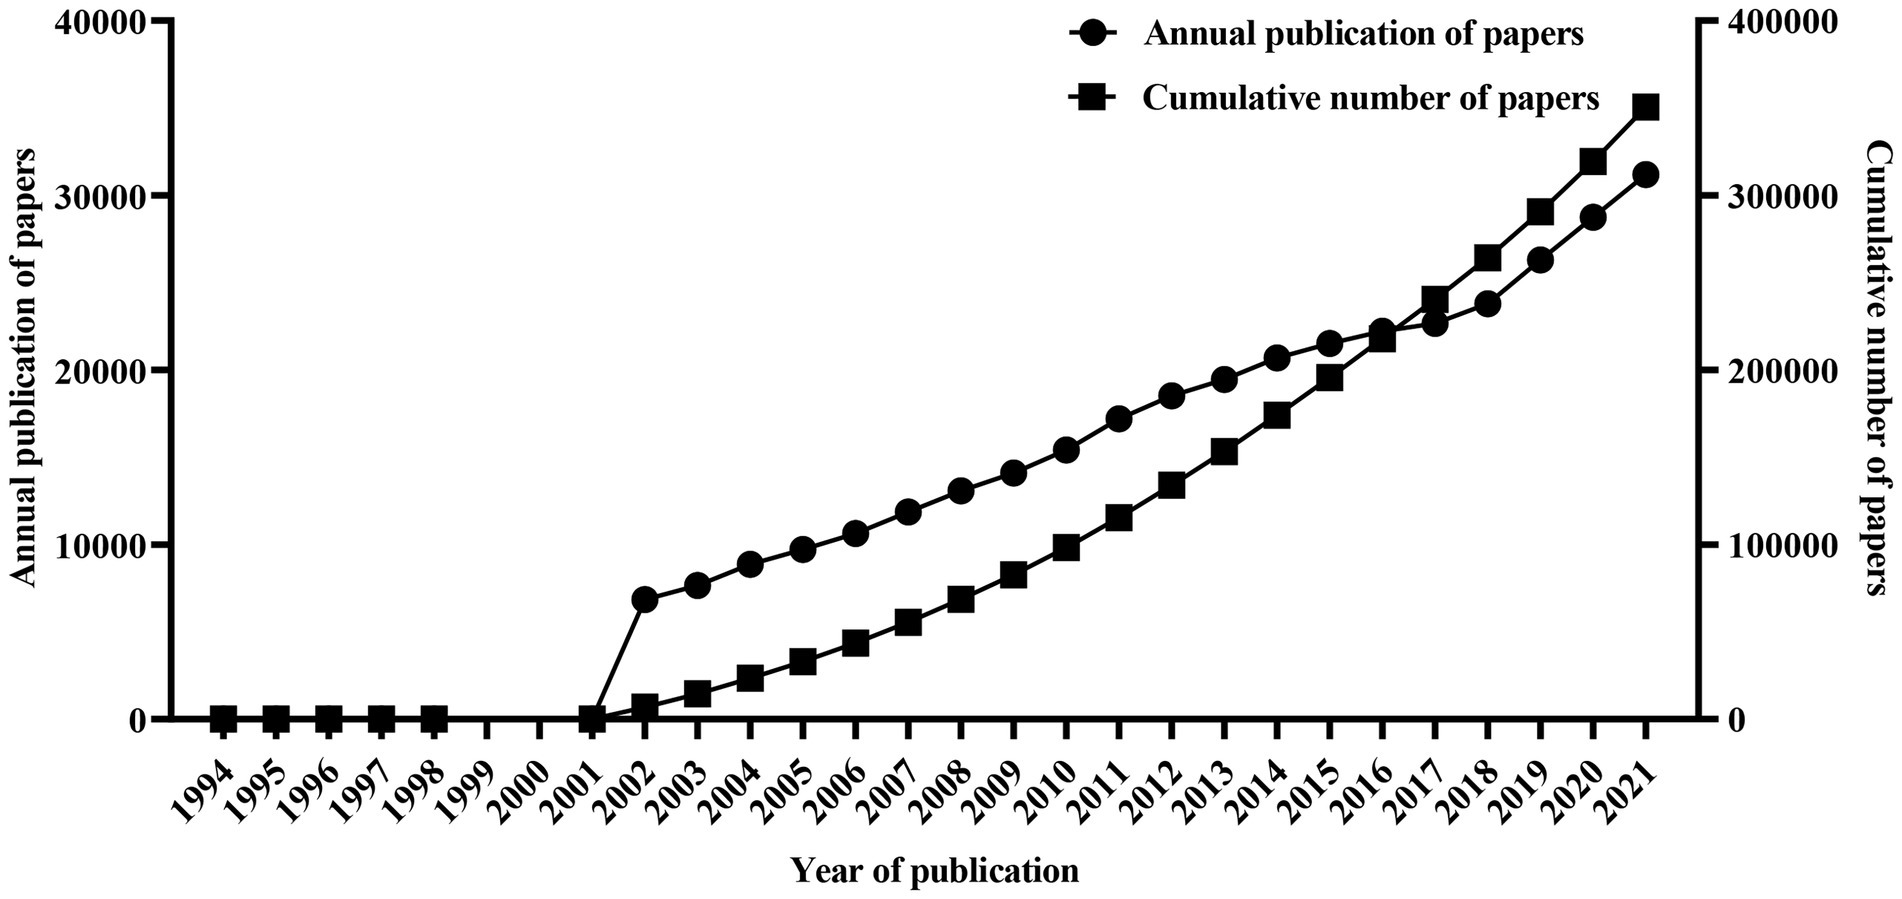
The bibliometric analysis of scientific papers using genetic data can provide information on the application of genetic data. We did subject retrieval (on September 10, 2022) by using “Genetic data or Genetic diversity or Molecular phylogeny” as retrieval formula in the core database of Web of Science. After duplications were removed by Citespace v6.1.2,4 a total of 369,900 valid papers are obtained. It is obvious that the annual numbers of published articles using genetic data were small before 2002, while grew rapidly after 2002 and increased year by year (Figure 4).
Using VOSviewer5 and Scimago graphica6 software, the national distribution and international cooperation relationship of papers using genetic data were shown in Figure 5. The size of nodes represents the number of articles published by a country. The larger the node, the more articles published by that country. The color of the node represents the number of cooperation times with other countries, the closer the node color is to red, the more cooperation times with other countries. The lines connecting nodes represent cooperation in paper publication between countries. The thicker the line between two countries, the more cooperation they have. The results show that the United States has the highest number of international co-authored papers and the most frequent cooperative relationships with other countries. Other countries with relatively high number of international co-authored papers include the United Kingdom, China, Germany, France, Italy, Australia, Spain, Netherlands, and Canada. These countries are not only the main force of doing related research using genetic data, but also have extensive scientific cooperation with many countries.
Problems in genetic data
In general, in the Animalia, Plantae and Fungi, most of the genetic data are concentrated in a few classes. For example, the Insecta and Mammalia account for 55.84% (GenBank) and 88.77% (BOLD) of the total genetic data in the Animalia. Magnoliopsida account for 68.25% (GenBank) and 61.19% (BOLD) of the total genetic data of the Plantae. Although hundreds of millions of sequence data have been accumulated in the public databases, they are still concentrated in biological groups closely related to human production and life, which makes genetic data accumulation for some biological classes with relatively rich species diversity is still insufficient. For examples, although there are 650 named species in Scaphopoda in the Animalia, the number of sequences is only 128 (GenBank) and 262 (BOLD); although there are 2,395 named species in Laboulbeniomycetes in the Fungi, the number of nucleotide sequences is only 957 (GenBank) and 7 (BOLD); and although there are 102 named species in Andreaeopsida in the Plantae, the number of sequences is only 421 (GenBank) and 96 (BOLD). Obviously, we still suffer a lack of accumulation of genetic data for many biological groups.
While South America, Africa and Australia have very rich species richness, the genetic data are relatively scarce in these regions. For example, although South America has very rich Magnoliopsida species, the rbcl sequence data are rarely distributed in this region. Similarly, compared with the species richness of Mammalia in Africa, their COI data are not much. In addition, most of the genetic data are concentrated in a few geographical grids, as we previously mentioned. Therefore, current sequence data show a disproportional distribution globally. Many geographical regions still lack the accumulation of genetic data, which may hinder us from conducting large-scale biogeography researches using genetic data.
In recent years, studies have reported the metadata deficiency of genetic data in public databases (Rajesh et al., 2021), such as that related to the collection location (Toczydlowski et al., 2021). For example, Marques et al. (2013) found that only 7% of barcode sequences in the then GenBank database contain longitude and latitude information. Gratton et al. (2017) found that only 6.2% of GenBank tetrapod accessions include locality data. Obviously, the lack of geographic coordinates will greatly hinder the effective use of genetic data in public databases, and clarifying the status of geographic coordinates of genetic data in different biological groups will provide reference for us to improve practices in data sharing. In our analysis, the geographical coordinate missing of the ITS sequences of Dothideomycetes was the most serious, with only 8.07% (GenBank) and 8.60% (BOLD) sequences having longitudes and latitudes. As a class with high species richness and relatively more genetic data, Dothideomycetes may reflect a general phenomenon of the lack of geographical coordinates in the Fungi. Magnoliopsida is the class with richest species and sequence data in the Plantae, but only 23.44% (GenBank) and 54.97% (BOLD) of rbcl sequences have longitude and latitude information. To our surprise, only about 18.32% (GenBank) and 5.71% (BOLD) of the Insecta COI sequences in are missing their geographic coordinates. However, problems may still exist for these insect geographical coordinates. A large amount of sequence data were found locating at research institutions rather than natural habitats, which cannot correctly reflect the real distribution of organisms in the natural environment. The subsequent use and analysis of these genetic data will be greatly hindered.
Future perspectives
We are now entering the third decade of the 21st century. Over the past 30 years, thanks to the efforts of many scientific research institutions and researchers, huge genetic data resources have been accumulated in public databases, making us enter an “age of big genetic data.” These genetic data have helped researchers make extraordinary achievements in many fields such as ecology, evolution and biogeography. However, there are still major gaps in the public genetic data and inappropriate practices in sharing of genetic data need to be improved. In the future, we need to encourage genetic data accumulation for previously neglected biological groups, especially those with relatively higher species richness but less genetic data volume, and scientific research investment should be increased in areas where genetic data are scarce. These efforts will greatly enrich the global genetic resource pool and provide strong support for in-depth understanding of biological and geographical evolution of species. Furthermore, we should also resolve the loss and error of geographical coordinates of genetic data by improving data practices (Huang and Qiao, 2011; Huang et al., 2012). Carefully archiving genetic data and relevant geographical information (e.g., natural sampling localities) by researcher will leave more valuable legacy for future research. Public databases should also update their data policy to improve the quality of metadata. In addition, increasing national research input and international cooperation with other countries will effectively help resolve imbalance in distribution of genetic data and research, especially in Africa and South America.
Data availability statement
The original contributions presented in the study are included in the article/supplementary material, further inquiries can be directed to the corresponding author.
Author contributions
XH conceptualized the study. XP, QL, and ZC collected and analyzed the data. XP and XH wrote the manuscript. All authors contributed to the article and approved the submitted version.
Funding
This research was supported by National Natural Science Foundation of China (Grant number: 32270499).
Conflict of interest
The authors declare that the research was conducted in the absence of any commercial or financial relationships that could be construed as a potential conflict of interest.
Publisher’s note
All claims expressed in this article are solely those of the authors and do not necessarily represent those of their affiliated organizations, or those of the publisher, the editors and the reviewers. Any product that may be evaluated in this article, or claim that may be made by its manufacturer, is not guaranteed or endorsed by the publisher.
Footnotes
References
Alamouti, S. M., Wang, V., Diguistini, S., Six, D. L., Bohlmann, J., Hamelin, R. C., et al. (2011). Gene genealogies reveal cryptic species and host preferences for the pine fungal pathogen Grosmannia clavigera. Mol. Ecol. 20, 2581–2602. doi: 10.1111/j.1365-294X.2011.05109.x
Avise, J. (2000). Phylogeography: The History and Formation of Species. Vol. 214. Cambridge, MA: Harvard. 47–48.
Avise, J. C. (2009). Phylogeography: retrospect and prospect. J. Biogeogr. 36, 3–15. doi: 10.1111/j.1365-2699.2008.02032.x
Benson, D. A., Karsch-Mizrachi, I., Clark, K., Lipman, D. J., Ostell, J., and Sayers, E. W. (2012). GenBank. Nucleic Acids Res. 40, D48–D53. doi: 10.1093/nar/gkr1202
Gratton, P., Marta, S., Bocksberger, G., Winter, M., Trucchi, E., and Kühl, H. (2017). A world of sequences: can we use georeferenced nucleotide databases for a robust automated phylogeography? J. Biogeogr. 44, 475–486. doi: 10.1111/jbi.12786
Guo, X., Zhang, G., Wei, K., Ji, W., Yan, R., Wei, Q., et al. (2019). Phylogeography of the threatened tetraploid fish, Schizothorax waltoni, in the Yarlung Tsangpo River on the southern Qinghai-Tibet plateau: implications for conservation. Sci. Rep. 9:2704. doi: 10.1038/s41598-019-39128-y
Guralnick, R., and Hill, A. (2009). Biodiversity informatics: automated approaches for documenting global biodiversity patterns and processes. Bioinformatics 25, 421–428. doi: 10.1093/bioinformatics/btn659
Hebert, P. D. N., Cywinska, A., Ball, S. L., and DeWaard, J. R. (2003). Biological identifications through DNA barcodes. Biol. Sci. 270, 313–321. doi: 10.1098/rspb.2002.2218
Hedges, S. B., Marin, J., Suleski, M., Paymer, M., and Kumar, S. (2015). Tree of life reveals clock-like speciation and diversification. Mol. Biol. Evol. 32, 835–845. doi: 10.1093/molbev/msv037
Hinchliff, C. E., Smith, S. A., Allman, J. F., Burleigh, J. G., Chaudhary, R., Coghill, L. M., et al. (2015). Synthesis of phylogeny and taxonomy into a comprehensive tree of life. Proc. Natl. Acad. Sci. U. S. A. 112, 12764–12769. doi: 10.1073/pnas.1423041112
Huang, X., Hawkins, B. A., Lei, F., Miller, G. L., Favret, C., Zhang, R., et al. (2012). Willing or unwilling to share primary biodiversity data: results and implications of an international survey. Conserv. Lett. 5, 399–406. doi: 10.1111/j.1755-263X.2012.00259.x
Huang, X., and Qiao, G. (2011). Biodiversity databases should gain support from journals. Trends Ecol. Evol. 26, 377–378. doi: 10.1016/j.tree.2011.05.006
Ma, C., Yang, P., Jiang, F., Chapuis, M., Shali, Y., Sword, G. A., et al. (2012). Mitochondrial genomes reveal the global phylogeography and dispersal routes of the migratory locust. Mol. Ecol. 21, 4344–4358. doi: 10.1111/j.1365-294X.2012.05684.x
Mardis, E. R. (2008a). Next-generation DNA sequencing methods. Annu. Rev. Genomics Hum. Genet. 9, 387–402. doi: 10.1146/annurev.genom.9.081307.164359
Mardis, E. R. (2008b). The impact of next-generation sequencing technology on genetics. Trends Genet. 24, 133–141. doi: 10.1016/j.tig.2007.12.007
Marques, A. C., Maronna, M. M., and Collins, A. G. (2013). Putting GenBank data on the map. Science 341:1341. doi: 10.1126/science.341.6152.1341-a
Miraldo, A., Li, S., Borregaard, M. K., Flórez-Rodríguez, A., Gopalakrishnan, S., Rizvanovic, M., et al. (2016). An Anthropocene map of genetic diversity. Science 353, 1532–1535. doi: 10.1126/science.aaf4381
Pelletier, T. A., Parsons, D. J., Decker, S. K., Crouch, S., Franz, E., Ohrstrom, J., et al. (2022). phylogatR: Phylogeographic data aggregation and repurposing. Mol. Ecol. Resour. 22, 2830–2842. doi: 10.1111/1755-0998.13673
Pope, L. C., Liggins, L., Keyse, J., Carvalho, S. B., and Riginos, C. (2015). Not the time or the place: the missing spatio-temporal link in publicly available genetic data. Mol. Ecol. 24, 3802–3809. doi: 10.1111/mec.13254
Rajesh, A., Chang, Y., Abedalthagafi, M. S., Wong-Beringer, A., Love, M. I., and Mangul, S. (2021). Improving the completeness of public metadata accompanying omics studies. Genome Biol. 22:106. doi: 10.1186/s13059-021-02332-z
Ratnasingham, S., and Hebert, P. D. N. (2007). Bold: the barcode of life data system (http://www.barcodinglife.org). Mol. Ecol. Notes 7, 355–364. doi: 10.1111/j.1471-8286.2007.01678.x
Rhoads, A., and Au, K. F. (2015). PacBio sequencing and its applications. Genomics Proteomics Bioinf. 13, 278–289. doi: 10.1016/j.gpb.2015.08.002
Sanger, F., Nicklen, S., and Coulson, A. R. (1977). DNA sequencing with chain terminating inhibitors. PNAS 74, 5463–5467. doi: 10.1073/pnas.74.12.5463
Tautz, D., Arctander, P., Minelli, A., Thomas, R. H., and Vogler, A. P. (2002). DNA points the way ahead in taxonomy. Nature 418:479. doi: 10.1038/418479a
Keywords: biodiversity, biogeography, DNA barcode, genomics, population genetics
Citation: Peng X, Li Q, Cheng Z and Huang X (2023) The geography of genetic data: Current status and future perspectives. Front. Ecol. Evol. 11:1112636. doi: 10.3389/fevo.2023.1112636
Edited by:
Peter Convey, British Antarctic Survey (BAS), United KingdomReviewed by:
Jiufeng Wei, Shanxi Agricultural University, ChinaCopyright © 2023 Peng, Li, Cheng and Huang. This is an open-access article distributed under the terms of the Creative Commons Attribution License (CC BY). The use, distribution or reproduction in other forums is permitted, provided the original author(s) and the copyright owner(s) are credited and that the original publication in this journal is cited, in accordance with accepted academic practice. No use, distribution or reproduction is permitted which does not comply with these terms.
*Correspondence: Xiaolei Huang, ✉ aHVhbmd4bEBmYWZ1LmVkdS5jbg==
 Xin Peng1
 Xiaolei Huang

