 Dangui Lu
 Lichuan Qiu2
 Zhichao Wang
94% of researchers rate our articles as excellent or good
Learn more about the work of our research integrity team to safeguard the quality of each article we publish.
Find out more
ORIGINAL RESEARCH article
Front. Ecol. Evol., 31 March 2023
Sec. Environmental Informatics and Remote Sensing
Volume 11 - 2023 | https://doi.org/10.3389/fevo.2023.1110018
This article is part of the Research TopicRemote Sensing Advances in Biodiversity and Ecosystem Functioning ResearchView all 12 articles
Changes in distribution patterns of economically essential forest species under global change are urgently needed in the scientific forecast, and large-scale spatial modeling is a crucial tool. Using diversity pattern indicators and other data obtained through geographic information systems (GIS) and spatial data on Moraceae species obtained from published data, we quantitatively studied the spatial diversity patterns of genera in the Moraceae in China. The results revealed that the patch richness, diversity index, and total shape index of the genera with multiple species were significantly higher than those of the monotypic genera. Monotypic genera had no spatial diversity and no distribution in patterns of spatial diversity. Maclura had the most concentrated spatial distribution and the lowest distribution area among the Moraceae in China. The number of patches and the total area were the smallest, while the most significant patch index was the highest. Maclura had no spatial diversity. Streblus had the highest patch abundance compared to other genera with fewer species. Streblus had the smallest number of patches and total area of distribution, the lowest spatial distribution, and a small total shape index, indicating its concentrated distribution. The values of the Shannon’s Diversity Index (SHDI) and Simpson’s Diversity Index (SIDI) were the highest, and the spatial distribution was the most diverse among the genera with fewer species. The patch type of Streblus had a more considerable value than other genera, but the number of patches was small, and the total shape index was low. Streblus was primarily distributed in the south of Yunnan, western Guangxi, the west and central parts of Hainan, and southern Guangdong. Most of these areas were mountainous. The temperature decreased with elevation, providing diverse environmental conditions for the narrow-stem genus. Among the Moraceae in China, the spatial distribution of Ficus was the most diverse, with the highest number of patches, patch types, total shape index, SHDI, and SIDI values. The spatial diversity of Ficus could be used as a protected area for Moraceae in China.
Large-scale patterns of species diversity are not only one of the central issues in macroecological and biogeographical studies (Colwell and Lees, 2000). In modern China, Moraceae includes 12 genera: Antiaris, Artocarpus, Broussonetia, Cannabis, Cudrania, Fatoua, Ficus, Humulus, Maclura, Malaisia, Morus, and Streblus. The diversity of Moraceae has been studied in terms of genetic diversity (Elhawary et al., 2018; Marcotuli et al., 2019; Martins et al., 2021), species diversity (Gardner et al., 2017; Machado et al., 2018; Shi et al., 2018; Pederneiras et al., 2020), and ecosystem diversity (Kong et al., 2020; Dong et al., 2022; Wang et al., 2022). Most studies on diversity in the Moraceae have been conducted for limited species of the genus Morus (Chen et al., 2016; Islam and Rahman, 2019; Hashemi and Khadivi, 2020) and Ficus species (Teixeira et al., 2018; Zhang et al., 2018; Chakraborty et al., 2022). On the contrary, in this work, all genera in the Chinese Moraceae were applied to investigate species diversity. Concerning research methodology for the study of the Moraceae in China, tabular statistics are frequently applied in studies to document plant species diversity (Chen et al., 2010), which has the disadvantage of requiring a great deal of work in discovering interprovincial relationships among species diversity. With the use of geographic information systems (GIS) technology, it is feasible to observe species diversity, i.e., spatial diversity, among regions. For now, the limited spatial distribution of some genera and species of Moraceae has been studied by researchers utilizing GIS (Berg, 1989). However, studies on the spatial distribution and diversity of all Moraceae across China are insufficient. Furthermore, studies on the species diversity of Moraceae are usually conducted using qualitative methods, and quantitative studies are insufficient (Zerega et al., 2005; Kumar et al., 2011). In this paper, we used GIS to study the species diversity of all Moraceae species in all of China. This was done because of these problems.
A quantitative study of species diversity in communities can utilize the Shannon-wiener index, which integrates species richness and evenness, combined with the Simpson index (Nagendra, 2002; Ganivet et al., 2020; Shukla et al., 2020), the Pielou evenness index (Pielou, 1966; Ricotta and Avena, 2003; He et al., 2019), and the Jaccard similarity index (Oluyinka Christopher, 2020). The index formula of spatial diversity patterns, such as the number of patches and total area, was applied to compute the index of spatial diversity patterns of the genus Moraceae in China. However, all of them lacked the ability to link with geoinformation to provide national-scale knowledge. In this research, GIS was applied to map the spatial distribution of 12 genera of Moraceae in China, with the county as the fundamental unit of spatial data and the Moraceae as the research object.
Large-scale vegetation distribution data can be obtained using remote sensing images, and landscape diversity indicators can analyze the spatial distribution pattern of vegetation. The Moraceae are primarily dominated by trees and shrubs, with a small number of vines. When the Moraceae building species are evident, the spatial pattern of the dominant species in the primary layer can be obtained using remote sensing technology. When the prevalent phenomenon of Moraceae is not evident, the spatial pattern does not contain species. However, species are the basis of plant community composition, and the workload of a species survey is immense. The published botanical histories of various places in China have the distribution sites of Moraceae, which lay the foundation for the study of the spatial distribution of Moraceae. Studying how species are spread out in space can help protect species and give a guide for figuring out what information about plants is in high-resolution remote sensing images.
In this study, GIS was used to create a map of the spatial diversity of 12 Moraceae genera in Chinese, using counties as the basic spatial data unit and Moraceae as the research object, from which not only the spatial distribution characteristics of the genera, but also further indicators of spatial diversity calculation, such as the number of patches and patch richness, can be obtained, providing a foundation for its quantitative study of spatial divergence. The quantitative study of the spatial diversity of Moraceae can provide a more accurate basis for species diversity, conservation, use, and restoration of Moraceae in China.
In the first step, based on the contents of the Flora Reipublicae Popularis Sinicae [Vol. 23(1)], the species of Moraceae in China and their Latin names were collated and reviewed by plant taxonomy experts to determine a list of Moraceae species in China. Secondly, the database of Moraceae in China was established by compiling all kinds of data sources to record the geographical distribution of Moraceae. The primary data sources for geographical distribution were the full-text FRPS website1, the National Plant Specimen Resource Center2, and the National Specimen Information Infrastructure website3. Up to the end of 2021, they issued papers and journals on the geographical distribution of Moraceae in China (Wu Zhengyi, 1989; Arimoto et al., 2020), and regional flora was issued by some provinces and regions. Determine the particular distribution of each plant in the county. The data of provinces and regions and the range of distribution that the counties cannot determine will not be adopted. In the final step, we tested all species names for synonyms and merged all synonymized species records.
We also excluded cultivated species and hybrids, and all distribution data were natural species distributions. The attribute data in the database includes genus name, species name, Latin name, province of distribution, county of issuance, and data source, with a total of 28,537 county-level distribution records. The attribute data in the database contained genus name, species name, Latin name, distribution province, distribution county, and data source. It was eventually determined that there were 12 genera and 149 species of Moraceae in China, and a total of 28,537 county-level distribution records were compiled.
All of the species’ spatial data, which includes both graphic and attribute data, was made in ArcGIS 10.2. The graphic data used a map of China with the county as the basic unit (a scale of 1:1,000,000). The attribute data was the distribution of species. Then, the number of genera was obtained, and the spatial diversity map was created. In the spatial distribution of the genus, an isolated county was a patch, and adjacent counties jointly formed a patch. The number of genera in the patch was different, forming different patch types. The spatial diversity and its pattern for the genus could be obtained by calculating the index of spatial diversity pattern. The applicable data was obtained from the spatial data and studied according to the spatial diversity pattern indicators (Table 1). Complete all raster data calculations in Fragstats 3.3.
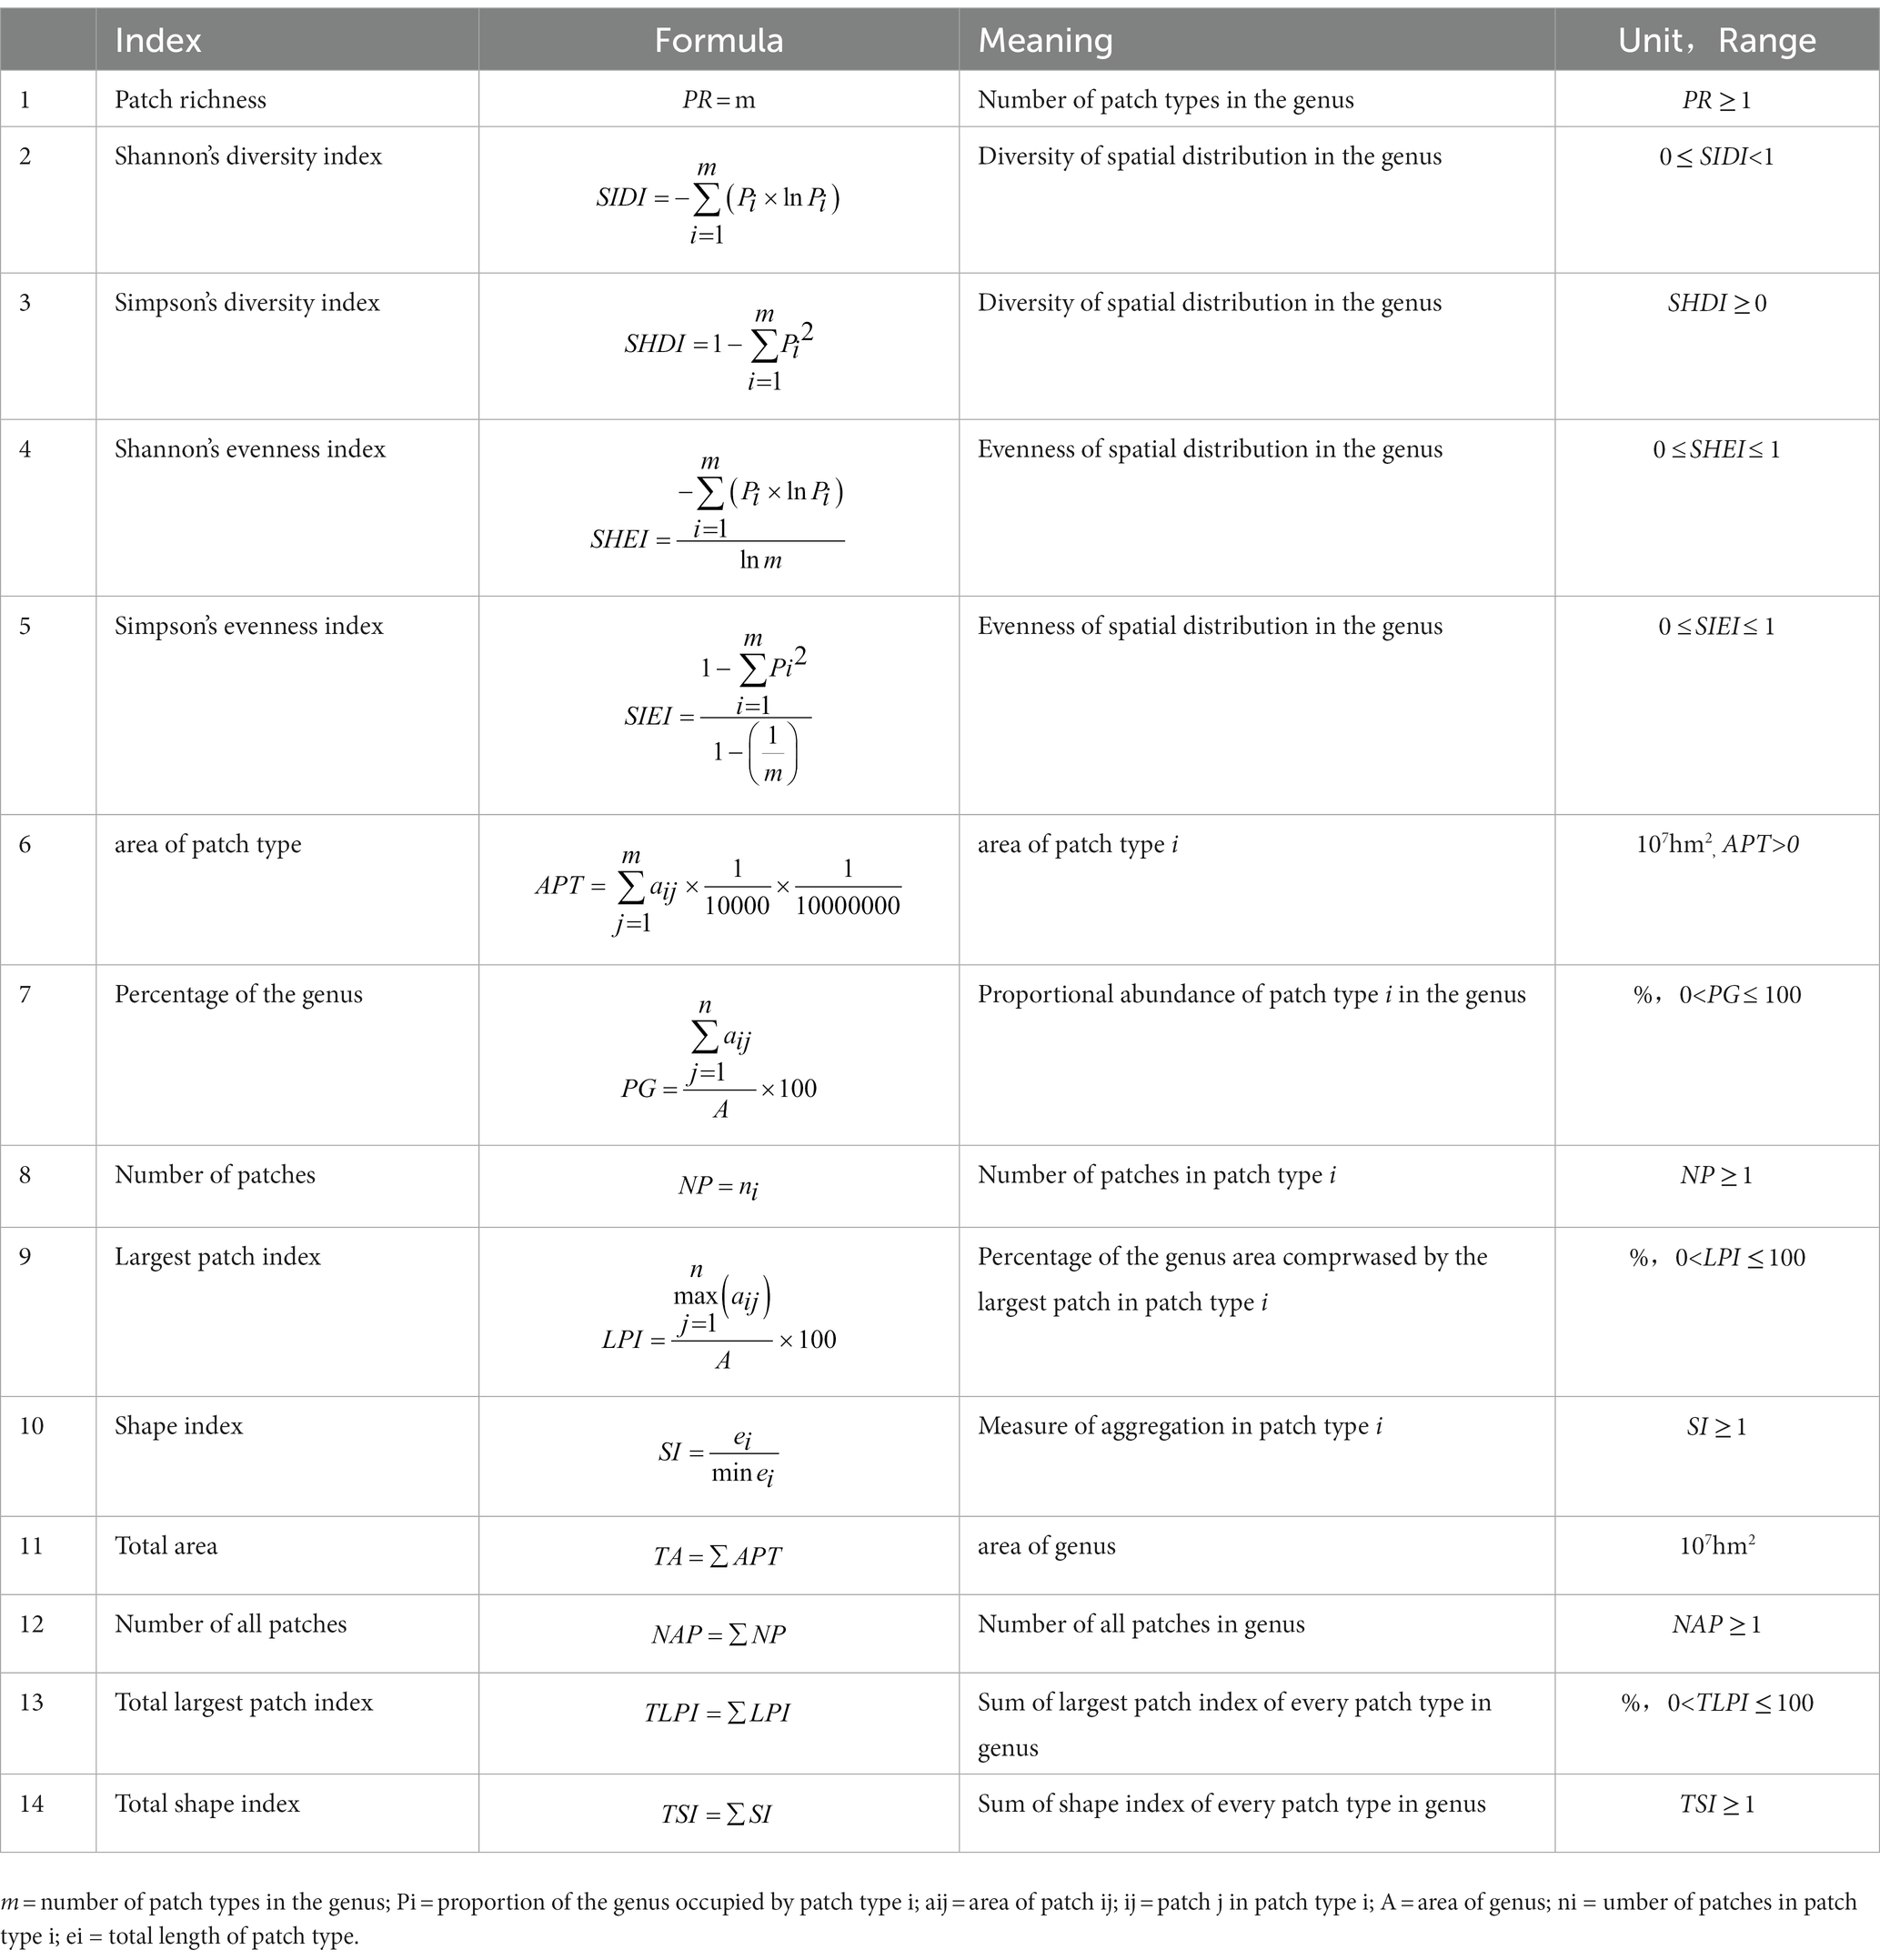
Table 1. Indices of spatial diversity patterns.
Monotypic genera are genera that comprise just one species. Moraceae includes Maclura, Antiaris, Malaisia, and Cannabis. Among Moraceae in China, these genera had the smallest patch richness, with a value of 1 (Table 2), indicating merely one patch type. However, the different genera had different numbers of patches. Shannon’s diversity index (SHDI), Simpson’s diversity index (SIDI), Shannon’s evenness index (SHEI), and Simpson’s evenness index (SIEI) of monotypic genera were all 0 (Table 2), implying that there was no diversity. The monotypic genus exhibited a high degree of aggregation. Additionally, it had a maximum plaque index but a low total shape index (Table 2).

Table 2. Spatial diversity of genera in the Moraceae in China.
The total number of all patches (NAP) on Maclura was six (Table 2), indicating six patches. Among the 12 genera of Moraceae, the spatial distribution of Maclura was the lowest, predominantly distributed in Medog County in Tibet and the eastern, central, northern, and southern parts of Yunnan. Maclura in the five counties had a significantly lower distribution range than the other genera. Consistent with the data shown in Figure 1A, the number of all patches (NAP) and total area (TA) of Maclura were the smallest (Table 2). Among monotypic genera, the Maclura spatial distribution was the most concentrated (Figure 1A), and the most extensive patch index (TLPI) was the highest among the 12 genera of Moraceae (Table 2).
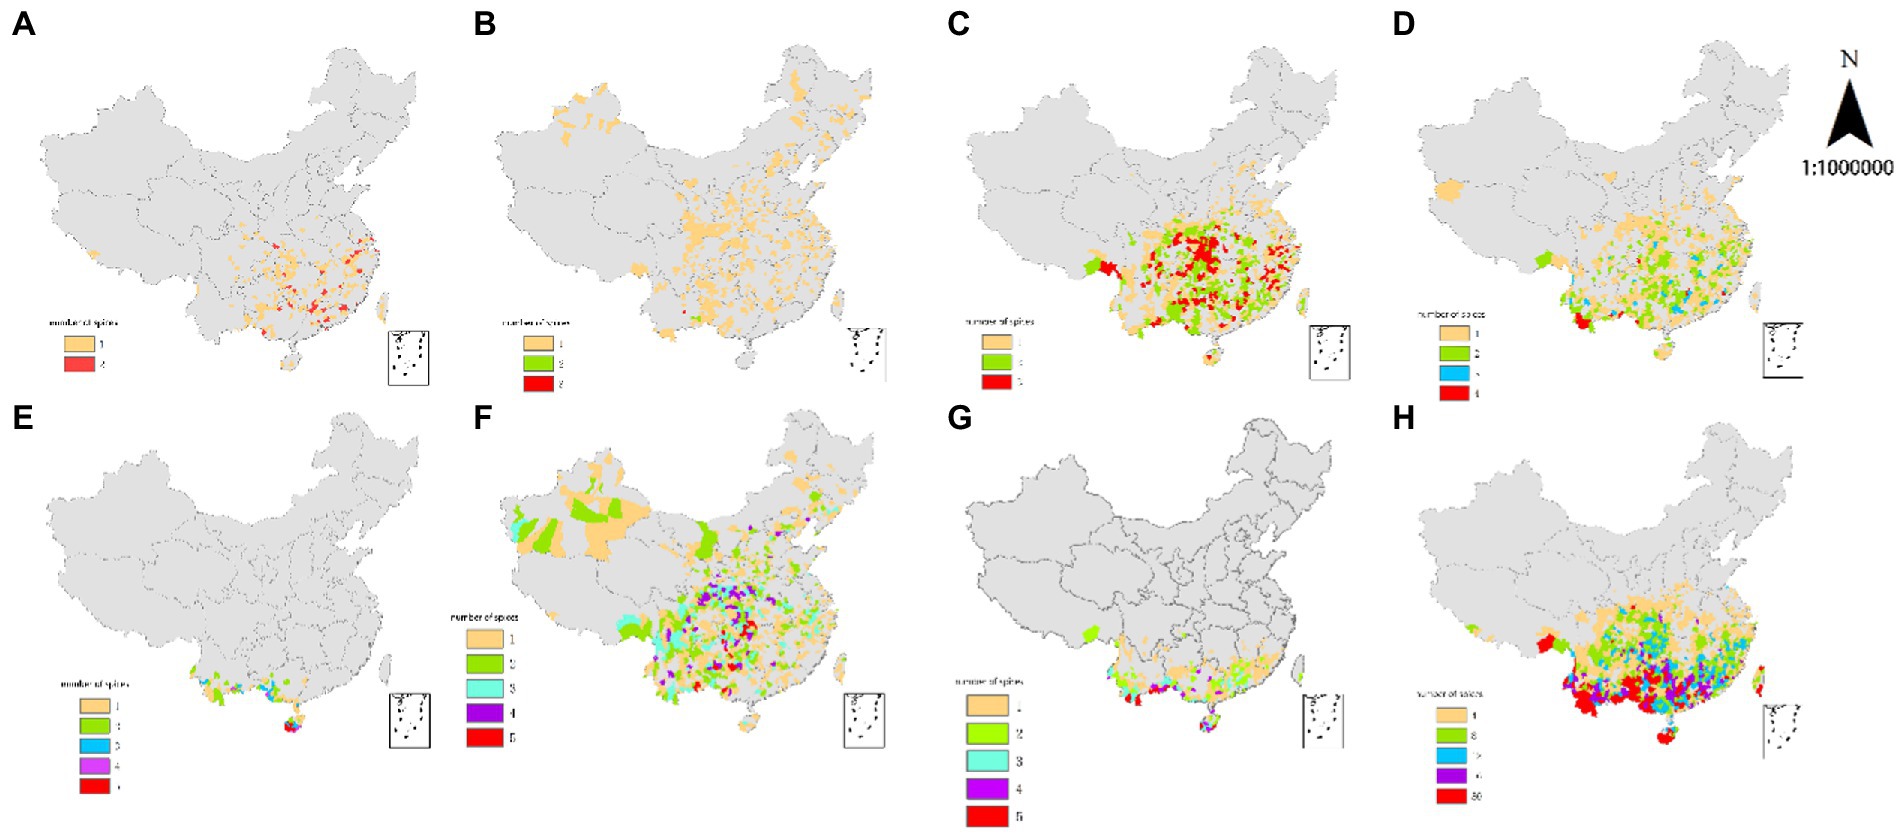
Figure 1. Spatial diversity distribution of every genus in the Moraceae in China. (A) Fatoua, (B) Humulus, (C) Broussonetia, (D) Cudrania (E) Streblus, (F) Morus, (G) Artocarpus, (H) Ficus.
The NAP value of Antiaris was 14 (Table 2), indicating that the number of patches was 14. The number of all patches (NAP) of Antiaris was slightly higher than that of Maclura, but Antiaris’ distribution range was significantly larger. The numbers of all patches (NAP), total area (TA), and full shape index (TSI) of Antiaris in Table 2 were consistent with those of Maclura.
The number of all patches (NAP) of Malaisia was 20 (Table 2), which indicates that the number of patches in this genus was 20, and the number of patches was slightly larger than that of Antiaris. The distribution range was somewhat more extensive than that of Antiaris. The number of all patches (NAP) and total area (TA) of the three genera in Table 2 were the smallest among the Moraceae in China, and the total area (TA) of the three genera was comparable.
Among the monotypic genera, the number of all patches (NAP), total area (TA), and complete shape index (TSI) of Cannabis were extensive (Table 2). Cannabis was distributed in other parts of the county, though not in regions including Hainan, Taiwan, Hong Kong, and Macau. Cannabis had the most comprehensive distribution, and the sum of the most extensive patch index of every patch type in the genus (TLPI) was the lowest among the monotypic genera (Table 2).
The lesser genera (2–7 species) included Fatoua, Humulus, Cudrania, Broussonetia, and Streblus. Patch richness (PR) values of the five species were more significant than 1 (Table 2), and the patch richness increased as patch type gradually increased from 2 to 5. The species in these genera were diverse, and their SHDI, SIDI, SHEI, and SIEI index values were all greater than 0 (Table 2) and slightly higher than those of monotypic genera. Table 1 shows that the correlation index of the lesser genus species (except for Cannabis) was higher than monotypic genera for patch richness (PR), total area (TA), and the number of all patches (NAP). The species were more widely distributed and more dispersed than monotypic genera. The total shape index (TSI) was significantly higher than that of monotypic genera (Table 2).
The total area (TA) of Fatoua was close to that of Artocarpus (Table 2). The difference can be easily observed by comparing the plots of these two genera. The plaque richness (PR) value of Fatoua is 2 (Table 2). There are two types of patches with low patch richness. One plaque type had one species, and the other had two species, corresponding to 1 and 2 in the legend of Figure 1A, higher than Fatoua. In Figure 1G, the patch types are classified into five classes. Fatoua is more widely distributed, and it was concentrated in tropical and subtropical regions (Figure 1A). Artocarpus is concentrated in tropical and southern subtropical regions (Figure 1G). Although Fatoua had a slightly larger number of patches, Artocarpus had more patch types and a slightly higher total area (TA).
The spatial distribution of Humulus (Figure 1B) was analogous to that of monotypic Cannabis. The PR of Humulus was 3 (Table 2), indicating that its patch richness was higher than that of Cannabis. Humulus has three patches: patches with species, patches with two species, and patches with three species, which correspond to 1, 2, and 3 in the legend of Figure 1B, respectively. According to the total shape index (TSI), Humulus species had greater spatial dispersion and uniform spatial distribution than Cannabis (Table 2). However, the total most extensive patch index (TLPI) was less than that of Cannabis. Compared with Cannabis, Humulus had a slightly smaller number of patches, but the total area was slightly larger (Table 2). The SHDI, SIDI, SHEI, and SIEI index values of Humulus were more significant than 0, but the value was lower because the first patch type was more evenly distributed. In contrast, the second and third patches were distributed in the southwest in small quantities (Figure 1B).
Compared with the lesser genera in the previous section, the total area of Broussonetia was the largest, as was the number of patches. The PR of Broussonetia was 3 (Table 2), and patch richness was low. The spatial distribution of Broussonetia (Figure 1C) was similar to that of Cudrania (Figure 1D), and its total area (TA) and several patches (NP) were slightly higher than those of Cudrania (Table 2), with distribution in the south and north. The SHDI and SIDI diversity index values and the SHEI and SIEI meanness index values of Broussonetia were higher than the corresponding indicators for Cudrania (Table 2), so we determined that the spatial distribution of Broussonetia was diverse.
The total area of distribution of Streblus was similar to Malaisia (Table 2). The number of patches (NP) of Streblus was twice that of Malaisia, and the total shape index (TSI) was three times that of the latter. The spatial distribution of Streblus was western. The distribution was more dispersed (Figure 1E). The PR of Streblus was 5 (Table 2), indicating that its patch richness was the highest among the lesser genera. However, the total area (TA) and number of all patches (NAP) of Streblus were the smallest (Table 2). The smallest spatial distribution range was found (Figure 1E). Its total shape index (TSI) was moderately small and relatively concentrated. The SHDI and SIDI diversity indices of Streblus were the highest among the lesser genera, and the SHEI and SIEI values were higher than average. The spatial distribution was the most diverse among the more inferior generation. Streblus had the most considerable number of patch types, but the number of patches (NP) was small, and the total shape index (TSI) was weak. Because Streblus was predominantly distributed in the south of Yunnan, western Guangxi, the west and central parts of Hainan, and southern Guangdong (Figure 1E), most were in mountainous areas. The temperature decreases with height, providing different and challenging environmental conditions for Streblus, which grows in a limited range of suitable conditions.
The multiple genera (more than seven species) include Morus, Artocarpus, and Ficus. Among the 12 genera of Moraceae in China, the genera with more than 10 species had the most outstanding patch richness (PR). The number of patches (NP), total shape index (TSI), SHDI, SIDI, SHEI, and SIEI values of these genera were higher than those of smaller genera, but the most extensive patch index (LPI) values were lower (Table 2).
Morus had a PR of 7 (Table 2), with seven types of patches. Patch types 1, 2, 3, 4, 5, 6, and 7 represented patches comprising 1, 2, 3, 4, 5, 6, and 7 species, respectively. In Figure 1F, the patch types were divided into five levels. The number of patches (NP) and total shape index (TSI) values of Morus were high (Table 2), which was consistent with the number and distribution of patches in Figure 1F. Among genera with more than 10 species, Morus had the largest total area (TA) and was the most evenly distributed across the county. Morus’s SHDI, SIDI, SHEI, and SIEI values were higher than those of other large genera, and the spatial distribution had higher diversity.
The PR of Artocarpus was 8 (Table 2), and patch richness (PR) was slightly higher than Morus’s. Patch types 1, 2, 3, and 4 represented patches containing 1, 2, 3, and 4 species, respectively, and patch type 5 represented patches containing 5–8 species. In Figure 1G, the patch types were divided into five levels. Among genera with more than 10 species, the patch richness of Artocarpus was relatively high. However, the number of patches (NP), total area (TA), and total shape index (TSI) values were the smallest (Table 2). The distribution range of Artocarpus was the smallest, and the spatial distribution was the most concentrated (Figure 1G). In Table 2, the SHDI, SIDI, SHEI, and SIEI values of Artocarpus were shown to be between the corresponding indicators for Morus and Ficus, with high spatial diversity.
The PR of Ficus was 41 (Table 2), the highest among the 12 genera of Moraceae in China. The patch types were species comprised of 1 to 37, 38, 40, 43, 49, and 50 (Figure 1H). The spatial distribution of Ficus was close to that of Broussonetia, though farther to the south (Figure 1H), and the spatial distribution was centered. However, the number of Ficus patches was 2.5 times that of Broussonetia, and the total shape index (TSI) was 4.5 times that of Broussonetia. The most extensive patch index (LPI), SHDI, and SIDI values of Ficus were higher than those of Broussonetia (Table 2). Among the Moraceae in China, the spatial distribution of Ficus was the most diverse and widely distributed, with the highest number of all patches (NAP), number of patch types, total shape index (TSI), SHDI, and SIDI values (Table 2). Therefore, areas with a substantial number of Ficus could be used as protected areas to protect the Moraceae resources in China.
Our research applied spatial variety pattern indicators using spatial calculations based on the number of patches, genus and species types, and distribution areas. Spatial diversity patterns were calculated using spatial arrows based on the number of patches, genus or species types, and their distribution areas to create Moraceae’s genus and species diversity in each county. Based on the patches, the analysis of the kinds of genera or species and their distribution areas in the study enables the species of mulberry genera and species in each county to be derived, and the spatial variety index can be computed. The computation of the spatial diversity index can quantify spatial diversity, which is unique to this research.
One of the most important features of species spatial distribution was the large-scale pattern of species diversity (Tittensor et al., 2010). The large-scale pattern of species diversity and its formation mechanism is one of the core issues in ecology and the basis of biodiversity conservation planning (Stuart-Smith et al., 2013). The most significant feature of this study was that the distribution was precise to the county level, quantitatively studying the spatial diversity of the Moraceae in China, and the diversity types were divided based on the number of species. Using GIS to draw distribution maps enabled us to carry out a spatially simple and intuitive observation of the species diversity of Moraceae in China and obtain spatial diversity computation indicators from patch maps. We obtained data on the spatial diversity, evenness index, and several patches using the spatial diversity model indicators. And then, we can quantitatively analyze the spatial diversity of Moraceae in China. Carrying out a study at this large scale not only enabled us to discover the spatial diversity center of Moraceae in China more accurately but could also aid in protecting and utilizing it.
The diversity analysis of genera can provide evidence and indications for investigating the evolution of flora (Yue, 2001). Among the Moraceae in China, the patch indicators of monotypic genera were consistent with the species, and spatial diversity did not differ between the species and genus. The number of all patches (NAP), total area (TA), and spatial distribution range of Maclura were the lowest among all 12 genera. Maclura’s most extensive patch index (LPI) was the highest among the 12 genera, and the spatial distribution was the most concentrated. Among monotypic genera, Cannabis had a moderately substantial total shape index (TSI), the most substantial number of patches (NP) and entire area (TA), and the most comprehensive distribution range. Among monotypic genera, the patch richness of Streblus was the highest, the total number of patches and total distribution area was the smallest, and the spatial distribution range was the smallest. The total shape index of Streblus was moderately small, and the distribution was relatively concentrated. We found that Streblus was mainly distributed in the south of Yunnan, the western part of Guangxi, the central and western parts of Hainan, and the southern part of Guangdong. This was because these areas are mostly mountainous, and the temperature decreases with elevation, providing different environmental conditions for Streblus, which can tolerate a narrow range of conditions.
The SHDI and SIDI diversity indices of Streblus were the highest, and the spatial distribution was the most diverse among the genera with few species. Streblus had more patch types, but the number of patches was small, and the total shape index (TSI) was low. Streblus was a non-monophyletic group, far from other genera. We found that Streblus was mainly distributed in the south of Yunnan, the western part of Guangxi, the central and western parts of Hainan, and the southern part of Guangdong. Because these areas were primarily mountainous, the temperature decreased with elevation, providing different environmental conditions for Streblus, which can tolerate a narrow range of conditions.
Among the genera with lesser species, the number of all patches (NAP), total area (TA), total shape index (TSI), SIDI, and SHEI values of Broussonetia were the highest. Broussonetia was widely distributed, and its distribution was the most diverse. The ecological adaptation of Broussonetia papyrifera was strong, and this species was widely distributed in China. The reason why is that the B. papyrifera population has high genetic diversity due to the fact that the tree was a cross-pollinated plant and geographical isolation due to features such as rivers, mountains, roads, and canals that block the flow of genes between Broussonetia papyrifera populations.
Among the Moraceae in China, the spatial distribution of Ficus was the most diverse, with the most significant number of all patches (NAP), number of patch types, total shape index (TSI), SHDI, and SIDI values. The diversified centers of Ficus were distributed in southeastern Gansu, northeastern Guizhou, southern Yunnan, southwestern Guangxi, southern Taiwan, and western Hainan. The spatial diversity of Ficus could be used when designating protected areas for the Moraceae in China. The spatial diversity center of the Moraceae in China was mainly distributed in tropical and subtropical regions. This conclusion was consistent with the view put forth by the Flora Reipublicae Popularis Sinicae that the Moraceae in China were prolific in tropical and subtropical areas, with a few distributed in the temperate zone.
The datasets presented in this study can be found in online repositories. The names of the repository and accession number(s) can be found in the article.
DL: conceptualization, validation, formal analysis, data curation, and writing - original draft. LQ: conceptualization, resources, and acquisition of the financial support for the project leading to this publication. MJ: software, validation, formal analysis, data curation, and acquisition of the financial support for the project leading to this publication. ZF: conceptualization and resources. ZW: provided guidance on article format and acquisition of the financial support for the project leading to this publication. All authors contributed to manuscript revision, read and approved the submitted version.
This work was supported by grants from the National Natural Science Foundation of China (41071335, 41171423).
The authors declare that the research was conducted in the absence of any commercial or financial relationships that could be construed as a potential conflict of interest.
All claims expressed in this article are solely those of the authors and do not necessarily represent those of their affiliated organizations, or those of the publisher, the editors and the reviewers. Any product that may be evaluated in this article, or claim that may be made by its manufacturer, is not guaranteed or endorsed by the publisher.
Arimoto, K., MacGowan, I., and Su, Z.-H. (2020). New data on lance flies (Diptera, Lonchaeidae) associated with figs (Moraceae, Ficus spp.) in Japan and Taiwan, with descriptions of two new species of the genus Silba Macquart. J. Asia Pac. Entomol. 23, 364–370. doi: 10.1016/j.aspen.2019.11.007
Berg, C. (1989). Classification and distribution of Ficus. Experientia 45, 605–611. doi: 10.1007/BF01975677
Chakraborty, A., Mahajan, S., Bisht, M. S., and Sharma, V. K. (2022). Genome sequencing and comparative analysis of Ficus bengalensis and Ficus religiosa species reveal evolutionary mechanisms of longevity. iScience 25:105100. doi: 10.1016/j.isci.2022.105100
Chen, H., Chen, J., Yang, H., Chen, W., Gao, H., and Lu, W. (2016). Variation in total anthocyanin, phenolic contents, antioxidant enzyme and antioxidant capacity among different mulberry (Morus sp.) cultivars in China. Sci. Hortic. 213, 186–192. doi: 10.1016/j.scienta.2016.10.036
Chen, R.-F., Xu, L., Yu, M. D., Liu, X.-Q., and Chen, L.-Q. (2010). Determination of the Origin and Evolution of Morus (Moraceae) by Analyzing the Internal Transcribed Spacer (ITS) Sequences. In 2010 4th International Conference on Bioinformatics and Biomedical Engineering. IEEE.
Colwell, R. K., and Lees, D. C. (2000). The mid-domain effect: geometric constraints on the geography of species richness. Trends Ecol. Evol. 15, 70–76. doi: 10.1016/S0169-5347(99)01767-X
Dong, J.-L., Li, Z., Gao, J. X., Sun, B. N., and He, Y. L. (2022). Ficus leaves within the Ficus subgenus Urostigma (Moraceae) from the middle Miocene in South China and their biogeography implications. Rev. Palaeobot. Palynol. 302:104671. doi: 10.1016/j.revpalbo.2022.104671
Elhawary, S. S., Younis, I. Y., el Bishbishy, M. H., and Khattab, A. R. (2018). LC–MS/MS-based chemometric analysis of phytochemical diversity in 13 Ficus spp. (Moraceae): correlation to their in vitro antimicrobial and in silico quorum sensing inhibitory activities. Ind. Crop. Prod. 126, 261–271. doi: 10.1016/j.indcrop.2018.10.017
Ganivet, E., Unggang, J., Bodos, V., Demies, M., Ling, C. Y., Sang, J., et al. (2020). Assessing tree species diversity and structure of mixed dipterocarp forest remnants in a fragmented landscape of North-Western Borneo, Sarawak, Malaysia. Ecol. Indic. 112:106117. doi: 10.1016/j.ecolind.2020.106117
Gardner, E. M., Sarraf, P., Williams, E. W., and Zerega, N. J. C. (2017). Phylogeny and biogeography of Maclura (Moraceae) and the origin of an anachronisticfruit. Mol. Phylogenet. Evol. 117, 49–59. doi: 10.1016/j.ympev.2017.06.021
Hashemi, S., and Khadivi, A. (2020). Morphological and pomological characteristics of white mulberry (Morus alba L.) accessions. Sci. Hortic. 259:108827. doi: 10.1016/j.scienta.2019.108827
He, Y.-H., Gao, P.-L., and Qiang, S. (2019). An investigation of weed seed banks reveals similar potential weed community diversity among three different farmland types in Anhui Province, China. J. Integr. Agric. 18, 927–937. doi: 10.1016/S2095-3119(18)62073-8
Islam, S. M. S., and Rahman, M. S. (2019). Genetic diversity analysis based on morphological characters in mulberry (Morus spp.). J. Biosci. 28, 111–119. doi: 10.3329/jbs.v28i0.44717
Kong, W., Wu, S. H., Wu, X. Q., Zheng, X. R., Sun, X. R., and Ye, J. N.. (2020). First report of leaf spot disease caused by Colletotrichum tropical on Ficus binnendijkii var. variegata in China. Plant Dis. 104:585. doi: 10.1094/PDIS-04-19-0834-PDN
Kumar, A., Bajpai, O., Mishra, A. K., Sahu, N., Behera, S. K., and Chaudhary, L. B. (2011). Assessment of diversity in the genus Ficus L. (Moraceae) of Katerniaghat wildlife sanctuary, Uttar Pradesh, India. American. J. Plant Sci. 2, 78–92. doi: 10.4236/ajps.2011.21011
Machado, A. F. P., Rønsted, N., Bruun-Lund, S., Pereira, R. A. S., and Paganucci de Queiroz, L. (2018). Atlantic forests to the all Americas: biogeographical history and divergence times of neotropical Ficus (Moraceae). Mol. Phylogenet. Evol. 122, 46–58. doi: 10.1016/j.ympev.2018.01.015
Marcotuli, I., Mazzeo, A., Nigro, D., Giove, S. L., Giancaspro, A., Colasuonno, P., et al. (2019). Analysis of genetic diversity of Ficus carica L. (Moraceae) collection using simple sequence repeat (SSR) markers. Acta Sci. Polon. Hortorum Cultus 18, 93–109. doi: 10.24326/asphc.2019.4.9
Martins, L. A. R., Lorenzoni, R. M., Pereira, R. M., de Miranda, F. D., Fontes, M. M., and Carrijo, T. T.. (2021). Genetic diversity and structure of Dorstenia elata (Moraceae) in an Atlantic Forest remnant. Rodriguésia :72.
Nagendra, H. (2002). Opposite trends in response for the Shannon and Simpson indices of landscape diversity. Appl. Geogr. 22, 175–186. doi: 10.1016/S0143-6228(02)00002-4
Oluyinka Christopher, A. (2020). Comparative analyses of diversity and similarity indices of West Bank Forest and block a Forest of the International Institute of Tropical Agriculture (IITA) Ibadan, Oyo state, Nigeria. Int. J. Forest. Res. 2020, 1–8. doi: 10.1155/2020/4865845
Pederneiras, L. C., da Costa, A. F., Medeiros, H., Rivera, N. M., Forzza, R. C., and Romaniuc-Neto, S.. (2020). Species diversity of Ficus L. sect. Americanae (Moraceae) in acre, Brazil. Brittonia 72, 215–231. doi: 10.1007/s12228-020-09620-1
Pielou, E. C. (1966). The measurement of diversity in different types of biological collections. J. Theor. Biol. 13, 131–144. doi: 10.1016/0022-5193(66)90013-0
Ricotta, C., and Avena, G. (2003). On the relationship between Pielou’s evenness and landscape dominance within the context of Hill’s diversity profiles. Ecol. Indic. 2, 361–365. doi: 10.1016/S1470-160X(03)00005-0
Shi, Y., Mon, A. M., Fu, Y., Zhang, Y., Wang, C., and Yang, X.. (2018). The genus Ficus (Moraceae) used in diet: its plant diversity, distribution, traditional uses and ethnopharmacological importance. J. Ethnopharmacol. 226, 185–196. doi: 10.1016/j.jep.2018.07.027
Shukla, G., Rai, P., Abha Manohar, K., and Chakravarty, S. (2020). Quantification of diversity, biomass and carbon storage of climber and liana community in a foothill forest of Indian Eastern Himalayas. Acta Ecol. Sin. 40, 478–482. doi: 10.1016/j.chnaes.2020.09.009
Stuart-Smith, R. D., Bates, A. E., Lefcheck, J. S., Duffy, J. E., Baker, S. C., and Thomson, R. J.. (2013). Integrating abundance and functional traits reveals new global hotspots offish diversity. Nature 501, 539–542. doi: 10.1038/nature12529
Teixeira, S. P., Costa, M. F. B., Basso-Alves, J. P., Kjellberg, F., and Pereira, R. A. S. (2018). Morphological diversity and function of the stigma in Ficus species (Moraceae). Acta Oecol. 90, 117–131. doi: 10.1016/j.actao.2018.02.008
Tittensor, D. P., Mora, C., Jetz, W., Lotze, H. K., Ricard, D., and Berghe, E. V.. (2010). Global patterns and predictors of marine biodiversity across taxa. Nature 466, 1098–1101. doi: 10.1038/nature09329
Wang, H.-F., Xu, X., Cheng, X. L., Liu, Y., Luo, A., and Lyu, T.. (2022). Spatial patterns and determinants of Moraceae richness in China. J. Plant Ecol. 15, 1142–1153. doi: 10.1093/jpe/rtac025
Zerega, N. J., Clement, W. L., Datwyler, S. L., and Weiblen, G. D. (2005). Biogeography and divergence times in the mulberry family (Moraceae). Mol. Phylogenet. Evol. 37, 402–416. doi: 10.1016/j.ympev.2005.07.004
Keywords: Moraceae, spatial diversity, China, geographic information systems, genus
Citation: Lu D, Qiu L, Jiao M, Feng Z and Wang Z (2023) Quantitative analysis of the spatial diversity of Moraceae in China. Front. Ecol. Evol. 11:1110018. doi: 10.3389/fevo.2023.1110018
Edited by:
Yonghao Xu, Institute of Advanced Research in Artificial Intelligence (IARAI), AustriaReviewed by:
Zhijie Wang, Guizhou University, ChinaCopyright © 2023 Lu, Qiu, Jiao, Feng and Wang. This is an open-access article distributed under the terms of the Creative Commons Attribution License (CC BY). The use, distribution or reproduction in other forums is permitted, provided the original author(s) and the copyright owner(s) are credited and that the original publication in this journal is cited, in accordance with accepted academic practice. No use, distribution or reproduction is permitted which does not comply with these terms.
*Correspondence: Meiqi Jiao, bXFqaWFvQDEyNi5jb20=; Zhongke Feng, ZmVuZ3pob25na2VAYmpmdS5lZHUuY24=; Zhichao Wang, WmhpY2hhb0BiamZ1LmVkdS5jbg==
Disclaimer: All claims expressed in this article are solely those of the authors and do not necessarily represent those of their affiliated organizations, or those of the publisher, the editors and the reviewers. Any product that may be evaluated in this article or claim that may be made by its manufacturer is not guaranteed or endorsed by the publisher.
Research integrity at Frontiers
Learn more about the work of our research integrity team to safeguard the quality of each article we publish.