
94% of researchers rate our articles as excellent or good
Learn more about the work of our research integrity team to safeguard the quality of each article we publish.
Find out more
ORIGINAL RESEARCH article
Front. Ecol. Evol., 31 March 2023
Sec. Environmental Informatics and Remote Sensing
Volume 11 - 2023 | https://doi.org/10.3389/fevo.2023.1108118
This article is part of the Research TopicBiodiversity Informatics: Building a Lifeboat for High Functionality Data to Decision PipelineView all 10 articles
 Kerry J. Sink1,2*
 Luther A. Adams1
 Mari-Lise Franken1,3
 Linda R. Harris2
 Jock Currie1
 Natasha Karenyi3,4Anisha Dayaram1,5Sean Porter6
 Stephen Kirkman2,7Maya Pfaff3,7
 Lara van Niekerk2,8Lara J. Atkinson3,9Anthony Bernard10
 Mariel Bessinger1
 Hayley Cawthra11Willem de Wet12Loyiso Dunga1,3
 Zoleka Filander7
 Andrew Green13David Herbert14Stephen Holness2
 Stephen Lamberth2,15Tamsyn Livingstone16Melanie Lück-Vogel8,17Fiona Mackay6
 Mapula Makwela18Ryan Palmer10Wilhem Van Zyl11
 Andrew Skowno1,3
South Africa has taken an iterative approach to marine ecosystem mapping over 18 years that has provided a valuable foundation for ecosystem assessment, planning and decision-making, supporting improved ecosystem-based management and protection. Iterative progress has been made in overcoming challenges faced by developing countries, especially in the inaccessible marine realm. Our aim is to report on the approach to produce and improve a national marine ecosystem map to guide other countries facing similar challenges, and to illustrate the impact of even the simplest ecosystem map. South Africa has produced four map versions, from a rudimentary map of 34 biozones informed by bathymetry data, to the latest version comprising 163 ecosystem types informed by 83 environmental and biodiversity datasets that aligns with the IUCN Global Ecosystem Typology. Data were unlocked through academic and industry collaborations; multi-disciplinary, multi-realm and multi-generational networks of practitioners; and targeted research to address key gaps. To advance toward a more transparent, reproducible and data-driven approach, limitations, barriers and opportunities for improvement were identified. Challenges included limited human and data infrastructure capacity to collate, curate and assimilate many data sources, covering a variety of ecosystem components, methods and scales. Five key lessons that are of relevance for others working to advance ecosystem classification and mapping, were distilled. These include (1) the benefits of iterative improvement; (2) the value of fostering relationships among a co-ordinated network of practitioners including early-career researchers; (3) strategically prioritizing and leveraging resources to build and curate key foundational biodiversity datasets and understand drivers of biodiversity pattern; (4) the need for developing, transferring and applying capacity and tools that enhance data quality, analytical workflows and outputs; and (5) the application of new technology and emerging statistical tools to improve the classification and prediction of biodiversity pattern. South Africa’s map of marine ecosystem types has been successfully applied in spatial biodiversity assessment, prioritization to support protected area expansion and marine spatial planning. These successes demonstrate the value of a co-ordinated network of practitioners who continually build an evidence base and iteratively improve ecosystem mapping while simultaneously growing ecological knowledge and informing changing priorities and policy.
The classification and mapping of ecosystem types is foundational to their assessment and effective management (Borja et al., 2010; Galparsoro et al., 2012; Keith et al., 2022). Developing ecosystem classification frameworks and typologies can also provide an opportunity to ‘marshal’ biodiversity data and knowledge to inform efficient and appropriate action (Keith et al., 2020). As such, one of the key purposes of classifications is to simplify the complexity of biodiversity data into synthesized spatial information that is fundamental for reporting and management (Nikolopoulou et al., 2021). The main objectives for classifying ecosystems include providing: (i) surrogates to represent biodiversity patterns; (ii) ecologically relevant units to support management and planning; and (iii) ecosystem units that can support ecosystem service and accounting work (Dayaram et al., 2021). Applications of ecosystem classification and mapping outputs include those related to assessment, monitoring, spatial biodiversity planning, allocating environmental flows and natural capital accounting (Bland et al., 2017; Bogaart et al., 2019; Botts et al., 2020).
Globally, there have been multiple efforts to classify and map marine regions, habitats and ecosystem types (Gregr and Bodtker, 2007; Longhurst, 2007; Howell, 2010; Last et al., 2010; Gregr et al., 2012; Hu et al., 2021; Nikolopoulou et al., 2021). Approaches include those with a focus on biogeography (Spalding et al., 2007) or bio-physical habitats (McArthur et al., 2010; Sayre et al., 2017; Nikolopoulou et al., 2021), with more capacitated countries possessing substantial datasets increasingly applying statistical methods to support classification, mapping and dissemination (Costello, 2009; Dove et al., 2018; Gerovasileiou et al., 2019). In the context of this paper, ecosystems are considered as functionally connected complexes of living organisms and their non-living environment (often referred to as habitat), and it is recognized that ecosystems can be classified at multiple scales. It is also important to acknowledge the limitations of mapping continuous ecological patterns as distinct polygons that may be less discrete in reality (Keith et al., 2022). Despite the challenges and limitations, national maps of marine ecosystem types or marine ecosystem maps (MEMs) help scientists and managers to organize biodiversity information into spatially discernable units that can support spatial assessment and planning (Dove et al., 2018).
In 2020, the IUCN released a Global Ecosystem Typology (IUCN GET) “to support global, regional and national efforts to assess and manage risks to ecosystems” (Keith et al., 2020, 2022). The IUCN GET provides a globally consistent classification of ecosystems underpinned by ecosystem functioning that spans all realms and the entire biosphere. The typology is hierarchical and developed by top-down classification of biomes within each realm with functional ecosystem groups, but can also accommodate local-scale classifications, including those developed by bottom-up approaches that dovetail with the ecosystem functional groups (Keith et al., 2020). It includes indicative maps of the global distribution at the third hierarchical level (Ecosystem Functional Groups), and there are ongoing efforts to map selected ecosystem types at a biogeographic ecotype level (the fourth hierarchical level). For national applications, more detailed maps at hierarchical levels 4 (biogeographic ecotypes), 5 (global ecosystem types) or 6 (local ecosystem types) are required. The classification and mapping of ecosystems at a national or greater scale is challenging, because of the diversity of ecosystems involved, lack of data availability and coverage, limitations in understanding the drivers of ecosystem pattern, and discrepancies in knowledge among different types of ecosystems (Keith et al., 2022). These challenges are exacerbated in developing countries where there are often less financial and human resources to support strategic biodiversity data collection, analyses and translation of technical outputs into decision-support tools.
Marine ecosystem classification and mapping lags far behind the equivalent efforts on land. The collection of marine biodiversity and environmental data is particularly difficult, because the sea is less accessible (and most of it opaque to satellites) compared to the terrestrial and fresh-water realms (Roberson et al., 2017; Smit et al., 2022; Bell et al., 2022a). Ecosystem mapping is more complex in the marine realm because the ocean environment is three-dimensional, fluid with few prominent boundaries that limit connectivity, and can be highly variable and dynamic (Howell, 2010; Roberson et al., 2017; Sayre et al., 2017; Sink et al., 2019). The costs associated with deep-sea research increase exponentially with increasing depth, resulting in a rapid decrease in data at greater depths (Bell et al., 2022a,b). Furthermore, the technical skills needed to collect, process and disseminate relevant marine geological, oceanographic and biodiversity data are often limited or concentrated within isolated research groups. Different disciplines of marine science have often operated in silos, focused in different areas or conducted research at different scales, which has limited multi-disciplinary collaborative utility. Moreover, oceanographers or marine geoscientists rarely rely on biodiversity data, but ecosystem mappers rely on oceanographic, bathymetric and geological data that complement biodiversity datasets. These different types of data products rarely align in space and time.
South Africa presents a unique opportunity to report on the process and progress in advancing marine ecosystem mapping and is a relevant case study for three reasons. Firstly, we have an established record in harnessing biodiversity data to support systematic biodiversity assessment and conservation planning (e.g., Balmford et al., 2002; SANBI and UNEP-WCMC, 2016; Botts et al., 2019; Skowno et al., 2019; Holness et al., 2022), often leading to implementation success (Botts et al., 2019; Sink et al., 2019; Harris et al., 2022a; von Staden et al., 2022). Secondly, South Africa has three ocean systems: the Indian, Atlantic and Southern Oceans, with a high associated diversity of ecosystems and species (Gibbons, 1999; Costello et al., 2010; Griffiths et al., 2010) that exemplify the challenges in classifying and mapping many different ecosystem types. Thirdly, as a developing country, we can provide relevant lessons for other countries requiring evidence to support sustainable development of their ocean economies, but due to resource and capacity constraints, are faced with different challenges and opportunities to those of more developed nations (Smit et al., 2022). In addition, South Africa’s national MEM has been adjusted for improved alignment with global typologies where appropriate, and comparisons of classifications at multiple scales provide opportunities for joint learning and adjustments of classifications and typologies.
We aim to report on South Africa’s approach to produce and improve the national MEM as a foundation for assessment, planning and ecosystem-based management of the marine realm. The objectives are: (1) to document the process, results and application of the map; (2) to report key limitations, barriers and challenges; and (3) to identify enabling factors and opportunities for more transparent, data-driven and repeatable improvements. In doing so, we contribute an approach to collate, collect, share and integrate multi-disciplinary data to iteratively improve maps of marine ecosystem types in a developing-country context. Because this paper shares lessons from iterative development over the past two decades and also reports on future plans, it departs from the standard paper format and presents methods, results and reflections on several components before distilling key lessons. In so doing, we demonstrate a collaborative approach to iteratively improve ecosystem maps to feed into a national system that synthesizes biodiversity data and knowledge to support biodiversity assessment, spatial planning, decision-making and protection.
The study area is South Africa’s mainland maritime domain (i.e., territorial seas plus exclusive economic zone), which extends from the dune base (Harris et al., 2019) to 200 NM seaward (Figure 1). The width of the continental shelf varies between 1.3 and 260 km, and the depth of the shelf break ranges between 80 and 600 m (de Wet and Compton, 2021). The western continental margin is wide and deep and terraced in places (de Wet and Compton, 2021), and tapers in a southern-easterly direction. The southern continental margin includes the wide Agulhas Bank resembling the outline of the South African shoreline, and abruptly tapers to the eastern continental margin, which lies parallel to the coastline. Slope and abyssal depth zones account for more than 60% of the mainland maritime domain. This paper does not cover the classification developed for the Prince Edward Island territory (Whitehead et al., 2019) or the estuarine realm (van Niekerk et al., 2020), and the coast as a cross-realm zone is also considered elsewhere (Harris et al., 2019).
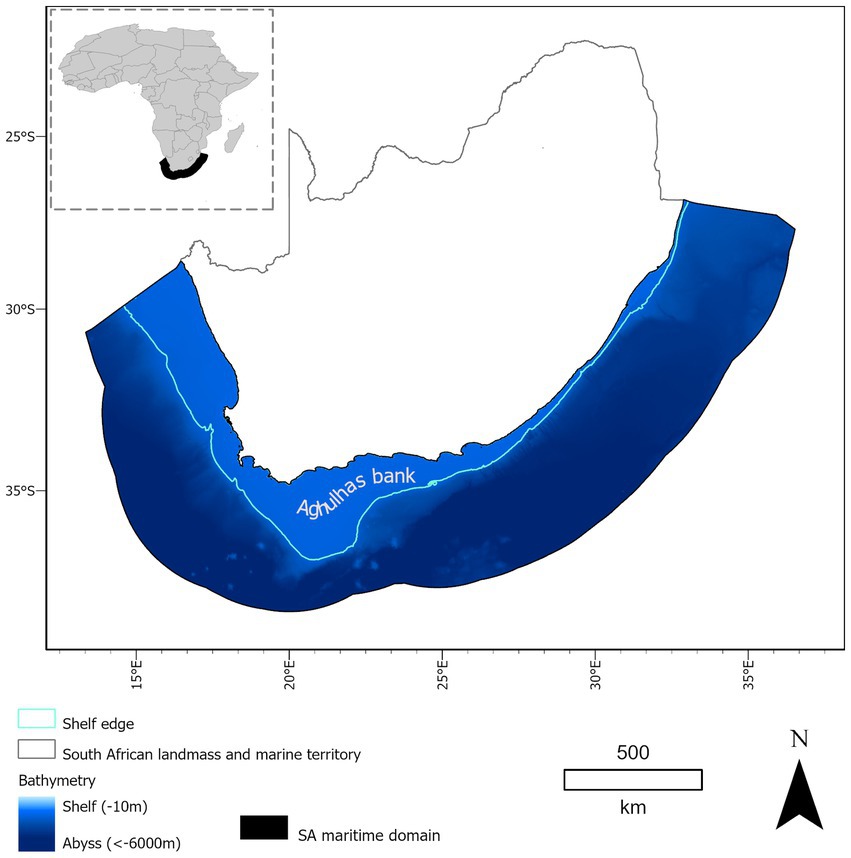
Figure 1. Map of the study area showing the marine realm of South Africa’s mainland territory.
South Africa’s approach to coordinate, guide and advance ecosystem classification and mapping has developed, evolved and iteratively improved over time. A key driver of this process has been the series of three National Biodiversity Assessments (NBAs) that South Africa has undertaken over the past two decades (Driver et al., 2005, 2012; Skowno et al., 2019), with recent changes in the ecosystem map undertaken to facilitate alignment with the IUCN GET (Keith et al., 2020, 2022). The first National Biodiversity Assessment (2003–2005) brought scientists together to discuss marine bioregions and spatial biodiversity data for assessment and planning for the first time (Lombard et al., 2005). Ecosystems were assessed at a scale of 34 broad biozones (broad categories reflecting main biogeographic and depth zones) across the seascape, and although a finer-scale national map of ecosystem types was not yet developed, digitization of existing hard-copy maps of relevant features such as sediment and submarine canyons was initiated. The biozone map (MEM 2004) can be considered as a precursor to an ecosystem map proper, but nevertheless was used to determine the two headline indicators in South Africa’s NBAs: ecosystem threat status and protection level (Skowno et al., 2019).
Further advances in data collation and mapping were made (2006–2011) through a project working to identify and support implementation of an ecologically representative offshore marine protected area network (Sink, 2016; Roberson et al., 2017; Kirkman et al., 2021). The MEM 2011 (Sink et al., 2012) was produced through collaborations from 25 organizations facilitated by a series of workshops that were part of the assessment process (2009–2011). At these workshops, initial habitat classifications initiated in the 2004 assessment and global efforts in this context were discussed, the pelagic ecosystem classification developed from cluster analysis of sea-surface data (now published as Roberson et al., 2017) was reviewed, and reef classifications were considered. The most recent NBA (Sink et al., 2019) produced a revised map of marine ecosystem types, MEM 2018, based on additional collated data, and minor changes were made for MEM 2022 to improve alignment with the IUCN GET (Keith et al., 2020). There have thus been four versions of the MEM, with MEM 2022 being most advanced and described in more detail in this paper (Figure 2), each discussed in more detail in Sections 2.4–2.6.
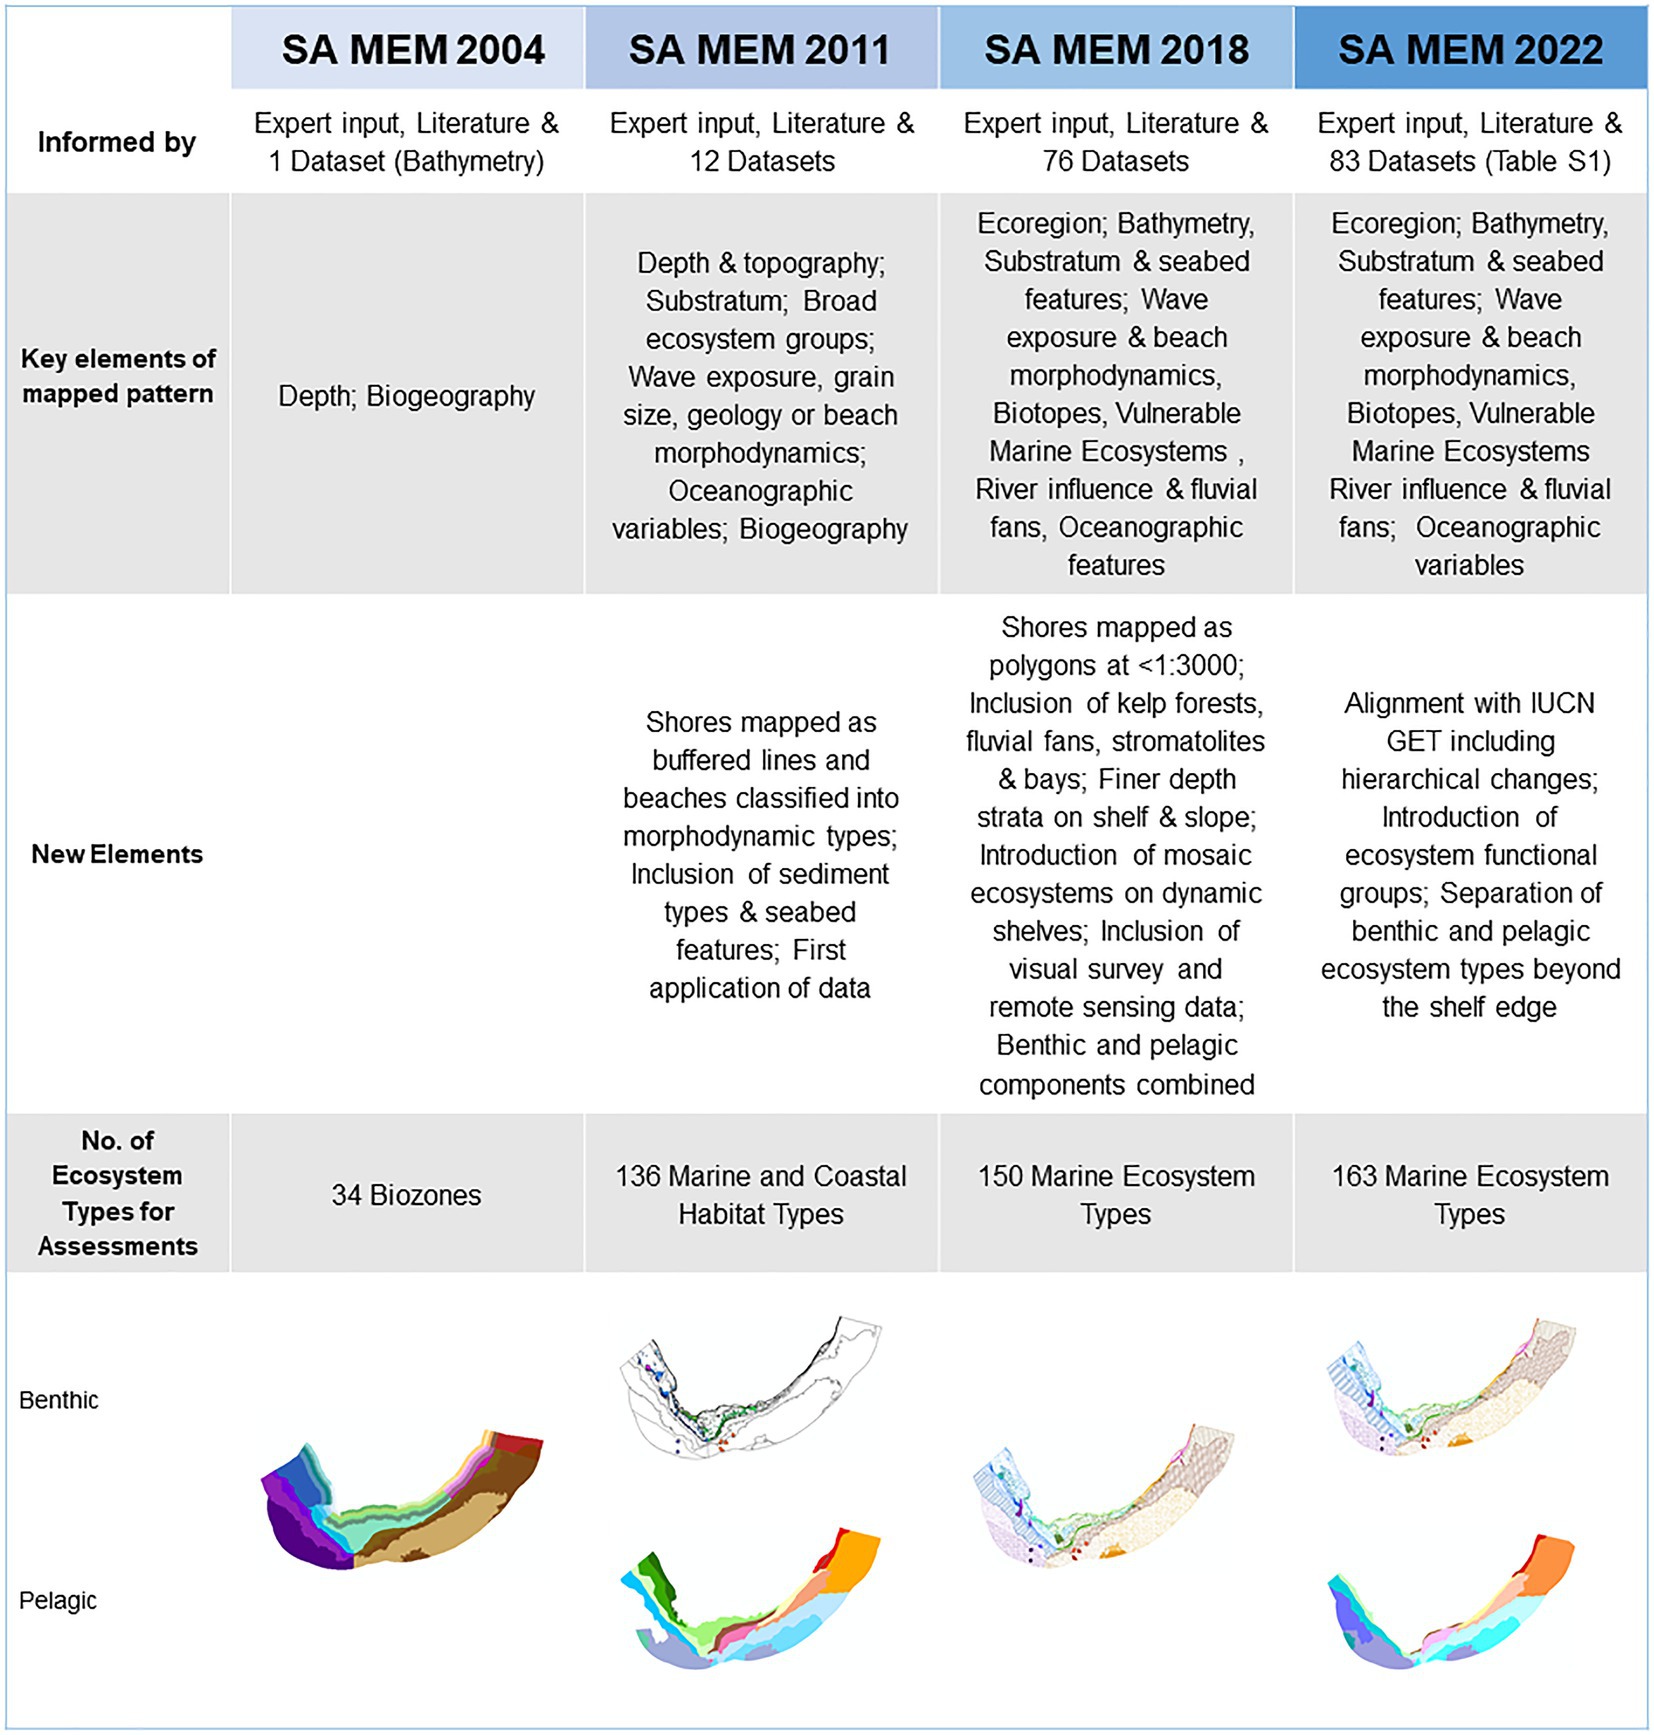
Figure 2. Schematic illustrating the evolution of South Africa’s national marine ecosystem map (SA MEM) used to assess ecosystem threat status and protection level between 2004 and 2022 in South Africa. This evolved from a literature- and expert-based approach to a data-informed but expert-driven method drawing from 83 multi-disciplinary datasets with recent changes to align with the IUCN Global Ecosystem Typology (IUCN GET). Note that the key elements of mapped patterns are listed hierarchically as they were applied in the classification.
The team and governance arrangements to support ecosystem classification and mapping have also evolved over time, with ongoing efforts to improve representation, capacity and coordination. Initial efforts were informal with South Africa’s first Marine Ecosystem Committee, formalized in 2015, drawing from experience in the terrestrial realm (Dayaram et al., 2021) and the collaborations that advanced the map of marine ecosystem types for the NBA 2011. A clear terms of reference was developed (Supplementary material) and potential members were approached or nominated from key organizations and departments. The Marine Ecosystem Committee was tasked with: (1) facilitating collaboration between institutions and individuals involved in regional and national marine ecosystem classification, mapping and description; (2) agreeing on the purpose, approach, data sources and methods for classifying and mapping marine ecosystems in South Africa; (3) supporting compatibility and alignment (spatially and conceptually), with the national vegetation map, the national estuary map and more recently, the emerging IUCN GET; and (4) assisting with decisions pertaining to the curatorship, update and changes in the national marine ecosystem classification system and map, including the review of protocols and procedures. Due to the substantial volume of work involved in advancing this task, a less formal broader network was then developed in 2018 with multiple task teams to advance more specific, focal areas (Figure 3). The inclusion of an emerging researcher task team helped develop long-term capacity, tackle specific research questions and diversify perspectives and approaches including the application of more modern methods in ecosystem classification and mapping (Supplementary material).

Figure 3. Ecosystem classification governance structures pertinent to the marine realm in South Africa. Marine ecosystem classification and mapping is led by a Marine Ecosystem Committee guided by a cross-realm National Ecosystem Committee (orange) but supported by other coastal committees (green) and the marine ecosystem network that includes nine task teams, seven of which are thematic (blue), one cross-cutting (black), and one dedicated to emerging researchers (yellow). VME refers to Vulnerable Marine Ecosystems.
South Africa’s current ecosystem committees and the associated network that advance marine classification and mapping are shown in Figure 3. A National Ecosystem Committee guides the body of work across realms and ensures consistent principles and alignment in classifications and maps. Realm-specific committees lead and coordinate the work of each realm (terrestrial, river, wetland, estuarine and marine). Each committee has broad institutional and ecosystem representation and a chair. These chairs also serve on the National Ecosystem Committee, which is also where, inter alia, issues pertaining to the cross-realm coastal zone are discussed and resolved. Sharing of experience across realms has supported consistency in conceptual approaches, learning across realms, and standardization in governance.
The work of the Marine Ecosystem Committee is supported by a less formal marine ecosystem network that comprises nine task teams (Figure 3), including seven thematic task teams, a cross-cutting team, and a dedicated emerging researchers task team to ensure that the skills and relationships are cultivated in the next generation of scientists who will advance this work. This task team consists of an inclusive group of early career scientists and postgraduate students who volunteer or are invited to collaborate and develop skills in the ecosystem classification and mapping process. The emerging researchers also participate in one or more of the thematic task teams and are invited to all Marine Ecosystem Committee meetings. Task teams have an elected lead and the leads make up the Marine Ecosystem Committee together with additional members to ensure institutional representation. The cross-cutting task team supports alignment between task teams within the network and the classification and mapping of transitional ecosystem types (Keith et al., 2020), coastal ecosystem types, and other ecosystems like bays that are challenging to incorporate in the classification scheme. The leads of the terrestrial (based largely on national vegetation types) and estuarine committees form part of the marine ecosystem network. All these committees and task teams are governed by specific terms of reference (Supplementary material). Task teams work informally and advance work through email, research collaborations and dedicated meetings. They are independently convened but the leads report to the Marine Ecosystem Committee that meets annually. Annual meetings of the network and some task teams were supported by government funding (less than $500 per year) with actual field expenses and analyses funded by organizations supporting members of the network and project funding. The COVID-19 pandemic caused all meetings to move online and this eliminated travel and meeting expenses. Proposed amendments to the ecosystem classification map are presented for deliberation and decision by the Marine Ecosystem Committee. Where consensus is not reached within a realm-specific committee, the National Ecosystem Committee undertakes final decision making.
South Africa’s maps of ecosystem types aim to simplify biodiversity into spatially distinct units that represent areas of more cohesive biodiversity pattern. They are discernable by the main factors influencing their composition, structure and function (Dayaram et al., 2021). South Africa follows a hierarchical approach in ecosystem classification. The marine classification hierarchy and the incorporation of ecosystem types has evolved over time (see overview above). The precursor to the ecosystem types map nested tidal, topographic and depth strata within 10 bioregions (Lombard et al., 2005), but the 2011 scheme nested broad ecosystem groups (similar to the IUCN level 3 Ecosystem Functional Groups; EFGs) within depth zones, which were sub-classified using biogeography in an approach more similar to the marine typology described by Keith et al. (2020). In 2018, the Marine Ecosystem Committee took a decision to nest ecosystem types within ecoregions (Sink et al., 2019). In 2022, the classification and hierarchy was reorganized to align with the emerging IUCN Global Ecosystem Typology 2.0 (Keith et al., 2020, 2022). South Africa considers the IUCN GET marine biomes as bathomes because of their focus on depth zones rather than biomes, which should consider broader elements, such as ecosystem function, biogeographic patterns and evolutionary history (Mucina, 2019). The marine ecosystem committee discussed implications before amendments were implemented and reviewed the IUCN framework in 2020, proposing some adjustments. Meetings were held between committee members and members of the IUCN team to explore alignment and discuss challenges.
In 2022, South Africa adopted the IUCN’s hierarchical classification system with minor modifications to create an updated hierarchy for South Africa’s marine ecosystems (Figure 4). The IUCN GET recognizes 6 levels, 5 of which were used in South Africa. Within the marine realm (level 1), the 4 marine biomes (level 2) specified by Keith et al. (2020) were adopted (but considered as bathomes): Shore, Shelf, Deepsea Benthic and Pelagic. To match the IUCN typology, a level of EFGs was developed with each type assigned into a relevant GET EFGs, with the exception of bays which are temporarily considered as a distinct additional EFG (level 3). The EFGs are a central concept in the IUCN GET, which classifies ecosystem types on the basis of function rather than through a biogeographical or biophysical lens (Keith et al., 2022).
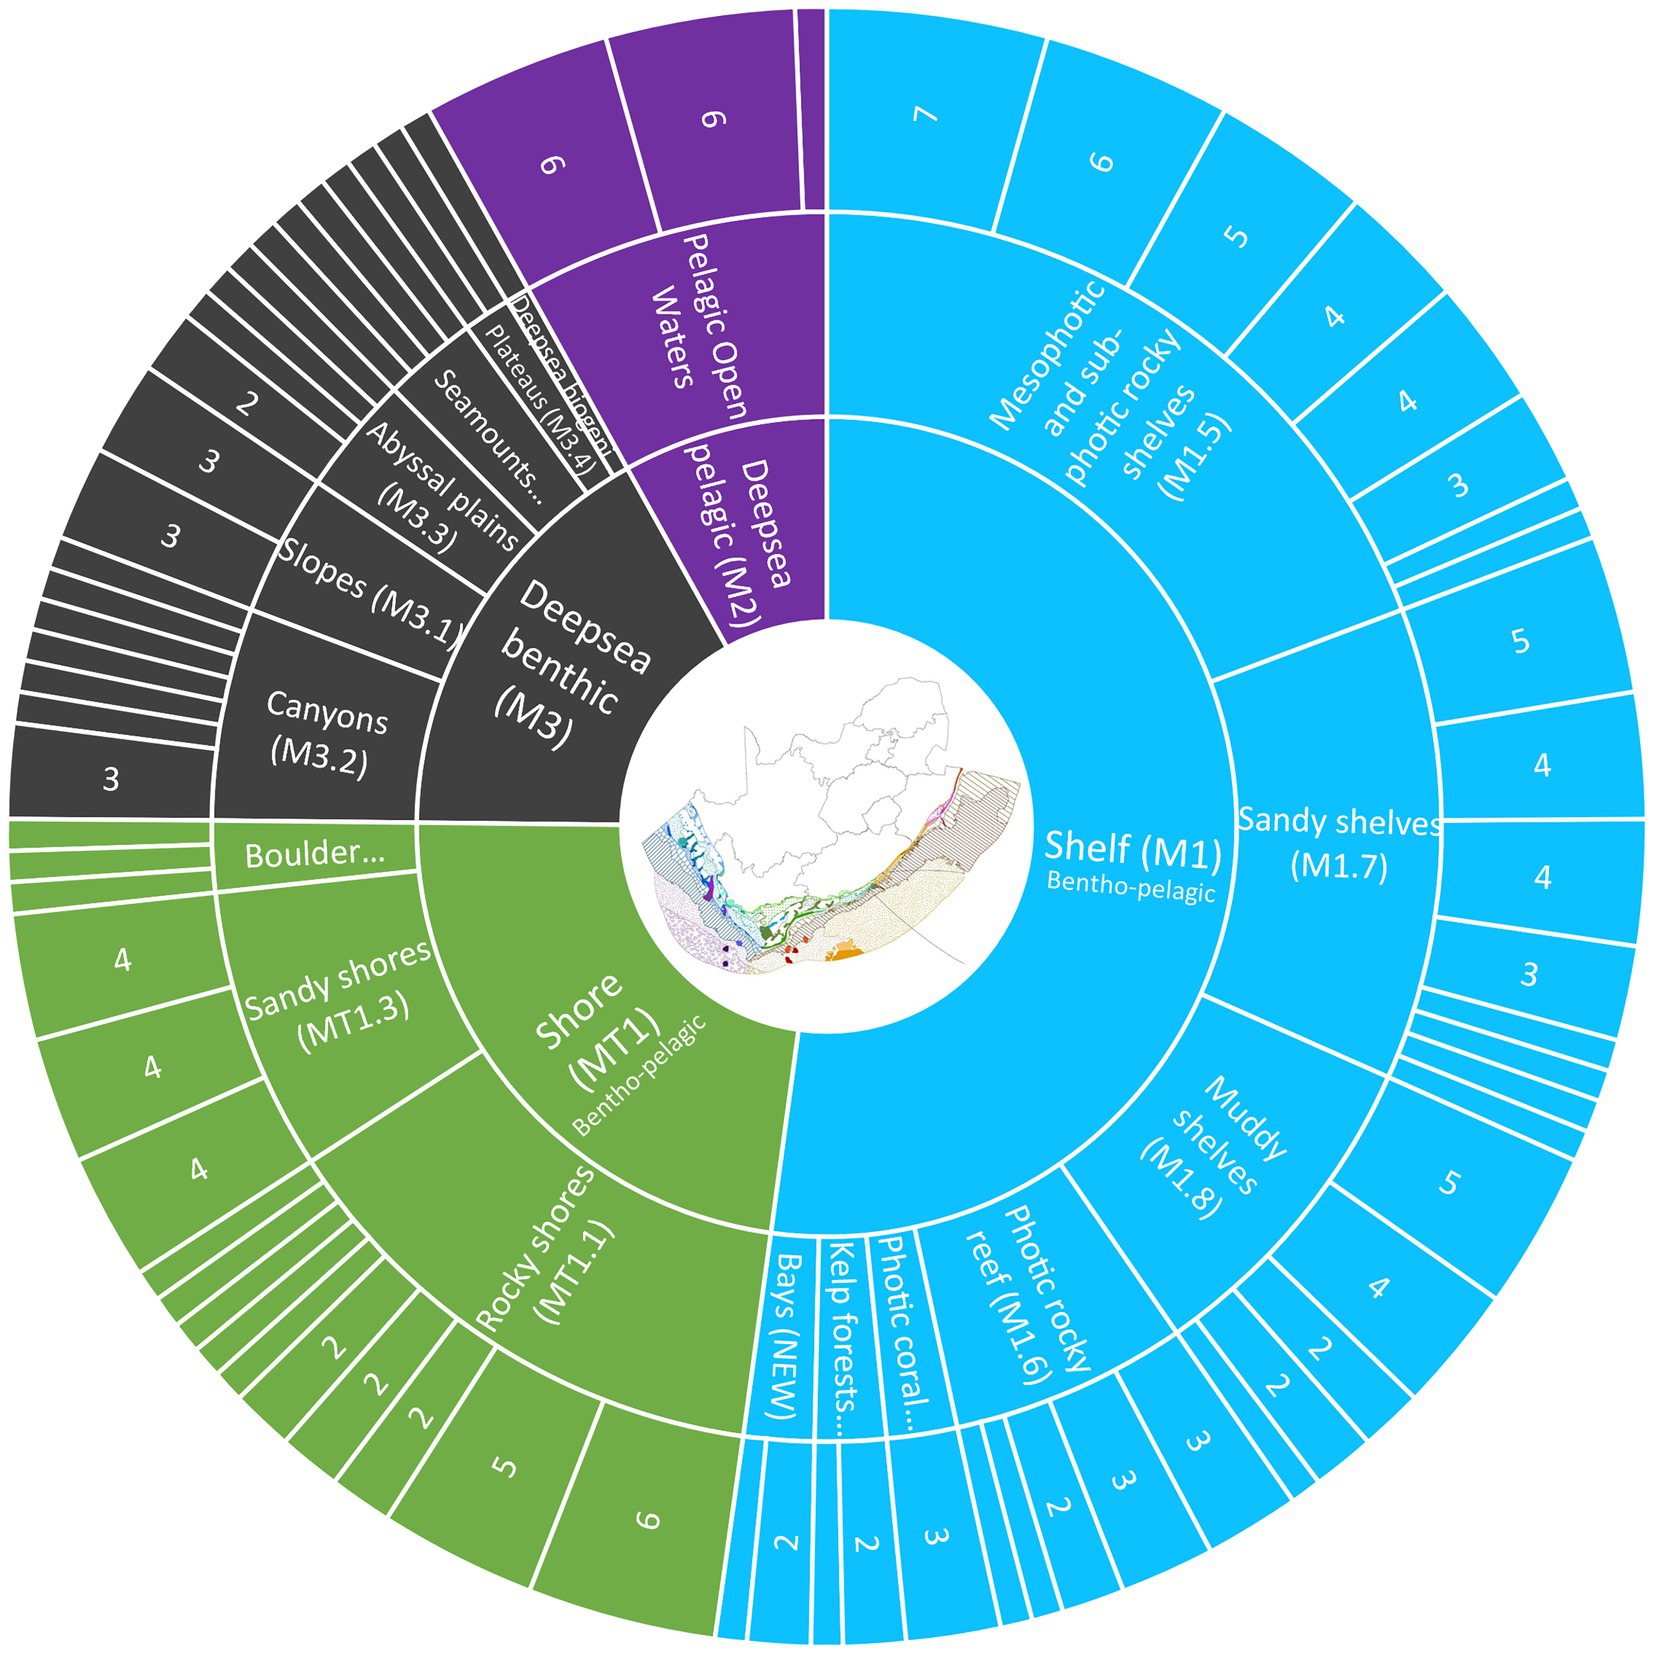
Figure 4. Overview of South Africa’s latest marine ecosystem classification with four bathomes (inner ring), 17 Ecosystem Functional Groups (central ring) nested within the four bathomes 58 biogeographic ecotypes (segments in outer ring) and 163 national marine ecosystem types (not shown as a distinct ring). The number and relative width of each segment in the outer ring reflects the number of national marine ecosystem types nested within each of the biogeographic ecotypes. Where there is no number, there is only one ecosystem type associated with that biogeographic ecotype. Note that the shore and shelf do not separate into benthic and pelagic components but the deepsea includes overlapping benthic and pelagic layers (see Table 1).
We did not make use of some functional groups within the marine IUCN GET because these types are not known to occur in the study area (e.g., muddy shores and hadal ecosystems >6,000 m), fall into other realms (e.g., coastal shrubland and grassland, which are beyond the extent of the marine ecosystem map), there is insufficient data to map them (shellfish beds, reefs and chemosynthetically based ecosystems), or the EFG was too broad and contained multiple EFGs (e.g., upwelling shelves). We also did not apply artificial shorelines, which are mapped as the historical natural ecosystem type, so that coastal development could be mapped as a pressure and that portion of the ecosystem extent reported as lost in a threat assessment.
The fourth level in our classification is made up of 58 biogeographic ecotypes nested within the EFGs (consistent with the IUCN typology). We did not attempt to define global ecosystem types (IUCN GET level 5). As such, the lowest and 5th level in our typology is made up of the national ecosystem types, which relate to ‘local ecosystem types’ in the 6th level of the IUCN GET.
The most contentious areas in South Africa’s work has been in nesting different components related to biogeography and depth, coupling or separating benthic and pelagic elements, and the challenges in classifying and mapping more connected or transitional ecosystem types. Depth and biogeography are universal elements in most marine and seabed classification schemes (Howell, 2010; Keith et al., 2020; Swanborn et al., 2021), with many separating biogeographic elements before depth. This was regularly debated and alternated between years in South Africa, but like the IUCN GET, the committee considered depth and topography (bathome) to be a more important driver of differences in biodiversity pattern than other assembly drivers, such as substratum, nutrients, oceanographic variables, disturbance regimes, and biotic interactions (Howell, 2010; Keith et al., 2022).
Bays also elicited substantial discussion. Although there is recognition of the distinct processes that operate in bay systems, there is less evidence that these translate into notable differences in community composition, structure and function. There were requests to distinguish different ecosystem types within bays (such as sandy shelves, kelp forests, and reefs) from those outside bays, by scientists and managers working at different scales. Islands and lagoons also posed challenges with South Africa’s only marine lagoon transferred to the estuarine realm in 2018, in recognition of the groundwater flow that influences ecosystem functioning (Whitfield, 2005).
The IUCN classification does not cater for mixed shores or the mosaic shelves that are recognized in the South African classification. Discussions with the IUCN GET team indicated that the absence of a mixed shore Ecosystem Functional Group was an oversight rather than a deliberate omission in the typology. We are currently exploring whether it is more appropriate to split mixed shores into sandy, rocky or boulder and cobble types, based on the dominant shore type, and to align with the existing groups, or to propose addition of a mixed shore Ecosystem Functional Group to the IUCN GET. This decision not only requires a better understanding of the biodiversity pattern in space and time within these systems but also improved ecological information on ecosystem functioning, species interactions and connectivity across habitats. Emerging research results have shown that many parts of the shelf, especially in the high current eastern margin, are more dynamic than anticipated. Rocky areas experiencing regular sand inundation host assemblages that are distinct from sandy and muddy areas where rocky substrate is absent, although the mosaic systems host a subset of species that characterize higher profile and more permanently rocky habitats (Porter et al., 2017; Supplementary material).
South Africa’s deep shelf, extending to 600 m in parts of the western margin (Sink et al., 2019) also posed challenges in aligning with international classification schemes such as the IUCN GET, which does not accommodate subphotic reefs on the shelf. South Africa combined mesophotic and subphotic reefs and assigned the IUCN GET code for photo-limited marine animal forests (M1.5 Keith et al., 2020), but recognize the need for further work in collaboration with the IUCN GET team.
Accommodating the three-dimensional and dynamic nature of the ocean in ecosystem typologies and maps is particularly challenging (Porter et al., 2017). South Africa separated benthic and pelagic elements in 2011 but re-combined these in 2018 due to challenges linked to apportioning impacts in coupled benthic-pelagic ecosystems in the 2018 assessment (Sink et al., 2019) and because overlapping ecosystem types raised concerns from managers and practitioners working to advance ecosystem accounting. One of South Africa’s key fisheries, the demersal hake trawl fishery targets bentho-pelagic hake Merluccius capensis and M. paradoxus which feed in the water column but rests on the seabed (Pillar and Barange, 1995; Huse et al., 1998), and trawling (benthic and mid-water) affects both benthic and pelagic ecosystem components. Managers were particularly concerned about the complexity that would be caused by introducing four overlapping pelagic classes (epipelagic, mesopelagic, bathypelagic, and abyssopelagic, as per the IUCN GET) in addition to a benthic component, and scientists indicated that there was insufficient data to reliably classify the vertical component in South Africa at this stage. However, in 2022, benthic and pelagic elements were separated beyond the shelf edge to align with the IUCN GET (Table 1).
This was feasible because South Africa had undertaken a pelagic bioregionalization in 2010 to support the development of a representative Marine Protected Area network (Roberson et al., 2017), and assessed ecosystem threat status for 13 pelagic ecosystem types in 2011 (Sink et al., 2012). The 500 m depth boundary used to delineate the area beyond the shelf edge where separate benthic and pelagic layers were introduced, was a pragmatic decision noting that the depth of the shelf break varies mostly between 100 and 500 m in South Africa (de Wet and Compton, 2021). Note that three of the pelagic ecosystem types (Aa1, Ab1, and Ab2) defined by Roberson et al. (2017) were excluded as pelagic ecosystem types in the 2022 map, because these are confined to the shelf where all ecosystem types are considered bentho-pelagic. A better understanding of vertical stratification, benthic-pelagic coupling in different bathomes and ecosystem functional groups and the impact of pressures across recognized vertical components, is needed. More international collaboration in resolving pelagic ecosystem pattern, process and functioning could benefit global and national ecosystem classification and mapping efforts.
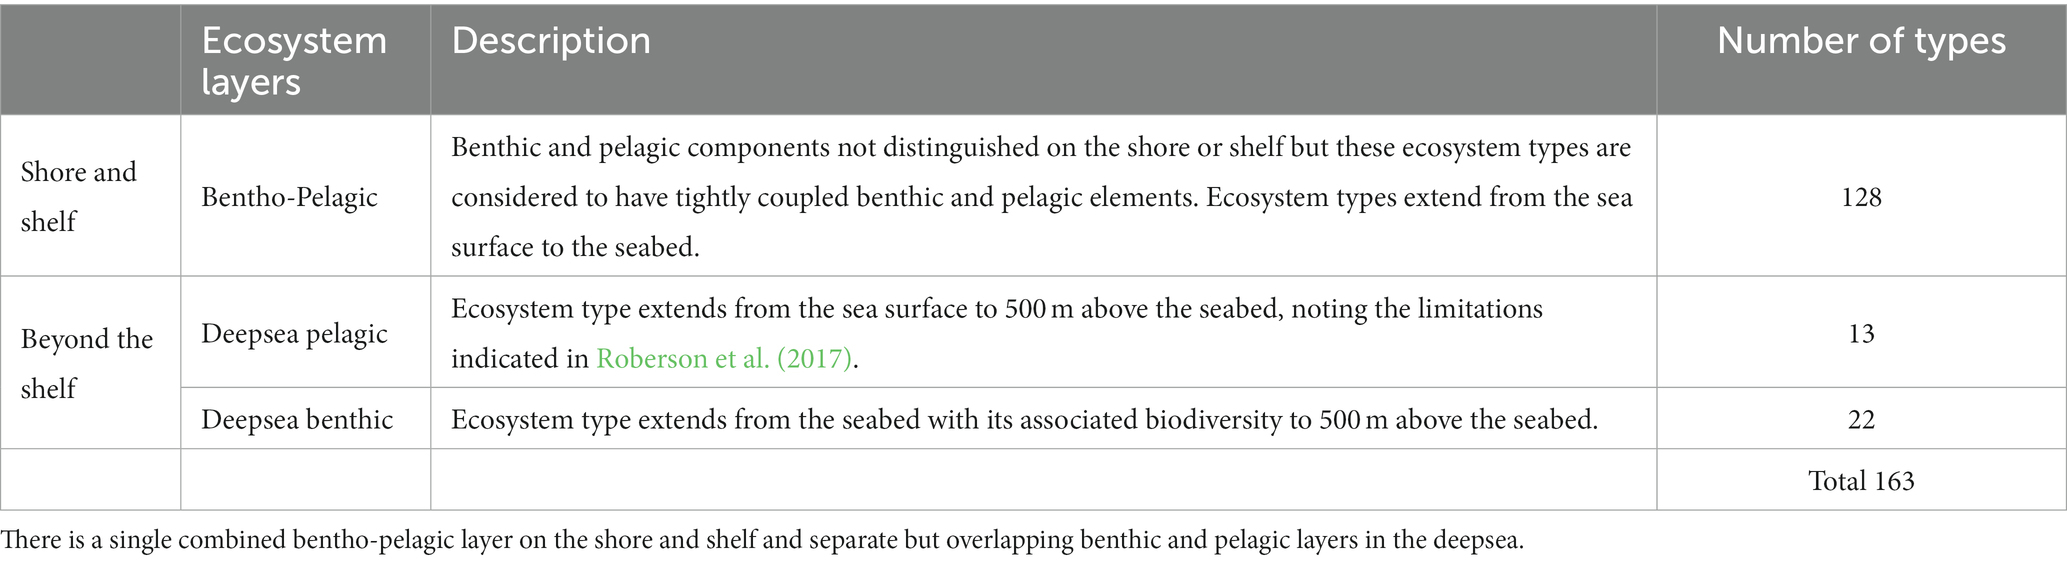
Table 1. Description of vertical stratification in South Africa’s 2022 marine ecosystem map.
The MEM 2004 classification was based only on literature and expert input, but initiated mapping of some features for which data were readily accessible (see Lombard et al., 2005 for details). Intertidal habitats were mapped by digitizing the shoreline from 1:50000 topo-cadastral maps, split into 12 habitats based on several expert-based maps (e.g., wave exposure) and/or hard-copy maps (e.g., Jackson and Lipschitz, 1984). Offshore sediment and seabed features (seamounts and submarine canyons) were also mapped, drawing from published geological and sediment maps (Birch et al., 1986; Dingle, 1986; Dingle et al., 1987), untrawlable grounds (data provided by the fisheries department), and unpublished canyon maps from academics.
The MEM 2011 drew from these and other data sources, including additional substrate, geology and oceanographic datasets (Sink et al., 2012). Because beaches were represented in 2004 as ‘sand’, a dedicated effort went into improving representation of beach morphodynamic types (Harris et al., 2011). The scale and accuracy of the shoreline was also improved by mapping a consistent midshore line on SPOT5 satellite imagery (Harris et al., 2011) that corrected errors introduced in 2004 from mapping the symbology for different shore types off the 1:50000 topo-cadastral maps. Substrate (e.g., rocky, sandy, muddy, gravel, mixed), wave exposure (sheltered, exposed, or very exposed), grain size, and biogeography were used to classify 58 coastal and inshore habitat types (Sink et al., 2012). Depth and slope, substrate, geology (e.g., sandy, muddy, gravel, reef, hard grounds, canyons, and ferro-manganese deposits), and biogeographic data were used to map 62 offshore benthic habitats (Sink et al., 2012). Sea surface temperature, primary productivity and chlorophyll-a content, depth, turbidity, frequency of eddies, and distribution of temperature and chlorophyll-a fronts were used to map 16 offshore pelagic ecosystem types (Roberson et al., 2017).
Between 2013 and 2018, experts identified and prioritized key datasets (Supplementary Table S1) to represent established marine biodiversity surrogates drawing from relevant international literature (e.g., Last et al., 2010; Briggs and Bowen, 2012; Spalding et al., 2012; Douglass et al., 2014; Sutton et al., 2017; Sink et al., 2019). New datasets, including contemporary and historical data, were discovered or made accessible through collaborations with academics, government and industry partners. A total of 83 datasets were used, including: shore maps (n = 1), remote sensing data (n = 2), bathymetric data (n = 7), geoscience data (n = 35), sediment data (n = 13), historical data that could inform seabed types (n = 2), visual survey datasets (n = 8), biotope data that classified biological assemblages (n = 7), a dataset for Vulnerable Marine Ecosystems [VMEs as defined by FAO (2009)] (n = 1) and oceanographic data (n = 8; Supplementary Table S1). Of these, 67 datasets were of abiotic variables, 16 of biotic variables, and one of mapped ecosystem types (shores). These data sets include different spatial and temporal resolutions that influence the quality and granularity of ecosystem mapping efforts. Where finer resolution abiotic data or biodiversity data were available these took precedence over coarser grained or environmental data. This meant that the better sampled shore and shelf and some finer resolution or granular ecosystem types (e.g., reefs and kelp forests) were mapped at a higher resolution than deep sea or broad scale ecosystem types (e.g., abyssal plains and pelagic habitats; Supplementary Figure S1).
Shores were delineated using expert mapping and remote sensing in a separate process for direct use in MEM 2018. Importantly, there was fine-scale delineation (<1:3000) of the shores to their actual extent (dunebase to the back of the surf zone) and the marine, estuarine and terrestrial ecosystem maps were seamlessly aligned (see Harris et al., 2019 for a detailed description of the methods). For the rest of the marine realm, collation of additional historical and contemporary data provided information for parts of the country that previously lacked data, facilitated improved seabed (e.g., through the compilation of a national sediment layer), and shore mapping (e.g., inclusion of stromatolites) and the first inclusion of biodiversity data from biotope classifications (Supplementary Table S1). The use of more modern methods such as remote sensing and visual surveys (Supplementary Table S1) facilitated the inclusion of kelp forests and supported improved mapping of shelf habitats including reefs and reef mosaics (Supplementary Table S1).
There were marked increases in the number and diversity of datasets and spatial layers that informed the iterative MEM versions, enabling more sophisticated mapping, and inclusion of greater detail with more confidence. The growing number of informative data layers used increases the complexity of data management and curation. The diverse array of environmental (bathymetry, geology, oceanography) and biodiversity (biotope, VME, remote sensing) data have been sourced from broad network of institutions and research partners (Supplementary Table S1), without a focus on data or metadata standards. The data and their resultant spatial layers have been managed as a collection of files on analyst’s computers, without dedicated data management, metadata curation and version control. To attain the vision of well documented and reproducible workflows (Poole et al., 2023), SANBI, including its marine program, needs to strengthen its data management capacity. Improved data management will include the use of spatially enabled databases, centralized, documented and version-controlled data repositories that can feed scripted, reproducible workflows. As with most improvements in the MEM, these capabilities will be developed and improved upon iteratively over time.
The identification and delineation of biozones for MEM 2004 was informed by expert workshops where discussions focused on biogeographic patterns and depth zones (supratidal, intertidal, shallow and deep photic, sub photic, upper and lower slope, and abyss). For MEM 2011, the first national map of coastal and benthic ecosystem types and a separate national map of pelagic ecosystem types (Roberson et al., 2017) were produced. For the former, the midshore line Harris et al. (2011) was buffered by 500 m landward and seaward to create polygons representing the shores. The intertidal habitats from 2004 and beach morphodynamic types from Harris et al. (2011) were combined by coding wave exposure from the former to the rocky and mixed shores mapped by Harris et al. (2011), and then all shores were split by bioregions to give the shore ecosystem types. Offshore, a top-down approach was used to delineate refined depth zones and digitized geological maps facilitate mapping of seabed types using GIS.
By 2018, a range of new data, both biotic and abiotic, had been collated to support an improved MEM (Supplementary Table S1). As mentioned above, shores were included directly from Harris et al. (2019). For the rest of the MEM 2018, prioritization and exclusion rules were used in cases where the data layers overlapped spatially, as described for the MEM 2011 above. Typically, the most recent data (in the case of conflicting sediment type), data with greater confidence (such as visual surveys) or finer resolution mapping (such as kelp forest mapped by remote sensing, or multi-beam data interpreted by geoscientists) were prioritized in assigning seabed types. The distribution of biotopes (Supplementary Table S1) was useful in determining whether non-contiguous polygons with similar abiotic characteristics hosted different epifaunal, infaunal or fish biodiversity. For example, two areas of similar depth and sediment might be separated on the basis of infauna or epifauna assemblage data even though the existing abiotic data does not reflect any differences in environmental conditions. Polygons representing ecosystem types were thus mapped in ArcGIS Pro 10.4 using an expert-driven but data-informed approach, with a focus on identifying more uniform areas separated by discontinuities in multiple datasets. Mosaic ecosystems were defined and mapped as areas with high spatial and temporal variability in the multiple data sources used. Further, a decision was made to combine the benthic and pelagic maps from 2011 into a single MEM in 2018. The mapping process revealed aspects of the classification that needed further consideration (e.g., how to position certain ecosystem types that spanned bathomes in the hierarchy, such as kelp). This required collaboration and feedback between teams and different experts including refinements to achieve alignment and edge-mapping (Dayaram et al., 2021). This was particularly important in the cross-realm coastal zone when the maps of ecosystem types from the terrestrial, estuarine, and marine realms were aligned (e.g., extending estuarine shores all the way to the back of the surf zone; see Harris et al., 2019 for details).
The MEM 2022 is the latest version of South Africa’s evolving map of marine ecosystem types (Figure 5). It consisted of a relatively minor update, with a focus on alignment with the IUCN GET (Keith et al., 2020), as discussed above. The bentho-pelagic ecosystems of the MEM 2018 were separated into benthic and pelagic ecosystem type layers in the deepsea (beyond approximately 500 m depth), reintroducing the pelagic components defined by Roberson et al. (2017). South Africa’s 163 marine ecosystem types are now nested within 58 biogeographic ecotypes and 17 ecosystem functional groups (Supplementary Table S2), demonstrating alignment with the IUCN GET.
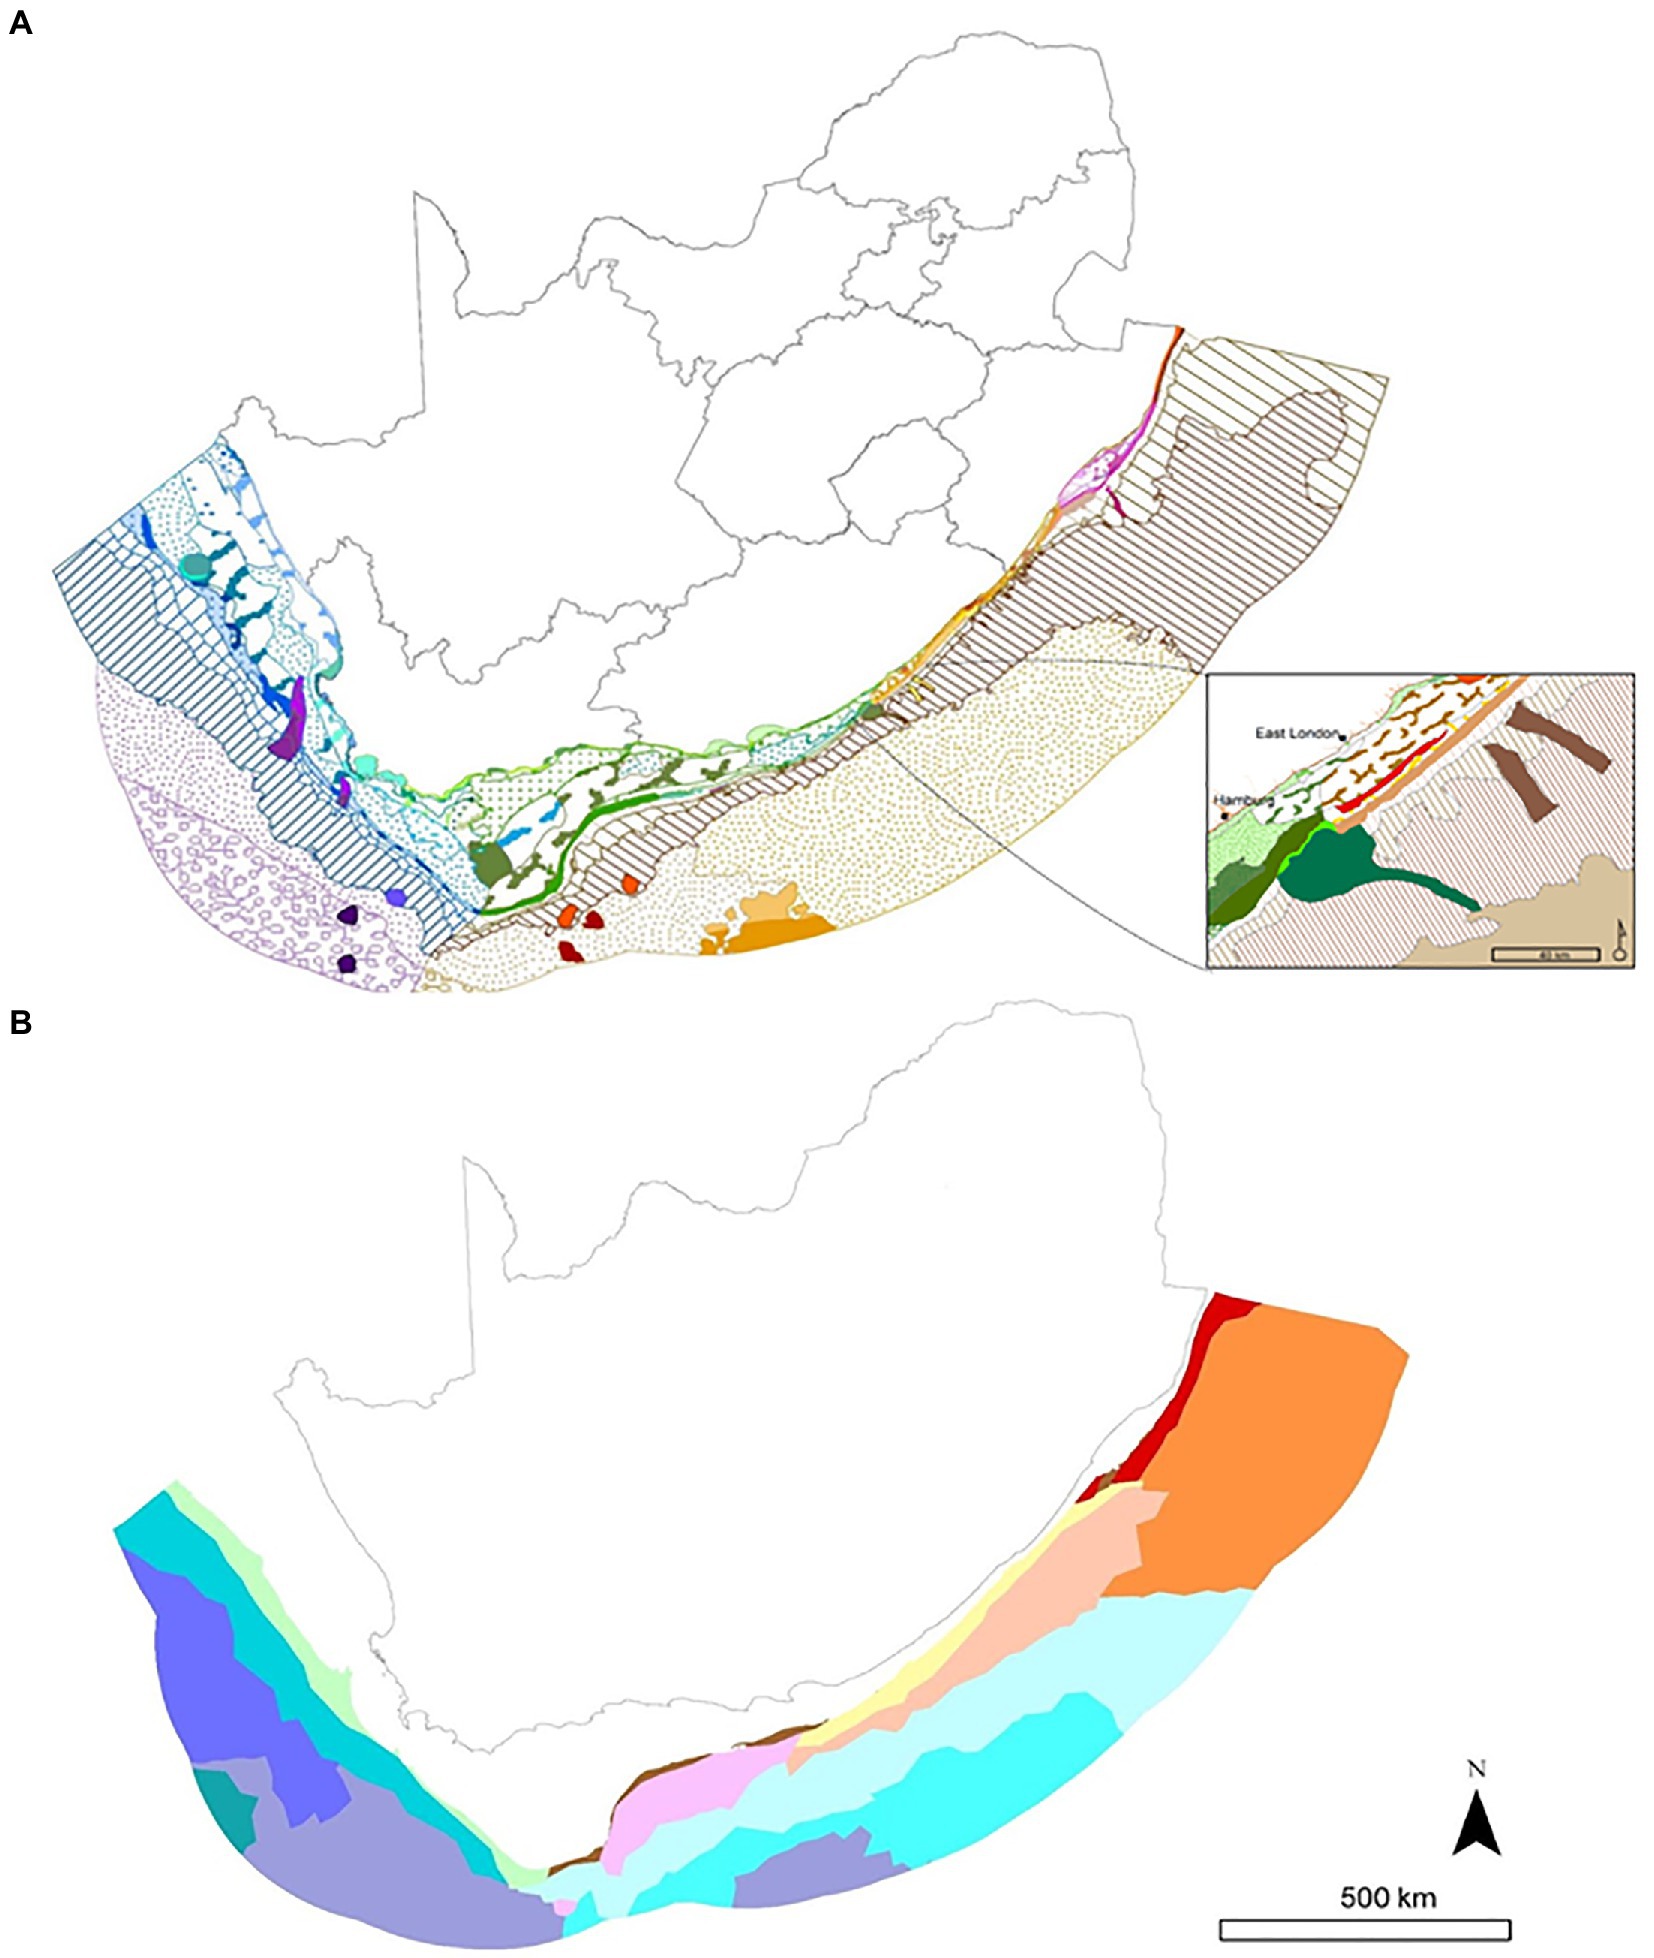
Figure 5. Map of the 163 marine ecosystem types in South Africa, including (A) 128 combined bentho-pelagic (shelf) and 22 deep-sea benthic (deep-sea) types and (B) 13 deep-sea pelagic types. The insert on A shows the transition between the Agulhas (green colors) and Natal ecoregions (warm colors). The key is available in Sink et al. (2019) and the map can be explored at this https://aniday.maps.arcgis.com/apps/webappviewer/index.html?id=d123de04da384e52b53baad8e6ca749c.
The challenges and size of the task of producing a national MEM, especially if it has not been done before, may paralyze efforts to get started. Collating the available and accessible knowledge into a first ‘best available’ version that could be iteratively improved upon, rather than focusing on perfection, was key to South Africa’s marine classification and mapping journey. Producing a first, even if rudimentary, version is better than none. South Africa’s national MEM has not only supported the assessment of marine biodiversity at a national scale (Lombard et al., 2005; Sink et al., 2012, 2019) but has also played a key role in spatial planning and prioritization (Botts et al., 2020; Kirkman et al., 2021; Harris et al., 2022a,b; Sink et al., 2023), and is being used to support national ecosystem accounts (Figure 5).
The ecosystem map is a foundational layer for the assessment of ecosystem threat status and protection level (SANBI and UNEP-WCMC, 2016; Keith et al., 2022) and even in its simplest form, provided an effective foundation to report on these headline indicators. One of the headline messages from South Africa’s first biodiversity assessment was that offshore ecosystems are the most poorly protected among realms (Driver et al., 2005). This message leveraged funding, research, stakeholder engagement and systematic conservation planning that culminated in the proclamation of 20 new Marine Protected Areas in 2019 representing a tenfold increase in area and a dramatic improvement (from 54 to 87%) in ecosystem representation in South Africa’s marine protected area network (Kirkman et al., 2021; Sink et al., 2023). South Africa has recently undertaken a review of its Ecologically or Biologically Significant Marine Areas (EBSAs), revising their delineation and descriptions, assessing their status, and providing management recommendations for each EBSA (Harris et al., 2022a). The MEM was a key dataset for the revised EBSA delineations, especially for assessing the EBSA criteria: biological diversity, and importance for threatened species and habitats, and in the EBSA status assessment. The MEM was also a key component of South Africa’s National Coastal and Marine Spatial Biodiversity Plan (Harris et al., 2022b) that in turn underpins the Biodiversity Sector Plan (DFFE, 2022), which is being developed as the biodiversity sector’s input to the national marine spatial planning process (Figure 6). Ecosystem characteristics, vulnerabilities, threat status and protection levels are considered in impact assessment and environmental authorization (Botts et al., 2020), which is important for ecosystem-based management. Analyses of the interaction between South Africa’s demersal hake trawl fishery and different ecosystem types have influenced eco-certification conditions (Andrews et al., 2022) with progress in ecosystem protection levels being a requirement for meeting eco-certification conditions (Sink et al., 2023). Although natural capital accounting has only recently been initiated in South Africa, the MEM is being used to create extent and condition accounts for terrestrial and aquatic ecosystems (Hein et al., 2022) with a view to ensuring that natural resources and assets, including ecosystem contributions to the economy, are considered, tracked, and maintained.
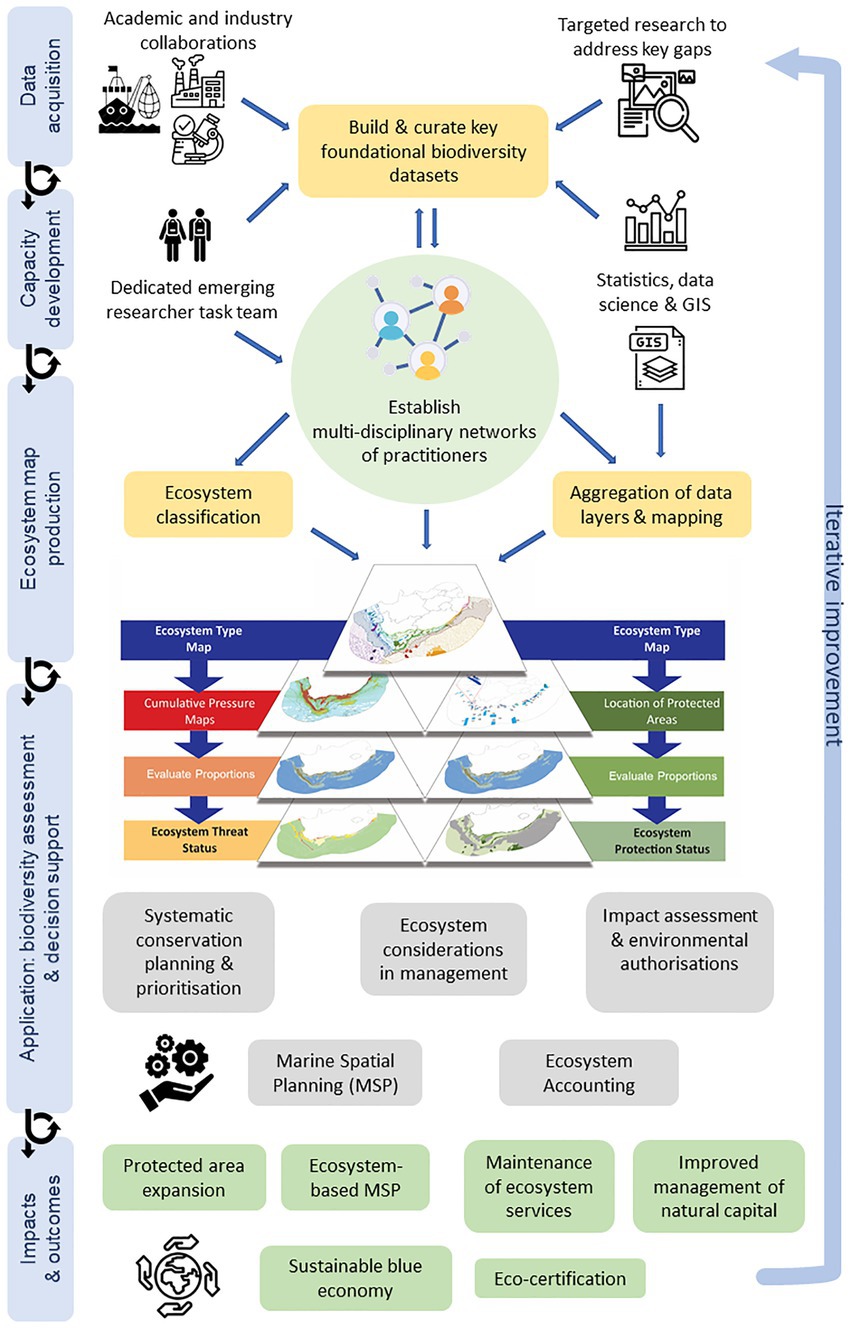
Figure 6. Schematic illustrating the iterative and collaborative process to develop and apply a national marine ecosystem map, demonstrating the flow of biodiversity data and decision support across the biodiversity value chain. For ecosystem threat status and protection level, the proportion of each ecosystem type in good condition and within the MPA network were evaluated against a series of ecosystem condition and representation in protected area network thresholds, respectively. See Sink et al. (2019) for assessment details.
The limitations, challenges and enabling factors were derived through systematic reflection by members of the marine ecosystem network and by scientists using the classification and map for assessment and spatial planning. This built on the limitations of the MEM 2018 that were identified as part of the NBA 2018 process, because recognition and discussion of limitations is an explicit element used to identify research gaps and priorities for improvement in order to focus funders’ attention on nationally agreed priorities. The main impediments and most significant enabling factors for the classification and mapping process were identified in task team and committee meetings and reviewed in a dedicated workshop where opportunities for future improvements were jointly distilled.
Current limitations and areas for improvement of the marine ecosystem classification and map in South Africa relate broadly to the need for additional data coverage and quality, particularly in deep water (Supplementary Figure S1), with a recognized need to better document uncertainty in the resulting map (Jansen et al., 2022). Data management and provision platforms such as the Copernicus Marine Environment Monitoring Service (CMEMS) and the European Marine Obervation and Data Network (EmodNet) provide leading examples of digital platforms for data acquisition, sharing and production, with potential access to global datasets. Similar regional platforms for the Western Indian Ocean include the Ocean Data and Information Network for Africa (ODINAFRICA)1 and the African Marine Atlas,2 which could also provide data for future improvement of national maps. Identified gaps include improved mapping of Vulnerable Marine Ecosystems, reefs, rhodolith beds (Adams et al., 2020), rocky, mixed and shingle shores, and better understanding of benthic-pelagic coupling and pelagic biodiversity pattern. A limitation for species distribution modeling is the lack of a national bathymetry layer, which could be addressed by collating data from researchers, global databases, the navy and industry to produce one publicly available bathymetry map with the best available data at a national scale. Similarly, nationally collated datasets for oceanographic variables are of high priority, but are currently limited. Development of platforms such as the National Oceans and Coastal Information Management System (OCIMS) may be able to play this role at a national level in future. Linking in and collaborating with existing data platforms and networks, such as ODINAFRICA, the Ocean Info Hub and Indian Ocean Global Ocean Observing System (IO-GOOS), may improve access to data and streamlining data management workflows. An improved understanding of the role of freshwater flow in shelf environments and mapping of fluvial fans is also required. Those ecosystem types that posed challenges in aligning with international classification schemes such as the IUCN GET require further international collaboration to resolve. South Africa also needs to advance conceptual models of its ecosystem functional groups, drawing from, and providing feedback to the IUCN GET team.
South Africa could draw additional lessons from international efforts to collate and share relevant marine ecosystem data and indicators in support of marine management. This includes other international ecosystem classification programs such as the European Nature Information System (EUNIS; Davies et al., 2004), the marine habitat classification for Britain and Ireland (Connor et al., 2004; Parry et al., 2015), the Coastal and Marine Classification Standard (CMECS) (United States Federal Geographic Data Committee, 2012) and the Australian hierarchical seabed classification framework (Last et al., 2010). European platforms that also support the assessment and monitoring of environmental status include CMEMS and EModNet, which not only collate, curate and provide co-ordinated ocean observations but also ready-to-use data products and indicators of ocean health for application in ocean state reports and marine environmental decision making. Relevant improvements that South Africa must consider include the provision of robust, well curated open access datasets; advances in data architecture; application of new technologies to improve observations; modeling to address data gaps; development of forecasting approaches; improved workflows to integrate diverse data sources in a more transparent and reproducible framework; innovations in indicator development and steps to improve user uptake (Le Traon et al., 2019; von Schuckmann et al., 2022). Key challenges and barriers to data collation, curation and integration are shown in (Table 2) and include capacity, data and analytical challenges. Many scientists were concerned that data were inadequate, outdated or needed further time to be improved or completed before being incorporated into ecosystem mapping. Enabling factors and opportunities for improvement of data, analyses, maps and capacity are also outlined in (Table 2). Finally, the reliance on an expert-driven approach leads to potential bias and a lack of transparency in classification, which points to a need for more transparent, repeatable data-driven methods to improve classification and mapping at the national scale.
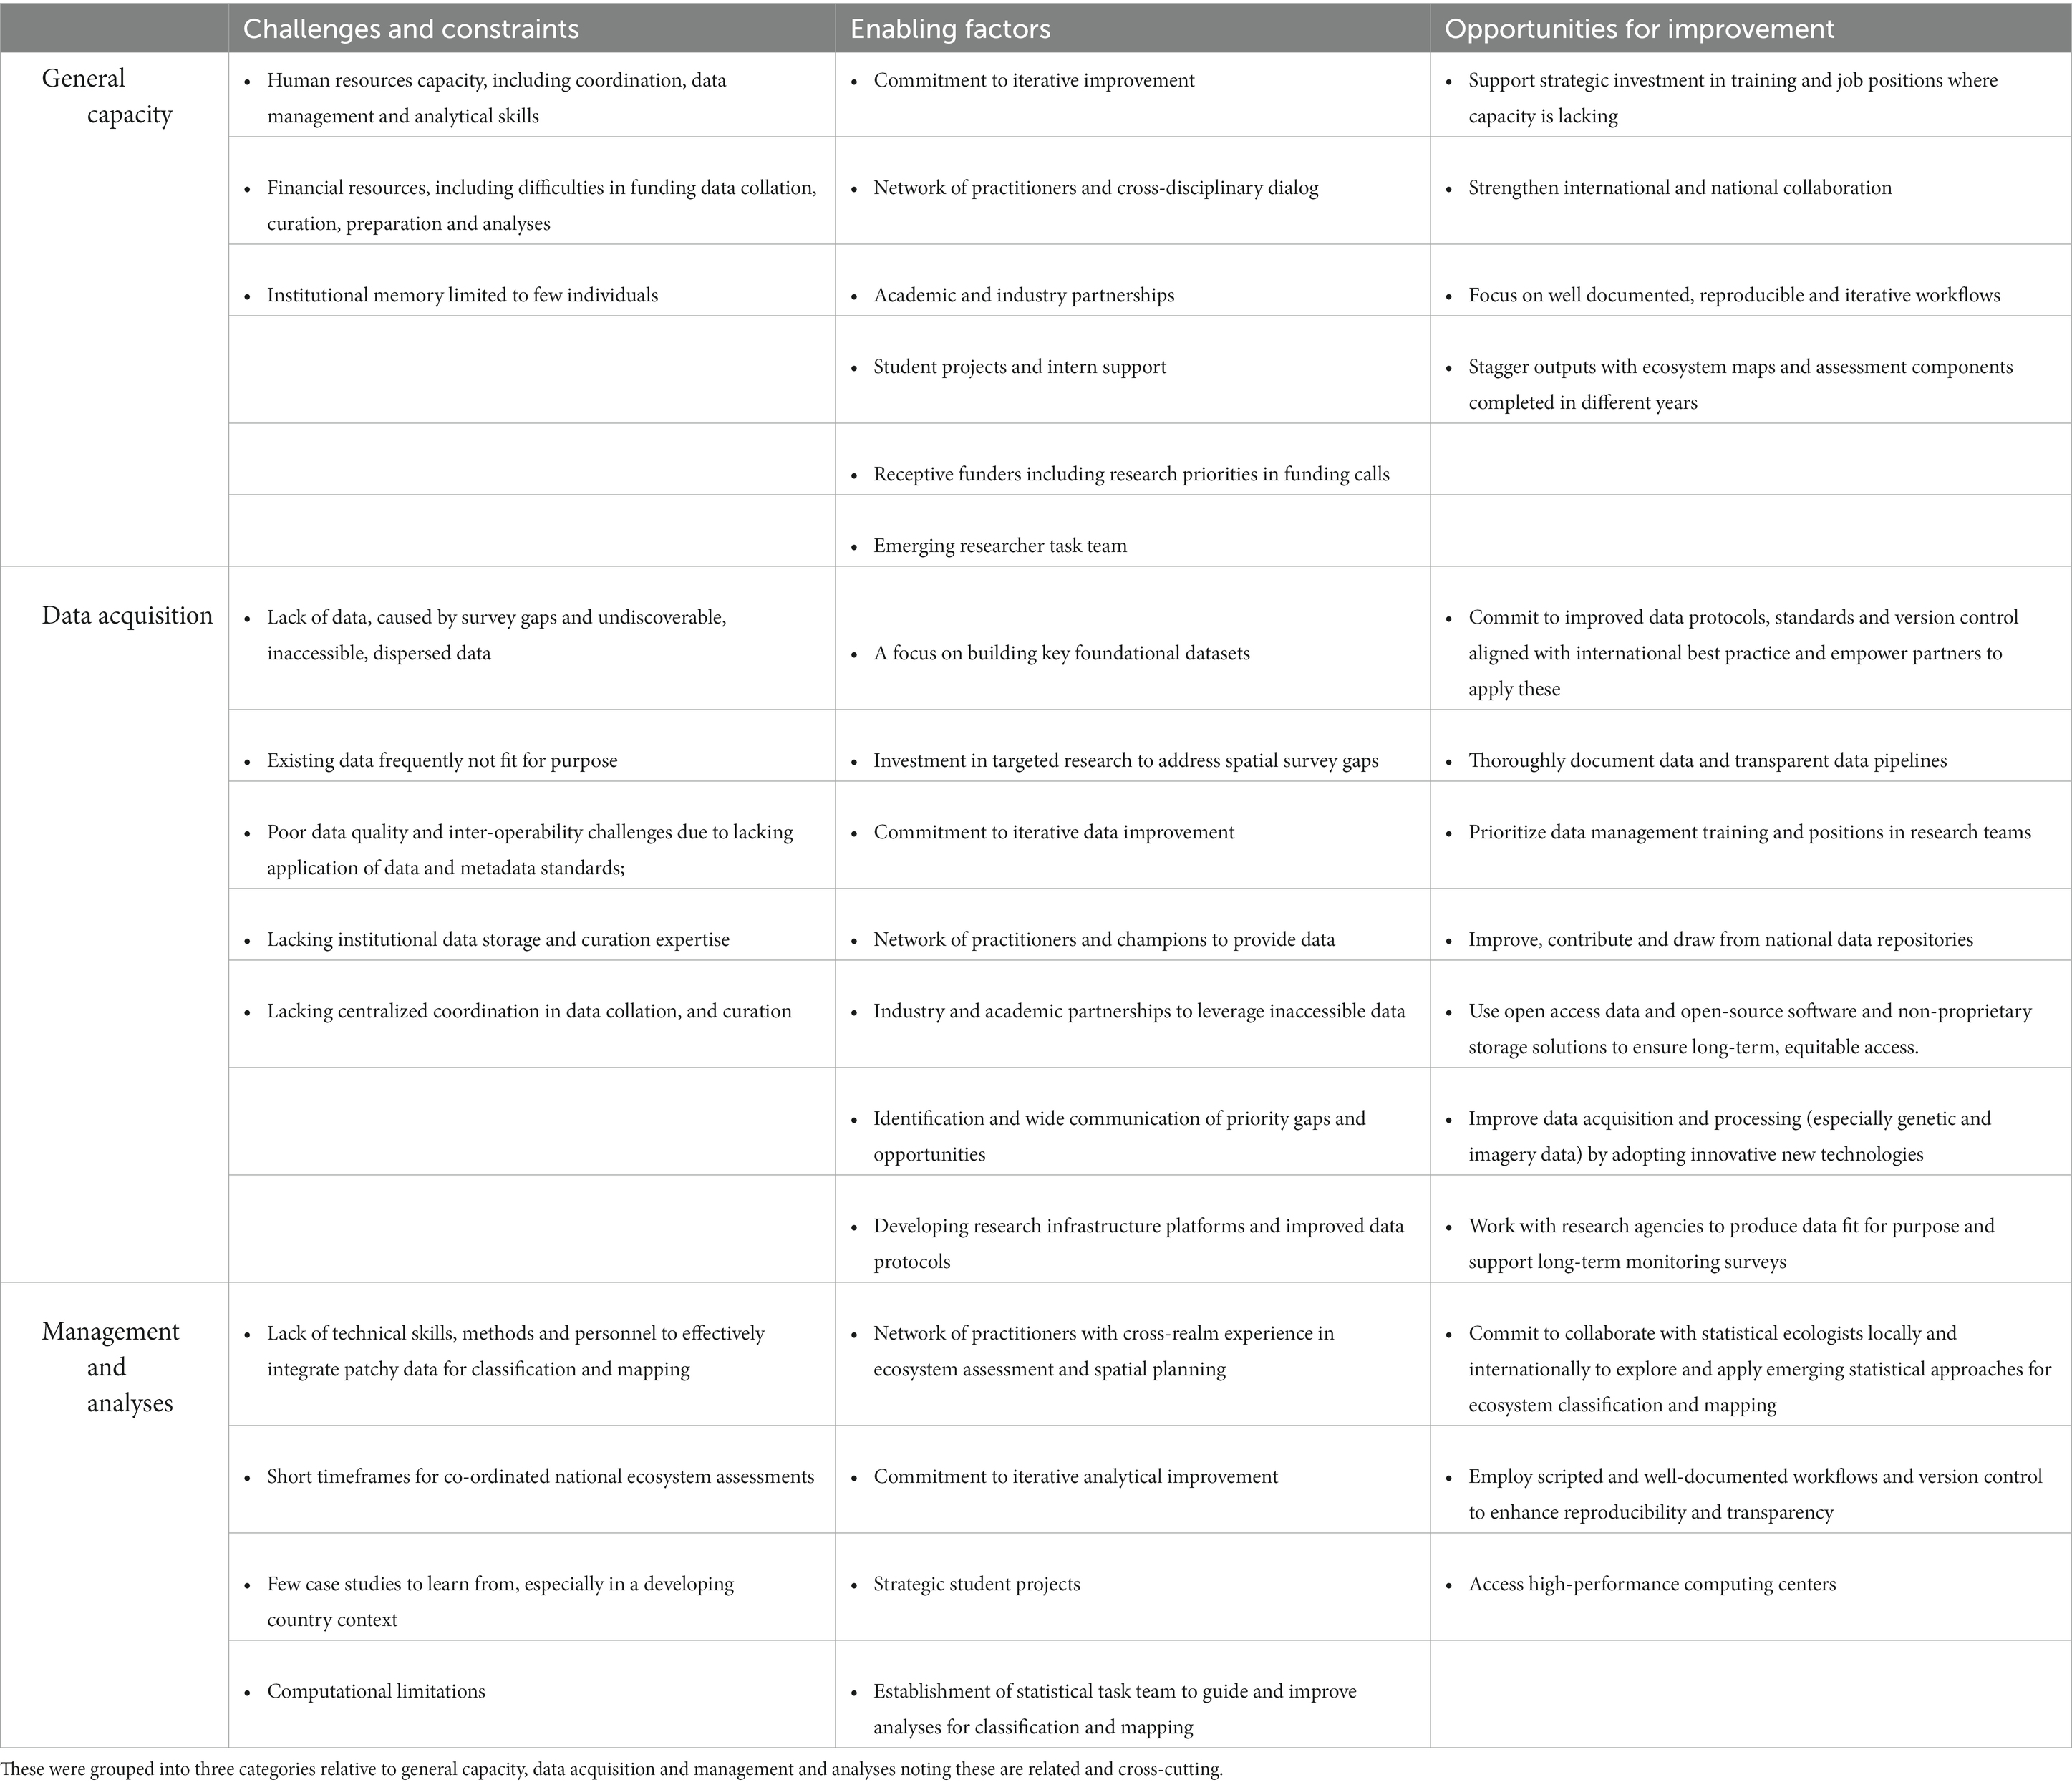
Table 2. Challenges, enabling factors, and further opportunities for improvement, as identified by authors during reflections from more than a decade of efforts to improve ecosystem maps.
South Africa’s first lesson from the efforts to classify and map marine ecosystem types is the value of an iterative approach to develop and improve classification and mapping. Dayaram et al. (2019) describe how iterative versions of South Africa’s vegetation map have improved the mapping of terrestrial ecosystems and how this translated into improved foundation for biodiversity planning and management (Botts et al., 2020). The inclusion of a simple map of marine biodiversity pattern in 2004 was useful in ensuring that aquatic ecosystems were not omitted from assessments, and also highlighted discrepancies relative to the more advanced terrestrial effort. Increased participation by scientists was catalyzed by omissions or mismatches in the data used in marine ecosystem mapping, and also through evidence of the map being applied in decision support. There was an understanding that the process was iterative and that there would be opportunities to influence the map with contributed data, participation and knowledge, facilitated by scheduled updates to allow scientists to plan their research for future inclusion of their new data.
The second lesson that emerged was the value of a co-ordinated network of practitioners including early-career researchers to support this work, which is a lesson shared in other realms (Botts et al., 2019). Benefits include greater transparency and inclusiveness, sharing of experience and knowledge between multiple fields and institutes thus supporting learning and capacity development, and helping to leverage desirable data. This serves to enhance South Africa’s marine ecosystem network (Figure 3), which spans numerous disciplines including geology, geoscience, oceanography, biodiversity and ecology and draws from experience from different habitats and functional ecosystem groups. Inclusion of a dedicated emerging researcher task team within the marine ecosystem network and the participation of these young scientists in the Marine Ecosystem Committee meetings provides them with opportunities for learning, developing leadership skills and gaining insight into the science-policy interface, while also fostering institutional memories that are important for inter-generational continuity. The network and task teams and the emerging researcher group in particular have allowed for a greater diversity of researchers to participate in South Africa’s marine ecosystem work, which is important in transitioning to more inclusive and equitable efforts in marine science and capacity development (Amon et al., 2022; Harden-Davies et al., 2022). The established governance structures with multiple teams and committees provide opportunities for discussions that facilitate agreed priorities, highlight key gaps and knowledge shortfalls, and identify potential expertise, datasets, approaches or research opportunities to address gaps. Our experience accords with the expectations shared by Keith et al. (2022) in the context of the IUCN GET, where highlighting areas of limited knowledge promote research to fill significant gaps. In our experience, a formally appointed champion (individual or research team within an appropriately mandated institute) that can drive this process and integrate results as they become available is an important element in coordination, fostering research relationships and facilitating progress.
The third lesson relates to the importance of building and curating key foundational biodiversity datasets and research to understand drivers of biodiversity patterns. The majority of in situ marine biological or ecological data collection that is undertaken is focused on relatively narrow geographic extents and optimized to address specific hypotheses, rather than to map biodiversity. The development of national-scale maps of ecosystem types, however, requires expansive foundational data layers that inform biodiversity and environmental patterns. To produce these layers, substantial effort is often required to collate, ‘clean’ and prepare datasets from many sources into a single, standardized format. In developed countries this is typically a function of national data centers, but such infrastructure and services are often lacking in developing countries. The importance of curation, documentation, expansion and iterative improvement of these datasets is a key requirement to build improved biodiversity knowledge and maps over time (SANBI and UNEP-WCMC, 2016) and helps identify gaps that can guide future research priorities.
The benefit of identifying gaps and research priorities is that it can help funders focus their funding calls to strategically address key gaps. In South Africa, the Foundational Biodiversity Information Programme (FBIP)3 has played an enabling role in funding research to collect, collate and prepare foundational biodiversity data used in South Africa’s Marine Ecosystem classification and map. Similarly, the Department of Science and Innovation/National Research Foundation funded African Coelacanth Ecosystem Programme (ACEP) provides the research community with competitive access to funding and marine research platforms and infrastructure (such as remote imagery and mapping platforms) provided through the South African Institute for Aquatic Biodiversity. The ACEP Open Call draws research priorities from among other strategy documents, the National Biodiversity Assessment which communicates research priorities identified by the Marine Ecosystem Committee, to ensure that the research supported is relevant and addresses gaps in ecosystem understanding. Research supported by ACEP has contributed to ecosystem classification and mapping through the provision of data layers and dedicated research outputs in the form of several student theses and peer-reviewed publications.
The fourth lesson is the importance of developing capacity and transferring skills and tools that enhance data quality, analytical workflows and reproducible outputs. Developing transparent and repeatable workflows requires meticulous organization and documentation of datasets, data preparation, analyses and all decisions along the way (Wilson et al., 2017). Accomplishing this for a wide range of input data from different fields and many different institutions, with a small, constrained team, is a daunting undertaking. Fortunately, data science has adopted and developed many highly effective tools, most of them open source and freely available, that enable improved documentation, management and sharing of data and analyses. Developing such data science and data management skills within the team is critical to working ‘smarter’ and building repeatable workflows. This philosophy and its benefits to iterative programs of work are well demonstrated by Lowndes et al. (2017) in their annual Ocean Health Index assessments. The code, systems and approaches developed by better-capacitated international teams can be shared and adopted to greatly benefit resource-limited teams in developing countries.
Lastly, the fifth lesson is the importance of innovation and adopting modern solutions and emerging statistical tools to advance ecosystem classification and mapping. Rapid advances in the areas of genomics (van Oppen and Coleman, 2022), visual survey methodologies (Mallet and Pelletier, 2014) and machine learning (Beyan and Browman, 2020) have unlocked big data streams for inclusion in the mapping process. Improved environmental and biological data access and extent worldwide has led to increasing focus on data-driven approaches to marine ecosystem classification and mapping (Howell, 2010; Shumchenia and King, 2010; Hill et al., 2020; Woolley et al., 2020). These approaches are robust, transparent, repeatable and may include measures of uncertainty (Jansen et al., 2022), making use of the most complete available data for classifying and predicting biodiversity patterns. The existence of earlier versions of ecosystem maps may necessitate some level of continuity between successive iterations, which can be achieved through expert-based decisions or decision trees. This is feasible due to recent growth in the field of statistical ecology in Africa (Minoarivelo et al., 2021). Three aspects to consider when pursuing data-driven statistical approaches, include: (i) the types of data that are available; (ii) surrogacy (Mellin et al., 2011; Flannery and Przeslawski, 2015), prioritization or integration of datasets (Zipkin et al., 2021) at a relevant scale; and (iii) the statistical method that best captures or predicts biodiversity patterns at this scale (e.g., Verfaillie et al., 2009; Murillo et al., 2018; Hill et al., 2020; McQuaid et al., 2020). Due to the scale mismatch between localized project-based biodiversity research and the standardized, national-scale biodiversity datasets required for ecosystem mapping (Sink et al., 2019), there is typically a need for prioritization or integration of multiple datasets covering different regions and assemblages, or consideration of surrogacy in some cases. Though statistical data integration methods exist, these require parameters or species in common (Zipkin et al., 2021), which is not always the case for datasets collected using different methods such as eDNA, trawls, dredges, grabs, and visual surveys (Lange et al., 2014; Flannery and Przeslawski, 2015). Emerging statistical tools for marine ecosystem classification rely on multivariate biodiversity data, either environmental or biological (or both), and include a technique of clustering the data and predicting the clusters across space (e.g., Verfaillie et al., 2009; Howell, 2010; Ovaskainen et al., 2017; Murillo et al., 2018; Hill et al., 2020). Currently, there is no accepted standard methodology and multiple emerging methods can be explored to classify and predict biodiversity patterns from growing datasets.
A co-ordinated and inclusive process enabled the collation and improvement of multi-disciplinary data to advance ecosystem mapping in a developing country. The national MEM has supported spatial biodiversity assessment, a tenfold increase in MPA estate, the identification of biodiversity priority areas to inform marine spatial planning, and has been applied in biodiversity management. Reflecting on progress, limitations and failures in South Africa reveals important lessons for others working to synthesize multiple datasets for robust decision support and improved biodiversity management. Key lessons include the value of (1) a clear commitment to iterative improvement even if the ideal frameworks or data are lacking; (2) developing relationships and skills among a network of current and emerging practitioners; (3) strategically prioritizing and leveraging resources to build and curate key foundational biodiversity datasets; (4) enhancing data quality and analytical workflows; and (5) the application of new technology and emerging statistical tools to improve the classification and prediction of biodiversity patterns. South Africa’s marine ecosystem mapping process provides insights that are relevant for developing countries but are also applicable in global efforts to unlock, share and use multi-disciplinary data for better biodiversity decisions.
The datasets presented in this study can be found in online repositories. The names of the repository/repositories and accession number(s) can be found at: http://bgis.sanbi.org/SpatialDataset/Detail/2681.
KS, NK, LH, AS, JC, LJA, and LAA contributed to the conception and planned content of this manuscript. KS, LAA, M-LF, JC, LH, SP, NK, AD, AS, ML-V, LJA, LD, SK, and RP wrote sections of the manuscript. AD, LAA, M-LF, MP, and KS produced the figures. All authors contributed data and analyses to the 2018 and 2022 versions of the ecosystem map and reviewed the draft manuscript. Most authors contributed to the reflections and lessons emanating from this manuscript.
The development and application of national maps of ecosystem types is part of the mandate of the South African National Biodiversity Institute. This manuscript was feasible due to funding received from the European Union’s Horizon 2020 research and innovation program under Grant Agreement No. 862428 (MISSION ATLANTIC). KS and NK acknowledge the ACEP Deep Connections, Agulhas Bank Connections and Deep Forests projects funded through the National Research Foundation (NRF Grants 129216, 129213, and 110765). LJA acknowledges support from the SeaMap project funded through the NRF Grant number 138572. LH and SH were supported by the Benguela Current Marine Spatial Management and Governance (MARISMA) Project. The MARISMA Project is funded by the German Federal Ministry for the Environment, Nature Conservation, Nuclear Safety and Consumer Protection (BMUV) through its International Climate Initiative (ICI), with in-kind contributions by the Benguela Current Commission (BCC) and its contracting parties (South Africa, Namibia and Angola). It is implemented by GIZ (Deutsche Gesellschaft für Internationale Zusammenarbeit GmbH; German Development Cooperation) in partnership with the BCC and its contracting parties. LH, LVN, SH, KS, MP, LD, and SK are also supported by CoastWise, a project of the MeerWissen initiative, which is funded by the German Federal Ministry for Economic Cooperation and Development, and implemented by GIZ.
We acknowledge all participants in South Africa’s three national biodiversity assessments and the broader communities of practice that support spatial biodiversity assessment and planning in South Africa. South Africa’s first marine assessment and first map of marine biozones was led by Amanda Lombard. We thank Kristal Maze and Mandy Driver for vision and leadership in supporting the science to policy value chain for biodiversity in South Africa. We acknowledge Megan van der Bank for her work in co-ordination and support of the marine ecosystem network and Prideel Majiedt for her technical support and policy insights. We thank Lynne Shannon for sharing perspectives on benthic-pelagic interactions. We acknowledge Robyn Adams for her contributions to Figure 5 in the form of the schematic component depicting the ecosystem assessment. The organizations and departments of all authors are acknowledged for their support as is the National Research Foundation and the African Coelacanth Ecosystem Program.
The authors declare that the research was conducted in the absence of any commercial or financial relationships that could be construed as a potential conflict of interest.
All claims expressed in this article are solely those of the authors and do not necessarily represent those of their affiliated organizations, or those of the publisher, the editors and the reviewers. Any product that may be evaluated in this article, or claim that may be made by its manufacturer, is not guaranteed or endorsed by the publisher.
The Supplementary material for this article can be found online at: https://www.frontiersin.org/articles/10.3389/fevo.2023.1108118/full#supplementary-material
Adams, L. A., Maneveldt, G. W., Green, A., Karenyi, N., Parker, D., Samaai, T., et al. (2020). Rhodolith bed discovered off the south African coast. Diversity 12:125. doi: 10.3390/d12040125
Amon, D. J., Filander, Z., Harris, L., and Harden-Davies, H. (2022). Safe working environments are key to improving inclusion in open-ocean, deep-ocean, and high-seas science. Mar. Policy 137:104947. doi: 10.1016/j.marpol.2021.104947
Andrews, J., Scarcella, G., and Pierre, J. (2022). South African Hake Fishery Surveillance Report. South Africa: Marine Stewardship Council Fisheries Assessments.
Balmford, A., Bruner, A., Cooper, P., Costanza, R., Farber, S., Green, R. E., et al. (2002). Economic reasons for conserving wild nature. Science 297, 950–953. doi: 10.1126/science.1073947
Bell, K. L. C., Chow, J. S., Hope, A., Quinzin, M. C., Cantner, K. A., Amon, D. J., et al. (2022b). Low-cost, deep-sea imaging and analysis tools for deep-sea exploration: a collaborative design study. Front. Mar. Sci. 9:873700. doi: 10.3389/fmars.2022.873700
Bell, K. L. C., Quinzin, M. C., Sarti, O., Cañete, T., Smith, A., Baldwin, H., et al. (2022a). “Global Summary,” in 2022 Global Deep-Sea Capacity Assessment. eds. K. L. C. Bell, M. C. Quinzin, S. Poulton, A. Hope, and D. Amon (Saunderstown, USA: Ocean Discovery League).
Beyan, C., and Browman, H. I. (2020). Setting the stage for the machine intelligence era in marine science. ICES J. Mar. Sci. 77, 1267–1273. doi: 10.1093/icesjms/fsaa084
Birch, G. F.., Rogers, J.., and Bremner, J. M.. (1986). “Texture and composition of sediments of the continental margin of the republics of South Africa, Transkei and Ciskei,” in Marine Geoscience Series 3, ed. A. PlessisDu Pretoria: Department of Mineral and Energy Affairs, Government Printer, 1–4.
Bland, L., Keith, D., Miller, R., Murray, N., and Rodríguez, J. (2017). Guidelines for the Application of IUCN Red List of Ecosystems Categories and Criteria, Version 1.1. Gland: IUCN.
Bogaart, P., Chan, J. Y., Horlings, H., Keith, D., Larson, T., Sayre, R., et al. (2019). Discussion paper 1.1: An ecosystem type classification for the SEEA EEA. Paper submitted to the SEEA EEA Technical Committee as input to the revision of the technical recommendations in support of the System on Environmental-Economic Accounting.
Borja, Á., Elliott, M., Carstensen, J., Heiskanen, A.-S., and van de Bund, W. (2010). Marine management–towards an integrated implementation of the European marine strategy framework and the water framework directives. Mar. Pollut. Bull. 60, 2175–2186. doi: 10.1016/j.marpolbul.2010.09.026
Botts, E. A., Pence, G., Holness, S., Sink, K., Skowno, A., Driver, A., et al. (2019). Practical actions for applied systematic conservation planning. Conserv. Biol. 33, 1235–1246. doi: 10.1111/cobi.13321
Botts, E. A., Skowno, A., Driver, A., Holness, S., Maze, K., Smith, T., et al. (2020). More than just a (red) list: over a decade of using South Africa’s threatened ecosystems in policy and practice. Biol. Conserv. 246:108559. doi: 10.1016/j.biocon.2020.108559
Briggs, J. C., and Bowen, B. W. (2012). A realignment of marine biogeographic provinces with particular reference to fish distributions. J. Biogeogr. 39, 12–30. doi: 10.1111/j.1365-2699.2011.02613.x
Connor, D. W., Allen, J. H., Golding, N., Howell, K. L., Lieberknecht, L. M., Northen, K. O., et al. (2004). The marine habitat classification for Britain and Ireland. Version 04.05 Infralittoral Rock Section.
Costello, M. J. (2009). Distinguishing marine habitat classification concepts for ecological data management. Mar. Ecol. Prog. Ser. 397, 253–268. doi: 10.3354/meps08317
Costello, M. J., Coll, M., Danovaro, R., Halpin, P., Ojaveer, H., and Miloslavich, P. (2010). A census of marine biodiversity knowledge, resources, and future challenges. PLoS One 5:e12110. doi: 10.1371/journal.pone.0012110
Davies, C. E., Moss, D., and Hill, M. O. (2004). EUNIS habitat classification revised 2004. Report to: European environment agency-European topic Centre on nature protection and biodiversity, 127–143.
Dayaram, A., Harris, L. R., Grobler, B. A., Van der Merwe, S., Rebelo, A. G., Ward Powrie, L., et al. (2019). Vegetation map of South Africa, Lesotho and Swaziland 2018: a description of changes since 2006. Bothalia African Biodiver. Conserv. 49, 1–11. doi: 10.4102/abc.v49i1.2452
Dayaram, A., Skowno, A. L., Driver, A., Sink, K., Van Deventer, H., Smith-Adao, L., et al. (2021). South African National Ecosystem Classification System Handbook : 1st Edn. Pretoria: South African National Biodiversity Institute.
de Wet, W. M., and Compton, J. S. (2021). Bathymetry of the south African continental shelf. Geo-Mar. Lett. 41, 1–19. doi: 10.1007/s00367-021-00701-y
DFFE (2022). Biodiversity Management Plans, Department of Forestry, Fisheries and the Environment, Pretoria.
Dingle, R. V. (1986). Revised bathymetric map of the cape canyon. Technical Report, Joint Geological Survey, University of Cape Town Marine Geoscience Unit 16, 20–25.
Dingle, R., Birch, G., Bremner, J., de Decker, R., du Plessis, A., Engelbrecht, J., et al. (1987). Deep-sea sedimentary environments around southern Africa south-East Atlantic and south-west Indian oceans. Ann. South African Museum 98, 1–27.
Douglass, L. L., Turner, J., Grantham, H. S., Kaiser, S., Constable, A., Nicoll, R., et al. (2014). A hierarchical classification of benthic biodiversity and assessment of protected areas in the Southern Ocean. PLoS One 9:e100551. doi: 10.1371/journal.pone.0100551
Dove, D., Acoba, T., and DesRochers, A. (2018). Seafloor substrate characterization from shallow reefs to the abyss: Spatially-continuous seafloor mapping using multispectral satellite imagery, and multibeam bathymetry and backscatter data within the Pacific Remote Islands marine National Monument and the Main Hawaiian islands. PIFSC Internal Report IR-18-08. Issued 18 October 2018.
Driver, A., Maze, K., Rouget, M., Lombard, A., Nel, J., Turpie, J., et al. (2005). National Spatial Biodiversity Assessment 2004: Priorities for Biodiversity Conservation in South Africa. Pretoria: South African National Biodiversity Institute.
Driver, A., Sink, K. J., Nel, J. N., Holness, S., Van Niekerk, L., Daniels, F., et al. (2012). National Biodiversity Assessment 2011: An Assessment of South Africa’s Biodiversity and Ecosystems, Synthesis Report. Pretoria: South African National Biodiversity Institute and Department of Environmental Affairs.
FAO (2009). International Guidelines for the Management of Deep-Sea Fisheries in the High Seas. Rome: Food and Agriculture Organization of the United Nations.
Flannery, E., and Przeslawski, R. (2015). Comparison of sampling methods to assess benthic marine biodiversity. Are spatial and ecological relationships consistent among sampling gear? Geosci. Australia. 007-71. doi: 10.11636/Record.2015.007
Galparsoro, I., Connor, D. W., Borja, Á., Aish, A., Amorim, P., Bajjouk, T., et al. (2012). Using EUNIS habitat classification for benthic mapping in European seas: present concerns and future needs. Mar. Pollut. Bull. 64, 2630–2638. doi: 10.1016/j.marpolbul.2012.10.010
Gerovasileiou, V., Smith, C. J., Sevastou, K., Papadopoulou, N., Dailianis, T., Bekkby, T., et al. (2019). Habitat mapping in the European seas–is it fit for purpose in the marine restoration agenda? Mar. Policy 106:103521. doi: 10.1016/j.marpol.2019.103521
Gibbons, M. (1999). The taxonomic richness of South Africa’s marine fauna: a crisis at hand. S. Afr. J. Sci. 95, 8–12.
Gregr, E. J., Ahrens, A. L., and Ian Perry, R. (2012). Reconciling classifications of ecologically and biologically significant areas in the world’s oceans. Mar. Policy 36, 716–726. doi: 10.1016/j.marpol.2011.10.009
Gregr, E. J., and Bodtker, K. M. (2007). Adaptive classification of marine ecosystems: identifying biologically meaningful regions in the marine environment. Deep Sea Res. I Oceanogr. Res. Pap. 54, 385–402. doi: 10.1016/j.dsr.2006.11.004
Griffiths, C. L., Robinson, T. B., Lange, L., and Mead, A. (2010). Marine biodiversity in South Africa: an evaluation of current states of knowledge. PLoS One 5:e12008. doi: 10.1371/journal.pone.0012008
Harden-Davies, H., Amon, D. J., Vierros, M., Bax, N. J., Hanich, Q., Hills, J. M., et al. (2022). Capacity development in the ocean decade and beyond: key questions about meanings, motivations, pathways, and measurements. Earth System Governance 12:100138. doi: 10.1016/j.esg.2022.100138
Harris, L. R., Bessinger, M., Dayaram, A., Holness, S., Kirkman, S., Livingstone, T.-C., et al. (2019). Advancing land-sea integration for ecologically meaningful coastal conservation and management. Biol. Conserv. 237, 81–89. doi: 10.1016/j.biocon.2019.06.020
Harris, L. R., Holness, S. D., Finke, G., Amunyela, M., Braby, R., Coelho, N., et al. (2022a). Practical marine spatial management of ecologically or biologically significant marine areas: emerging lessons from evidence-based planning and implementation in a developing-world context. Front. Mar. Sci. 9:678. doi: 10.3389/fmars.2022.831678
Harris, L. R., Holness, S. D., Kirkman, S. P., Sink, K. J., Majiedt, P., and Driver, A. (2022b). A robust, systematic approach for developing the biodiversity sector’s input for multi-sector marine spatial planning. Ocean Coastal Manag. 230:106368. doi: 10.1016/j.ocecoaman.2022.106368
Harris, L., Nel, R., and Schoeman, D. (2011). Mapping beach morphodynamics remotely: a novel application tested on south African sandy shores. Estuar. Coast. Shelf Sci. 92, 78–89. doi: 10.1016/j.ecss.2010.12.013
Hein, L., Bagstad, K. J., Obst, C., Edens, B., Schenau, S., Castillo, G., et al. (2022). Progress in natural capital accounting for ecosystems. Science 367, 514–515. doi: 10.1126/science.aaz890
Hill, N., Woolley, S. N. C., Foster, S., Dunstan, P. K., McKinlay, J., Ovaskainen, O., et al. (2020). Determining marine bioregions: a comparison of quantitative approaches. Methods Ecol. Evol. 11, 1258–1272. doi: 10.1111/2041-210X.13447
Holness, S. D., Harris, L. R., Chalmers, R., De Vos, D., Goodall, V., Truter, H., et al. (2022). Using systematic conservation planning to align priority areas for biodiversity and nature-based activities in marine spatial planning: a real-world application in contested marine space. Biol. Conserv. 271:109574. doi: 10.1016/j.biocon.2022.109574
Howell, K. L. (2010). A benthic classification system to aid in the implementation of marine protected area networks in the deep/high seas of the NE Atlantic. Biol. Conserv. 143, 1041–1056. doi: 10.1016/j.biocon.2010.02.001
Hu, W., Zhou, Q., Chen, B., Yang, S., Xiao, J., Du, J., et al. (2021). Progress in marine habitat mapping: concept, methods, and applications. Biodivers. Sci. 29, 531–544. doi: 10.17520/biods.2020176
Huse, I., Hamukuaya, H., Boyer, D. C., Malan, P. E., and Strømme, T. (1998). The diurnal vertical dynamics of cape hake and their potential prey. S. Afr. J. Mar. Sci. 19, 365–376. doi: 10.2989/025776198784126746
Jackson, L. F., and Lipschitz, S. (1984). Coastal Sensitivity Atlas of Southern Africa. Goodwood, Cape Town: National Printing Press.
Jansen, J., Woolley, S. N. C., Dunstan, P. K., Foster, S. D., Hill, N. A., Haward, M., et al. (2022). Stop ignoring map uncertainty in biodiversity science and conservation policy. Nat. Ecol. Evol. 6, 828–829. doi: 10.1038/s41559-022-01778-z
Keith, D. A., Ferrer-Paris, J. R., Nicholson, E., Bishop, M. J., Polidoro, B. A., Ramirez-Llodra, E., et al. (2022). A function-based typology for Earth’s ecosystems. Nature 610, 513–518. doi: 10.1038/s41586-022-05318-4
Keith, D. A., Ferrer-Paris, J. R., Nicholson, E., and Kingsford, R. T. (2020). IUCN Global Ecosystem Typology 2.0: Descriptive Profiles for Biomes and Ecosystem Functional Groups. Gland, Switzerland: IUCN, International Union for Conservation of Nature.
Kirkman, S., Mann, B., Sink, K., Adams, R., Livingstone, T., Mann-Lang, J., et al. (2021). Evaluating the evidence for ecological effectiveness of South Africa’s marine protected areas. Afr. J. Mar. Sci. 43, 389–412. doi: 10.2989/1814232X.2021.1962975
Lange, E., Petersen, S., Rüpke, L., Söding, E., and Wallmann, K. (2014). Marine resources–opportunities and risks. World Ocean Review 3:165.
Last, P. R., Lyne, V. D., Williams, A., Davies, C. R., Butler, A. J., and Yearsley, G. K. (2010). A hierarchical framework for classifying seabed biodiversity with application to planning and managing Australia’s marine biological resources. Biol. Conserv. 143, 1675–1686. doi: 10.1016/j.biocon.2010.04.008
Le Traon, P. Y., Reppucci, A., Alvarez Fanjul, E., Aouf, L., Behrens, A., Belmonte, M., et al. (2019). From observation to information and users: the Copernicus marine service perspective. Front. Mar. Sci. 6:234. doi: 10.3389/fmars.2019.00234
Lombard, A., Strauss, T., Harris, J., Sink, K., Attwood, C., and Hutchings, L. (2005). National Spatial Biodiversity Assessment 2004: Technical Report. Volume 4: Marine Component. Pretoria: South African National Biodiversity Institute.
Longhurst, A. R. (2007). “Toward an ecological geography of the sea,” in Ecological Geography of the Sea (San Diego: Academic Press), 1–17.
Lowndes, J. S. S., Best, B. D., Scarborough, C., Afflerbach, J. C., Frazier, M. R., O’Hara, C. C., et al. (2017). Our path to better science in less time using open data science tools. Nat. Ecol. Evol. 1:0160. doi: 10.1038/s41559-017-0160
Mallet, D., and Pelletier, D. (2014). Underwater video techniques for observing coastal marine biodiversity: a review of sixty years of publications (1952–2012). Fish. Res. 154, 44–62. doi: 10.1016/j.fishres.2014.01.019
McArthur, M. A., Brooke, B. P., Przeslawski, R., Ryan, D. A., Lucieer, V. L., Nichol, S., et al. (2010). On the use of abiotic surrogates to describe marine benthic biodiversity. Estuar. Coast. Shelf Sci. 88, 21–32. doi: 10.1016/j.ecss.2010.03.003
McQuaid, K. A., Attrill, M. J., Clark, M. R., Cobley, A., Glover, A. G., Smith, C. R., et al. (2020). Using habitat classification to assess Representativity of a protected area network in a large, data-poor area targeted for Deep-Sea mining. Front. Mar. Sci. 7:8860. doi: 10.3389/fmars.2020.558860
Mellin, C., Delean, S., Caley, J., Edgar, G., Meekan, M., Pitcher, R., et al. (2011). Effectiveness of biological surrogates for predicting patterns of marine biodiversity: a global meta-analysis. PLoS One 6:e20141. doi: 10.1371/journal.pone.0020141
Minoarivelo, H. O., Peralta, F. C., and Kuiper, T. (2021). Statistical Ecology can Unlock the Power of Biodiversity Data in Africa. The Conversation Africa. Available at: https://theconversation.com/statistical-ecology-can-unlock-the-power-of-biodiversity-data-in-africa-171513 (Accessed February 23, 2022).
Mucina, L. (2019). Biome: evolution of a crucial ecological and biogeographical concept. New Phytol. 222, 97–114. doi: 10.1111/nph.15609
Murillo, F. J., Kenchington, E., Tompkins, G., Beazley, L., Baker, E., Knudby, A., et al. (2018). Sponge assemblages and predicted archetypes in the eastern Canadian Arctic. Mar. Ecol. Prog. Ser. 597, 115–135. doi: 10.3354/meps12589
Nikolopoulou, S., Berov, D., Klayn, S., Dimitrov, L. I., Velkovsky, K., Chatzinikolaou, E., et al. (2021). Benthic habitat mapping of Plazh Gradina – Zlatna ribka (Black Sea) and Karpathos and Saria Islands (Mediterranean Sea). Biodivers. Data J. 9:e71972. doi: 10.3897/BDJ.9.e71972
Ovaskainen, O., Tikhonov, G., Norberg, A., Guillaume Blanchet, F., Duan, L., Dunson, D., et al. (2017). How to make more out of community data? A conceptual framework and its implementation as models and software. Ecol. Lett. 20, 561–576. doi: 10.1111/ele.12757
Parry, M., Howell, K. L., Narayanaswamy, B., Bett, B., Jones, D. O. B., Hughes, D., et al. (2015). A Deep-Sea Section for the Marine Habitat Classification of Britain and Ireland, Peterborough: JNCC.
Pillar, S. C., and Barange, M. (1995). Diel feeding periodicity, daily ration and vertical migration of juvenile cape hake off the west coast of South Africa. J. Fish Biol. 47, 753–768. doi: 10.1111/j.1095-8649.1995.tb06000.x
Poole, C. J., Skowno, A. L., Currie, J. C., Sink, K. J., Daly, B., and von Staden, L. (2023). Taking state of biodiversity reporting into the information age – a south African perspective. Front. Ecol. Evol. In press
Porter, S. N., Branch, G. M., and Sink, K. J. (2017). Changes in shallow-reef community composition along environmental gradients on the east African coast. Mar. Biol. 164:101. doi: 10.1007/s00227-017-3130-0
Roberson, L. A., Lagabrielle, E., Lombard, A. T., Sink, K., Livingstone, T., Grantham, H., et al. (2017). Pelagic bioregionalisation using open-access data for better planning of marine protected area networks. Ocean Coastal Manag. 148, 214–230. doi: 10.1016/j.ocecoaman.2017.08.017
SANBI and UNEP-WCMC (2016). Mapping Biodiversity Priorities: A Practical, Science-Based Approach to National Biodiversity Assessment and Prioritisation to Inform Strategy and Action Planning. Cambridge, UK: UNEP-WCMC.
Sayre, R. G., Wright, D. J., Breyer, S. P., Butler, K. A., Van Graafeiland, K., Costello, M. J., et al. (2017). A three-dimensional mapping of the ocean based on environmental data. Oceanography 30, 90–103. doi: 10.5670/oceanog.2017.116
Shumchenia, E. J., and King, J. W. (2010). Comparison of methods for integrating biological and physical data for marine habitat mapping and classification. Cont. Shelf Res. 30, 1717–1729. doi: 10.1016/j.csr.2010.07.007
Sink, K. J. (2016). Operation Phakisa African Coelacanth Ecosystem Programme (ACEP) Deep Secrets Cruise: The Outer Shelf and Slope Ecosystems of South Africa–RV Algoa voyage 230. Pretoria: South African National Biodiversity Institute.
Sink, K. J., Harris, L. R., Skowno, A. L., Livingstone, T., Franken, M., Porter, S., et al. (2019). “Chapter 3: marine ecosystem classification and mapping,” in South African National Biodiversity Assessment 2018 Technical Report Volume 4: Marine Realm, eds. K. J. Sink, M. G. Bankvan der, P. A. Majiedt, L. R. Harris, L. J. Atkinson, and S. P. Kirkman, et al. Pretoria: South African National Biodiversity Institute.
Sink, K. J., Holness, S., Harris, L., Majiedt, P., Atkinson, L., Robinson, T., et al. (2012). National Biodiversity Assessment 2011: Technical Report, Volume 4: Marine and Coastal Component. Pretoria: South African National Biodiversity Institute, 328.
Sink, K. J., Lombard, A. T., Attwood, C. G., Livingstone, T., Grantham, H., and Holness, S. D. (2023). Integrated systematic planning and adaptive stakeholder process support tenfold increase in South Africa’s marine protected area estate. Conservation Letters. In review.
Skowno, A. L., Poole, C. J., Raimondo, D. C., Sink, K. J., van Deventer, H., Van Niekerk, L., et al. (2019). National Biodiversity Assessment 2018: The Status of South Africa’s Ecosystems and Biodiversity, Synthesis Report. Pretoria.: South African National Biodiversity Institute, an entity of the Department of Environment, Forestry and Fisheries.
Smit, K. P., Van Niekerk, L., Harris, L. R., McQuatters-Gollop, A., Shannon, L. J., and Sink, K. J. (2022). A roadmap to advance marine and coastal monitoring, biodiversity assessment, and international reporting: a developing nation perspective. Front. Mar. Sci. 9:6373. doi: 10.3389/fmars.2022.886373
Spalding, M. D., Agostini, V. N., Rice, J., and Grant, S. M. (2012). Pelagic provinces of the world: a biogeographic classification of the world’s surface pelagic waters. Ocean Coastal Manag. 60, 19–30. doi: 10.1016/j.ocecoaman.2011.12.016
Spalding, M. D., Fox, H. E., Allen, G. R., Davidson, N., Ferdaña, Z. A., Finlayson, M., et al. (2007). Marine ecoregions of the world: a bioregionalization of coastal and shelf areas. Bioscience 57, 573–583. doi: 10.1641/b570707
Sutton, T. T., Clark, M. R., Dunn, D. C., Halpin, P. N., Rogers, A. D., Guinotte, J., et al. (2017). A global biogeographic classification of the mesopelagic zone. Deep Sea Res. I Oceanogr. Res. Pap. 126, 85–102. doi: 10.1016/j.dsr.2017.05.006
Swanborn, D. J. B., Huvenne, V. A. I., Pittman, S. J., and Woodall, L. C. (2021). Bringing seascape ecology to the deep seabed: a review and framework for its application. Limnol. Oceanogr. 67, 66–88. doi: 10.1002/lno.11976
United States Federal Geographic Data Committee (2012). Coastal and Marine Ecological Classification Standard (CMECS). Silver Spring, MD: NOAA Repository.
van Niekerk, L., Adams, J., James, N., Lamberth, S., MacKay, C., Turpie, J., et al. (2020). An estuary ecosystem classification that encompasses biogeography and a high diversity of types in support of protection and management. Afr. J. Aquat. Sci. 45, 199–216. doi: 10.2989/16085914.2019.1685934
van Oppen, M. J. H., and Coleman, M. A. (2022). Advancing the protection of marine life through genomics. PLoS Biol. 20:e3001801. doi: 10.1371/journal.pbio.3001801
Verfaillie, E., Degraer, S., Schelfaut, K., Willems, W., and Van Lancker, V. (2009). A protocol for classifying ecologically relevant marine zones, a statistical approach. Estuar. Coast. Shelf Sci. 83, 175–185. doi: 10.1016/j.ecss.2009.03.003
von Schuckmann, K. P., Le Traon, N., Smith, A., Pascual, S., Djavidnia, P., Brasseur, M., et al. (2022). Copernicus Ocean state report, issue 6. J. Operat. Oceanograph. 15, 1–220. doi: 10.1080/1755876X.2022.2095169
von Staden, L., Lötter, M. C., Holness, S., and Lombard, A. T. (2022). An evaluation of the effectiveness of critical biodiversity areas, identified through a systematic conservation planning process, to reduce biodiversity loss outside protected areas in South Africa. Land Use Policy 115:106044. doi: 10.1016/j.landusepol.2022.106044
Whitehead, T. O., Von der Meden, C. E., Skowno, A. L., Sink, K. J., Van der Merwe, S., Adams, R., et al. (2019). South African National Biodiversity Assessment 2018 Technical Report Volume 6: Sub-Antarctic Territory. Pretoria.: South African National Biodiversity Institute.
Whitfield, A. (2005). Langebaan – a new type of estuary? Afr. J. Aquat. Sci. 30, 207–209. doi: 10.2989/16085910509503859
Wilson, G., Bryan, J., Cranston, K., Kitzes, J., Nederbragt, L., and Teal, T. K. (2017). Good enough practices in scientific computing. PLoS Comput. Biol. 13:e1005510. doi: 10.1371/journal.pcbi.1005510
Woolley, S. N. C., Foster, S. D., Bax, N. J., Currie, J. C., Dunn, D. C., Hansen, C., et al. (2020). Bioregions in marine environments: combining biological and environmental data for management and scientific understanding. Bioscience 70, 48–59. doi: 10.1093/biosci/biz133
Keywords: ecosystem mapping, evidence-based biodiversity management, marine ecosystem map, ecosystem types, benthic ecosystems, pelagic ecosystems
Citation: Sink KJ, Adams LA, Franken M-L, Harris LR, Currie J, Karenyi N, Dayaram A, Porter S, Kirkman S, Pfaff M, van Niekerk L, Atkinson LJ, Bernard A, Bessinger M, Cawthra H, de Wet W, Dunga L, Filander Z, Green A, Herbert D, Holness S, Lamberth S, Livingstone T, Lück-Vogel M, Mackay F, Makwela M, Palmer R, Van Zyl W and Skowno A (2023) Iterative mapping of marine ecosystems for spatial status assessment, prioritization, and decision support. Front. Ecol. Evol. 11:1108118. doi: 10.3389/fevo.2023.1108118
Edited by:
Nick Isaac, UK Centre for Ecology and Hydrology, United KingdomReviewed by:
Amy Whitehead, National Institute of Water and Atmospheric Research (NIWA), New ZealandCopyright © 2023 Sink, Adams, Franken, Harris, Currie, Karenyi, Dayaram, Porter, Kirkman, Pfaff, van Niekerk, Atkinson, Bernard, Bessinger, Cawthra, de Wet, Dunga, Filander, Green, Herbert, Holness, Lamberth, Livingstone, Lück-Vogel, Mackay, Makwela, Palmer, Van Zyl and Skowno. This is an open-access article distributed under the terms of the Creative Commons Attribution License (CC BY). The use, distribution or reproduction in other forums is permitted, provided the original author(s) and the copyright owner(s) are credited and that the original publication in this journal is cited, in accordance with accepted academic practice. No use, distribution or reproduction is permitted which does not comply with these terms.
*Correspondence: Kerry J. Sink, ay5zaW5rQHNhbmJpLm9yZy56YQ==
Disclaimer: All claims expressed in this article are solely those of the authors and do not necessarily represent those of their affiliated organizations, or those of the publisher, the editors and the reviewers. Any product that may be evaluated in this article or claim that may be made by its manufacturer is not guaranteed or endorsed by the publisher.
Research integrity at Frontiers
Learn more about the work of our research integrity team to safeguard the quality of each article we publish.