
94% of researchers rate our articles as excellent or good
Learn more about the work of our research integrity team to safeguard the quality of each article we publish.
Find out more
ORIGINAL RESEARCH article
Front. Ecol. Evol., 17 March 2023
Sec. Behavioral and Evolutionary Ecology
Volume 11 - 2023 | https://doi.org/10.3389/fevo.2023.1099543
 Rohan Sarkar1
 Anirban Bhowmick1,2†Debsruti Dasgupta1,3†Rounak Banerjee1,3†
 Poushali Chakraborty1,4Abhijit Nayek1,5‡R. Sreelekshmi1,6‡Aritra Roy1,7§Rituparna Sonowal1§
 Amartya Baran Mondal1,8
 Anindita Bhadra1*
Foraging and acquiring of food is a delicate balance between managing the costs (both energy and social) and individual preferences. Previous research on solitarily foraging free-ranging dogs showed that they prioritise the nutritionally highest valued food, but do not ignore other less valuable food either, displaying typical scavenger behaviour. We conducted a similar experiment on 136 groups of dogs with the same set-up to see the change in foraging strategies, if any, under the influence of social cost like intra-group competition. We found multiple differences between the strategies of dogs foraging alone versus in groups with competition playing an implicit role in the dogs’ decision making when foraging in groups. Dogs continually assessed and evaluated the available resources in a “patch,” transitioning from random foraging to systematic foraging with time and more information. Dogs in groups used an, “eat first, sample afterwards” strategy whereas individual dogs sampled thoroughly before eating. Additionally, dogs in groups were quicker and more likely to respond to the experimental set-up and eat from it. The dogs adjusted their behaviour in terms of effort and time allocated according to the quality of the “patch.” Foraging in groups also provided benefits of reduced individual vigilance. The various decisions and choices made lend support to the optimal foraging theory wherein the dogs harvested the nutritionally richest patch possible with the least risk and cost involved but were willing to compromise if that was not possible. This underscores the cognitive, quick decision-making abilities and adaptable behaviour of these dogs, which is likely to have influenced the process of dog domestication.
Animal foraging strategies are a delicate balance between food preference and food selection influenced by various factors like nutritional requirements, availability of food, predation, competition etc (Schoener, 1971). Food preference is defined as the discrimination exerted by animals on different food types resulting in the selection of one food type over the other when no constraints bear on their choice (Rozin and Vollmecke, 1986). Multiple experiments have shown that, given the chance, animals do indeed prefer certain food items more than others (Berteaux et al., 1998; Ganas et al., 2008). But such idealised situations rarely occur in the natural world and thus animals may not always be able to acquire food according to their preference. For example, goats and giant anteaters make different dietary choices when foraging in the wild versus in experimental conditions (Redford, 1985; Nefzaoui et al., 1995). Thus, it is necessary to distinguish between food preference and food selection, defined as preference modified by environmental conditions (Hodgson, 1979). The search for the best possible food with the least risk and energy investment, thereby having the highest survival advantage, gives rise to different foraging strategies. Foraging can thus be viewed as a sequence of events- searching, assessing, handling, and utilization of resources and food with the ultimate aim of gaining energy and fitness and each component of this process may be optimised according to the species, trophic level or situation.
The decision-making processes that underlie what and how an animal feeds are of import not only to understand individual foraging behaviour but are also important in the broader sense of population dynamics and community structure amongst other ecosystem processes at many levels. Optimal foraging theory is a behavioural ecological model that seeks to understand the foraging behaviour of animals in the context of the efficiency of a certain behaviour or choice in the presence of local and global constraints (Kamil et al., 1987). According to classical optimal foraging models (Pyke, 1977), an animal must make multiple decisions whilst foraging – (a) choice of what to eat (food selection), (b) choice of where to search and feed from (patch selection), (c) amount of time to be allocated to different patches, and (d) choice of movement patterns and speed between patches. As the availability and abundance of food is neither uniform nor continuous in nature, the outcomes of these decisions must be dynamic, governed by the stochastic nature of the challenges. Urbanisation, in recent years, has been instrumental in transforming ecological conditions like habitat and food sources, introducing further heterogeneity in animal foraging ecology. Animals living in urban habitats often face new challenges, apart from stochasticity in resources, in the form of novel, anthropogenic food and scarcity of their natural food. One way in which urban animals adapt to this challenge is by diet-switching, a foraging behaviour wherein the animal starts consuming an alternative food/prey when the primary food is scarce in number (Dasgupta et al., 2021; Sarkar and Bhadra, 2022).
The Canidae family includes species that show a range of foraging patterns, including several that are opportunistic and generalist predators and are increasingly being found in and around urban settlements (Kjellander and Nordström, 2003; Contesse et al., 2004). Hence the canids are a highly suitable taxon for studying foraging behaviour in urban centres. Being group-living animals, their challenges in food procurement are not only environmental, but also social. Members of a group-living species might forage alone or in groups depending on the food abundance in the area (Le Roux et al., 2009). Foraging in groups provides animals with the advantages of lower predation risk and higher efficiency (Clark and Mangel, 1986), but group-living comes with various disadvantages too. Intra-group competition is one of the costs of group living (Janson, 1985). Competition has an effect on the quality and quantity of food acquired by individuals. As a trade-off to competition, individuals may change dietary preferences or forage from lower quality patches (Schulke and Ostner, 2012) resulting in eating inferior food (Taylor, 1970) or eating less (Janson, 1985). Furthermore, individuals in a group may exert more effort and forage faster, as a manifestation of competitive interaction, in order to obtain their share (Clark and Mangel, 1986).
The free-ranging dog (Canis lupus familiaris) is an ideal model canid to study the effect of various factors and challenges of an urban, human-dominated environment on food preference and selection, if any. They have been living in human habitations for centuries, much earlier than any other canids, and have become well adapted to their scavenging lifestyle and dependence on anthropogenic food (Pal, 2001; Debroy, 2008). Despite subsisting on a carbohydrate-rich omnivorous diet, they maintain a strong preference for meat in cafeteria-type trials (Bhadra and Bhadra, 2014; Fleming et al., 2017). They find their preferred food using the Rule of Thumb: “If it smells like meat, eat it” (Bhadra and Bhadra, 2014). This preference is also exercised whilst scavenging by the dogs in a more realistic scenario of finding food from garbage bins. Individual dogs were found to preferentially find and eat meat pieces from the noisy background of garbage first, as compared to other types of food using the “Sniff & Snatch” strategy (Sarkar et al., 2019). They show qualities of a periscopic forager by optimising the order of sampling and eating from resource patches (in this case, the boxes) on simultaneously encountering them (Mitchell, 1989). This type of feeding strategy has characteristics of an optimal foraging model where the highest ranked food (in both quality and quantity) is sought out first and then less preferred food are added to the diet (Pyke, 1977). In the previous experiment, although the dogs seemed to prefer eating from the protein box, it was not immediately clear whether the dogs carefully assessed available patches before making a decision or they behaved impulsively or were able to hone on the best available resource immediately using their strong olfactory capabilities. Thus, whilst we knew their feeding preference, we did not know of the decision-making and the strategies that were instrumental for exercising this preference. Furthermore, we observed this preference during foraging by solitary dogs, as the trials in the previous experiment were performed on individuals, and not groups of free-ranging dogs.
Free-ranging dogs typically live in groups, and whilst foraging, show different levels of social organisation, from solitary, to pairs, and groups of three or more (Sen Majumder et al., 2014). We carried out a multiple-choice task with free-ranging dog groups to understand whether they preferentially feed on meat using the Rule of Thumb, “If it smells like meat, eat it” (Bhadra et al., 2016), in the presence of competitors. The objectives of this paper are to examine the feeding patterns and strategies of free-ranging dogs in groups and to compare these against those of solitary dogs in the context of the predictions of optimal foraging models. We could only compare the foraging behaviour of the free-ranging dogs against the first three decision-making points of the optimal foraging theory-what to eat, where to eat from and how much time and effort to expend in a patch. Our experiment design did not require the dog to travel any amount of distance to access the different resources and thus decision making in relation to movement patterns and speed was not studied. We hypothesized that presence of other group members will have an effect on the foraging strategies of dogs as compared to when they are solitary; they would try to minimise competition by relaxing resource selectivity, rather than entering into active competition for the most preferred resource.
The study was conducted in urban and semi-urban habitats in and around Kolkata, India (22.5726 °N, 88.3639 °E) in areas having eateries, shops, open markets of meat, fish, and vegetables, garbage dumps and dustbins. The 22 field sites have been highlighted in the maps (Supplementary Figure 1). The study was carried out during June to October 2019, June 2020, and during March-April 2021. All the areas had significant human presence that encompassed a varied range of human-dog interactions. In order to avoid repeating the experiment on the same groups, we carried out the experiments in different areas on different days. This prevented any learning bias in the focal dogs.
Three plastic boxes of same build and design were used as proxies for dustbins. These boxes were filled with garbage collected from dustbins or roadside dumps. The garbage put in these boxes were all dry waste like Styrofoam cups, cardboard pieces, polythene bags, dried leaves and flowers. We did not put food wastes (leftovers or fruit peels) so that the only edible items were the food items provided by us in these boxes. These boxes were called Protein, Mixed and Carbohydrate boxes according to the food items contained within. The Protein box had 10 pieces of raw chicken, the Mixed box had 5 pieces of raw chicken and bread each, and the Carbohydrate box had 10 pieces of bread. Both the chicken and bread provided were either fresh (bought on the same day as the experiment) or at most a day old (kept in a refrigerator but brought to room temperature before using for experiment) and were fit for human consumption. We mixed the food items with the garbage thoroughly in the box. The food was mixed outside the sight of the dogs to remove food based visual cues before the experiment. The set-up used was the same as that in Sarkar et al. (2019).
The experimenters visited a place randomly chosen from a map and did a recce of the place along with talking to the locals to locate groups of dogs. These groups were selected randomly and from a variety of places as mentioned above. Care was taken so that the places selected did not overlap with that of the solitary dog experiment sites. On a later date the experiment was performed on those sites with these randomly pre-selected groups. A group was defined as a cluster of three or more dogs with at least two of them being adults, and that were observed to be either resting together or engaging in affiliative interactions (Banerjee and Bhadra, 2022) with each other. By pre-identifying and randomising the places, groups and dates, we made sure not to repeat the experiment on the same group twice.
On locating a group (or a minimum of 3 members of a group), we set down the three boxes side by side on the ground. The contents of the boxes became accessible to the dogs after opening their lids and all their actions were recorded from that point on. If the dogs did not approach on their own or did not notice the boxes, their attention was called towards the set-up by vocalisation and tapping the three boxes lightly. The position of the boxes was randomised with each group. The maximum amount of time the boxes would be on the ground, and thus the total experiment time window, was 5 min. Any group that did not respond within 5 min was said to be unsuccessful in doing the experiment. An interaction was said to be initiated if a member of the group (or the solitary dog in the previous experiment) sniffed the edges of the box (a minimum of 2-3 cm from the edge) with its snout after opening the lids. From the point of the action of first sniff, each group was allowed to interact with the set-up for a minute, after which the lids were closed and the boxes were removed from the vicinity of the group. This is the foraging time window. The one-minute time window was found to be enough time for the solitary dogs to explore the contents, find the food pieces and finish eating some amount of the food pieces but not all of them. This helped us gauge their preference, if any (Sarkar et al., 2019). We kept the time limit same for the groups too to have similar time levels for comparison and found that no groups had eaten all the food items either. Thus, the foraging time window started as soon as the first dog from the group sniffed from one of the boxes. Consequently, although the entire foraging time window for the experiment was 1 min, only the first responder was able to avail of it. The experimenter had 10 extra seconds post the one-minute window to restrict the dogs’ access to the food inside the boxes. This experiment (and the one on solitary dogs) was carried out during those times when the activity level of the dogs was greater than 50% (Banerjee and Bhadra, 2022). We also made sure to keep a buffer of at least 3–4 h between our experiment and the general time around which people in India throw leftovers and garbage (around lunch and dinner hours) to ensure that dogs, both solitary and in groups, had similar motivations to participate in the experiment. The experiment was carried out on 136 groups, of which 119 groups interacted with the set-up, and compared with 68 solitary dogs (both adults and juveniles) from the previous experiment.
Each event of sniffing and eating by an individual dog within a group was assigned an order from 1–6. Let us consider an example where the mixed box was sniffed first, followed by protein box and then the dog ate from it and this was followed by the dog eating from the mixed box and then sniffing the carbohydrate box. In this case, the order would be assigned as SM-1; SP-2; EP-3; EM-4; SC-5, where SM stands for sniffing mixed, EP stands for eating protein and so on. The sniffing time for each dog started from the moment they began investigating by sniffing at their first box and ended at the moment the dog encountered food and picked it up in its mouth. The exploratory and evaluative behaviour carried out by dogs through sniffing is termed as sampling. At least one dog from a group had to sample once from one of the boxes for that group to qualify as a successful response to the set-up. We also noted down the following things: (a) the time taken to sniff from the time the experimental set-up was available for investigation to the dogs, called latency to sniff time, (b) the time taken to eat from a box after its first instance of sniffing known as latency to eat time, (c) frequency of sampling before and after eating, (d) the total time and attempts spent on each box and the time spent in each such attempt, and (e) whether dogs showed vigilance behaviour, defined as visual scanning of the surrounding environment (Roberts, 1996).
We used Bayesian statistics to analyse our data. We ran multiple generalised linear mixed effects model for parameter estimation using the brms package (Bürkner, 2017) in R 4.0.2 (R Core Team, 2021). We used a weakly informative prior specifying a normal distribution (mean = 0, SD = 1) on the fixed effects and an exponential distribution (SD = 1) on the random effects for all the models (Model specific shape parameter priors have been mentioned in relevant sections). Thus, we favoured no specific direction for the effects whilst keeping their magnitude within reasonable values. We used 95% Bayesian Credible Interval (BCI) to assess the variability in parameter estimates and to interpret our findings (Van de Schoot et al., 2014). We reported log odds ratios (LOR) for the logistic, multinomial, and beta regressions. In case the model predictors had more than two levels, we compared the levels against each other using contrasts. The contrasts were reported in response scale (i.e., probability for logistic regression) Credible intervals that did not overlap zero (unless a different value is stated) indicated difference between parameters.
For models, we ran 5,000 (8,000, for complex models) iterations of the Markov Chain and discarded the first 1,000 (or 2000) as a warm-up. We used efficient approximate leave-one-out cross-validation (loo) (Vehtari et al., 2017) or k-fold cross validation (Arlot and Celisse, 2010) to select the best fitted candidate model amongst the ones we fitted. There were two exceptions to the usage of this condition: (a) When there was only a single candidate model and (b) When a model with lower loo score made more logical sense, as a better estimation of prediction error does not automatically lead to a better model (Fushiki, 2011). Furthermore, we used graphical posterior predictive cheque to assess if our best fitted model gives valid predictions with respect to our observed data.
We carried out time-to-event analysis using the rstanarm package (Goodrich and Gabry, 2020) to compare latencies. For each model, we compared the posterior estimate of the standardised survival curve to the Kaplan-Meier survival curve which helped us to assess the model fit to the observed data (estimated survival function cheque). We also validated our result using restricted mean survival time (RMST), interpreted as the average event-free (as in, no sniffing/eating) time up to a pre-specified important time point, τ. For all models Gelman and Rubin’s Rhat statistic was used to assess convergence and it was adequate in all cases with Rhat = 1 (Gelman and Rubin, 1992). All the videos were decoded by one of the experimenters. 24% of the videos of the current experiment were additionally decoded by another person, not part of the experiment. The inter-rater reliability was measured through the Cohen’s kappa coefficient for the categorical variables and were found to be 0.784–0.829. For the quantitative and ordinal data, we used intraclass correlation estimates based on a single rating, absolute agreement, two-way mixed effects model and the scores were found to be in the range of 0.791–0.999.
The experiment did not involve any invasive procedure, and the food provided to the dogs were fit for human consumption. Dog feeding on streets is permitted by Prevention of Cruelty to Animals Act 1960 of the Parliament, and this experimental protocol did not need any additional clearance from the Institute ethics committee, as it did not violate the law.
The results have been broadly categorised under various components of the foraging process-(a) Sampling (this includes the search, exploration and evaluation components), (b) Handling and Allocation (this includes the time and effort expended on a “patch”), (c) Feeding (this includes the utilization of resources and preference components), and (d) Risk Management (this looks at the various behavioural tools and solutions to manage competitors, predators, and other challenges).
Sampling was said to be initiated when a dog first sniffed one of the boxes. We analysed whether the dogs sampled first from a particular box(es) more than the others. This response variable was trinary (“box”), “M” for mixed box, “P” for protein box, and “C” for carbohydrate box. We ran a multinomial logistic regression. Our model was a hierarchical Intercept only model with random effect of group nested within place. “groupid” refers to the identity of the group the dog belongs to.
The results of the regression using contrasts showed that neither one of the three boxes were likely to be sampled first more than the other two (95% CI for C–P: −0.162, 0.171; 95% CI for C–M: −0.200, 0.080; 95% CI for P–M: −0.207, 0.079) (see Figure 1).
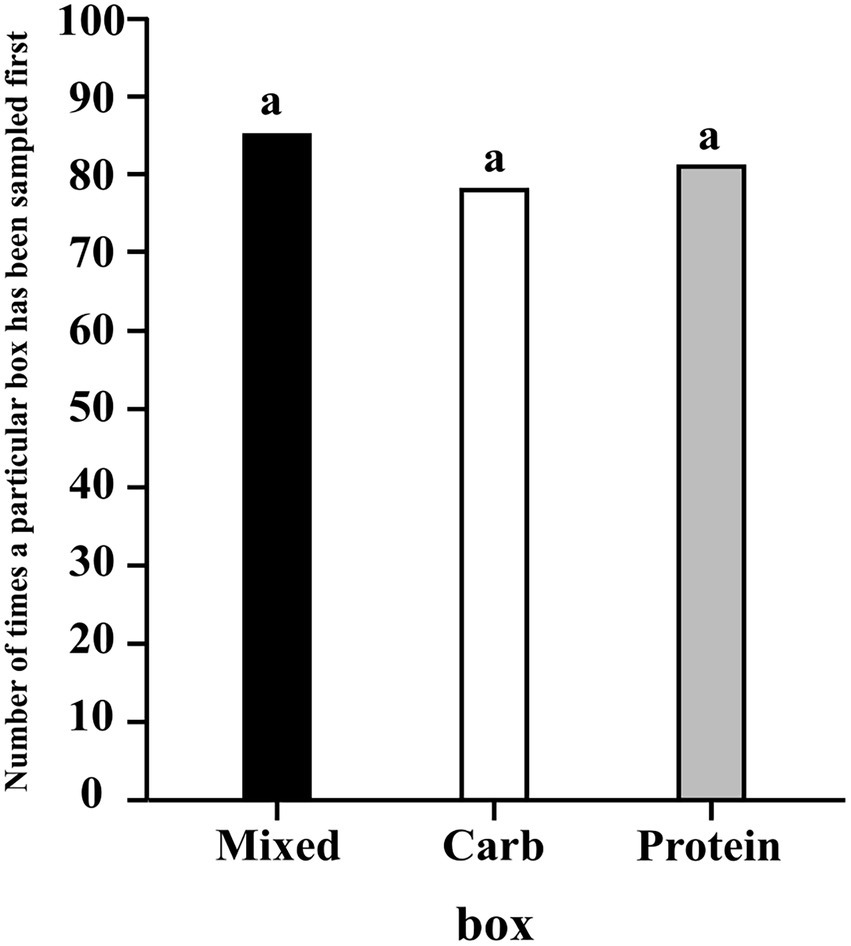
Figure 1. A bar graph showing the frequency of the first sampling event for each box; the letter “a” denotes there is no difference between the sampling of boxes.
We analysed the activity patterns of the dogs in groups. We quantified the likelihood of sampling all the three boxes across groups, dogs, and foraging time through a binary response variable (“sniff”; “Y” when a box was sniffed and “N” when it wasn’t) We ran a logistic regression with Bernoulli distribution.
Our best fitted model was a hierarchical model with “random effect” of individual dog nested within group nested within place. “box” refers to the identity of the box sniffed by the dog. “groupid” refers to the identity of the group the dog belongs to and “id” refers to its own identity. Here the dependent variable “sniff” stands in for sampling.
The results of the regression using contrasts showed that for sampling, neither carbohydrate box (M–C median estimate: 0.070; 95% CI: (−0.017, 0.156)) nor protein box (M–P median estimate: −0.038; 95% CI: (−0.123, 0.047)) were sampled any more or less than mixed box. But protein box had a higher probability of being sampled than carbohydrate box [P–C median estimate: 0.107; 95% CI: (0.022, 0.195)] (see Figure 2).
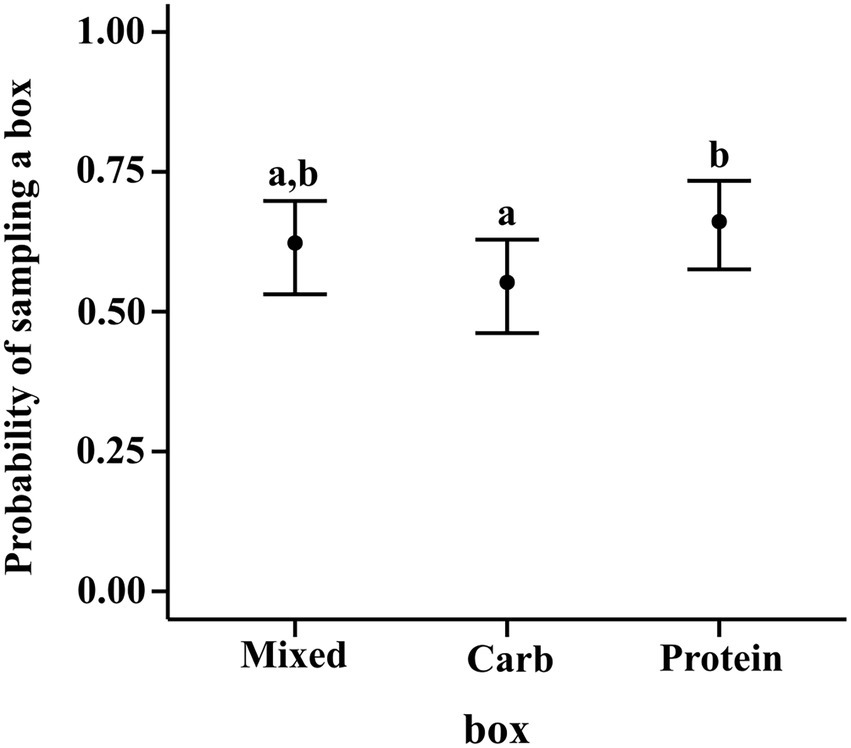
Figure 2. Conditional effects plot of the sampling preference logistic regression; the error bars display the 95% credible interval; the circles represent posterior medians; the letters denote the presence/absence of difference across the predictor, “box”.
We analysed whether more than one box was sampled either by dogs in groups or individually or both before the first event of eating from a box. A sampling event was initiated when the dog sniffed a different box from the one which it was currently sniffing. That was counted as Sampling Event 1, sniffing another box or returning to the previous box was Sampling Event 2, and so on. The end point was when the dog started eating. The response variable was binary (“morethanone”), “no/(0)”: when only one box was sampled at before eating or moving away from the set-up, and “yes/(1)”: when more than one box was sampled. We ran a logistic regression with Bernoulli distribution.
Our best fitted model was a hierarchical model with “random effect” of group nested within place. “firstbox” refers to the first box sampled by the dog (Mixed/Protein/Carbohydrate boxes) and “status” refers to whether the dog was solitary or in a group.
The results of the regression using contrasts showed that dogs in groups were more likely to sample other boxes before eating if the first box they encountered was carbohydrate box (C–M median estimate: 0.202; 95% CI: 0.051, 0.348; C–P median estimate: 0.159; 95% CI: 0.005, 0.310), as compared to mixed and protein boxes. There was no such difference in sampling between protein and mixed boxes (95% CI: −0.100, 0.184). Solitary dogs showed no difference in sampling likelihood before eating regardless of the box they first encountered (95% CI of (a) P–M: −0.195, 0.366; (b) C–M: −0.216, 0.362; (c) C–P: −0.273, 0.243). Additionally, the likelihood of sampling other boxes after encountering the protein box first was more in solitary dogs than dogs in groups (PS–PG median estimate: 0.235; 95% CI: 0.003, 0.467) (see Figure 3).
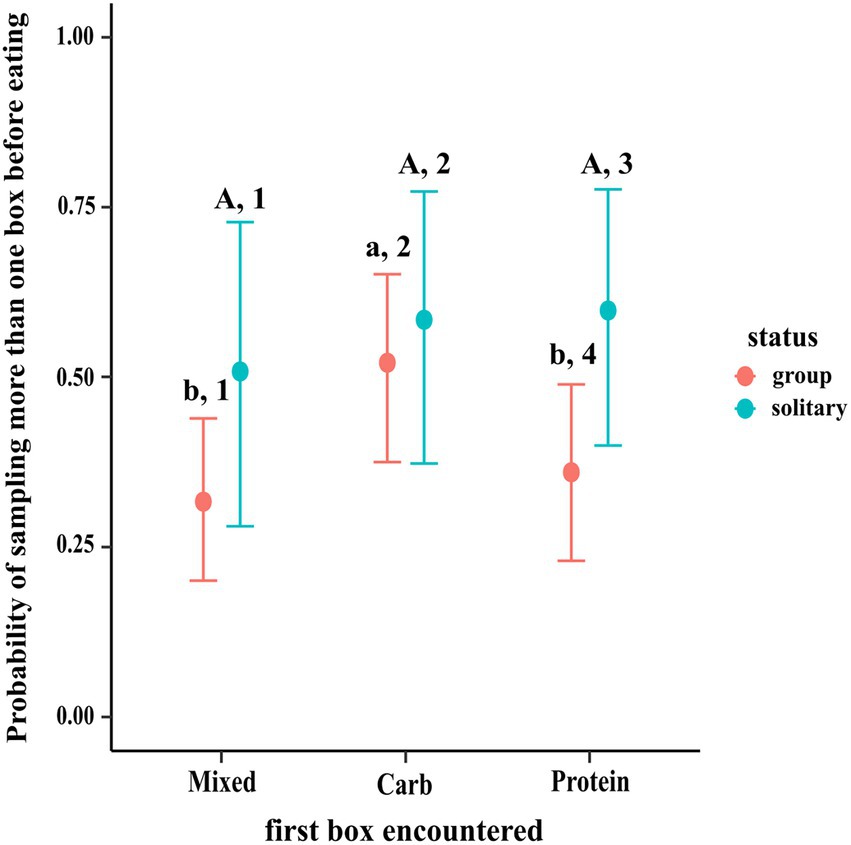
Figure 3. Conditional effects plot of the pre-eating sampling logistical model; the error bars display the 95% credible interval; the circles represent posterior medians; the uppercase letters denote the presence/absence of difference within solitary dogs, the lowercase letters for difference within groups & the numbers denote that across status.
We analysed whether dogs sampled from other boxes after they had initiated the first event of eating and, if yes, the number of such sampling events. We ran a multilevel hurdle model for the zeroes (“hu”: whether or not sampling post eating was done) and a Poisson regression for the counts of such non-zero attempts.
Our best model was a hierarchical model with group nested within place. “morethanone” refers to whether or not the dog sampled multiple boxes before the first event of eating and “grpsize” refers to the number of group members present on the day of the experiment for a particular group (solitary dogs were a “group of 1,” i.e., their group size was 1).
The results of the regression showed that dogs who did multiple pre-eating sampling were less likely to sample other boxes post-eating (mean Estimate = 0.98, 95% CI = 0.29, 1.68). Furthermore, larger the group size, more the likelihood of sampling post-eating (mean Estimate = −0.33, 95% CI = −0.59, −0.10). Neither pre-eating sampling, nor the group size have any effect on the rate of post-eating sampling (see Figure 4).
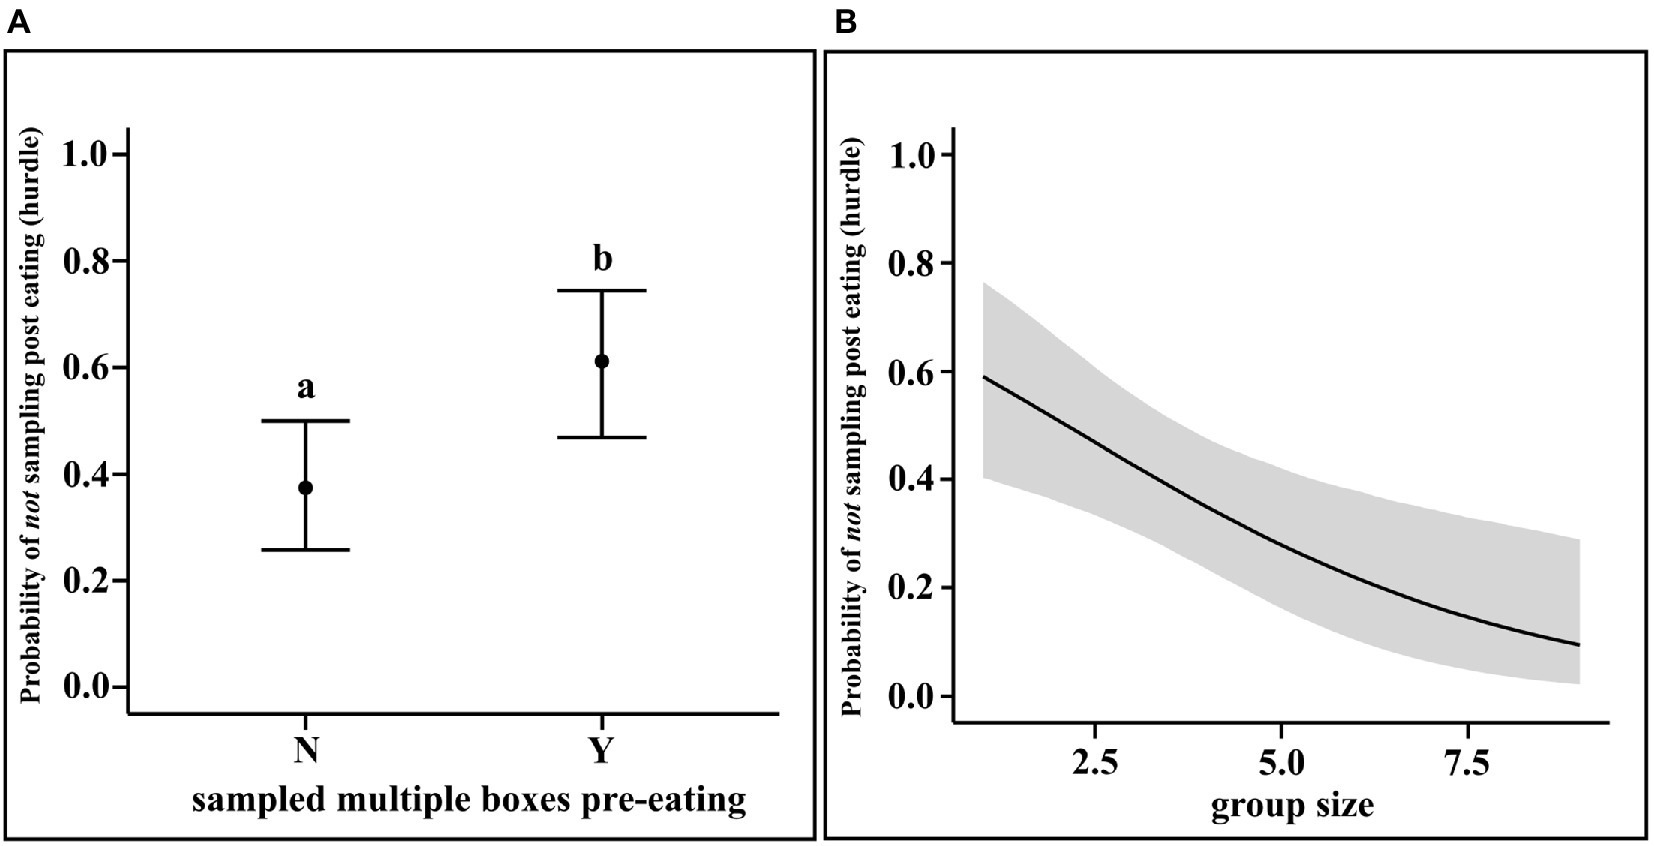
Figure 4. (A) Conditional effects plot of the hurdle parameter in the post-eating sampling hurdle-Poisson model for the “morethanone” predictor; the error bars display the 95% credible interval; the circles represent posterior means and (B) Conditional effects plot of the hurdle parameter in the post-eating sampling hurdle-Poisson model for the “grpsize” predictor; the grey area displays the 95% credible interval posterior medians; the letters denote the presence/absence of difference between the probabilities of whether or not multiple boxes has been sampled pre-eating” for (A).
Total handling attempts (THA) is defined as the number of times a particular box has been engaged (sniffed/foraged/eaten from) with over the entirety of time available to the dog of a minute. An attempt is initiated when a dog interacts with a box through one of the activities mentioned above and ends when the dog stops interacting with the box. Disengagement happened when a dog started sniffing another box, started looking around for potential dangers or opportunities or was distracted due to external factors like car horns or ticks. We analysed whether dogs handled a box and, if yes, the number of such handling attempts. We ran a multilevel hurdle model for the zeroes (“hu”: whether or not handling was done) and a Poisson regression for the counts (number: number of handling attempts for the non-zero responses).
Our best model was a hierarchical model with individual dog (“id”) nested within group, nested within place. “tha” refers to total handling attempts and “box” refers to the identity of the box.
The results of the regression showed that the identity of the box did have an effect on the rate of THA. The contrast values of the THA rate on the response scale of count for the mixed box and protein boxes were higher as compared to carbohydrate box (median Estimate for M–C = 0.177, 95% CI = 0.024, 0.337; mean estimate for P–C = 0.222, 95% CI = 0.068, 0.382). The rate of THA was not different between protein and mixed box. Furthermore, the identity of the box had an effect on the likelihood of being handled (computed through the hurdle parameter). Carbohydrate box was less likely to be handled as compared to protein box (median estimate for P–C = −0.090, 95% CI = −0.166, −0.016), whereas there were no differences between protein and mixed boxes or mixed and carbohydrate boxes (see Figure 5).
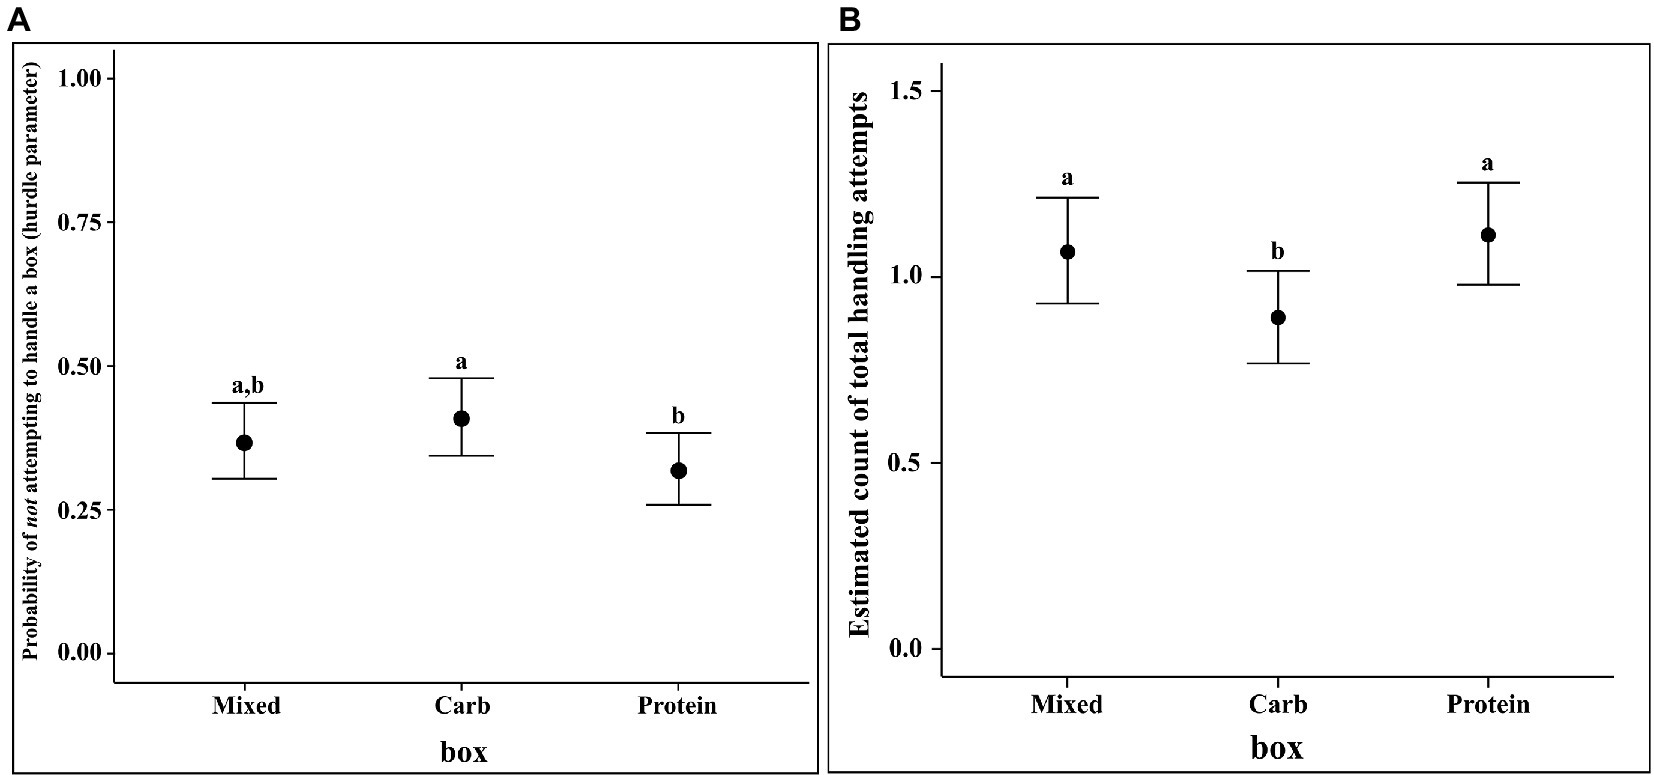
Figure 5. (A) Conditional effects plot of the hurdle parameter in the THA hurdle-Poisson model for the “box” predictor and (B) Conditional effects plot of the rate parameter on the count scale in the THA hurdle-Poisson model for the “box” predictor; the error bars display the 95% credible interval; the letters denote the presence/absence of difference across the predictor, “box”.
Total handling time (THT) for a particular box is defined as the proportion of time spent by a dog throughout the totality of its handling events on a particular box out of its total available time to forage. We ran a zero–one-inflated beta distribution to account for the zeroes and ones in the dataset. We reported log odds ratios with 95% credible intervals. We computed the log odds difference between the three box types to check if one box type was handled more or less than the other.
Our candidate model was a hierarchical model with individual dog (“id”) nested within group, nested within place. “propht” refers to the proportion of the time a dog spent at a box foraging (handling a resource patch) out of the total available time to forage and “box” refers to the identity of the box the dog spent that time in and “status” refers to whether they were in group or solitary.
The results of the regression showed that dogs in groups spent lesser proportion of time handling the carbohydrate box as compared to mixed and protein boxes as shown by the posterior difference (95% CI for M–C = 0.051, 0.240; 95% CI for P–C = 0.086, 0.301). Solitary dogs spent a greater proportion of time handling protein box as compared to carbohydrate box (95% CI for P–C = 0.010, 0.321) but no such difference between protein and mixed boxes (95% CI for P–M = −0.285, 0.014) or between mixed and carbohydrate boxes (95% CI for M–C = −0.125, 0.178) was observed. No difference across type (group vs. solitary) was seen for the same box (e.g., group mixed vs. solitary mixed). The conditional effects plot of the model is given in Figure 6.
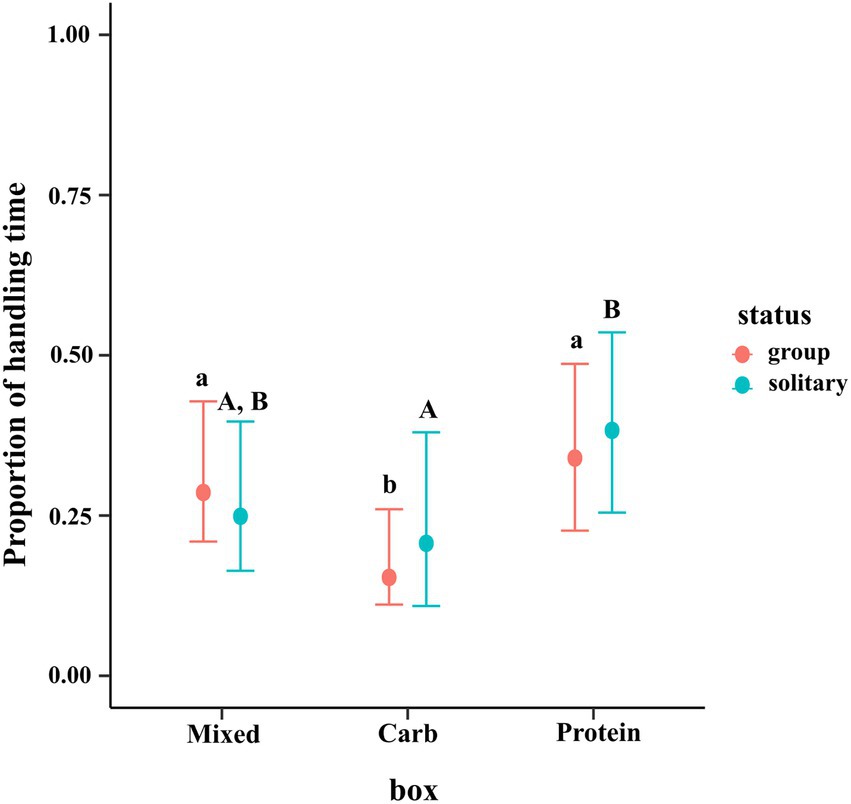
Figure 6. Conditional effects plot of the total handling time zero–one inflated beta regression; the error bars display 95% credible intervals; the circles represent the posterior medians; the uppercase letters denote the presence/absence of difference within solitary dogs and the lowercase letters for difference within groups.
Unit handling time is defined as the amount of time spent in each handling attempt out of the available proportion of handling time. It is formulated as handling time divided by THA. We carried out a generalized linear regression with zero–one-inflated beta distribution to account for the zeroes and ones in the dataset.
Our best model was a hierarchical model with individual dog (“id”) nested within group, nested within place. “prophand” refers to the proportion of the time a dog spent at a box handling it in a single attempt out of the available proportion of handling time for that particular box, “box” refers to the identity of the box the dog spent that time in and “type” refers to whether they were in group or solitary.
The results of the regression showed that solitary dogs spent a lesser proportion of time in each handling attempt as compared to dogs in groups (LOR = −0.34, 95% CI = −0.61, −0.09). Furthermore, dogs spent a lesser proportion of time in each handling attempt for carbohydrate box as compared to mixed box (M–C median estimate: 0.177; 95% CI: 0.024, 0.337) and protein box (P–C median estimate: 0.222; 95% CI: 0.068, 0.382). Unit handling time of protein and mixed boxes showed no such difference (95% CI: −0.210, 0.120) (see Figure 7).
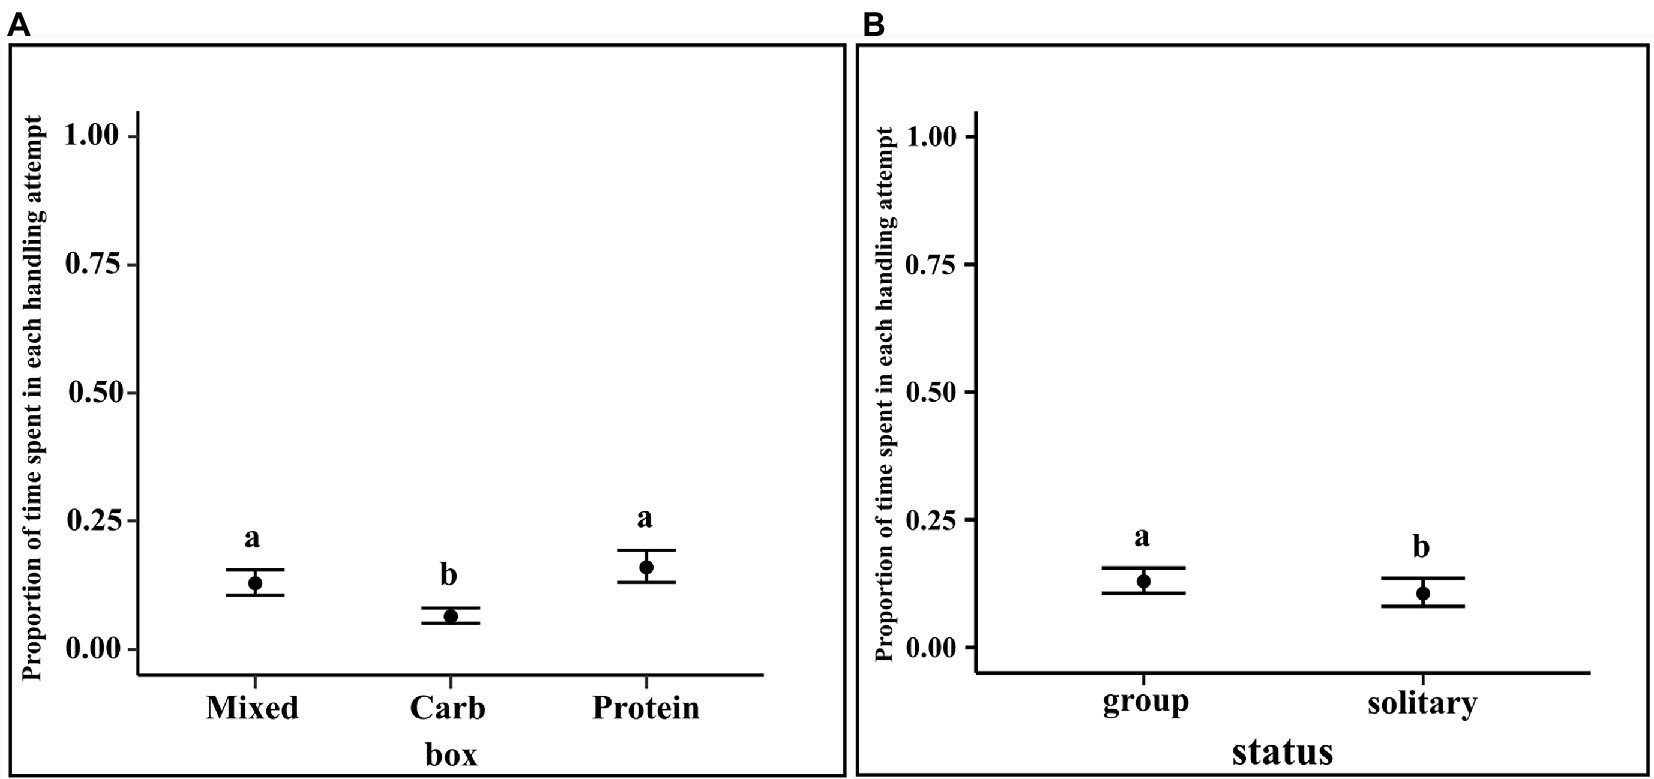
Figure 7. (A) Conditional effects plot of the unit handling time zero–one inflated beta regression for the “box” predictor; the error bars display 95% credible intervals; the circles represent the posterior medians and (B) Conditional effects plot of the unit handling time zero–one inflated beta regression for the “status” predictor; the error bars display 95% credible interval; the letters denote the presence/absence of difference across the predictors, “box” and “status”.
We ran a hierarchical, intercept only, multinomial logistic regression model, similar to model 3.1.1 and analysed whether the dogs ate first from a particular box(es) more than the others. Protein and mixed boxes had higher probability of being eaten from first as compared to carbohydrate box (C–P median estimate: -0.298; 95% CI: −0.456, −0.107; C–M median estimate: -0.358; 95% CI: −0.506, −0.175). There was no difference between protein and mixed boxes (M–P media estimate: 0.060; 95% CI: −0.145, 0.256) (see Figure 8).
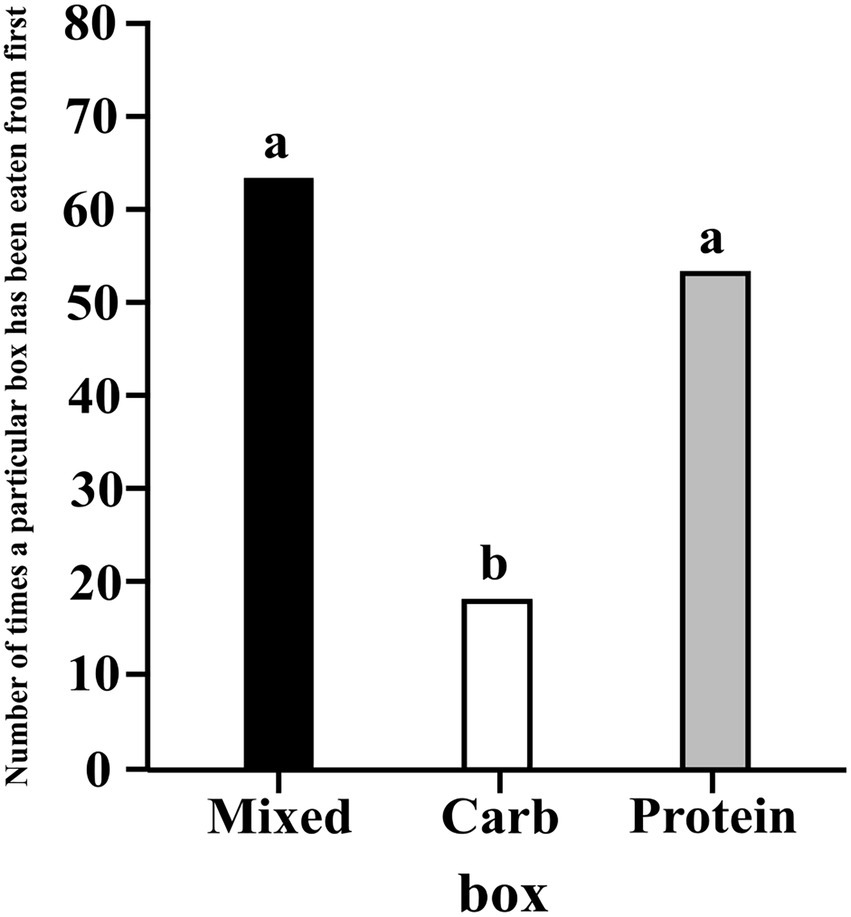
Figure 8. A bar graph showing the frequency of the first eating event for each box; the letters denote the presence/absence of difference of eating events across the different boxes.
We ran a hierarchical logistic regression model, similar to model 3.1.2. Carbohydrate box was less likely to be eaten from as compared to mixed box (M–C median estimate: 0.214; 95% CI: (0.145, 0.292)) and protein box (P–C median estimate: 0.222; 95% CI: (0.150, 0.299)). Protein and mixed box did not show any such difference among themselves (M–P median estimate: -0.006; 95% CI (−0.090, 0.077)) (see Figure 9).
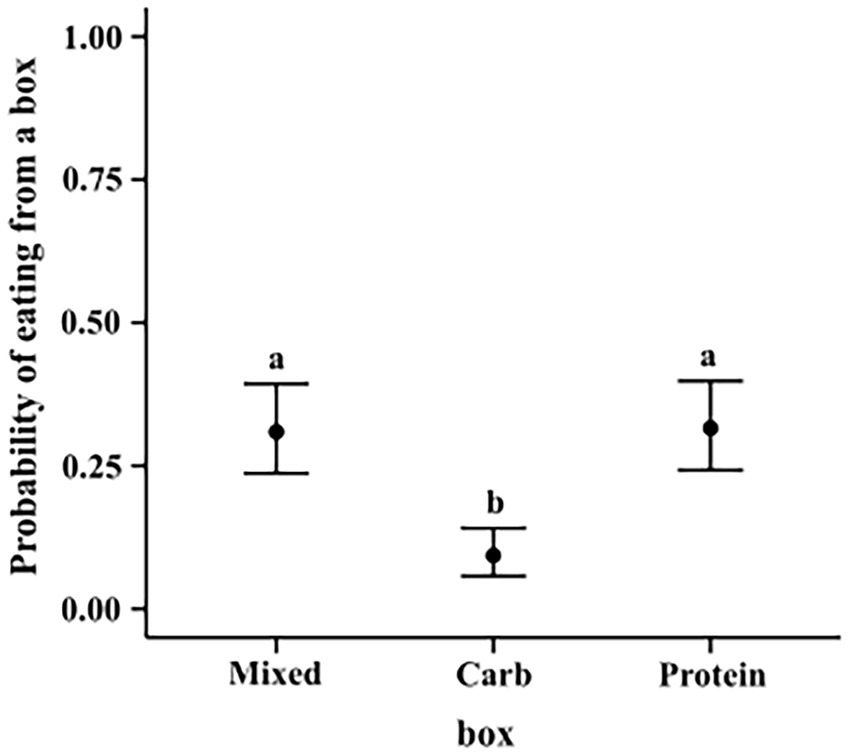
Figure 9. Conditional effects plot of the eating preference logistic regression; the error bars display the 95% credible interval; the circles represent posterior medians; the letters denote the presence/absence of difference across the predictor, “box”.
We analysed whether dogs in groups displayed SnS behaviour (sniffing a box and immediately eating from it) towards a particular box or not (Bhadra and Bhadra, 2014). The response variable was binary -“y,” dummy coded as 1, if SnS was displayed and “n,” dummy coded as 0, if SnS was not displayed. A dog could show one of four behaviours after sniffing from a box: (a) immediately eat from it (SnS); (b) sniff from a different box; (c) eat from a different box; (d) do nothing. Out of the four only (a) was coded as 1 whilst the rest were coded as 0. We ran the fitted function in brms to calculate the probabilities of each category (1 or 0) on the response scale and reported probabilities with 95% credible intervals. Credible intervals that do not overlap 0.25 indicate evidence of a difference between category levels, rather than the probability of the event being the outcome of random chance. The probability value of 0.25 was used because SnS is one of four actions that the dog can take.
Our model was an Intercept only hierarchical model with random effect of group nested within place. “groupid” refers to the identity of the group the dog belongs to. The dependent variable “dfood” (“food” being a placeholder for either one of the three boxes) was a binary variable (1 or 0) indicating if a dog displayed SnS behaviour towards the respective box.
The results showed that the probability of dogs in groups following SnS towards the mixed and protein boxes is higher than a random chance event (For mixed -mean: 0.492; 95% CI: 0.381, 0.605; For protein -mean: 0.471; 95% CI: 0.373, 0.588) and lower than a random chance event for carbohydrate box (mean: 0.133; 95% CI: 0.064, 0.230). Thus, dogs in groups were more likely to show SnS strategy when they encountered protein and mixed boxes.
An interaction was said to be initiated when the first dog in a group sniffed one of the boxes. The time taken to respond from the time the first box was opened was noted. We defined the latency to sniff as a time-to-event variable. We only considered the first responders in the group data, that is, the dogs who responded first to the set-up due to the fact that they resemble solitary dogs most closely in terms of accessibility and availability of resources and time. We specified a proportional hazards model for the “hazard” of sniffing. For easier interpretation, the term “hazard” is replaced by “occurrence” in subsequent sections with no change in its meaning or mathematical formulae. We considered the effect of condition, a variable that tells us whether dogs are part of a group or solitary, on the occurrence of sniffing. The occurrence ratio (OR) quantifies the relative increase in the occurrence that is associated with a unit-increase in the relevant covariate, whilst holding any other covariates in the model constant. In our model, OR is a time fixed quantity.
Our best fitted model was a weibull model. Here, the outcome variable is time taken to sniff after opening all three boxes (or opening the first box, if the dog was curious enough to not allow the experimenters time to open all three boxes before approaching), denoted by “secstosniff,” and the predictor “condition” is a variable which can take one of two levels-solitary and group.
The results of the regression gave us the estimated ORs and showed that individuals in the solitary condition have lower rates of sniffing relative to the ones in groups. The inferred median condition effect is −0.939 with an estimate of 0.156 for the standard deviation of the marginal posterior distribution of the covariate effect. The occurrence of sniffing is 0.391 times lower than the occurrence of sniffing by individuals in group. The 95% CI of the posterior is completely below zero (−1.2, −0.6). We also checked the posterior distribution for the absolute difference in RMST between the two conditions at the average time, τ = 33 s (rmst.group – rmst.solitary). The 95% CI of the difference posterior lies entirely below zero (−12.41, −6.73). This provided evidence that the RMST is higher in solitary condition, thus sniffing earlier is more likely in group (see Figure 10).
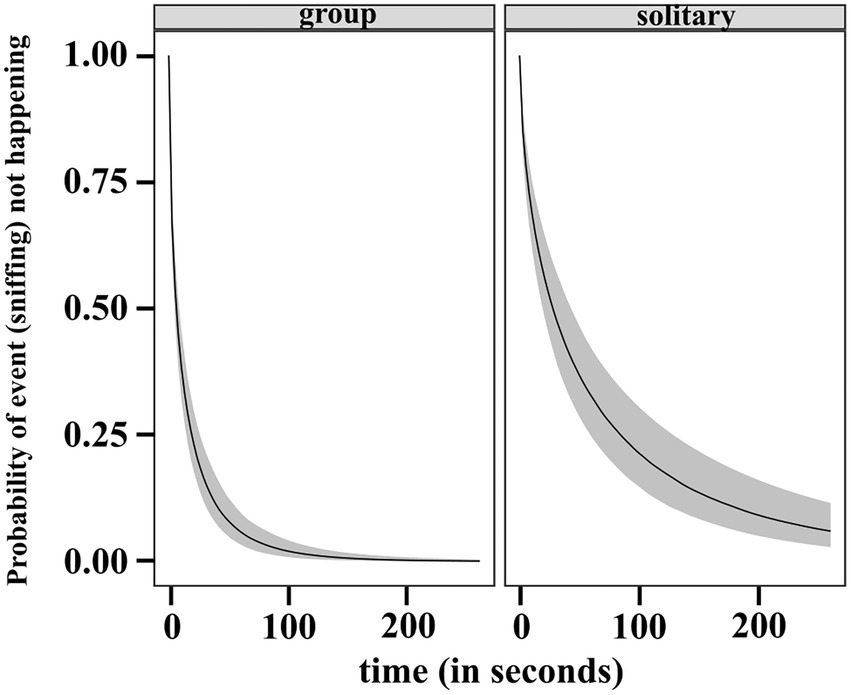
Figure 10. Predicted survival (no sniffing) function (posterior median and 95% uncertainty limits) for a dog in group and solitary condition.
The time interval available for the dog to complete the task of eating was 60 s (the total duration of the experiment once a dog started sniffing a box). Our best fitted model was a cubic m-spline model with degrees of freedom, df = 5 and δ = 3. The outcome variable is time taken to eat after first sniffing a box, denoted by “secstoeat,” and the predictor “condition” is a variable which can take one of two levels-solitary and group.
The results of the regression gave us the estimated ORs and showed that individuals in the solitary condition have lower rates of eating relative to the ones in groups. The inferred median condition effect is −0.449 with an estimate of 0.220 for the standard deviation of the marginal posterior distribution of the covariate effect. The occurrence of eating is 0.638 times lower than the occurrence of eating by individuals in group. As the 95% CI of the posterior is touching zero (−0.9, 0), we checked the posterior distribution for the absolute difference in RMST between the two conditions at the halfway time, τ = 30s (rmst.group – rmst.solitary). The 95% CI of the difference posterior lies entirely below zero (−5.11, −0.137). This provided evidence that the RMST is higher in solitary condition, thus eating earlier is more likely in group. The posterior probability that RMST at τ = 30 is higher for solitary than group is 0.981 giving further support to our result. We plotted the predicted survival function between 0 and 60s for a dog in each of the condition in Figure 11.
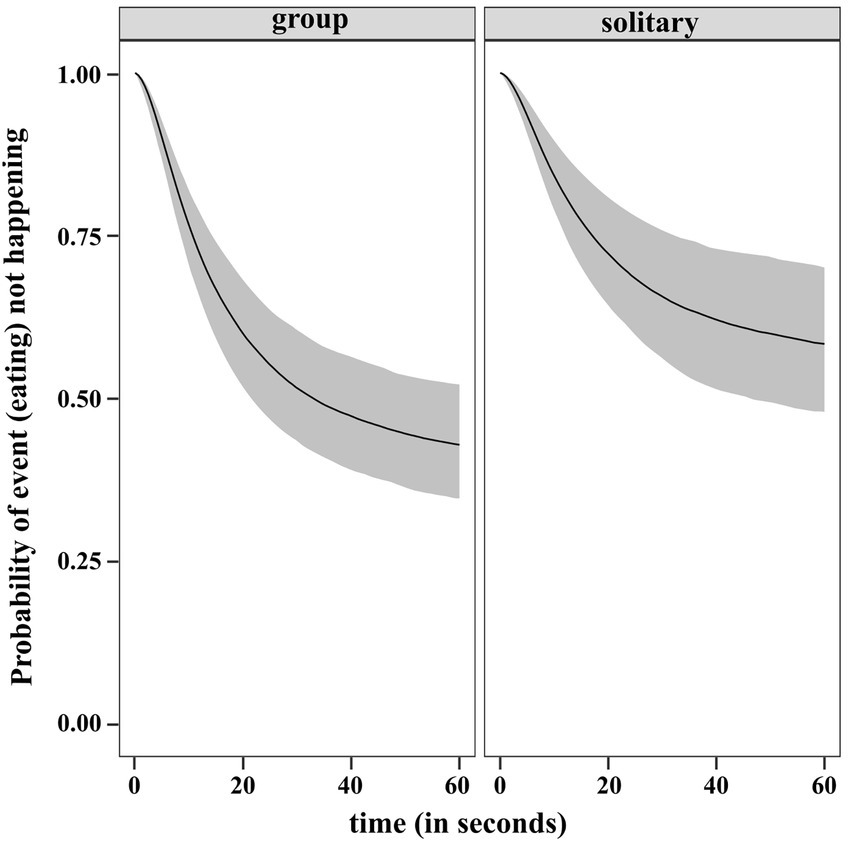
Figure 11. Predicted survival (no eating) function (posterior median and 95% uncertainty limits) for a dog in group and solitary condition.
The following behaviours were included under vigilance behaviour: (a) alert scanning whilst eating or suspending foraging, (b) continuously looking at something whilst eating or suspending foraging, (c) showing wariness whilst looking at something (including experimenters/humans), (d) following the movement of traffic, humans or other moving objects even if dog has moved away from boxes, and (e) alert and scanning whilst sitting.
The following behaviours were not considered: (a) looking at insects/walls/ground/boxes, (b) looking at humans in a positive gesture (for, e.g., affiliative), (c) If eyes are not clearly visible and head movement is negligible, (d) sitting and looking with a relaxed posture (d) walking out of the frame.
Our best model was a hierarchical logistical model with group nested within place. “scanenvdn” is a binary variable and refers to whether a dog showed vigilant behaviour and “status” refers to whether the dog is solitary or in group.
The results of the regression showed that compared to dogs in groups, solitary dogs are more likely to scan their environment (LOR = 1.30; 95% CI = 0.59, 2.06). The conditional effects plot of the model is given in Figure 12.
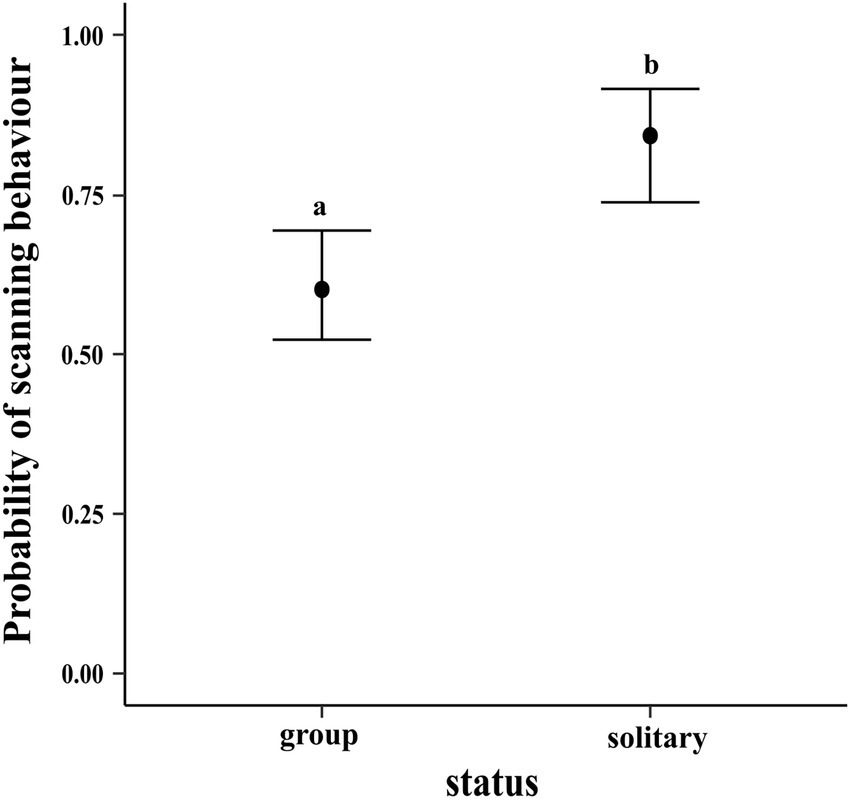
Figure 12. Conditional effects plot of the vigilance logistic regression; the error bars display the 95% credible intervals; the circles represent the posterior medians; the letters denote the presence/absence of difference across the predictor, “status”.
Below, we present our results in the form of a figure that summarises the most likely steps taken by dogs during foraging (see Figure 13).
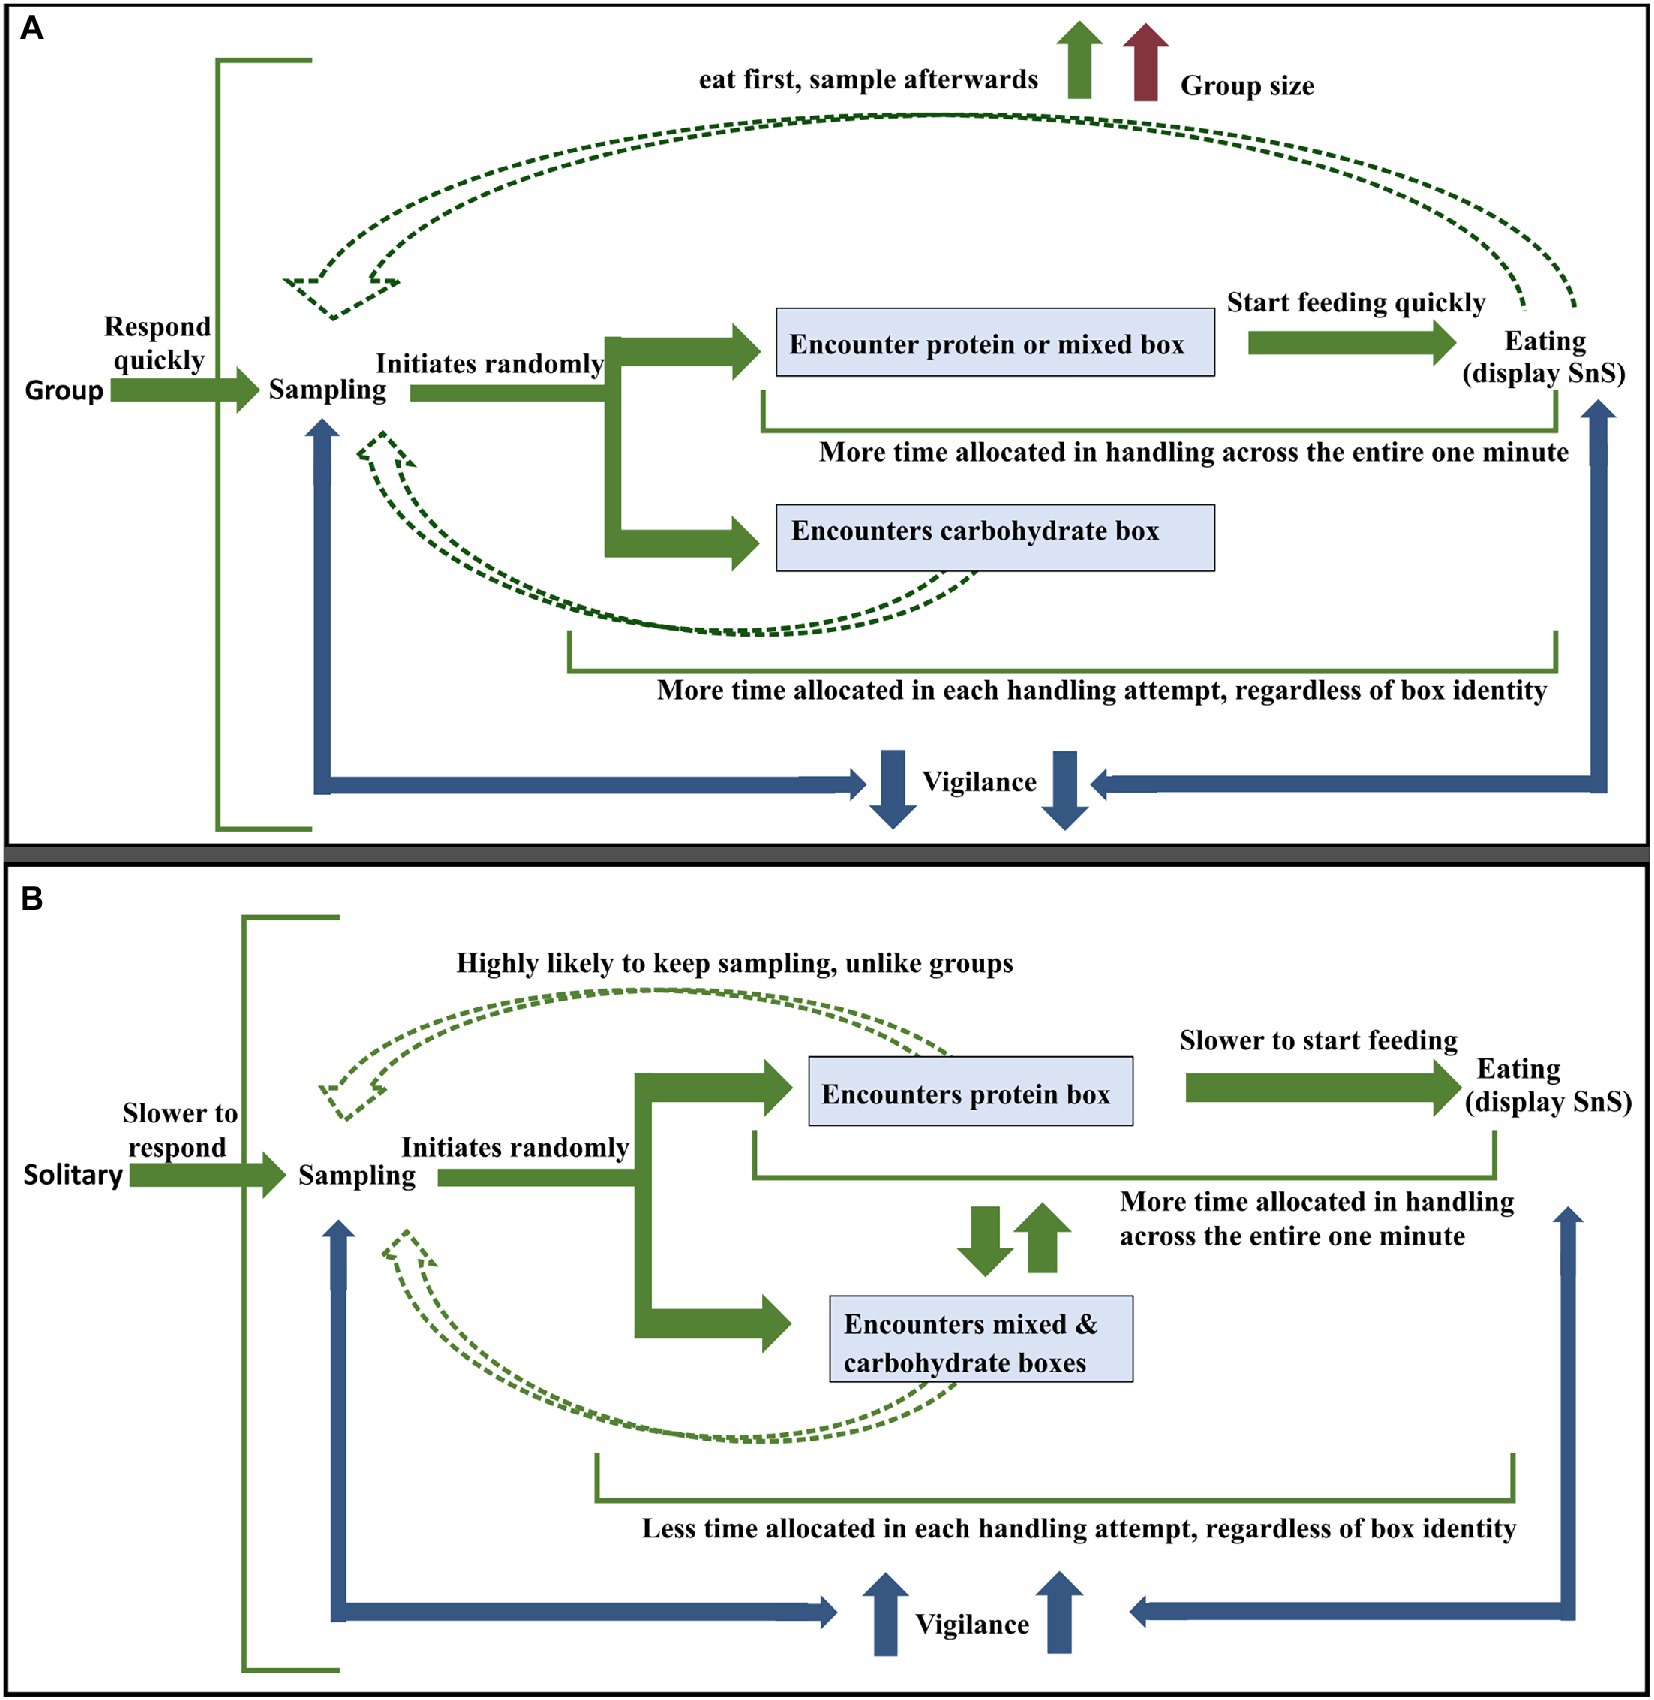
Figure 13. (A) Most likely strategy followed by dogs in groups (B) Most likely strategy followed by a solitary dog. The green arrows depict the flow of events and the blue arrows in both pictures represent effort given to vigilance activity in between sampling and eating. The red arrow in (A) stands for increase in group size the dashed green arrows represent recurrent sampling events by the dogs post the initial sequence of events (solid green arrows).
Resources are often distributed in a heterogenous and stochastic fashion across time and space in patches. The acquiring of such resources is dependent on the ability to make profitable foraging decisions by foragers. Such decisions can only be made by gathering information about patch heterogeneity. Patch quality information can be gathered whilst exploiting it. This is known as sampling for information (Stephens and Krebs, 1986). Foragers harvest information from the environment by sampling and investigating through visual, olfactory, and chemical cues and using such information to modify their behaviour accordingly (Lima, 1984; Sandlin, 2000). In uncertain environments, animals spend a considerable amount of their time investigating, with a significant proportion of that spent in resource-rich patches (Lima, 1984; Naef-Daenzer, 2000). As the resources in a patch deplete, foragers may have to frequently reassess patch choice and make decisions whether to stay, move on or re-visit a previous patch (Smith and Sweatman, 1974; Krebs et al., 1977).
In our experiment, the boxes simulating dustbins acted as heterogeneous resource patches about which the dogs had no prior knowledge. Thus, the only way to collect information and assess the quality of the patches was through sampling them. A major decision node around which we split the dogs’ sampling efforts was the first eating event. Previous research had shown that solitary dogs harvested the best resource patch first but showed no such preference during sniffing (Sarkar et al., 2019). Our current experiment showed that sampling played an important role during foraging in free-ranging dogs. Dogs in groups sampled multiple “patches” (boxes), leaving behind sub-optimal food as evidenced by the fact that sampling likelihood increased if dogs came across the carbohydrate box first, until they encountered the best available resource and then ate from it. Solitary dogs, on the other hand, were more likely to keep sampling even if they encountered the best “patch” first, the protein box. The fact that dogs who sampled multiple boxes before eating did not keep sampling afterwards elucidated the role of sampling as an information gaining process with specific purpose of finding the best available resource “patch” and not a random, undirected behaviour. Furthermore, the post-eating sampling tendency increased with an increase in group size. Thus, dogs in groups were more likely to “eat first, sample afterwards” as compared to solitary dogs. This behaviour hinted at an implicit effect of competition, in the presence of conspecifics, at play. Overall, these results highlight several salient features of the dogs’ sampling strategy. Whilst sampling individually, it might be hypothesized that free-ranging dogs were always on the lookout for better opportunities. Thus, even after encountering protein box, they often chose to leave it without eating from it to sample other boxes. In groups, dogs were aware of the risk of opportunity and food loss posed by the presence of other group members and thus paused their sampling as soon as they found their preferred food, regardless of quantity. This strategy of quickly initiating eating from a near optimal (mixed) or an optimal (protein) “patch” they encountered and then collecting information from other “patches” assured them of some amount of energy gain whilst keeping their options open for moving onto better “patches,” if they became available. This demonstrates that dogs were able to assess and evaluate the quality and quantity of resources available in a patch. They were also aware and adaptable to the presence of other members and took all of these into account before making a decision of eating. Additionally, in both cases, solitary, and group, no particular box was sniffed first more than the others, thus demonstrating that the dogs did not have an instantaneous clue of the location of preferred food and thorough sampling was the only way for them to gather information about the “patches.” This is further supported by the fact that once profitable patches had been located through sampling, dogs in groups tended to eat more and eat first from the protein and mixed boxes as compared to the carbohydrate box and solitary dogs ate more and ate first from protein box only (Sarkar et al., 2019).
In keeping with the unpredictable environment that they live in and the fluctuating food resources available therein, free-ranging dogs were found to investigate and engage with all the available resource “patches” (boxes), though they concentrated their maximal efforts on the energy-rich boxes (protein and mixed), choosing to handle them more number of times than the energy-poor boxes (carbohydrate). Furthermore, instead of allocating all their time to the best “patch” once located, the dogs allocated different proportions of their available time to different “patches” depending on their quality with better “patches” allocated more time but suboptimal patches allocated a small proportion of time too. Although this seems to be a deviation from optimal behaviour, it is hypothesized that the dogs are actually prioritising a long-term adaptation to a fluctuating environment, akin to titmice foraging (Smith and Sweatman, 1974). In their natural habitat, food resource clumps such as dustbins and garbage dumps vary in food abundance across time such that high abundance food sources can become low abundance ones at a later time and vice versa. In such a scenario, it is advantageous to spend some time handling all “patches,” especially if the distance between the “patches” are minimal, as is the case here, in order to continually track the status of the environment and change the allocation as and when necessary. Additionally, dogs spent a lower proportion of time in each handling attempt for the carbohydrate box as compared to the mixed and protein boxes. This can be because of two reasons. One, apart from handling carbohydrate box fewer times, the smaller time allocation for each attempt shows that dogs expend less effort for a suboptimal resource. The other reason seems to be that between feeding from protein and mixed boxes, dogs would sample from carbohydrate box too and would quickly assess the value to be lower than that of the other two boxes and move back to them. Unfortunately, we were unable to observe the amount of food eaten by individual dogs. Thus, we were unable to find out the point of resource depletion at which the dogs shifted to another patch.
The decision-making displayed in the sampling and allocation components of free-ranging dogs’ foraging behaviour implies that the dogs employ a random search optimization process between patches initially when information about the patches is low, and then switch to systematic foraging when information is obtained (Baum, 1987; Bartumeus and Catalan, 2009). By heterogenous sampling of the patches, the dogs attempt to increase their chances of encountering their preferred food quickly. Once located, more time and effort are spent in some patches than others. Further research is required to provide a definitive understanding of the optimization process, for example, whether dogs revisit previous patches, and to check the generalizability of the process observed.
Free-ranging dogs are known to forage singly as well as in groups (Sen Majumder et al., 2014). Group living animals have to balance between access to quality nutrition and conspecific competition. Decreased resource selectivity in the presence of conspecifics reflects an adaptive response to competition. Such decreased selectivity can also be observed in the free-ranging dogs in the current experiment. Whilst solitary dogs sought to maximise both quality and quantity of the available food by preferentially feeding from the protein box (Sarkar et al., 2019), dogs in groups show a relaxation in their preference by feeding from both protein and mixed boxes equally. Whilst it might be hypothesized that the dogs moved to the mixed box only after they believed that the protein box had no valuable resource to offer them, we do not think that is the case here. The dogs ate first from both the boxes equally showing that instead of the protein box being the top “patch” in preference hierarchy, the dogs have relaxed their choice to include both as equally preferable. As dogs ate chicken pieces in overwhelmingly high amount than bread (80.5% of the total food eaten; Supplementary Figure 2), it implies that even whilst eating from the mixed box, they selectively, but not completely, preferred eating the chicken pieces over bread. Thus, whilst there is increased acceptance in terms of feeding from lower valued “patches” (lower quantity of preferred food), there is little change in acceptance of lower valued food as compared to solitary dogs. Solitary dogs follow the SnS strategy exclusively for the protein box whereas the dogs in groups apply the strategy to both mixed and protein boxes. Taken together, these results show that even in groups, dogs do follow the Rule of Thumb, “If it smells like meat, eat it” (Bhadra et al., 2016). These results lend credence to optimal foraging prediction, with a slight deviation, that states that if foods of higher value are available, low value items should be rejected, regardless of their abundance (Pyke, 1977). Similarly, free-ranging dogs sequester the preferred food, meat, first, followed by bread. But, instead of complete rejection, there is preference priority in that whilst they prefer eating chicken, they are not averse to eating bread if they do come across it in the mixed box. This seems to be an adaptation of the scavenging lifestyle that these dogs lead wherein they try to maximise nutrients in any form they can whilst maintaining their preference.
Free-ranging dogs are known to be bolder in groups (Bhattacharjee et al., 2020). The reduced time demonstrated by groups in responding to the experimental set-up and in eating as compared to solitary dogs imply the presence of such traits during foraging. Indeed, it was found that solitary dogs are more likely to indulge in vigilance behaviour as compared to those in groups, perhaps due to the likelihood of facing competition from other dogs and scavengers whilst foraging. Since this was not the focus of this experiment, we did not attempt to look into this behaviour in great detail. Dogs in groups are also known to spend more time engaging with the boxes in each foraging attempt. Foraging in groups confer multiple benefits to animals, some of which such as reduced vigilance (Beauchamp, 2003) and more time spent in foraging (Gotmark et al., 1986) seem to be behind the dogs’ action here. However, we must specifically investigate other factors that might elicit similar behaviour in future studies. Intragroup competition and social rank appropriate behaviour might be two such factors (Elgar, 1989).
To summarise, dogs in groups initiated their sampling randomly, choosing to keep sampling multiple boxes if they first encountered a suboptimal “patch” (carbohydrate box). On encountering an optimal (protein box) or near optimal (mixed box) “patch,” they followed a “eat first, sample afterwards” strategy. The likelihood of this strategy being followed increased with increasing group size. These dogs allocate varying proportions of time to different “patches” based on their quality with higher quality “patches” (both protein and mixed) allocated a higher portion of the time. Dogs, in general, expended more effort (quantified through attempts) in handling these higher quality “patches” with more time spent in these “patches” with each attempt. A similar preference of “patches” is observed in the feeding choice of groups too. Overall, dogs in groups spent a higher proportion of time in each of their handling attempt, initiated sampling and eating quicker, and were less likely to display vigilant behaviour as compared to solitary dogs.
Solitary dogs initiated their sampling randomly and were likely to sample all three boxes at least once. Unlike dogs in groups, solitary dogs were likely to keep sampling boxes even if the first box they encountered was the protein box. They were least likely to sample once they started eating. They preferred feeding from protein box over others and allocated more time to handling protein box over carbohydrate box.
In this study, we investigated the foraging behaviour of free-ranging dogs in groups and compared it against that of solitary dogs. This study is the first of its kind to explore in detail the foraging strategies of these dogs under different social conditions. We found that the foraging tactics of free-ranging dogs fulfil multiple characteristics of a stochastic optimal foraging strategy and that these animals are highly plastic in their behaviour and adaptable in their strategies, as befits an organism living in an unpredictable environment. Further research may focus on finding out the energy threshold that make a “patch” valuable and how animals assess that. Studies may seek to explore the mechanism behind the inverse relationship between group size and vigilance and disentangling the various factors that come into play when foraging in group such as competition, hierarchy and food density. Examining the effect of these confounding factors in tandem and alone will shed greater insights into the foraging behaviour of these animals and the causal mechanism behind such behaviours as reduced latency. Another thing worth noting would be the differing motivations of individuals, like pregnant females, across different time of the year (pre-mating and post-mating). Such studies can help to understand the strategies and behavioural patterns that enable urban adaptation in animals that adopt a scavenging strategy.
The datasets presented in this study can be found in online repositories. The names of the repository/repositories and accession number(s) can be found at: https://osf.io/ma6uq/.
Ethical review and approval was not required for the animal study because the experiment did not involve any invasive procedure, and the food provided to the dogs were fit for human consumption. Dog feeding on streets is permitted by Prevention of Cruelty to Animals Act 1960 of the Parliament, and this experimental protocol did not need any additional clearance from the Institute ethics committee, as it did not violate the law.
RSa and ABha: conceptualization, project administration, and writing—reviewing and editing. RSa: data curation, formal analysis, methodology, visualization, and writing original draft. ABha: funding acquisition, resources, supervision, and validation. RSa, ABho, DD, RB, PC, AN, RSr, AR, RSo, and AM: investigation. All authors contributed to the article and approved the submitted version.
RSa was supported by IISER Kolkata Institute fellowship. AN was supported by JNCASR Summer Research Fellowship Programme, 2019. RSo was supported by the INSPIRE fellowship of the Department of Science and Technology, India. This work was supported by the Science Engineering and Research Board (grant: EMR/2016/000595), Department of Science and Technology, Government of India.
RSa would like to thank Dr. Scott Claessens (School of Psychology, University of Auckland, New Zealand) for his immense help, guidance and mentoring of RSa in Bayesian statistics, model building and for providing manuscript inputs. Without his patience and kindness this paper would not have been possible. RSa would also like to thank Prof. Sumana Annagiri (Department of Biological Sciences, IISER Kolkata, India), Dr. Satyaki Mazumder (Department of Mathematics and Statistics, IISER Kolkata, India) and Narayan Srinivasan (Department of Mathematics and Statistics, IISER Kolkata, India) for their valuable inputs. RSa would like to acknowledge Anwesha Acharjee (Department of Biological Sciences, IISER Kolkata, India) and Tuhin Subhra Pal (Department of Biological Sciences, IISER Kolkata, India) for their help in conducting the inter-rater reliability tests. RSa would like to express gratitude to Animal Behaviour Collective for their support during the COVID-19 pandemic. We would like to thank the two reviewers, AA and NM and editor HB for their feedback in improving the manuscript.
The authors declare that the research was conducted in the absence of any commercial or financial relationships that could be construed as a potential conflict of interest.
All claims expressed in this article are solely those of the authors and do not necessarily represent those of their affiliated organizations, or those of the publisher, the editors and the reviewers. Any product that may be evaluated in this article, or claim that may be made by its manufacturer, is not guaranteed or endorsed by the publisher.
The Supplementary material for this article can be found online at: https://www.frontiersin.org/articles/10.3389/fevo.2023.1099543/full#supplementary-material
Arlot, S., and Celisse, A. (2010). A survey of cross-validation procedures for model selection. Stat Surv. 4, 40–79. doi: 10.1214/09-SS054
Banerjee, A., and Bhadra, A. (2022). Time-activity budget of urban-adapted free-ranging dogs. Acta Ethol. 25, 33–42. doi: 10.1007/s10211-021-00379-6
Bartumeus, F., and Catalan, J. (2009). Optimal search behavior and classic foraging theory. J. Phys. A Math. Theor. 42, 434002–434012. doi: 10.1088/1751-8113/42/43/434002
Baum, W. M. (1987). “Random and systematic foraging, experimental studies of depletion, and schedules of reinforcement” in Foraging Behavior. eds. A. C. Kamil, J. R. Krebs, and H. R. Puliam. 1st ed (Boston: Springer), 587–607.
Beauchamp, G. (2003). Group-size effects on vigilance: a search for mechanisms. Behav. Process. 63, 111–121. doi: 10.1016/S0376-6357(03)00002-0
Berteaux, D., Crête, M., Huot, J., Maltais, J., and Ouellet, J. P. (1998). Food choice by white-tailed deer in relation to protein and energy content of the diet: a field experiment. Oecologia 115, 84–92. doi: 10.1007/s004420050494
Bhadra, A., and Bhadra, A. (2014). Preference for meat is not innate in dogs. J. Ethol. 32, 15–22. doi: 10.1007/s10164-013-0388-7
Bhadra, A., Bhattacharjee, D., Paul, M., Singh, A., Gade, P. R., and Shrestha, P. (2016). The meat of the matter: a rule of thumb for scavenging dogs? Ethol. Ecol. Evol. 28, 427–440. doi: 10.1080/03949370.2015.1076526
Bhattacharjee, D., Sau, S., and Bhadra, A. (2020). Bolder together-response to human social cues in groups of free-ranging dogs. Behaviour 157, 363–384. doi: 10.1163/1568539X-bja10005
Bürkner, P. C. (2017). Brms: An R package for Bayesian multilevel models using Stan. J. Stat. Softw. 80, 1–28. doi: 10.18637/jss.v080.i01
Clark, C. W., and Mangel, M. (1986). The evolutionary advantages of group foraging. Theor. Popul. Biol. 30, 45–75. doi: 10.1016/0040-5809(86)90024-9
Contesse, P., Hegglin, D., Gloor, S., Bontadina, F., and Deplazes, P. (2004). The diet of urban foxes (Vulpes vulpes) and the availability of anthropogenic food in the city of Zurich, Switzerland. Mamm. Biol. 69, 81–95. doi: 10.1078/1616-5047-00123
Dasgupta, D., Banerjee, A., Karar, R., Banerjee, D., Mitra, S., Sardar, P., et al. (2021). Altered food habits? Understanding the feeding preference of free-ranging gray Langurs within an urban settlement. Front. Psychol. 12, 1–14. doi: 10.3389/fpsyg.2021.649027
Elgar, M. A. (1989). Predator vigilance and group size in mammals and birds: a critical review of the empirical evidence. Biol. Rev. Camb. Philos. Soc. 64, 13–33. doi: 10.1111/j.1469-185X.1989.tb00636.x
Fleming, P. J. S., Nolan, H., Jackson, S. M., Ballard, G. A., Bengsen, A., Brown, W. Y., et al. (2017). Roles for the Canidae in food webs reviewed: where do they fit? Food Webs. 12, 14–34. doi: 10.1016/j.fooweb.2017.03.001
Fushiki, T. (2011). Estimation of prediction error by using K-fold cross-validation. Stat. Comput. 21, 137–146. doi: 10.1007/s11222-009-9153-8
Ganas, J., Ortmann, S., and Robbins, M. M. (2008). Food preferences of wild mountain gorillas. Am. J. Primatol. 70, 927–938. doi: 10.1002/ajp.20584
Gelman, A., and Rubin, D. B. (1992). Inference from iterative simulation using multiple sequences. Stat. Sci. 7, 457–511. doi: 10.1214/ss/1177011136
Goodrich, B, and Gabry, J AI& BS. Rstanarm: Bayesian applied regression modeling via Stan [internet]. (2020). Available at: https://mc-stan.org/rstanarm
Gotmark, F., Winkler, D. W., and Andersson, M. (1986). Flock feeding on fish schools increases individual success in gulls. Nature 319, 589–591. doi: 10.1038/319589a0
Hodgson, J. (1979). Nomenclature and definitions in grazing studies. Grass Forage Sci. 34, 11–17. doi: 10.1111/j.1365-2494.1979.tb01442.x
Janson, C. (1985). Aggressive competition and individual food consumption in wild Brown capuchin monkeys (Cebus apella). Behav. Ecol. Sociobiol. 18, 125–138. doi: 10.1007/BF00299041
Kamil, A. C., Krebs, J. R., and Pulliam, HR. Foraging Behaviour. Springer. New York, NY: Plenum Press; (1987).
Kjellander, P., and Nordström, J. (2003). Cyclic voles, prey switching in red fox, and roe deer dynamics -a test of the alternative prey hypothesis. Oikos 101, 338–344. doi: 10.1034/j.1600-0706.2003.11986.x
Krebs, J. R., Erichsen, J. T., Webber, M. I., and Charnov, E. L. (1977). Optimal prey selection in the great tit (Parus major). Anim. Behav. 25, 30–38. doi: 10.1016/0003-3472(77)90064-1
Le Roux, A., Cherry, M. I., Gygax, L., and Manser, M. B. (2009). Vigilance behaviour and fitness consequences: comparing a solitary foraging and an obligate group-foraging mammal. Behav. Ecol. Sociobiol. 63, 1097–1107. doi: 10.1007/s00265-009-0762-1
Lima, S. L. (1984). Downy woodpecker foraging behavior: efficient sampling in simple stochastic environments. Ecology 65, 166–174. doi: 10.2307/1939468
Mitchell, W. A. (1989). Informational constraints on optimally foraging hummingbirds. Oikos 55, 145–154. doi: 10.2307/3565417
Naef-Daenzer, B. (2000). Patch time allocation and patch sampling by foraging great and blue tits. Anim. Behav. 59, 989–999. doi: 10.1006/anbe.1999.1380
Nefzaoui, A., Ben Salem, H., Abdouli, H., and Ferchichi, H. (1995). Palatability for goat of some Mediterranean shrubs. Comparison between browsing time and cafeteria technique. Ann. Zootech. 44:117. doi: 10.1051/animres:19950587
Pal, S. K. (2001). Population ecology of free-ranging urban dogs in West Bengal. In. Acta Theriol. (Warsz). 46, 69–78. doi: 10.4098/AT.arch.01-8
Pyke, G. (1977). Optimal foraging: a selective review of theory and tests. Q. Rev. Biol. 52, 137–154. doi: 10.1086/409852
R Core Team. R: A Language and Environment for Statistical Computing. Vienna, Austria: R Foundation for Statistical Computing; (2021).
Redford, K. H. (1985). Feeding and food preference in captive and wild Giant anteaters Myrmecophaga tridactyla. J. Zool. 205, 559–572. doi: 10.1111/j.1469-7998.1985.tb03544.x
Roberts, G. (1996). Why individual vigilance declines as group size increases. Anim. Behav. 51, 1077–1086. doi: 10.1006/anbe.1996.0109
Rozin, P., and Vollmecke, T. A. (1986). Food likes and dislikes. Annu. Rev. Nut. 6, 433–456. doi: 10.1146/annurev.nu.06.070186.002245
Sandlin, E. A. (2000). Cue use affects resource subdivision among three coexisting hummingbird species. Behav. Ecol. 11, 550–559. doi: 10.1093/beheco/11.5.550
Sarkar, R., and Bhadra, A. (2022). How do animals navigate the urban jungle? A review of cognition in urban-adapted animals. Curr. Opin. Behav. Sci. 46:101177. doi: 10.1016/j.cobeha.2022.101177
Sarkar, R., Sau, S., and Bhadra, A. (2019). Scavengers can be choosers: a study on food preference in free-ranging dogs. Appl. Anim. Behav. Sci. 216, 38–44. doi: 10.1016/j.applanim.2019.04.012
Schoener, T. W. (1971). Theory of feeding strategies. Annu. Rev. Ecol. Syst. 2, 369–404. doi: 10.1146/annurev.es.02.110171.002101
Schulke, O., and Ostner, J. (2012). “Ecological and social influences on sociality” in The evolution of primate societies, eds. John C. Mitani, Josep Call, Peter M. Kappeler, Ryne A. Palombit, and Joan B. Silk (Chicago, IL: University of Chicago Press), 195–219.
Sen Majumder, S., Bhadra, A., Ghosh, A., Mitra, S., Bhattacharjee, D., Chatterjee, J., et al. (2014). To be or not to be social: foraging associations of free-ranging dogs in an urban ecosystem. Acta Ethol. 17, 1–8. doi: 10.1007/s10211-013-0158-0
Smith, J. N. M., and Sweatman, H. P. (1974). Food-searching behavior of titmice in patchy environments. Ecology 55, 1216–1232. doi: 10.2307/1935451
Stephens, D. W., and Krebs, JR. Monographs in Behavior and Ecology. Princeton University Press (1986).
Taylor, J. C. (1970). The influence of arboreal rodents on their habitat and man. Publ l’OEPP [Organisation Eur Mediterr pour la Prot des Plantes] 58, 217–223.
Van de Schoot, R., Kaplan, D., Denissen, J., Asendorpf, J. B., Neyer, F. J., and van Aken, M. A. G. (2014). A gentle introduction to Bayesian analysis: applications to developmental research. Child Dev. 85, 842–860. doi: 10.1111/cdev.12169
Keywords: scavengers, group foraging, optimal foraging theory, food selection, competition
Citation: Sarkar R, Bhowmick A, Dasgupta D, Banerjee R, Chakraborty P, Nayek A, Sreelekshmi R, Roy A, Sonowal R, Mondal AB and Bhadra A (2023) Eating smart: Free-ranging dogs follow an optimal foraging strategy while scavenging in groups. Front. Ecol. Evol. 11:1099543. doi: 10.3389/fevo.2023.1099543
Edited by:
Hynek Burda, University of Duisburg-Essen, GermanyReviewed by:
Arrilton Araujo, Federal University of Rio Grande do Norte, BrazilCopyright © 2023 Sarkar, Bhowmick, Dasgupta, Banerjee, Chakraborty, Nayek, Sreelekshmi, Roy, Sonowal, Mondal and Bhadra. This is an open-access article distributed under the terms of the Creative Commons Attribution License (CC BY). The use, distribution or reproduction in other forums is permitted, provided the original author(s) and the copyright owner(s) are credited and that the original publication in this journal is cited, in accordance with accepted academic practice. No use, distribution or reproduction is permitted which does not comply with these terms.
*Correspondence: Anindita Bhadra, YWJoYWRyYUBpaXNlcmtvbC5hYy5pbg==
†These authors have contributed equally to this work
‡These authors have contributed equally to this work
§These authors have contributed equally to this work
Disclaimer: All claims expressed in this article are solely those of the authors and do not necessarily represent those of their affiliated organizations, or those of the publisher, the editors and the reviewers. Any product that may be evaluated in this article or claim that may be made by its manufacturer is not guaranteed or endorsed by the publisher.
Research integrity at Frontiers
Learn more about the work of our research integrity team to safeguard the quality of each article we publish.