 Man-Ping Kang1
 Cheng-Zhang Zhao
94% of researchers rate our articles as excellent or good
Learn more about the work of our research integrity team to safeguard the quality of each article we publish.
Find out more
ORIGINAL RESEARCH article
Front. Ecol. Evol., 15 May 2023
Sec. Population, Community, and Ecosystem Dynamics
Volume 11 - 2023 | https://doi.org/10.3389/fevo.2023.1097817
This article is part of the Research TopicThe Impacts of Climate Change and Human Activities on the Structure and Function of Wetland/Grassland EcosystemsView all 18 articles
Fractional vegetation cover (FVC) is an important indicator of the development or reversal of salt marsh due to its absence in arid desert areas. Many studies have emphasized the differences in factors that affect fractional vegetation cover (FVC) in different temporal and spatial scales. However, few studies have reported on the temporal and spatial variations in vegetation coverage and their response to climate and also on the hydrological environment in inland salt marsh wetlands. Accordingly, based on a wetland community survey, different types of data, such as meteorological data, hydrological data, and Landsat remote sensing image data, recorded during the period from 1990 to 2020 were collected. The characteristics of the spatial and temporal distribution of vegetation coverage in the Sugan Lake wetland over the past 30 years were analyzed using a binary pixel model. Furthermore, a quantitative analysis on the response of vegetation coverage to hydrological and meteorological factors was undertaken. The results of the present study showed that the dimidiate pixel model had a high simulation accuracy in retrieving the vegetation coverage in inland salt marsh wetlands. The vegetation coverage of the Sugan Lake wetland increased with each year from 1990 to 2020, and its annual average was 19.34%. The spatial distribution of vegetation coverage was patchy and decreased from the center to the edge of the wetland. Within the same period, the vegetation coverage showed an increasing trend in Quan-shui and He-hong areas and a decreasing trend in the Shan-hong area. Vegetation coverage was mainly affected by various factors, such as precipitation, lake area, surface runoff, groundwater depth, and residential density, respectively. It was significantly positively correlated with precipitation (R2 = 0.56, P < 0.01), lake area (R2 = 0.50, P < 0.01), air temperature (R2 = 0.46, P < 0.01), and river system density (R2 = 0.52, P < 0.01) and negatively correlated with groundwater depth (R 2 =-0.57, P < 0.01) and residential density (R2 = −0.38, P < 0.05). Implicit in these findings are complex mechanisms of change in vegetation coverage that help prevent the degradation of vegetation in fragile ecosystems.
A wetland is a groundwater-dependent ecosystem that is formed by the interaction between land and water. The inland salt marsh is a type of wetland ecosystem that is endowed with a distinct eco-hydrological process and a highly heterogeneous environment. The wetland ecosystem is controlled by hydrological processes. Spatial and temporal differences between water supply and static water directly affect the growth, development, reproduction, and spatial distribution pattern of wetland plants (Herring et al., 2013; Yao et al., 2019). Vegetation is an important part of the wetland ecosystem and plays a crucial role in material and energy exchange, atmospheric homeostasis, hydrological processes, carbon cycle, and stability of ecosystem (Shen et al., 2018; Zhang et al., 2018). Fractional vegetation cover (FVC) is an important parameter that reflects the growth distribution characteristics and structural density of surface vegetation, while it also serves as a sensitive index for the response of ecosystems to climate change and hydrological disturbance (Derakhshannia et al., 2020). The spatiotemporal heterogeneity of vegetation coverage in inland salt marshes is the key contributing factor to the stability of fragile wetland ecosystems in arid desert areas and is important for understanding the formation of the distribution patterns of the plant community in salt marshes.
Fractional vegetation cover refers to the proportion of the vertical projection area of above-ground vegetation (including leaves, stems, and branches) on the ground in a whole study area (Feng et al., 2019). Vegetation coverage not only reflects the appearance and nature of the plant community but is also important for maintaining the stability of wetland vegetation's community structure and function and, consequently, wetland landscape diversity and habitat environmental security (Li et al., 2016). Preferred methods for calculating FVC are ground verification and remote sensing estimation (Tang et al., 2020). Validation methods primarily include visual estimation in the field, sampling investigation, and photogrammetry; however, these methods can be influenced by individual differences as well as by the weather, time, and terrain (Okin et al., 2013). Vegetation coverage is characterized by the continuity of time and space, and the traditional methods of vegetation community investigation have limitations on the spatiotemporal scale. Remote sensing inversion is a preferred and feasible method for estimating vegetation coverage. Satellite remote sensing has several advantages, such as low requirements, speed of acquisition, and ability to cover a large area, compared with traditional ground-based verification. Many methods, such as empirical models (Gitelson, 2013), spectral mixing analysis (Okin, 2007), dimidiate pixel models, artificial neural networks (Atzberger and Rembold, 2013), and regression trees (Tottrup et al., 2007), are available to perform the inversion of vegetation coverage based on remotely sensed data. The normalized vegetation index (NDVI) is an important indicator of the effective radiation absorbed by vegetation during photosynthesis. This index is very sensitive to the growth potential and biomass variability of vegetation and has been successfully used to monitor vegetation conditions and their growth status. The dimidiate pixel model can largely eliminate the influence of background factors such as soil; accurately extract pure vegetation pixels in arid areas; and objectively and effectively reflect vegetation canopy conditions. With the continuous development of remote sensing science and technology, the inversion of vegetation coverage based on multisource remote sensing data is an essential means to obtain a large range of long-time series data. Remote sensing technology can overcome the limitations of a traditional community survey in temporal and spatial scales and complete the estimation of regional vegetation coverage. Most of the existing studies are based on different resolution and remote sensing imaging mechanisms, such as Landsat and MODIS (Okin et al., 2013; Cheng et al., 2017), GF-1 (Tao et al., 2019), radar (Liu L. et al., 2019), and other satellite data, to make estimates. However, few studies have combined wetland field surveys with remote sensing technology to describe patchy and spatial heterogeneity of vegetation coverage. In this study, the combination of wetland field survey and remote sensing technology can better describe the evolution of spatial–temporal heterogeneity of vegetation coverage in salt marsh wetlands. It is of great significance for understanding the formation mechanism of the spatial distribution pattern of plant communities in salt marsh wetlands.
Vegetation coverage is an important ecological indicator of wetland plant growth as well as ecological and environmental changes. The spatiotemporal dynamics of vegetation coverage in salt marsh wetlands is influenced by both human disturbances and natural environmental factors (Meixler et al., 2018; Zheng et al., 2019). Natural environmental factors comprise climatic factors, including precipitation (Mo et al., 2019; Meng et al., 2020), temperature (Lamchin et al., 2018; Liu L. et al., 2019), and extreme weather events (Wang et al., 2015; Jiang et al., 2017), terrain (Peng et al., 2012), topography (Liu et al., 2010), hydrology (Li et al., 2019), soil type, and moisture conditions (Liu S. et al., 2019; Peng et al., 2019). Climate change, especially any change that affects temperature and precipitation, influences the ecology of plant communities and plant growth cycles (Chen et al., 2019; Ding et al., 2020). Hydrological factors (groundwater depth and surface water runoff) are the main driving forces of succession of wetland vegetation through their effects on the soil environment, which, in turn, impact vegetation growth and distribution and shape the composition and structure of vegetation communities. In the short term, human disturbance is the main factor affecting vegetation coverage (Shen et al., 2018; Wu et al., 2022); ultimately, however, vegetation coverage is determined by both natural and human factors (Wang et al., 2019). Exploring vegetation coverage and its responses to different natural and anthropogenic factors is crucial for understanding ecosystem processes in the context of global climate change.
Suganhu Wetland is located in the Huahaizi Plateau Basin between Mount Taishan in the Altun mountain range, Mount Nanshan in the Danghe mountain range, and Saishiteng Mountain. The study area is a typical saline-marsh wetland ecosystem with the distribution of saline soil, and the wetland ecological series keeps the original state, which has a special eco-hydrological process. It has a typical, representative, and special protection and scientific research value in the northwest desert area. To date, studies on the vegetation coverage of wetlands have mainly focused on marsh wetlands in the Qinghai–Tibet Plateau (Peng et al., 2012; Zhang et al., 2018; Zhou et al., 2019), Lake Wetlands (Mao et al., 2022), Coastal Wetlands (Hao et al., 2020), and Yellow River Delta Wetland (He et al., 2018). Studies investigating the Sugan Lake wetland have mainly focused on the relationship between vegetation root morphology and biomass allocation (Li et al., 2021) and the influence of groundwater chemistry on the distribution of wetland vegetation (Zhou et al., 2019). However, relatively few studies have addressed the spatial distribution pattern of plant coverage and its response to climatic and hydrological factors in inland salt marshes, and the question of how the functional stability of plant communities in inland salt marshes is maintained remains unexplained. Accordingly, in this study, based on a wetland community survey, different types of data, such as meteorological data, hydrological data, and Landsat remote sensing image data, recorded during the period from 1990 to 2020 were collected. The characteristics of the spatial and temporal distribution of vegetation coverage in the Sugan Lake wetland over the past 30 years were analyzed using a dimidiate pixel model. Furthermore, a quantitative analysis of the responses of the vegetation coverage to hydrological and meteorological factors was undertaken. We sought to clarify (1) the spatiotemporal variation in vegetation coverage in the Sugan Lake wetland from 1990 to 2020; (2) the characteristics of the changes in vegetation coverage in different hydrological zones; and (3) the main factors influencing changes in vegetation coverage in the hydrological zone of the salt marsh. This study aimed to provide a theoretical basis for revealing the mechanism involved in the synergistic adaptation between wetland plant growth and the hydrological environment under climate change.
The Sugan Lake wetland is located in the Sugan Lake Provincial Migratory Bird Nature Reserve, Aksai County, Jiuquan City, Gansu Province, China. The study area is located in the Huahaizi Plateau Basin on the northern margin of Qaidam Basin on the Qinghai–Tibet Plateau (39.22°−39.35° N, 94.45°−94.59° E) (Figure 1) at an altitude ranging from 2,795 to 2,808 m. The area is characterized by an inland alpine semi-arid climate, windy weather, frequent sandstorms, an average annual temperature of 2°C, an average annual precipitation of 77.6 mm, an average annual evaporation capacity of 1,964.8 mm, an average frost-free period of 90 days, and a dry air temperature of 30°C (Li et al., 2021).
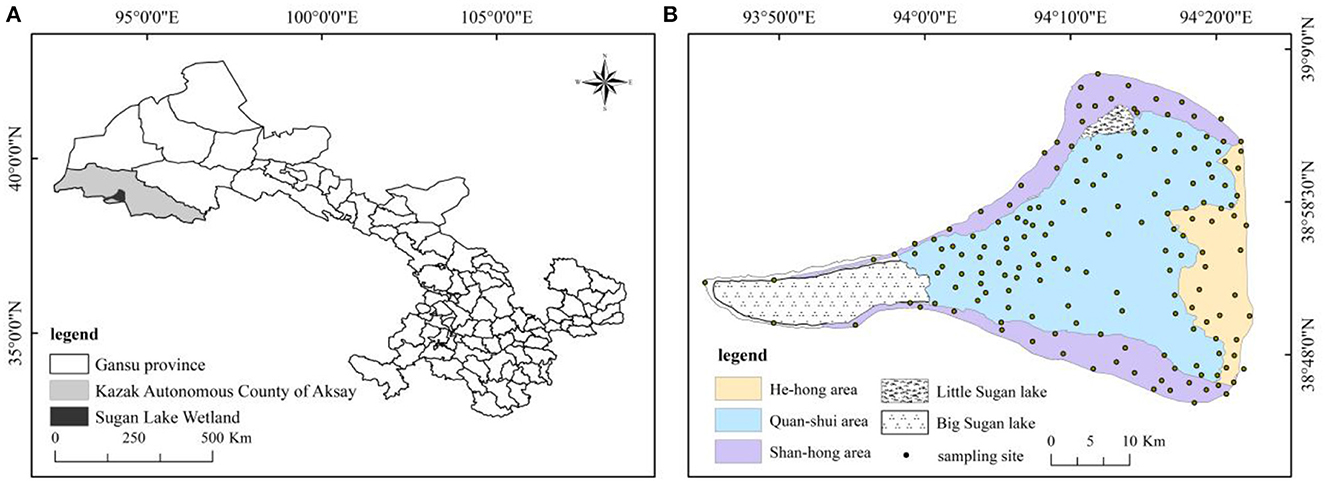
Figure 1. Sampling points of field survey data for the Sugan Lake wetland. (A) The study area is located in Aksai Kazak Autonomous County, Jiuquan City, Gansu Province, China. (B) Functional partition and sampling point of the study area.
The Sugan Lake wetland is an independent water system at the central and northwest end of the Qaidam inner water system. The Large and Small Harteng Rivers originating from the South Mountain of Danghe River flow underground through the mountain pass into the Large and Small Sugan Lakes of the Haizi Basin and then into the Large and Small Sugan Lakes. Finally, they are consumed by lake evaporation and evapotranspiration in the spring overflow zone. According to the classification criteria of the Chinese Soil Classification System of 1992, the main soil types in the study area are meadow soil, meadow marsh soil, and saline–alkali soil. The dominant plant species are Saussurea salsa, Leymus secalinus, Phragmites australis, Glaux maritima, Triglochin palustre, Triglochin maritimum, Suaeda glauca, Blysmus sinocompressus, and Salicornia europaea (Li et al., 2021).
Sugan Lake is a plateau basin that is located at the end of the Large and Small Harteng River flow system, which is composed of lakes, rivers, freshwater springs, and various wetlands. The soil hydrological process is complex. The said complexity makes it necessary to further characterize the vegetation distribution pattern and the heterogeneity of wetland eco-hydrological processes in Sugan Lake. A survey was undertaken on the vegetation based on soil. The results of the aforementioned survey were combined with the results of the surrounding area of the hydrogeological survey conducted by the Geological Environmental Monitoring Institute in the Sugan Lake basin in Gansu Province. Based on the study of the changes in elevation, the trend of the river, freshwater springs in the distribution, and surface water source will facilitate Sugan Lake area topography, vegetation map, soil map, and land utilization to present situation chart datum's superposition (Gou et al., 2021). The Sugan Lake wetland is divided into three ecological function zones—Shan-hong area, Quan-shui area, and He-hong area (Table 1). The Shan-hong area, with relatively high terrain, is mainly distributed in the wet geographical zone at the periphery of the wetland and at the end of the diluvial fan. It is composed of two terrain units—micro-highland and low-lying land—and is divided into two parts in the north and south. Shan-hong area is dominated by a Gobi-like bare land with a large exposed surface area, limited conditions for vegetation growth, short and sparsely distributed plants, and low-density rhizomatous plants, mainly Leymus secalinus and Saussurea runcinata. The Quan-shui area is located in the south of the small Sugan Lake, east of the Dasugan Lake wetland center, low-lying, slow due to terrain and sediment particles, and aquifer permeability decreases, the underground water level rises gradually, and eventually overflows the surface to form a linear or a planar overflow, which develops to form a freshwater spring or a spring river, apart from the formation of surface water in rivers and springs. In this area, there is abundant vegetation. The vegetation is typical of a freshwater spring, herbaceous marsh, and marsh meadow, such as Carex reptabunda, Triglochin maritimum, and Polygonum sibiricum. The He Hong area lies on the east side of the Sugan Lake wetland. Every summer, the small Harteng flood of the river flows through the 215 national roads and forms small alluvial fans, thereby developing the advantage for Leymus secalinus inland salt marsh wetland, the scouring and silting of the flooding process, the influence of the area formed by east–west silt erosion gully and terrace landscape. In the erosion gullies and low-lying areas with seasonal surface water, river wetland plants, such as Phragmites australis and Triglochin maritimum, can be found. With increasing elevation, vegetation, such as Leymus secalinus, distributed in the silt platform area, is short and sparsely distributed due to the action of water and salt stress, and the vegetation coverage is low.
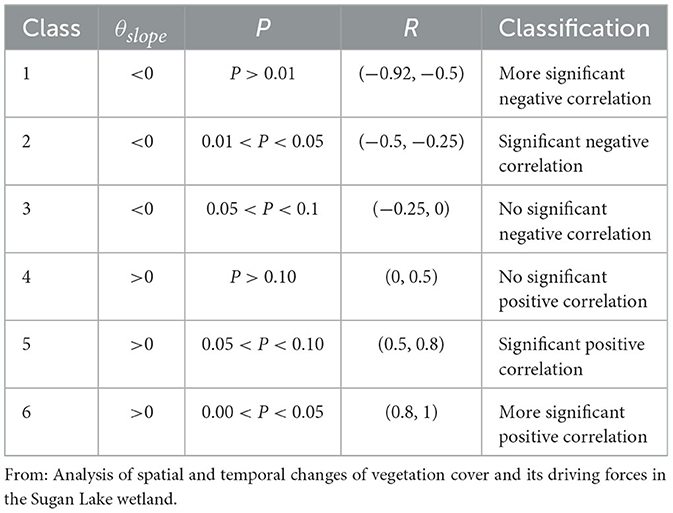
Table 1. The trend and level of significance of θslope.
Based on the field investigation, a total of 146 sampling sites with a relatively flat terrain in the study area were selected (Figure 1), and 1 m × 1 m quadrates were set. From 15 August to 27 August 2020, a wetland community survey was conducted; the names of the members of the vegetation community were recorded; and the coverage, height, and density of the plant community were measured and repeated three times.
Remote sensing data from the geospatial cloud (https://earthexplorer.usgs.gov/) and Landsat (Landsat-5 TM/ETM and Landsat-8 OLI) satellite remote sensing were used in this study. To better identify wetland vegetation cover, imaging data from the vegetation growing season (July to September) were selected as much as possible, and the cloud cover of remote sensing images in the study area was 10%. The satellite revisit period was 16 days and the row number of the study area was 137, with a total of 30 scenes (Gauss–Kruger projection is universally used in image projection systems and World Geodetic System 1984 (WGS84) was the reference ellipsoid). The NDVI was calculated based on radiometric calibration, atmospheric correction, and band fusion of Landsat data under the ENVI5.1 software platform. The vegetation coverage of each period was calculated using a binary pixel model.
The existing cold lake meteorological stations housed in the area surrounding Sugan Lake were selected to obtain information on temperature, precipitation, and average humidity data recorded from 1990 to 2020 via the China Meteorological Science Data Sharing Service network (http://cdc.cma.gov.cn/). Based on the Landsat remote sensing images, the water area of the Sugan Lake wetland was monitored from 1990 to 2020. The information pertaining to the areas of Da and Xiao Sugan Lakes over the last 30 years was extracted by combining supervised classification and visual interpretation, while the density of the water system was extracted by the index calculation. Groundwater and surface runoff data recorded from 1990 to 2020 in the Akesesu Dry Lake Basin were used for gathering information on ecological background verification and eco-hydrological monitoring research report (unpublished).
The normalized vegetation index was calculated as the ratio of the difference between the values of the red spectral band (R) and the near-infrared spectral band (NIR) to the sum of the values of the two bands, as follows:
Image data from 1990 to 2012 were obtained from band 3 (R region) and band 4 (NIR region) of Landsat-5 TM/ETM images. Image data from 2013 to 2020 were obtained from Landsat-8 OLI images in band 4 (R region) and band 5 (NIR region) and were utilized for NDVI calculation (Mao et al., 2020).
The FVC is an important variable for describing the quality of vegetation and the changes in the ecosystem (Jiapaer et al., 2011). In this study, the dimidiate pixel model was used to calculate vegetation coverage using the following formula (Tong et al., 2016):
where NDVIsoil and NDVIveg are the NDVI values of the pixels completely covered by bare soil and vegetation and represent the minimum and maximum NDVI values of a region, respectively. NDVI values with cumulative frequencies of 2 and 98% were selected as NDVIsoil and NDVIveg, respectively (Hao et al., 2020).
This study was conducted according to the technical regulations stipulated for the investigation of land use status quo and the technical regulations stipulated for the investigation of wetland resources (2008). The vegetation coverage standard of Sugan Lake wetland was formulated based on the wetland community coverage, wetland type, wetland plant composition, and other field wetland survey data. The studies were divided into the following five coverage groups: very low vegetation coverage (≤10%), low vegetation coverage (10%−30%), medium vegetation coverage (30%−50%), high vegetation coverage (50%−70%), and very high vegetation coverage (≥70%).
A one-dimensional (1D) linear regression model was used to analyze the interannual changes in vegetation cover in the Suganhu Lake wetland from 1990 to 2020. The spatiotemporal characteristics of vegetation coverage were displayed by comparing the differences between individual image elements (Li et al., 2019). The t-test was used to examine the correlation and significance level between the two variables. Unary linear regression θslope was calculated as follows:
where θslope is the θslope of the image element regression equation; FVCi is the mean value of FVCi in the year i; n is the monitoring time, and n=30. When θslope was =0, the FVCi of the image element is unchanged. When θslope was >0, the FVCi of the image element tends to increase; and when it is <0, the image element tends to decrease. The correlation coefficient (R) was used to determine the significance of the changing trend. When R was <0, the vegetation cover tended to decrease, and when R was >0, the vegetation cover tended to increase. A t-distribution was used to test whether the variables were truly correlated with each other and to determine the level of significance of their correlation (Zhang et al., 2016). The θslope of the meta-regression line was obtained based on Eq. (1) and the trend and significance were classified into six levels based on the fitted correlation coefficient that corresponded to the results of a t-test (Hao et al., 2020; Yang et al., 2021) (Table 1).
The correlation between vegetation coverage and climatic and hydrological factors was calculated based on Pearson's correlation coefficient, as follows: If the joint distribution of the random variables x and y is a two-dimensional (2D) normal distribution, (x1, y1), (x2, y2),…, (xn, yn) is the nth independent observation value, r represents Pearson's correlation coefficient, and the calculation formula is:
where , the range of the correlation coefficient r is [1, −1], and the larger the value of r, the stronger the correlation between variables.
Principal component analysis mainly analyzes the features of the covariance matrix to minimize the data dimension while maintaining the maximum contribution of the variance of the data set. The specific calculation process is as follows:
1) Calculate the matrix X of the standardized data index, set the number of relevant indicators as n and the number of sampling sites as m, and then calculate the matrix as follows:
2) Calculate the correlation coefficient matrix and obtain the principal component:
where rij is the correlation coefficient between the ith index and the jth index of the standardized data, and the correlation coefficient matrix can be obtained.
3) Principal components with an eigenvalue >1 and a cumulative variance contribution rate >85% were extracted.
The linear regression model of vegetation coverage was established based on the Landsat remote sensing data and the measured values of vegetation coverage from the community survey, and the pixel binary model was tested by the degree of fitting. As shown in Figure 2, the estimated values of remote sensing inversion and the measured values of the community survey tended to be y = 0.8743x + 2.945 (R2 = 0.76, P ≤ 0.01). The correlation degree was satisfactory and the fitting degree of the linear model was high. The results showed that the vegetation coverage simulated by a pixel dichotomous model based on remote sensing data NDVI has high simulation accuracy and reliability in the Sugan Lake inland salt marsh wetland.
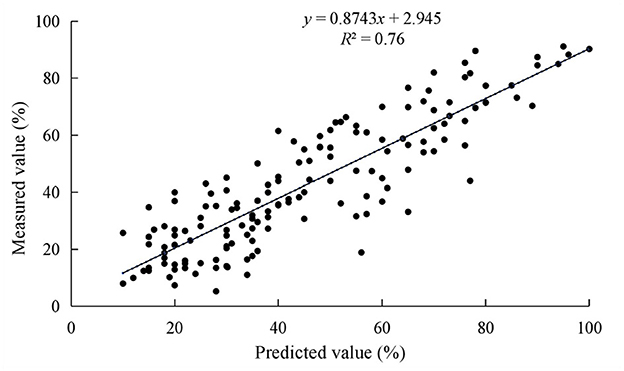
Figure 2. Measured and predicted vegetation coverage in 2020.
The interannual variation in vegetation coverage in the Sugan Lake wetland from 1990 to 2020 is shown in Figure 3. Overall, vegetation coverage exhibited a significant upward trend in this wetland during this period. The maximum vegetation coverage occurred in 2018 (32.12%) and the minimum in 1993 (12.8%). The interannual variation in vegetation coverage in the Sugan Lake wetland can be divided into two stages. From 1990 to 2002, vegetation coverage showed a fluctuating but decreasing trend, and from 2003 onward, vegetation coverage showed a fluctuating but increasing trend, especially between 2016 and 2018.
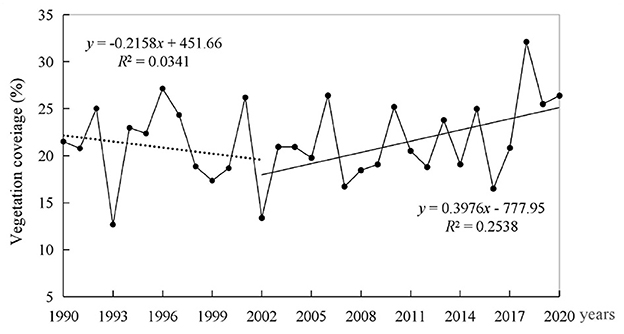
Figure 3. The interannual variation in vegetation coverage in the Sugan Lake wetland from 1990 to 2020.
Figure 4 shows the spatial distribution of vegetation coverage in the Sugan Lake wetland in 2020. Vegetation coverage was very low (<10%) at the edge of the wetland; low (10–30%) in the east of the Dasugan Lake, Huahaizi, and the area surrounding Saishiteng Village; medium (31–50%) mainly around the Da and Xiao Sugan Lakes, the river beach in the south of Shuiyazi River, and the waterlogged depression in the middle of the wetland; and high (50–70%) or very high (71–100%) primarily in the center of the wetland. Vegetation coverage was also high in a strip located in the freshwater area south of the Xiao Sugan Lake, the spring outcrop zone of the wetland, and the beach downstream of the Shuiyazi River. In the eastern part of Dasugan Lake, the lake water is trapped in low-lying areas due to flooding; here, the vegetation coverage was ≤0.
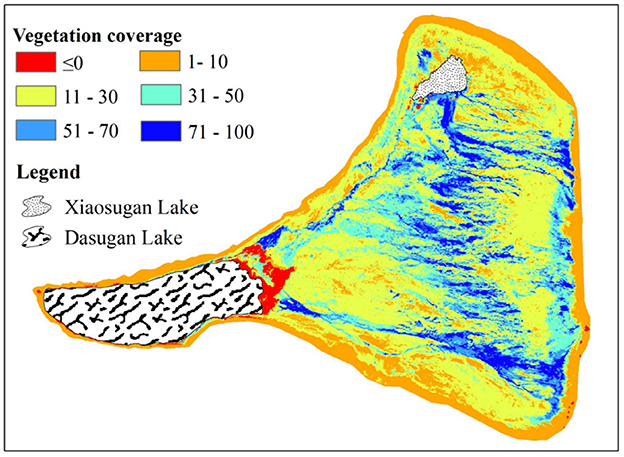
Figure 4. Spatial distribution of vegetation coverage in the Sugan Lake wetland in 2020.
The θslope and the corresponding correlation coefficient R were calculated, and the ArcGIS 10.3 superposition analysis function was used to obtain the spatial trend in vegetation coverage change in the study area (Figure 5, Table 2). The trend in vegetation coverage variation showed an increase overall, and the positive area was larger than the negative area, indicative of an improving trend in the wetland vegetation of Sugan Lake from 1990 to 2020. The proportion of area where the vegetation coverage did not increase significantly was 40.06%, which was mainly distributed in the center of the wetland and the river area. The proportion of area with no significant decrease in vegetation coverage was 52.04%. It is distributed primarily on the edge of the Sugan Lake wetland and the area east of the Dasugan Lake. However, in the area east of the Dasugan Lake, the proportion of area showing an extremely significant decrease in vegetation coverage was relatively small. The proportion of area in the Sugan Lake wetland in which vegetation coverage increased significantly was 5.87% and was mainly distributed in the area surrounding Huahaizi.
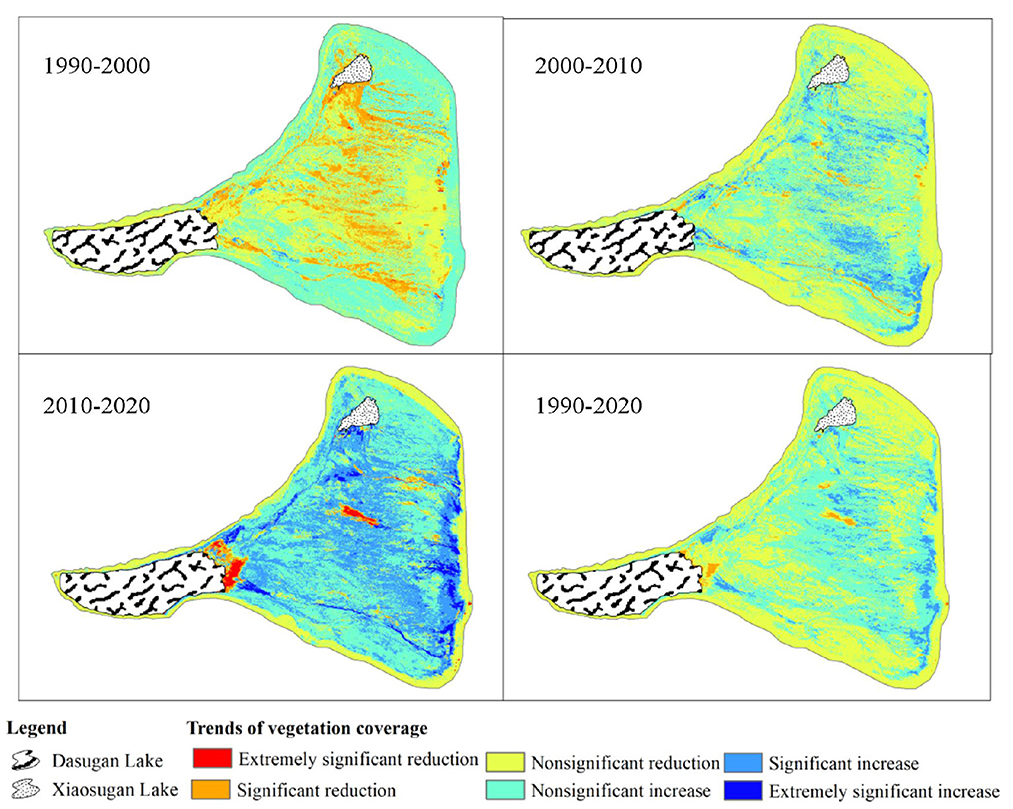
Figure 5. The trend in vegetation cover variation in the Sugan Lake wetland from 1990 to 2020.
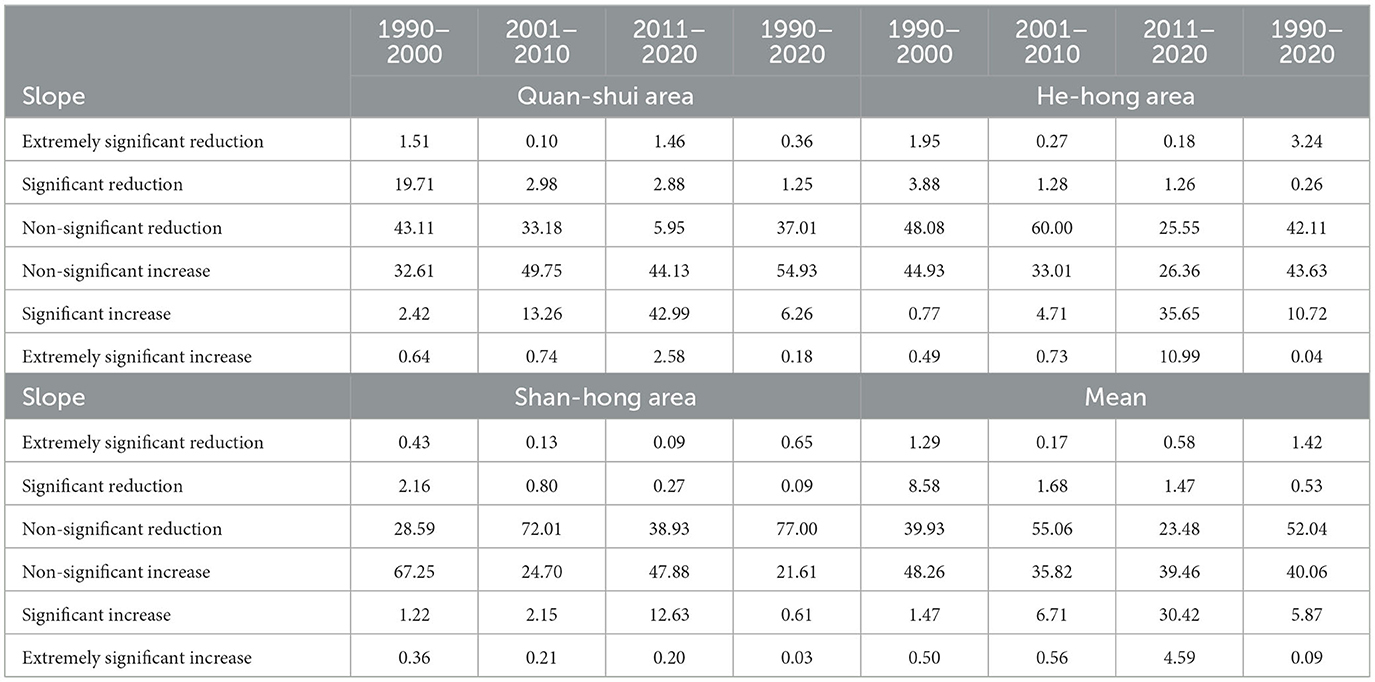
Table 2. The trend in vegetation coverage variation in various subareas of the Sugan Lake wetland from 1990 to 2020.
Differences in the trend toward vegetation coverage change were observed in different periods. The area showing a significant decrease in vegetation coverage was the largest from 1990 to 2000, accounting for 0.26% of the total area. The area with a non-significant decrease in FVC was the largest from 1990 to 2000 and from 2001 to 2010, accounting for 39.93% and 55.06% of the total area, respectively. The area with a non-significant decrease in vegetation coverage was 23.48% between 2011 and 2020. The maximum proportion of the area with a non-significant increase in vegetation coverage was 48.26% and 39.46% of the total area between 1990 and 2000 and between 2011 and 2020, respectively, while the area with a non-significant increase in vegetation coverage was 35.82% from 2001 to 2010 (Figure 5, Table 2).
Overall, the interannual change in vegetation coverage in Quan-shui and He-hong areas showed an increasing trend (Figure 6), with annual average values of 30.12 and 15.12%, respectively. The maximum values of vegetation coverage in Quan-shui and He-hong areas (44.08 and 27.58%, respectively) were reached in 2018. The minimum values of vegetation coverage in Quan-shui and He-hong areas were reached in 2002 and 2008 (18.97 and 6.18%, respectively). The average annual value of vegetation coverage in the Shan-hong area was 8.75% and the annual rate of change was −0.1187%. The maximum and minimum values of vegetation coverage were recorded in 1997 and 1993 (24.92 and 4.2%, respectively).
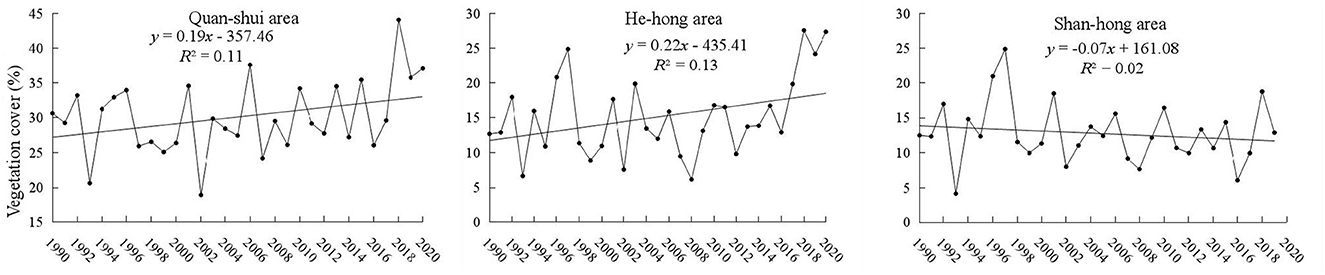
Figure 6. The interannual change in FVC in different regions from 1990 to 2020.
Differences were found in the trends in vegetation coverage among the regions. From 1990 to 2020, the area with a non-significant increase in vegetation coverage in Quan-shui accounted for 54.93% of the total area (Table 2), while the area with an extremely significant increase and an extremely significant decrease accounted for 0.18 and 0.36% of the total area, respectively. The area in He-hong with a non-significant increase and a non-significant decrease in vegetation coverage accounted for 42.11 and 43.63% of the total area, respectively, while the area with a significant decrease and an extremely significant increase in vegetation coverage accounted for 0.26 and 0.04% of the total area, respectively. In the Shan-hong region, the area with a non-significant increase in vegetation coverage accounted for 77% of the total area, while the area with a significant decrease and an extremely significant increase accounted for 0.09% and 0.03% of the total area, respectively. During the last 30 years, the area with a non-significant increase in vegetation coverage in Quan-shui accounted for 49.75% of the total area from 2001 to 2010 (Table 2). The areas in He-hong and Shan-hong with a non-significant decrease in vegetation coverage accounted for 60 and 72.01% of the total area, respectively.
From 1990 to 2017, the temperature, precipitation, and humidity of the Sugan Lake wetland showed an increasing trend. The annual average temperature is 3.49°C, the lowest mean annual temperature was 2.65°C in 1992, and the highest was 4.4°C in 2017 (Figure 7). The annual average precipitation is 18.28 mm, the lowest average annual precipitation was 5.2 mm in 2000, and the highest was 35.8 mm in 2019. The annual average relative humidity is 30%, with a minimum of 23.46% in 1991 and a maximum of 37.63% in 2007 (Figure 7).
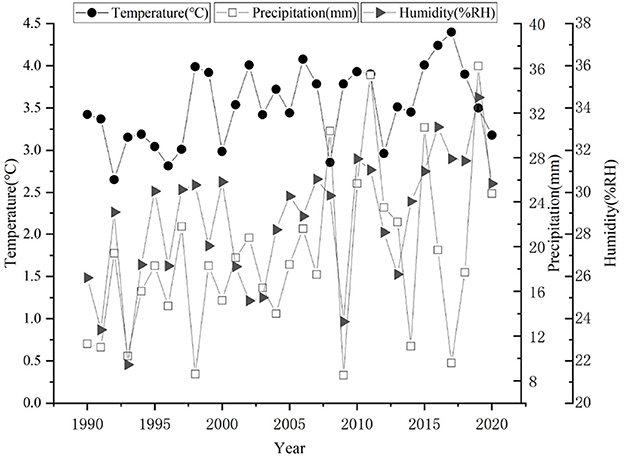
Figure 7. Interannual variation in air temperature, precipitation, and humidity in the Sugan Lake wetland.
The interannual variation in the average lake area and groundwater depth of the Sugan Lake wetland from 1990 to 2020 is shown in Figure 8A. Over the past 30 years, the interannual variation in the lake area of Dasugan Lake has increased, and the average annual lake area was ~107.42 m2. From 1990 to 2020, the groundwater depth of the Sugan Lake wetland showed a decreasing trend, and the average groundwater depth was 2.49 m.
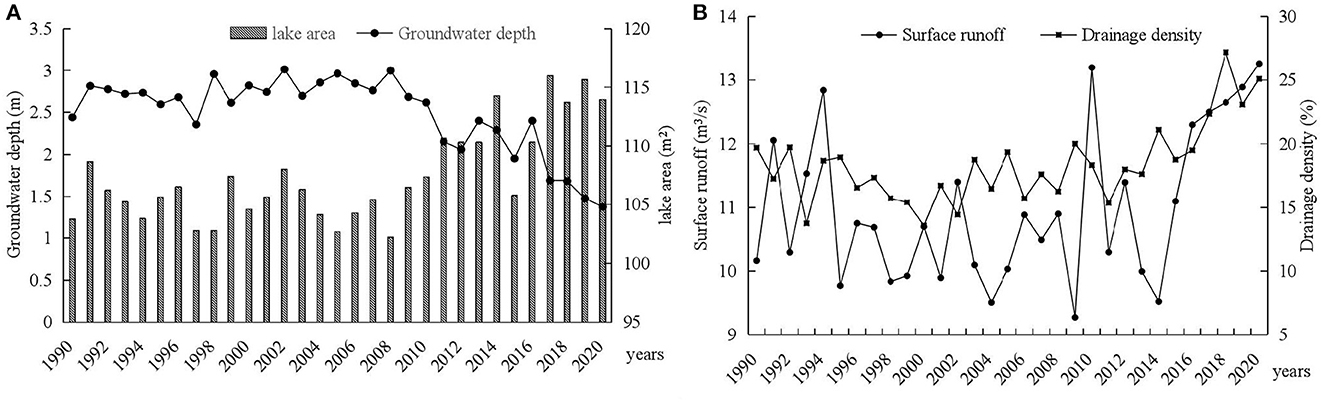
Figure 8. Interannual variation in hydrological elements in the Sugan Lake wetland. (A) Lake area and groundwater depth of Dasugan Lake. (B) Interannual variation in surface runoff and drainage density.
Figure 8B shows the interannual variation in surface runoff and drainage density in hydrological elements in the Sugan Lake wetland from 1990 to 2020. Over the last 30 years, the average annual surface runoff was 10.97 m3/s, and the maximum surface runoff was 13.26 m3/s, which was recorded in 2020. The drainage density of the Sugan Lake wetland showed an increasing trend over the last 30 years, with an average value of 18.34%. The lowest water system density was 13.76% in 1993 and the highest was 27.6% in 2018.
We next explored the effects of climatic and hydrological factors on the spatial distribution of vegetation coverage in the Sugan Lake wetland. PCA and the Pearson correlation coefficient were used to comprehensively analyze the influence of climate (temperature, precipitation, and humidity), hydrology (groundwater depth, surface runoff, lake area, and water density), human activities (residential density), and other environmental factors on vegetation coverage in the Sugan Lake wetland.
The results of the PCA showed that the variance contribution rates of the first, second, and third principal components were 53.38, 13.82, and 12.63%, respectively, and their cumulative contribution rates reached 79.82%, indicating that they had fully summarized most of the indicators (Tables 3, 4). The index coefficient of the first principal component can reflect the contribution of the index to each principal component. Among them, the first principal component contains the maximum information and has the greatest influence on vegetation coverage. From the perspective of the loading of the principal component, the absolute values of correlation coefficients of groundwater depth, residential density, surface runoff, precipitation, and lake area in the first principal component are all >0.80. The results showed that the vegetation coverage was mainly affected by precipitation, lake area, surface runoff, groundwater depth, and residential density. The second principal component shows that the temperature phase relation value is 0.70, indicating that this component further reflects the influence of temperature on vegetation coverage to a certain extent based on the first principal component. In the third principal component, the correlation coefficient of humidity was 0.84, indicating that the influence of humidity on vegetation coverage was further reflected based on the first principal component and the second principal component.
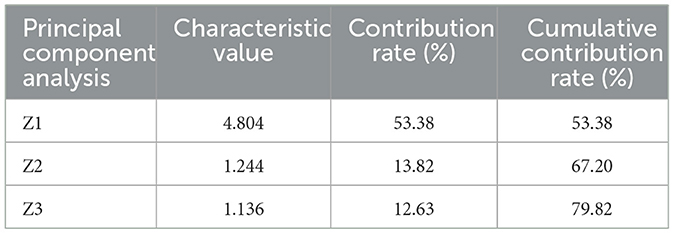
Table 3. The eigenvalues and the contribution rate of the principal components.
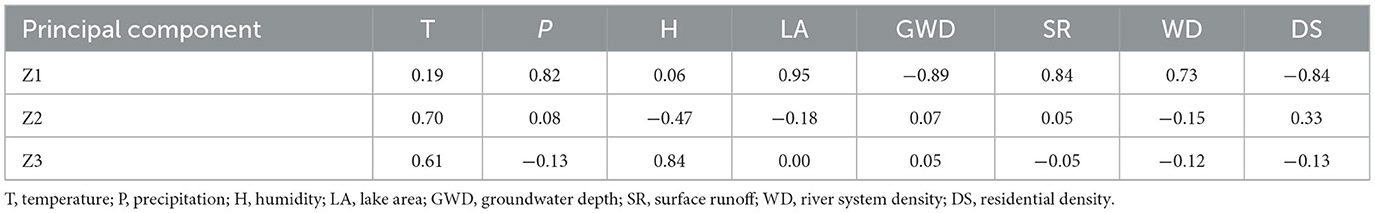
Table 4. The factor loading matrix of the four principal components.
The results of the Pearson correlation analysis showed that there was a significant positive correlation between vegetation coverage and precipitation, air temperature, lake surface area, and water system density (P < 0.01) (Figure 9). Meanwhile, there was a significant negative correlation between vegetation coverage and groundwater depth (P < 0.01) and between vegetation coverage and residential density (P < 0.05) (Figure 9).
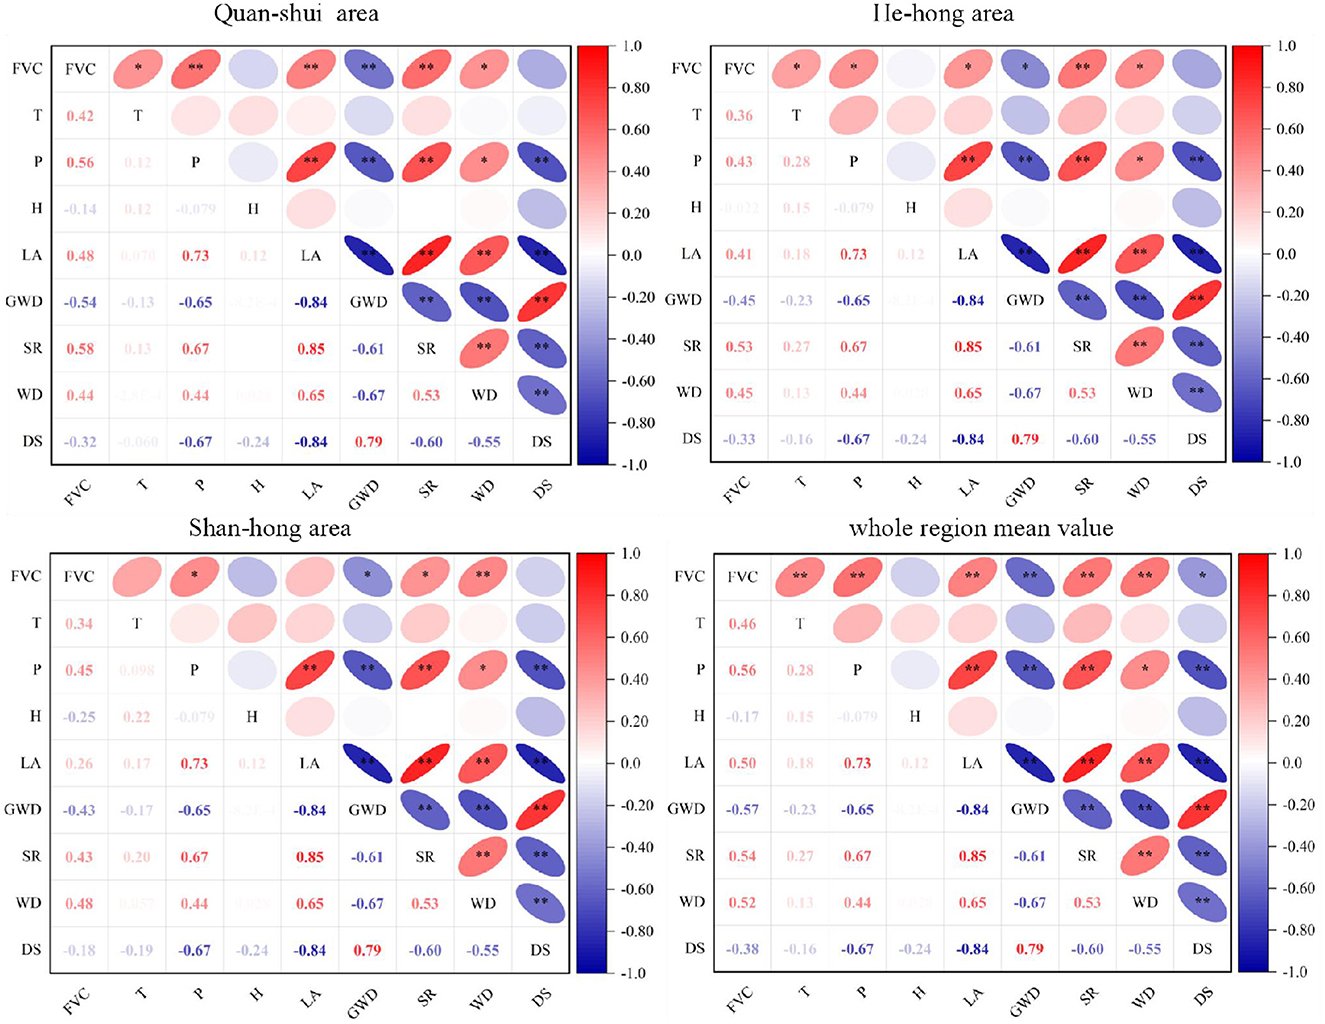
Figure 9. Analysis of factors influencing vegetation coverage in different subareas of the Sugan Lake wetland. FVC, vegetation coverage; T, temperature; P, precipitation; H, humidity; LA, lake area; GWD, groundwater depth; SR, surface runoff; WD, river system density; DS, residential density.
The impacts of hydrological factors on FVC were different in different regions. In the Quan-shui area, there was a significant negative correlation between vegetation coverage and groundwater depth (R2 = −0.54, P < 0.01). Vegetation coverage was significantly positively correlated with surface runoff (R2 = 0.58, P < 0.01) and precipitation (R2 = 0.56, P < 0.01), respectively. In the He-hong area, vegetation coverage was significantly positively correlated with surface runoff (R2 = 0.53, P < 0.01) but negatively correlated with groundwater depth (R2 = −0.45, P < 0.05). In the Shan-hong area, vegetation coverage was significantly positively correlated with precipitation (R2 = 0.45, P < 0.05) and water system density (R2 = 0.48, P < 0.01) but not significantly correlated with hydrological factors (groundwater depth, surface runoff, and lake surface area), and the correlation coefficient was low.
Hydrological and climatic change characteristics are key abiotic factors that affect salt marsh zonation. Temperature and precipitation are the main abiotic determinants of the spatial distribution of vegetation and affect the ecological processes of plant communities and the growth cycle of plants (Liang et al., 2015; Zhang et al., 2019). In this study, we found that vegetation coverage in the Sugan Lake salt marsh showed an increasing trend from 1990 to 2020, as did air temperature, precipitation, and humidity. Vegetation coverage was positively correlated with precipitation (R2 = 0.56, P < 0.01) and air temperature (R2 = 0.4, P < 0.05). Precipitation is the main factor that affects the ecological environment in arid desert areas and determines the growth and development of wetland vegetation and the distribution of the dominant population. The reason attributed to precipitation is as follows: first, in the Sugan Lake wetland in the arid desert, precipitation is vital for the growth of vegetation, with the increase in average annual precipitation. On the one hand, it reduces drought stress and provides the much-needed water for the growth of vegetation. On the other hand, from both sides of the mountain, flood and rain gather in a closed basin, and for the development of marsh wetland, this pool of water provides abundant water resources and promotes the growth of wet raw halophytes. The vegetation coverage of the wetland was improved. Second, the research area has an inland alpine climate, and the temperature is relatively low. In this study, there was a significant positive correlation between vegetation coverage and temperature (R2 = 0.6, P < 0.05). An increase in temperature can enhance the rate of photosynthesis, promote the synthesis and transport of carbohydrates, promote water absorption and conductance through the roots, and accelerate plant growth and development, thereby increasing vegetation coverage (Yan et al., 2012; Coldren et al., 2018). Climate warming and humidification are crucial to the ecology and hydrology of high-altitude areas. Ougahi found that, in high-altitude areas, with the rise of temperature, due to the melting of snow, soil moisture increases and vegetation growth becomes vigorous (Ougahi et al., 2022). Over the last 30 years, vegetation coverage in the Sugan Lake wetland was positively correlated with both air temperature and precipitation; however, the correlation between vegetation coverage and precipitation was greater than that between vegetation coverage and air temperature. This suggests that the vegetation coverage of the Sugan Lake wetland is more sensitive to precipitation than to air temperature, which is consistent with that reported by Simpson (Simpson et al., 2017). Solar radiation, as the main source of surface energy, is also the most direct and important meteorological factor to affect vegetation growth and development (Jiang et al., 2020). Some scholars have found that, in high-altitude areas, a low solar radiation limits vegetation growth, whereas an increase in radiation enhances the net photosynthesis of vegetation and thereby promotes vegetation growth, thus affecting vegetation coverage (Fu and Shen, 2017, 2022; Han et al., 2022).
Hydrology is an important driving force of wetland ecosystems. Under a constant climate, changes in hydrological parameters affect the type and structure of wetland vegetation, which, in turn, influence wetland ecosystem's productivity (He et al., 2018). The results of the present study showed that vegetation coverage was positively correlated with surface area, surface runoff, and drainage density and negatively correlated with groundwater depth (P < 0.01, R2 = −0.55) in Sugan Lake. The correlation between vegetation coverage and hydrological factors differed according to the zone assessed. First, there was a very significant positive correlation between vegetation coverage and water system density, and lake area (R2 = 0.5, P < 0.05) in the Quan-shui area. The main reason for this correlation is that the region is low-lying and the groundwater outcrops gather into large waters and rivers. Surface water has diluted the salinization of the surface soil of the tidal flat and salt marsh wetland around the river, which provides favorable environmental conditions for the growth and development of wetland vegetation such as Carex reptabunda, Triglochin maritimum, and Polygonum sibiricum. With the increase in precipitation and temperature, snow and ice melts in the surrounding mountains, seasonal flood, and surface runoff increase and converge in the low-lying wetland center, resulting in an increase of surface runoff and water system density in this region (Dar et al., 2022). The surface water flows to Dasugan Lake, thus increasing the surface area of the lake. The lake water flooding diluted the soil salinization on the lake shore and provided conditions for the growth of wet xerophytic vegetation such as Phragmites australis and Saussurea salsa. Therefore, vegetation coverage in the spring area increased significantly and extremely significantly. Second, there was a significant positive correlation between vegetation coverage and surface runoff (R2 = 0.53, P < 0.05) in the He-hong area. This development takes place mainly because, when both precipitation and temperature increase, mountain ice and snow melt more, which intensifies the runoff of the Large and Small Harteng rivers. The waters of the Large and Small Harteng rivers converge on the area after passing through National Highway 215, eroding gullies and low-lying areas and creating seasonal water on the surface to provide water for vegetation growth. Finally, the Shan-hong area is mainly located on the northern and southern edges of the Sugan Lake wetland. This area is dominated by a Gobi-like bare land, with a large exposed surface area and deep underground water burial depth, which makes it difficult for plant roots to absorb underground water, limited vegetation growth conditions, and short and sparse plants. With the increase in precipitation and temperature, snow and ice melting to water, seasonal floods, and precipitation in the mountains on both sides provide the vegetation in this region with the water needed for growth (Azmat et al., 2017). Vegetation coverage is affected by precipitation and stream density but has no significant correlation with groundwater depth, surface runoff, the lake area, and other hydrological factors. It was found that there was a significant negative correlation between vegetation coverage and groundwater depth. The main reason for this negative correlation is that, in the past 30 years, the surface runoff and the area of the Great Sugan Lake increased, while the groundwater depth decreased, which provided water resources for the growth of vegetation in this area. In addition, human disturbance (grazing) was weakened, the wetland eco-hydrological environment improved, and consequently, the vegetation coverage gradually increased. There was a significant negative correlation between vegetation coverage and residential density (R2 = −0.47, P < 0.01), which was consistent with Cheng's research conclusion (Cheng et al., 2017).
With the continuous advancement in remote sensing science and technology, satellite remote sensing image has become an important data source for earth observation. The inversion of vegetation coverage based on multisource remote sensing data is an important means to obtain a large range of long-time series data. We should note that there may be limitations or uncertainties in the data and methods used in this study. First, the data of Landsat-5 TM/ETM and Landsat-8 OLI were used in this study to retrieve vegetation coverage. On the one hand, NDVI data may have certain uncertainties in reflecting the actual vegetation status of salt marsh wetlands within 30 × 30 m (Liu et al., 2022). On the other hand, some scholars proposed that, when FVC reaches 80–90%, NDVI is nearly close to saturation, considering that the supersaturation of NDVI may have a certain impact on the inversion of vegetation coverage (Shen et al., 2020, 2022). This uncertainty may affect the result of the fitting test between predicted and measured vegetation coverage. Therefore, high-resolution remote sensing images, such as GF-2 image data, are considered for later research. Second, this study only considered the effects of climate (temperature, precipitation, and humidity) and hydrological factors on the vegetation coverage of each zone, but the conditions affecting the vegetation coverage of salt marsh wetlands are far more complex. In our previous studies, we found that the spatial distribution of vegetation coverage in the Sugan Lake wetland was patchy, which was influenced by the depth of groundwater and the spatial heterogeneity of soil as well as the total salt content in the soil. Some previous studies have shown that solar radiation, as the main source of surface energy, is also the most direct and important meteorological factor that affects vegetation growth and development. In addition, plant phenology, grazing, and human activities also affect vegetation growth and vegetation coverage (Chen et al., 2014; Fu et al., 2022; Wang et al., 2022; Zha et al., 2022). In the future, it is necessary to comprehensively consider the effects of solar radiation, plant phenology, grazing, nitrogen input, soil environment, and other factors on the zoning of vegetation communities and the spatial pattern of vegetation coverage, which have an important practical significance in the evaluation of the future ecological environment of the Sugan Lake wetland.
In conclusion, based on the combination of a wetland community survey and a remote sensing technology, the characteristics of the spatial and temporal distribution of vegetation coverage in the Sugan Lake wetland over the past 30 years were analyzed using a binary pixel model. The results of the present study showed that the dimidiate pixel model displayed a high simulation accuracy in retrieving the vegetation coverage in inland salt marsh wetlands. Over the past 30 years, vegetation coverage of the Sugan Lake wetland showed an increasing trend, and the trend in vegetation coverage variation differed according to the region evaluated. Spatially, the high and low values of vegetation coverage were distributed in patches. Vegetation coverage was mainly affected by precipitation, lake area, surface runoff, groundwater depth, and residential density. There was a significant positive correlation between vegetation coverage and precipitation (R2 = 0.56, P < 0.01) and lake area (R2 = 0.50, P < 0.01) and between vegetation coverage and air temperature (R2 = 0.46, P < 0.01) and river system density (R2 = 0.52, P < 0.01). Vegetation coverage was negatively correlated with groundwater depth (R2 = −0.57, P < 0.01) and resident density (R2 = −0.38, P < 0.05). The correlation between FVC and environmental factors also differed in a region-dependent manner. We were able to draw the conclusions that, in a cold climate background, a temperature rise is beneficial for vegetation growth and development but precipitation has a greater impact on vegetation.
The raw data supporting the conclusions of this article will be made available by the authors, without undue reservation.
M-PK, C-ZZ, MM, X-YL, and X-WZ conceived and designed the experiments. M-PK performed the experiments, analyzed the data, and drafted the manuscript. C-ZZ supported in the funding acquisition, resources, and critical revision of the article. M-PK, MM, X-YL, and X-WZ undertook the investigation and contributed the methodology. All authors reviewed and approved the final manuscript.
This work was supported, in part, by the National Natural Science Foundation of China (Grant Nos. 41461013 and 41861009).
We acknowledge Charlesworth Author Services (https://dashboard.cwauthors.com.cn) for editing the English text of a draft of this manuscript. In addition, we are very grateful to Zhiwei Zhang, Xuqian Bai, XL, and DaWei Wang for their assistance in the field and laboratory work.
The authors declare that the research was conducted in the absence of any commercial or financial relationships that could be construed as a potential conflict of interest.
All claims expressed in this article are solely those of the authors and do not necessarily represent those of their affiliated organizations, or those of the publisher, the editors and the reviewers. Any product that may be evaluated in this article, or claim that may be made by its manufacturer, is not guaranteed or endorsed by the publisher.
Atzberger, C., and Rembold, F. (2013). Mapping the spatial distribution of winter crops at sub-pixel level using AVHRR NDVI time series and neural nets. Remote Sens. 5, 1335–1354. doi: 10.3390/rs5031335
Azmat, M., Liaqat, U. W., Qamar, M. U., and Awan, U. K. (2017). Impacts of changing climate and snow cover on the flow regime of Jhelum River, Western Himalayas. Reg. Environ. Change 17, 813–825. doi: 10.1007/s10113-016-1072-6
Chen, B. X., Zhang, X. Z., Tao, J., Wu, J. S., Wang, J. S., Shi, P. L., et al. (2014). The impact of climate change and anthropogenic activities on alpine grassland over the Qinghai-Tibet Plateau. Agric. For. Meteorol. 189, 11–18. doi: 10.1016/j.agrformet.2014.01.002
Chen, X. Y., Fu, B. H., Shi, P. L., et al. (2019). Vegetation dynamics in response to climate change in Tianshan, Central Asia from 2000 to 2016. Arid Land Geogr. 42, 162–171. doi: 10.12118/j.issn.1000-6060
Cheng, F. Y., Liu, S. L., Yin, Y. J., Lü, Y. H., An, N. N., and Liu, X. M. (2017). The dynamics and main driving factors of coastal vegetation in Guangxi based on MODIS NDVI. Acta Ecol. Sin. 37, 788–797. doi: 10.5846/stxb201509091866
Coldren, G. A., Langley, J. A., Feller, I. C., and Chapman, S. K. (2018). Warming accelerates mangrove expansion and surface elevation gain in a subtropical wetland. J. Ecol.107, 79–90. doi: 10.1111/1365-2745.13049
Dar, T., Rai, N., Kumar, S., and Bhat, M. A. (2022). Climate change impact on cryosphere and streamflow in the Upper Jhelum River Basin (UJRB) of north-western Himalayas. Environ. Monit. Assess. 194, 140(2022). doi: 10.1007/s10661-022-09766-3
Derakhshannia, M., Dalvand, S., Asakereh, B., and Ostad Ali Askari, K. (2020). Corrosion and deposition in Karoon River, Iran, based on hydrometric stations. Int. J. Hydrol. Sci. Technol. 10, 334. doi: 10.1504/IJHST.2020.108264
Ding, Y., Halike, A., Chen, X. Y., and Abdirahman, M. (2020). Spatialtemporal changes in vegetation characteristics and climate in Hotan prefecture. Acta Ecol. Sin. 40, 1258–1268. doi: 10.5846/stxb201811292600
Feng, L. L., Jia, Z. Q., Li, Q. X., Zhao, A. Z., Zhao, Y. L., and Zhang, Z. J. (2019). Spatiotemporal change of sparse vegetation coverage in northern China. J. Indian Soc. Remote Sens. 47, 359–366. doi: 10.1007/s12524-018-0912-x
Fu, G., and Shen, Z. X. (2017). Effects of enhanced UV-B radiation on plant physiology and growth on the Tibetan Plateau: a meta-analysis. Acta Physiol. Plant 39, 85. doi: 10.1007/s11738-017-2387-8
Fu, G., and Shen, Z. X. (2022). Asymmetrical warming of growing/non-growing season increases soil respiration during growing season in an alpine meadow. Sci. Total Environ. 812, 152591. doi: 10.1016/j.scitotenv.2021.152591
Fu, G., Wang, J. H., and Li, S. W. (2022). Response of forage nutritional quality to climate change and human activities in alpine grasslands. Sci. Total Environ. 845, 157552. doi: 10.1016/j.scitotenv.2022.157552
Gitelson, A. A. (2013). Remote estimation of crop fractional vegetation cover: the use of noise equivalent as an indicator of performance of vegetation indices. Int. J. Remote Sens. 34, 6054–6066. doi: 10.1080/01431161.2013.793868
Gou, F. Z., Zhao, C. Z., Yang, J. C., Ren, J., Ma, J. Y., and Li, Z. Q. (2021). Spatial heterogeneity of above-ground biomass in sugan lake wetland vegetation. Acta Ecol. Sin. 41, 7774–7784. doi: 10.5846/stxb201909161918
Han, F., Fu, G., Yu, C., and Wang, S. (2022). Modeling nutrition quality and storage of forage using climate data and normalized-difference vegetation index in alpine grasslands. Remote Sens. 14, 3410. doi: 10.3390/rs14143410
Hao, J., Xu, G., Luo, L. i, Zhang, Z., Yang, H., et al. (2020). Quantifying the relative contribution of natural and human factors to vegetation coverage variation in coastal wetlands in China. Catena 188, 104429. doi: 10.1016/j.catena.2019.104429
He, W. J., Han, G. X., Xu, Y. N., Zhang, X. T., Wang, A. D., Che, C. G., et al. (2018). Effects of tidal dry-wet alternation on CO2 exchange in the net ecosystem of salt marsh in the Yellow River Delta. Chin. J. Appl. Ecol. 29, 269–277. doi: 10.13287/j. 1001 - 9332. 201801.035
Herring, G., Eagles-Smith, C. A., Ackerman, J. T., Gawlik, D. E., and Beerens, J. M. (2013). Landscape factors and hydrology influence mercury concentrations in wading birds breeding in the Florida Everglades, USA. Sci. Total Environ. 458, 637–646. doi: 10.1016/j.scitotenv.2013.04.036
Jiang, H. L., Xu, X., Guan, M. X., Wang, L. F., Huang, Y. M., and Jiang, Y. (2020). Determining the contributions of climate change and human activities to vegetation dynamics in agro-pastural transitional zone of northern China. Sci. Total Environ. 718, 134871. doi: 10.1016/j.scitotenv.2019.134871
Jiang, L., Jiapaer, G., Bao, A., Guo, H., and Ndayisaba, F. (2017). Vegetation dynamics and responses to climate change and human activities in Central Asia. Sci. Total Environ. 599–600, 967–980. doi: 10.1016/j.scitotenv.2017.05.012
Jiapaer, G., Chen, X. i, and Bao, A. (2011). A comparison of methods for estimating fractional vegetation cover in arid regions. Agric. For. Meteorol. 151, 1698–1710. doi: 10.1016/j.agrformet.2011.07.004
Lamchin, M., Lee, W. K., Jeon, S. W., Wang, S. W., Lim, C. H., Song, C., et al. (2018). Long-term trend and correlation between vegetation greenness and climate variables in Asia based on satellite data. Sci. Total Environ. 618, 1089–1095. doi: 10.1016/j.scitotenv.2017.09.145
Li, N., Li, L. W., Lu, D. S., Zhang, Y. L., and Wu, M. (2019). Detection of coastal wetland change in China: a case study in Hangzhou Bay. Wetlands Ecol. Manag. 27, 103–124. doi: 10.1007/s11273-018-9646-3
Li, Q., Zhao, C. Z., Kang, M. P., and Li, X. Y. (2021). The relationship of the main root-shoot morphological characteristics and biomass allocation of Saussurea salsa under different habitat conditions in Sugan lake wetland on the northern margin of the Qinghai-Tibet Plateau. Ecol. Indicat. 128, 107836. doi: 10.1016/j.ecolind.2021.107836
Li, X. R., Sun, L., and Zhu, J.S. (2016). Vegetation coverage extraction in arid regions based on multi-scale remote sensing data. Chinese J. Ecol. 35, 1394-1402. (in Chinese). doi: 10.13292/J.1000-4890.201605.029
Liang, S. Z., Yu, D. F., Wang, M., and Shi, P. (2015). Application of remote sensing time-series data to investigate the relationship between vegetation change and climatic factors: A case study of Circum-Bohai Sea area. Remote Sens. 27, 114–121. doi: 10.6046/gtzyyg.2015.03.19
Liu, L., Wang, Y., Wang, Z., Li, D., Zhang, Y., Qin, D., et al. (2019). Elevation-dependent decline in vegetation greening rate driven by increasing dryness based on three satellite NDVI datasets on the Tibetan Plateau. Ecol. Indic. 107, 105569. doi: 10.1016/j.ecolind.2019.105569
Liu, R. J., Zhang, W. C., and Pei, H. Q. (2010). Relationship between soil erosion and influencing factors in Huaihe River Basin. Soil Water Conserv. 2010, 29–32. (in Chinese). doi: 10.3969/j.issn.1000-0941.2010.05.012
Liu, S., Huang, S., Xie, Y., Wang, H., Huang, Q., Leng, G., et al. (2019). Spatial temporal change in vegetation cover in a typical semi-humid and semi-arid region in China: changing patterns, causes and implications. Ecol. Indic. 98, 462–475. doi: 10.1016/j.ecolind.2018.11.037
Liu, Y. C., Li, Z., Chen, Y. N., Li, Y. P., Li, H. W., Xia, Q. Q., et al. (2022). Evaluation of consistency among three NDVI products applied to High Mountain Asia in 2000-2015. Remote Sens. Environ. 269, 112821, doi: 10.1016/j.rse,0.2021.112821
Mao, D. H., Wang, Z. M., Du, B. J., Li, L., Tian, Y. L., Jia, M. M., et al. (2020). National wetland mapping in China: A new product resulting from object-based and hierarchical classification of Landsat 8 OLI images. ISPRS J. Photogramm. Remot. Sens. 164, 11–25. doi: 10.1016/j.isprsjprs.2020.03.020
Mao, P. P., Zhang, J., Li, M., Liu, Y. L., Wang, X., Yan, R. R., et al. (2022). Spatial and temporal variations in fractional vegetation cover and its driving factors in the Hulun Lake region. Ecol. Indic. 108490. doi: 10.1016/j.ecolind.2021.108490
Meixler, M. S., Kennish, M. J., and Crowley, K. F. (2018). Assessment of plant community characteristics in natural and human-altered coastal marsh ecosystems. Estuar. Coasts 41, 52–64. doi: 10.1007/s12237-017-0296-0
Meng, X., Gao, X., Li, S., and Lei, J. (2020). Spatial and temporal characteristics of vegetation NDVI change and the driving forces in Mongolia during 1982–2015. Remote Sens. 2, 603. doi: 10.3390/rs12040603
Mo, K., Chen, Q., Chen, C., Zhang, J., Wang, L., and Bao, Z. (2019). Spatiotemporal variation of correlation between vegetation cover and precipitation in an arid mountain-oasis river basin in northwest China. J. Hydrol. 574, 138–147. doi: 10.1016/j.jhydrol.2019.04.044
Okin, G. S. (2007). Relative spectral mixture analysis—a multitemporal index of total vegetation cover. Remote Sens. Environ. 106, 467–479. doi: 10.1016/j.rse.2006.09.018
Okin, G. S., Clarke, K. D., and Lewis, M. M. (2013). Comparison of methods for estimation of absolute vegetation and soil fractional cover using MODIS normalized BRDF-adjusted reflectance data. Remote Sens. Environ. 130, 266–279. doi: 10.1016/j.rse.2012.11.021
Ougahi, J. H., Cutler, M. J., and Cook, S. (2022). Assessment of climate change effects on vegetation and river hydrology in a semi-arid river basin. PLoS ONE 17, e0271991. doi: 10.1371/journal.pone.0271991
Peng, J., Liu, Z., Liu, Y., Wu, J., and Han, Y. (2012). Trend analysis of vegetation dynamics in Qinghai-Tibet Plateau using Hurst Exponent. Ecol. Indic. 14:28–39. doi: 10.1016/j.ecolind.2011.08.011
Peng, W., Kuang, T., and Tao, S. (2019). Quantifying influences of natural factors on vegetation NDVI change based on geographical detector in Sichuan, western China. J. Clean. Prod. 233, 353–367. doi: 10.1016/j.jclepro.2019.05.355
Shen, Q., Gao, G., Han, F., Xiao, F., Ma, Y., Wang, S., et al. (2018). Quantifying the effects of human activities and climate variability on vegetation cover change in a hyperarid endorheic basin. Land Degrad. Dev. 29, 3294–3304. doi: 10.1002/ldr.3085
Shen, X., Liu, B., Jiang, M., and Lu, X. (2020). Marshland loss warms local land surface temperature in China. Geophys. Res. Lett. 47, e2020GL087648. doi: 10.1029/2020GL087648
Shen, X., Liu, Y., Zhang, J., Wang, Y., Ma, R., and Liu, B. (2022). Asymmetric impacts of diurnal warming on vegetation carbon sequestration of marshes in the Qinghai Tibet Plateau. Glob. Biogeochem. Cycles 36, e2022GB007396. doi: 10.1029/2022GB007396
Simpson, L. T., Osborne, T. Z., and Duckett, L. J. I.C. (2017). Feller Carbon storages along a climate induced coastal wetland gradient. Wetlands 37, 1023–1035, doi: 10.1007/s13157-017-0937-x
Tang, L., He, M., and Li, X. (2020). Verification of fractional vegetation coverage and NDVI of desert vegetation via UAVRS technology. Remote Sens. 12, 1742. doi: 10.3390/rs12111742
Tao, G., Jia, K., Zhao, X., Wei, X., Xie, X., Zhang, X., et al. (2019). Generating High Spatio-Temporal Resolution Fractional Vegetation Cover by Fusing GF-1 WFV and MODIS Data. Remote Sens. 11, 2324. doi: 10.3390/rs11192324
Tong, X., Wang, K., Brandt, M., Yue, Y., Liao, C., and Fensholt, R. (2016). Assessing future vegetation trends and restoration prospects in the karst regions of Southwest China. Remote Sens. 8, 357. doi: 10.3390/rs8050357
Tottrup, C., Rasmussen, M. S., Eklundh, L., and Jonsson, P. (2007). Mapping fractional forest cover across the highlands of mainland Southeast Asia using MODIS data and regression tree modelling. Int. J. Remote Sens. 28, 23–46. doi: 10.1080/01431160600784218
Wang, J., Wang, K., Zhang, M., and Zhang, C. (2015). Impacts of climate change and human activities on vegetation cover in hilly southern China. Ecol. Eng. 81, 451–461. doi: 10.1016/j.ecoleng.2015.04.022
Wang, J. W., Li, M., Yu, C., and Fu, G. (2022). The change in environmental variables linked to climate change has a stronger effect on aboveground net primary productivity than does phenological change in alpine grasslands. Front. Plant Sci. 12, 798633. doi: 10.3389/fpls.2021.798633
Wang, X., Tan, K., Xu, K., Chen, Y., and Ding, J. (2019). Quantitative evaluation of the eco-environment in a coalfield based on multi-temporal remote sensing imagery: A case study of Yuxian, China. Int. J. Environ. Res. Public Health. 16, 511. doi: 10.3390/ijerph16030511
Wu, D., Liu, Q. X., Xia, R. L., and Li, T. (2022). Study on the changes in vegetation structural coverage and its response mechanism to hydrology. Open Geosci. 14, 79–88. doi: 10.1515/geo-2020-0322
Yan, S. F., Lu, Q., Zhang, J. C., Zhang, Z. X., Bai, S. Y., and Wang, L. (2012). The spatio-temporal evolution characteristics and response of regional climate change of NDVI at Jiangsu coastal areas. J. Nanjing For. Univ. 36, 43–47. doi: 10.3969/j.issn.1000-2006.2012.01.009
Yang, L., Shen, F., Zhang, L., Cai, Y., Yi, F., and Zhou, C. (2021). Quantifying influences of natural and anthropogenic factors on vegetation change using structural equation modeling: a case study in Jiangsu Province. China J. Clean. Prod. 280, 124330. doi: 10.1016/j.jclepro.2020.124330
Yao, S., Li, X., Liu, C., Yuan, D., Zhu, L., Ma, X., et al. (2019). Quantitative assessment of impact of the proposed Poyang Lake Hydraulic Project (China) on the habitat suitability of migratory birds. Water 11, 1639. doi: 10.3390/w11081639
Zha, X. J., Tian, Y., and Ouzhu Fu, G. (2022). Response of forage nutrient storages to grazing in alpine grasslands. Front. Plant Sci. 13, 991287. doi: 10.3389/fpls.2022.991287
Zhang, S., Li, Z., Lin, X., and Zhang, C. (2019). Assessment of climate change and associated vegetation cover change on watershed-scale runoff and sediment yield. Water 11, 1373. doi: 10.3390/w11071373
Zhang, S. W., Ning, H. R., Xu, D. L., Ye, H. C., Zheng, Y., Zhang, H. Y., et al. (2016). Analysis of spatio-temporal evolution and driving factors of vegetation fraction for opencast coal mine in grassland area. Trans. Chin. Soc. Agri. Eng. 32, 233–241. doi: 10.11975/j.issn.1002-6819.2016.17.031
Zhang, Z., Chang, J., Xu, C., Zhou, Y., Wu, Y., Chen, X., et al. (2018). The response of lake area and vegetation cover variations to climate change over the Qinghai-Tibetan Plateau during the past 30 years. Science of the Total Environment. 635, 443–451. doi: 10.1016/j.scitotenv.2018.04.113
Zheng, K, Wei, J. Z., Pei, J. Y., Cheng, H, Zhang, X. L, Huang, F. Q., et al. (2019). Impacts of climate change and human activities on grassland vegetation variation in the Chinese Loess Plateau. Sci. Total Environ. 660:236–244, doi: 10.1016/j.scitotenv.2019.01.022
Keywords: salt marsh wetland, vegetation coverage, spatial characteristics, climate, hydrology
Citation: Kang M-P, Zhao C-Z, Li X-Y, Ma M and Zhao X-W (2023) Temporal and spatial characteristics of vegetation coverage and their influencing factors in the Sugan Lake wetland on the northern margin of the Qinghai–Tibet Plateau. Front. Ecol. Evol. 11:1097817. doi: 10.3389/fevo.2023.1097817
Received: 14 November 2022; Accepted: 17 April 2023;
Published: 15 May 2023.
Edited by:
Chao Chen, Zhejiang Ocean University, ChinaReviewed by:
Zhongqing Yan, Chinese Academy of Forestry, ChinaCopyright © 2023 Kang, Zhao, Li, Ma and Zhao. This is an open-access article distributed under the terms of the Creative Commons Attribution License (CC BY). The use, distribution or reproduction in other forums is permitted, provided the original author(s) and the copyright owner(s) are credited and that the original publication in this journal is cited, in accordance with accepted academic practice. No use, distribution or reproduction is permitted which does not comply with these terms.
*Correspondence: Cheng-Zhang Zhao, emhhb2N6MTcxMEAxNjMuY29t
Disclaimer: All claims expressed in this article are solely those of the authors and do not necessarily represent those of their affiliated organizations, or those of the publisher, the editors and the reviewers. Any product that may be evaluated in this article or claim that may be made by its manufacturer is not guaranteed or endorsed by the publisher.
Research integrity at Frontiers
Learn more about the work of our research integrity team to safeguard the quality of each article we publish.