 Jason C. Doll
 Luke Etchison2
95% of researchers rate our articles as excellent or good
Learn more about the work of our research integrity team to safeguard the quality of each article we publish.
Find out more
ORIGINAL RESEARCH article
Front. Ecol. Evol. , 25 April 2023
Sec. Models in Ecology and Evolution
Volume 11 - 2023 | https://doi.org/10.3389/fevo.2023.1097389
This article is part of the Research Topic Models in Conservation and Restoration Ecology View all 9 articles
Endemic species are threatened by invasive species, habitat loss, and climate change. Endemic species are also an important group that maintains biodiversity. Understanding population dynamics of endemic species is needed to maintain or restore their populations. Advancements in models that describe population dynamics of endemic species and species of conservation need has been made possible by the application of novel quantitative methods. One such modeling tool is state-space modeling. These models provide a flexible framework to describe population dynamics using simple mortality models and more complex integrated population models. Here we develop a state-space model to describe survival and population size of the Sicklefin Redhorse (Catostomidae: Moxostoma sp.), a species of conservation concern from two rivers located in North Carolina, USA. This model is structured to combine information across similar rivers and to account for complex interactions of sex, time, variable sampling effort, and river discharge. Survival of Sicklefin Redhorse was found to vary by sex, and annual variability was not consistent across rivers. Discharge was negatively related to capture probability for males. Capture probabilities also differed across sex. Population estimates revealed a large difference between sex where males outnumbered females each year in both rivers. We conclude that electrofishing is not an efficient capture method but when used, should consider discharge. Discharge was not included in the survival model, however, the 3 years with the lowest survival in the Little Tennessee River coincided with the three lowest discharge years in the time series. Future work should investigate the difference in survival between the rivers.
Endemic species are those that are located in one geographic location. In addition to being geographically isolated, they have population characteristics that give them a high probability of going extinct (Pouteau et al., 2020); they are impacted by numerous threats such as invasive species, habitat loss, and climate change (Crivelli, 1995; Mayani-Parás et al., 2021); they are considered indicators of biological health (Loyola et al., 2007); and they can be important in maintaining biodiversity (Bonn et al., 2002). Populations of endemic species are at high risk of going extinct due to their limited range and often have a small population size (Gaston, 1998). However, not all endemic species have small population sizes, which could help buffer the extinction risk (Hobbs et al., 2011). Endemic species can also be negatively affected by exotic species (Walsh et al., 2012). Studies have shown that islands with a higher proportion of endemic species will experience a much larger impact with the introduction of exotic species compared to islands with a lower proportion of endemic species (Walsh et al., 2012). Even natural colonization of new species can put endemic species at risk (Bataille et al., 2009). For example, the black salt-marsh mosquito Aedes taeniorhynchus colonized the Galápagos islands prior to human colonization and has been shown to be a main vector of disease transmission across reptiles, mammals, and birds, many of which are endemic to the Galápagos islands (Bataille et al., 2009). Climate change presents a threat to all species but poses a unique threat to endemic because of their already limited range. Future projections of climate change have shown to predict reduction in endemic species range sizes of 47% to 77% (Thuiller et al., 2006; Loarie et al., 2008; Dirnböck et al., 2010). Habitat loss further increases the threats to endemic species (Mayani-Parás et al., 2021). Taken together, climate change is expected to increase the risk posed by habitat loss on endemic species (Dirnböck et al., 2010). The sensitivity of endemic species to the numerous threats makes them useful as indicators of biological health. For example, the number of endemic species have been used to identify areas with high diversity of birds (Bonn et al., 2002) and effectively used as an indicator group to identify conservation priorities in Brazil (Loyola et al., 2007). Endemic species are also considered sentinels of biodiversity and are the main consideration when delineating biodiversity hotspots (Myers, 1988). There are currently 36 areas designated as biodiversity hotpots and 43% of the species found in these areas are endemics (Habel et al., 2018). Given the importance of endemic species to biodiversity hotspots and being biodiversity indicators, it is imperative to understand their population dynamics (e.g., population size and survival), particularly because of the myriad of threats that can impact them. Understanding these dynamics can be the first step in conservation planning and restoration of these uniquely threatened and important groups.
The southeastern United States has over 550 species of fish with many of them endemic (Elkins et al., 2019). These endemic species include the Spotfin Chub (Cyprinella monachal), Smoky Madtom (Noturus baileyi), Tennessee Dace (Chrosomus tennesseensis), Yellowfin Matom (Noturus flavipinnis), and the Sicklefin Redhorse (Moxostoma sp). Human activities such as pollution and habitat destruction has had a negative impact on endemic species in this region (Biggins, 1987, 1988). The Sicklefin Redhorse is endemic to the Little Tennessee River and Hiwassee River systems. Sicklefin Redhorse are benthivores, feeding on aquatic invertebrates. They require substrate with limited to no silt and prefer gravel, cobble, boulder, and bedrock for feeding and reproduction (Jenkins, 1999). Maturation occurs between 5 and 8 years (Jenkins, 1999; Jenkins, 2005). Adults live in rivers and large creeks year-round with migrations during spawning where females exhibit significant spawning site fidelity (Favrot, 2009; Favrot and Kwak, 2018). There is some evidence that males and females exhibit different movement patterns (Stowe, 2014). A radio tracking study in the Tuckasegee River found that females made no major movements all season while males moved to lower reaches in the winter followed by a spawning migration to upper reaches in late winter and early spring (Stowe, 2014). Sicklefin Redhorse larvae and juveniles have limited upstream movement due to inadequate swimming speeds to pass high velocity riffle habitats (Ivasauskas, 2017) and are found in larger streams and lentic habitats further downstream from spawning areas (i.e., larval drift).
In 2005, the United States Fish and Wildlife Service classified the Sicklefin Redhorse a candidate for the federal endangered species list (U.S. Fish and Wildlife Service, 2015). Environmental challenges that threaten the Sicklefin Redhorse are similar to those affecting other Catostomidae species. Research has shown that Catostomidae populations can be influenced by habitat fragmentation (Bessert and Orti, 2008), habitat degradation (Thompson et al., 2010), pollution runoff (Munkittrick et al., 1991), non-native species (Tyus and Saunders III, 2000), and in some regions, commercial harvest (Begley et al., 2018). Many Catastomids exhibit upstream migrations similar to salmonids and therefore habitat fragmentation can be a major factor influencing their range and population dynamics. For example, movement patterns consistent with upstream homing to natal areas for spawning was observed in Largescale Suckers (Catostomus macrocheilus) following transplanting upstream of a dam in Montana (Schmetterling and McFee, 2006). These movement patterns suggested that the dam was acting as a barrier for this species preventing a full recovery. Further, spawning site fidelity has also been documented in Robust Redhorse (Moxostoma robustum) in the Lower Savannah River (Grabowski and Isely, 2006).
Being a candidate for federal listing and environmental threats to Sicklefin Redhorse, there has been a significant amount of conservation effort to protect and restore this species (U.S. Fish and Wildlife Service, 2015). Within the Little Tennessee River basin, Sicklefin Redhorse have been reintroduced into portions of the upper Tuckasegee River where they have since been restored following removal of an impoundment barrier in 2010 (Jason Mays, USFWS, personal communication, 2020). The restoration efforts have continued with annual stocking of juvenile fish upstream of the Ela Dam on the Oconaluftee River, Cullowhee Dam on the Tuckasegee River and the Franklin Dam on the Little Tennessee River. Despite ongoing restoration efforts of Sicklefin Redhorse, little is known about their population dynamics. Understanding survival and population size of this species is needed to develop new management actions or regulations such as stocking (Schooley and Marsh, 2007), reservoir discharge permitting (Scoppettone et al., 2015), and habitat restoration (Cooke et al., 2005). Achieving baseline population estimates of Sicklefin Redhorse will provide the framework to outline specific goals and targets (e.g., minimum population size) needed to have a sustainable population without stocking.
There are currently no published studies that describe survival of Sicklefin Redhorse. More broadly, there is minimal information about factors influencing survival of Catastomids. Most of the research focuses on factors influencing survival of larval fish (Weyers et al., 2003; Jennings et al., 2010; Ivasauskas, 2017). Specifically, high velocity (Weyers et al., 2003) and increased sediment load (Jennings et al., 2010) has been linked to reduced larval survival and larval growth. Factors influencing adult survival is limited to data collected from age and growth studies (Grabowski et al., 2007; Bettinger and Crane, 2011). Grabowski et al. (2007) used catch curves to estimate annual mortality of four sucker species in the Savannah River and found no difference across species but noted their mortality estimates are likely biased due to size selective sampling of older fish. Therefore, there is a need in the literature to better understand population size and survival of Castostomid species,
The goal of this research was to describe annual survival and population size of Sicklefin Redhorse in the Little Tennessee River basin to inform restoration efforts. The objectives were to 1) estimate annual survival in the Little Tennessee River and Tuckasegee River for male and females; 2) Determine the effect of stream discharge on capture probability; and 3) Estimate population size in the Little Tennessee River and Tuckasegee River. We hypothesized 1) that survival will differ by river but not by sex; and 2) capture probability will decrease as stream discharge increases.
All fish were captured in the Little Tennessee River and the Tuckasegee River. Both rivers flow through the Blue Ridge physiographic province and their confluence is at Fontana Lake, from which the Little Tennessee River eventually flows 99 km through North Carolina and Tennessee before its confluence with the Tennessee River. The Tuckasegee River Basin contains 1,579 km2 of Jackson and Swain counties in North Carolina. It has an elevation range of 1,953 m to 520 m, an average annual precipitation of 156 cm, and land use that is approximately 89% forest, 7% urban, and 2% agriculture (U.S. Environmental Protection Agency (US EPA), 2020). The Little Tennessee River Basin upstream of Lake Fontana contains 1,281 km2 of Clay, Macon, and Swain counties in North Carolina and Rabun County in Georgia. It has an elevation range of 1,686 m to 520 m, an average annual precipitation of 162 cm, and land use that is approximately 86% forest, 7% urban, and 4% agriculture (U.S. Environmental Protection Agency (US EPA), 2020).
Sampling was conducted in the Little Tennessee River and Tuckasegee River between 2007 and 2021. Rivers were not sampled each year. Sampling was not conducted in the Tuckasegee River prior to 2012 or the Little Tennessee River in 2018 and 2019. No sampling was completed in 2020 due to the COVID-19 pandemic. Sampling was conducted during April and May each year to target spawning migration. A total of six fixed sites were sampled on Little Tennessee River and four fixed sites were sampled in the Tuckasegee River (Figure 1). Sites on the Oconaluftee River (in an 800-meter reach between a hydroelectric dam and the confluence with the Tuckasegee River) are included in the data for the Tuckasegee River and referred to as the Tuckasegee River hereafter. Standardized boat electrofishing was used at each site. Sampling time on individual days was not recorded during sample collection and thus annual effort is expressed as the number of days sampled per year. Sampling effort ranged between 1 and 3 days on the Little Tennessee River, and between 1 and 6 days on the Tuckasegee River. Sample site lengths ranged from 350 m to 900 m on the Little Tennessee River and between 430 m and 1,480 m on the Tuckasegee River. Sample lengths were consistent each year. All fish collected were measured for total length (mm), total weight (g), and sex. Sex was determined by squeezing fish, males were identified by producing milt and females were identified by producing eggs. If no gametes were visible, sex could still typically be determined by observing tubercles on the anal and dorsal fins. However, occasionally sex was assigned as unknown when these methods failed to yield an obvious determination. Each individual was inspected for PIT (passive integrated transponder) tags and were given a PIT tag if they were unmarked. Daily discharge data were retrieved from the USGS gaging station on the Little Tennessee River at Needmore, North Carolina (Station #03503000) and the Tuckasegee River at Barker’s Creek, North Carolina (Station #03510577). Annual discharge during sampling was calculated by averaging the daily reported discharge during sampling days within a year.
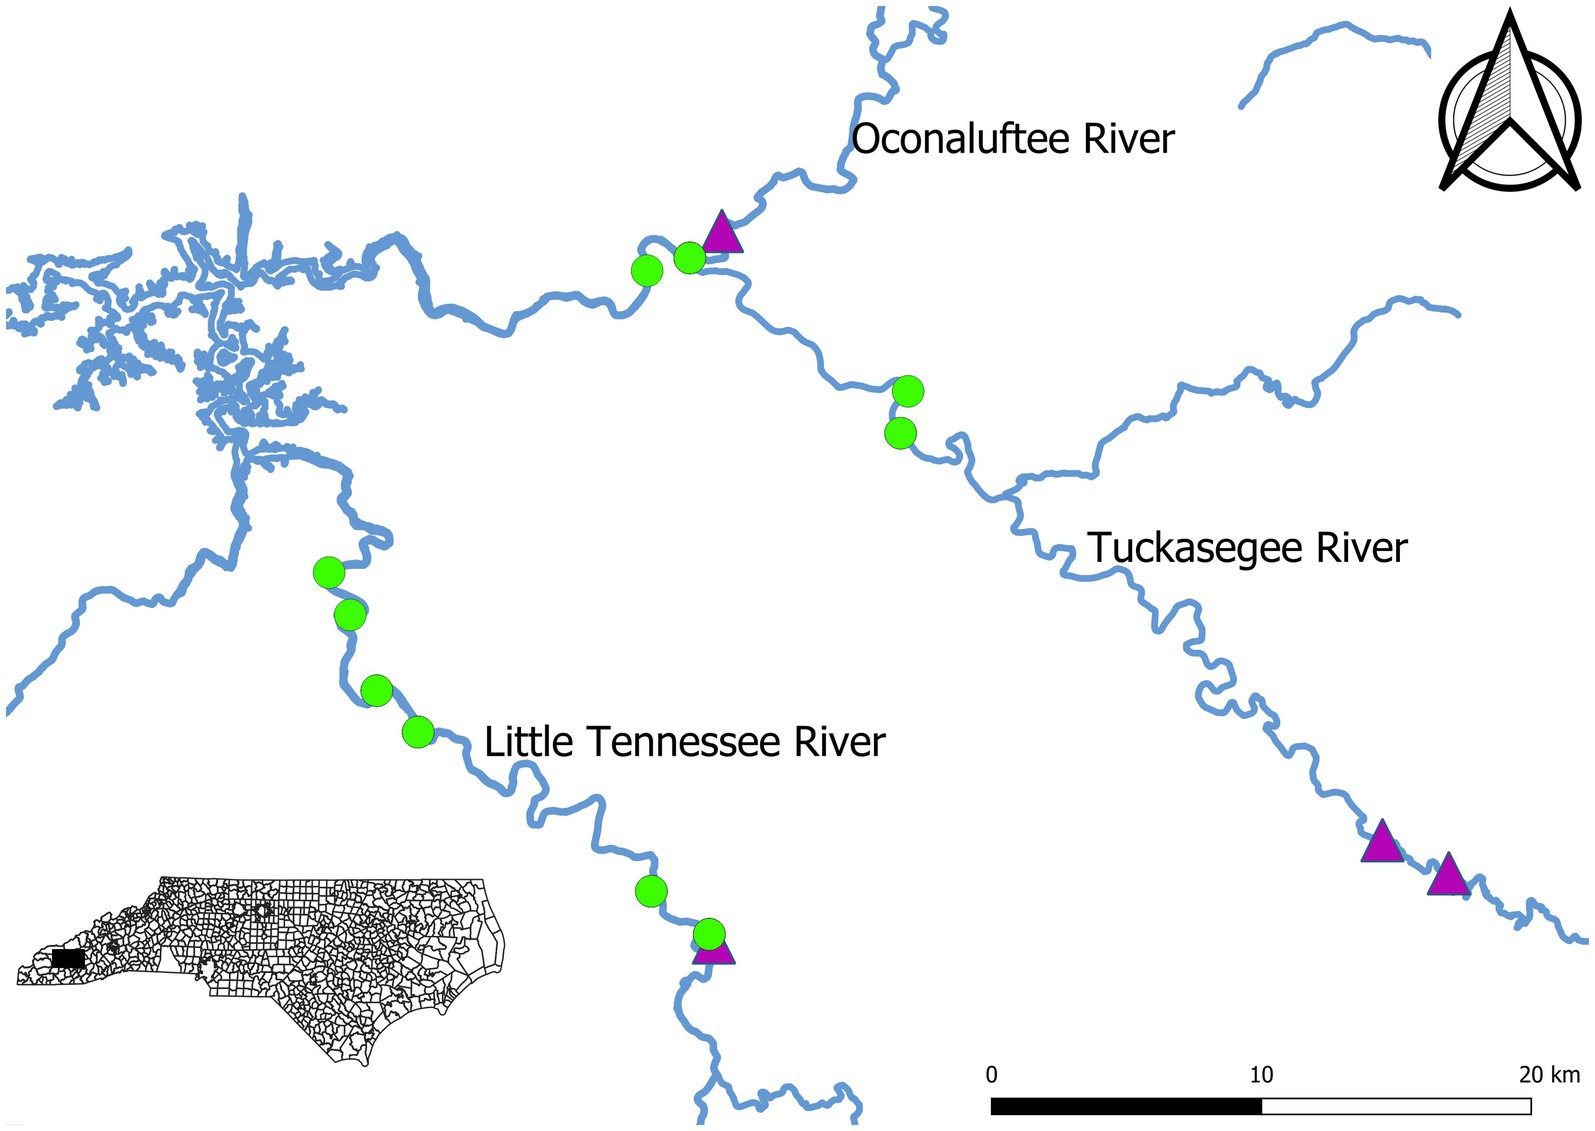
Figure 1. Map of Sicklefin Redhorse Moxostoma sp. electrofishing sampling sites (green points) on the Little Tennessee River and Tuckasegee River in western North Carolina. Dams are indicated by purple triangles.
Determining unbiased estimates of abundance and survival requires data that are collected following specific protocols with replicate observations over time or space (Upton, 2020). Relative abundance is relatively inexpensive and typically acquired through common sampling protocols that produce an observed number of individuals that is a product of the total number of individuals at a site and an unknown and unmeasured term, detectability (Royle and Dorazio, 2008). Thus, the observed number of individuals (n) is a product of the true number of individuals occupying a site (N), and the capture probability (p): E(n) = pN. Capture probability is defined as the probability of capturing an individual given that it is present and is never perfect (i.e., 100%). Because capture probabilities vary with species, methods, habitats, environments, etc. (Korman et al., 2009; Hense et al., 2010; Dextrase et al., 2014), the percentage of individuals that are detected may or may not represent the constant fraction of true abundance, particularly when comparisons are across sites and include multiple species. Variation in capture probabilities can lead to biased estimates of abundance which can further bias estimates of survival. Specific collection methods and models exist to disentangle these quantities and provide unbiased estimates of abundance. However, they require additional sampling and some method of marking individuals that are captured over a large spatial scale (Doll et al., 2020) or temporal scale (Doll et al., 2021). These data are used to estimate unbiased estimates of abundance, capture probability, and survival using a broad classification of modeling technique referred to as state-space models.
State-space models are a powerful statistical framework for analyzing complex environmental datasets. These models are hierarchical in nature and separate total variation within the system being modeled into process variation and observation error. Process variation is the random variation of the unobserved ecological process of interest (e.g., survival). Observation error is the random variation from the data-gathering process. The hierarchical structure of state-space models includes two sets of equations; one that represents the true, but unknown and unobserved, state of the system being studied; and a second that represents the observational data. These two systems of equations are linked through a shared parameter. A general state-space model is as follows:
Equation 1 is a first-order Marvok process where each state, , is only dependent on the previous state, . The additional parameters of equation 1 includes a transition matrix, a , and the process error, . Equation 2 describes the observation process where each observation, , is a function of the state process at time t, ; b, a parameter that describes the relationship between the observation at time t and the state at time t; and observational error, . The two error terms, and , are modeled using an appropriate distribution. One example is:
where is the standard deviation of the normal distribution. The state-space modeling framework is very flexible and any distribution could be used to match the expectations of the observations. For example, a Poisson or Negative Binomial distribution is often used in models of population dynamics because the observations are counts of individuals in the population. Additionally, the structure of state and observation equations are flexible and can incorporate many complex relationships to describe the unobserved system dynamics (e.g., population growth models; Hostetler and Chandler, 2015) and spatial relationships (Kumar et al., 2020) and the observed data (e.g., incorporating gear catchability in fisheries surveys; Gwinn et al., 2019).
State-space models have been widely used in a variety of ecological applications due to their flexibility (Kéry and Royle, 2016). Population ecologists use the state-space modeling framework to combine multiple life history and observational models into one ‘integrated population model’. These complex state-space models have been applied to a variety of taxa including the federally endangered Great Lakes Piping Plover (Charadrius melodus) (Saunders et al., 2018); marine protected Pantropical Spotted Dolphin (Stenella attenuate) (Hoyle and Maunder, 2004); and the Tricolored Blackbird (Agelaius tricolor), a species of conservation concern (Robinson et al., 2018). Integrated population models often combine sub-models that describe survival (Stuart et al., 2022), mortality (Doll et al., 2021), and movement patterns (Patterson et al., 2008). Studies of animal movement have taken advantage of this structure to model individual movement (Patterson et al., 2008) and population movement (Jonsen, 2016). These models generally require multiple years of data and can incorporate multiple data sources. Other simpler state-space models that are appropriate for describing population dynamics of species that are of conservation concern include data obtained from capture-recapture data. For example, abundance and activity of the federally endangered Indiana Bat (Myotis sodalist) (Caldwell et al., 2019); abundance estimates of the state and federally protected Spotfin Chub (Erimonax monochus) (Doll et al., 2020); and abundance estimates of the federally endangered North Atlantic Right Whale (Eubalaena glaciallis) (Pace III et al., 2017). In this study we use capture-recapture data of uniquely tagged individuals with a state-space modeling framework to estimate survival and population size of the Sicklefin Redhorse.
Survival and population abundance was estimated using a Cormack–Jolly–Seber (CJS) model (Cormack, 1964; Jolly, 1965; Seber, 1965). The CJS model describes changes in the population due to deaths in an open system based on capture-recapture data from time t = 1,….T. This model describes capture probability (p) and survival (φ) based on a series of capture-mark-recapture events. Here, individuals are marked in time t and the individual will survive to year t + 1 with probability φt or dies with probability 1 − φt. The CJS model assumes survival is a combination of true survival and emigration (i.e., fish have left the system or missed during capture), therefore is termed apparent survival. We estimate survival as apparent survival but note that true survival and apparent survival estimated here are likely similar due to high site fidelity of Sicklefin Redhorse during the spawning period (Stowe, 2014). Thus, apparent survival will be referred to as survival throughout.
Survival in the CJS model is the state process that is not observed. Rather survival is estimated based on the observation process and capture probability. For example, a marked individual that is alive at time t may be recaptured with probability pt or not recaptured with probability 1 - pt. However, capture probability is conditional on the state process of being alive at time t and formulated with a hierarchical structure for the individual i. The state process is conditional on the first capture when it is marked. The true state of an individual fish is a latent discrete parameter, Zr,i,t, that indicates if the individual i from river r is alive at time t. Given an initial capture at time t = 1 where Zr,i,1 = 1, Subsequent states of the latent discrete parameter Z is distributed as:
Given an individual i is alive at time t (Zr,i,t = 1), it is recaptured with probability (t = 2,…,T) which is distributed at:
where is the observation of individual i in river r at time t and is the capture probability of individual i in river r at time t. The latent parameter is included because if the individual is dead ( = 0) then the individual cannot be recaptured. Covariates of survival and capture probability are entered into the model through the logit-link function. The survival model with covariates is represented as:
where the intercept ( ) represents the baseline survival for river r, is a random effect for sex (Male, Female, or Unknown) and shared across rivers, is a random effect of time for river r, is the standard deviation of the random effect for sex, and is the standard deviation of the random effect for time for each river r. The capture probability model is shared across both rivers.
where the intercept ( ) represents the baseline capture probability, is a random effect for sex (Male, Female, or Unknown), is the effect of effort , is the effect of discharge, is the amount of sampling effort in river r during year t, is the discharge at river r during year t, and is the standard deviation of the random effect for sex. For years when sampling did not occur, was set to 0.
Posterior predicted survival for each sex, river, and year was calculated as:
where , , and are survival estimates for male, female, and unknown sex fish in river r; is the random effect for males; is the random effect for females; is the random effect for unknown sex; and inv-logit is the inverse logit function.
Sex specific capture probability and total population size for each sex, river, and year was derived from the posterior probability distribution of the estimated parameters. Sex and river specific capture probability was calculated as:
where is the capture probability of males in year t at river r; is the capture probability of females in year t at river r; is the capture probability of unknown sex in year t at river r; is the random effect for males; is the random effect for females; is the random effect for unknown sex; is sampling effort in year t at river r; is the discharge in year t at river r; and are estimated parameters; and inv-logit is the inverse logit function. Sex and stream specific total population size by year was calculated as:
where is the total estimated population size of males at river r in year t; is the total population size of females at river r in year t; is the total population size of unknown sex at river r in year t; is the observed number of males at river r in year t, is the observed number of females at river r in year t; is the observed number of females at river r in year t; is the total population size of all fish at river r in year t.
Parameters were estimated using Bayesian inference (Doll and Jacquemin, 2018) following the model specification of Schofield (2007) and Stan Development Team (2022a). Non-informative prior probability distributions were given to all parameters (Table 1). Stan was used to estimate posterior probability of model parameters (Stan Development Team, 2022a) with RStan version 2.26.13 (Stan Development Team, 2022b) implemented in R 3.5.3 (R Core Team, 2022). Three MCMC chains were used with a total of 4,000 steps and discarding the first 2,000 steps as a burn-in period for a total of 6,000 steps (2,000 per chain). The burn-in period is necessary to reduce the effect of starting values on the MCMC results (Gelman et al., 2008). Complete model specification with Stan code is located in Appendix A. Convergence of the MCMC algorithm was assessed with the split and visual inspection of traceplots. Convergence was obtained when the upper limit of the split is under 1.10.
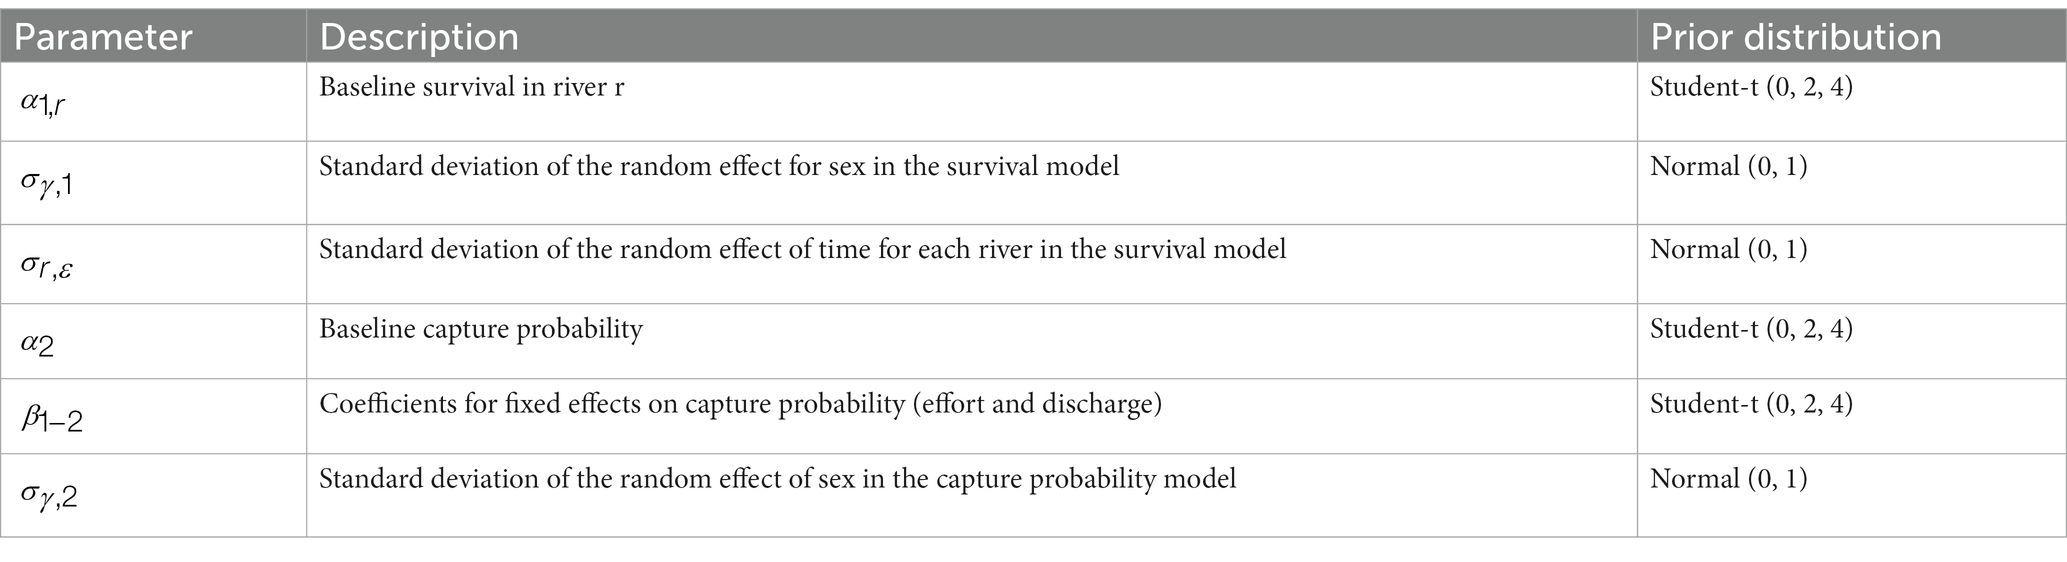
Table 1. Prior probability distributions for the Cormack–Jolly–Seber model.
A total of 1,412 individuals were sampled during the study period. This includes 990 unique males, 331 unique females, and 91 unknown sex (Figure 2). Annual total observed fish fluctuated with a general increase after 2011 (Figures 2, 3). More fish were observed in the Little Tennessee River (n = 889) than the Tuckasegee River (Figure 3; n = 523). Mean discharge in the Little Tennessee River and Tuckasegee River during sampling was 37.22 cms (sd = 28.04) and 29.96 cms (sd = 21.03). Mean total length of captured fish in the Little Tennessee River and Tuckasegee River was 578.8 mm (sd = 47.4) and 550.9 mm (sd = 51.0). Females were generally longer than males in both rivers. Average total length of females was 607.8 mm (sd = 59.6) from the Little Tennessee River and 575.1 mm (sd = 52.3) from the Tuckasegee River while males were 571.3 mm (sd = 59.6) from the Little Tennessee River and 543.2 mm (sd = 39.5) from the Tuckasegee River.
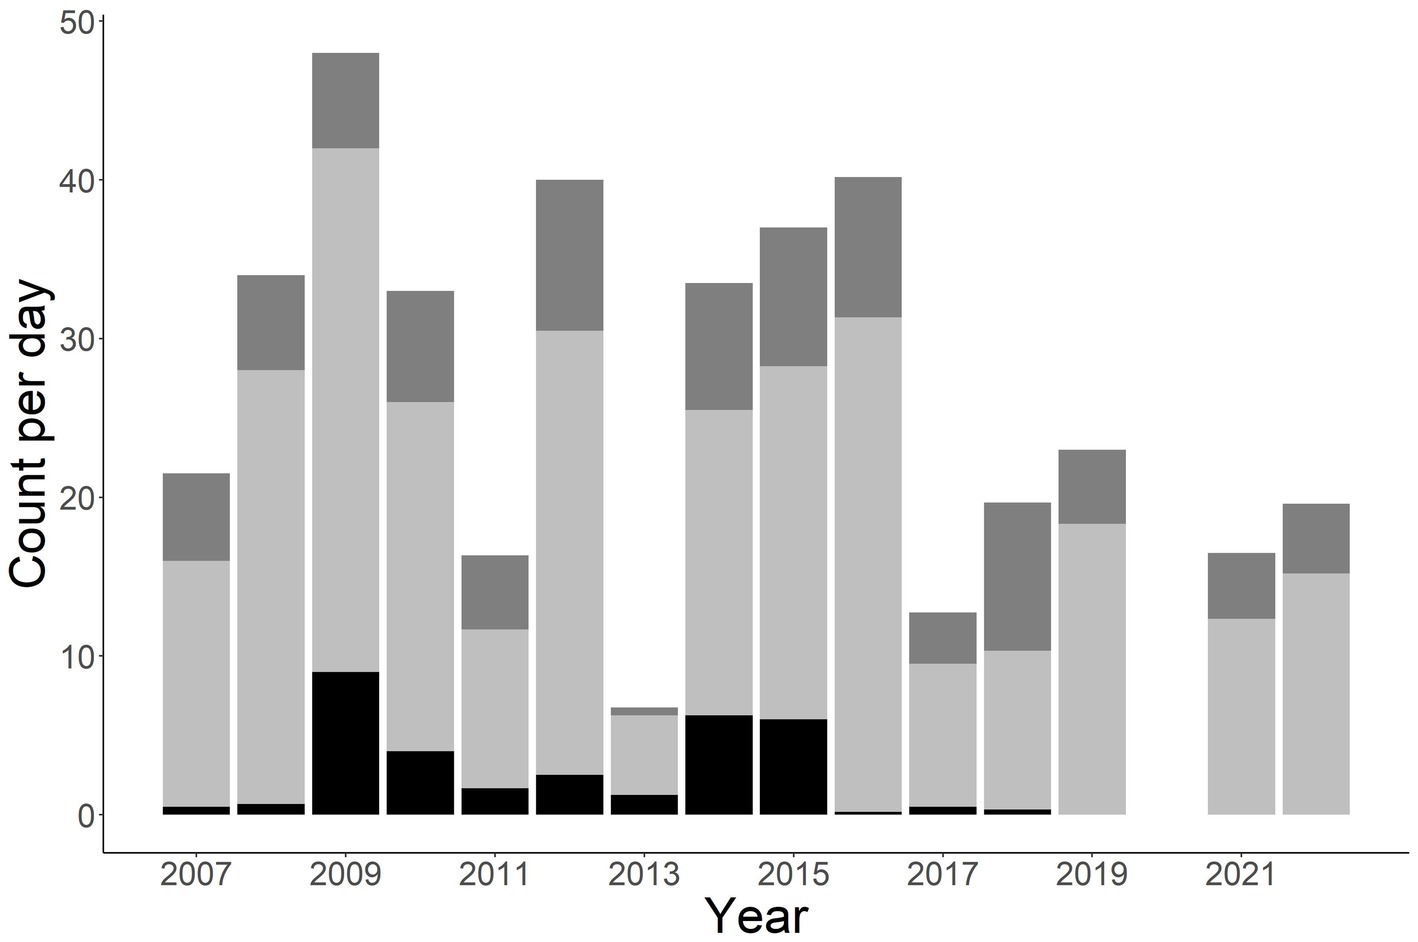
Figure 2. Stacked bar chart of total number of Sicklefin Redhorse Moxostoma sp. collected by year in the Little Tennessee River and Tuckasegee River. Dark grey (top of bar) represents total number of females, light grey (middle of bar) represents total number of males, and black (bottom of bar) represents total number of unknown sex.
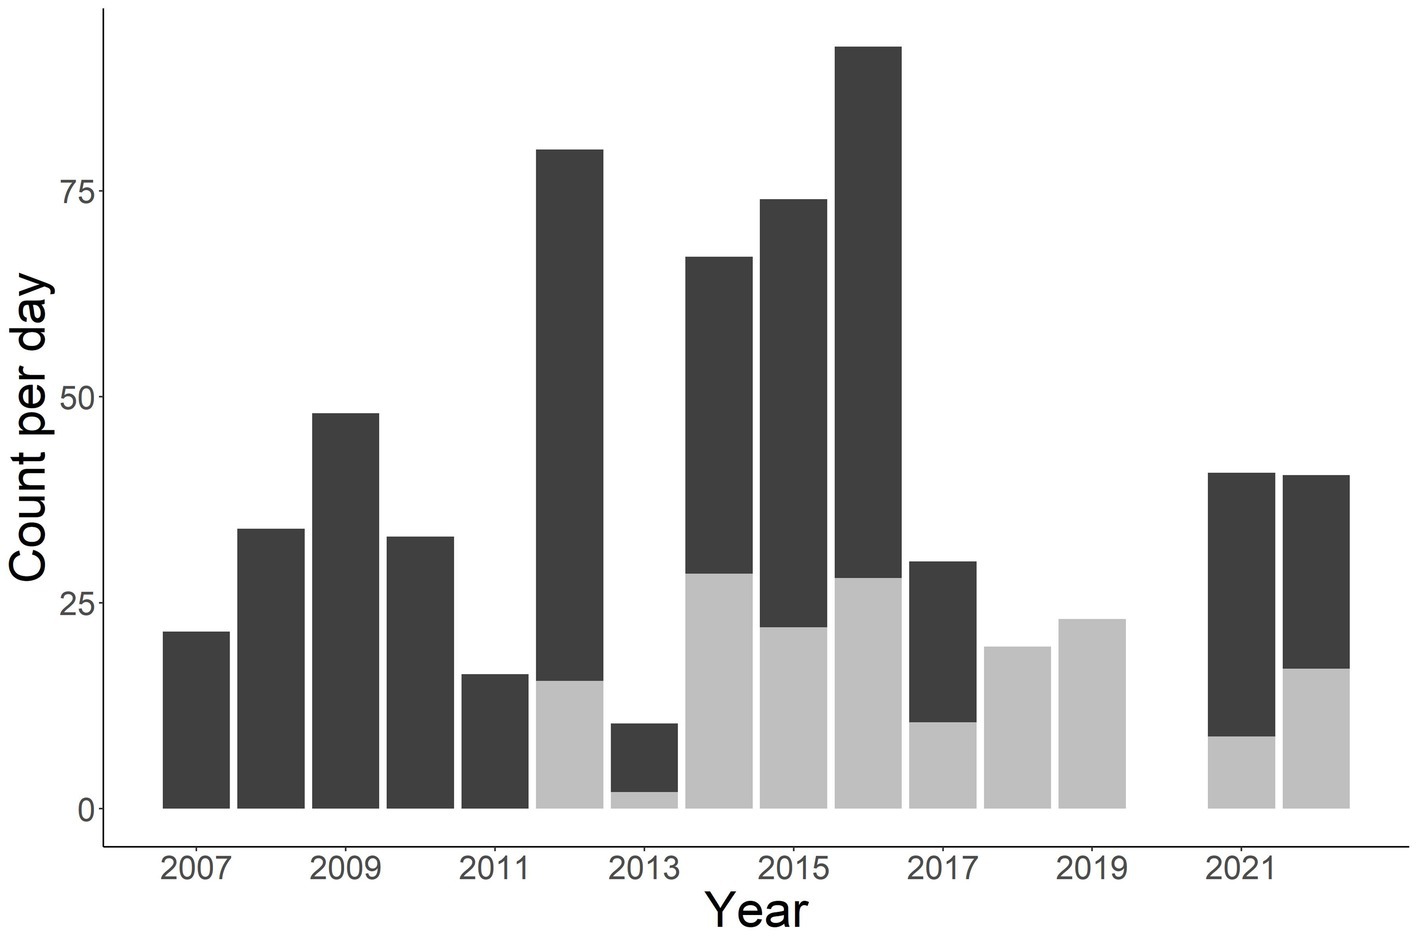
Figure 3. Stacked bar chart of total number of Sicklefin Redhorse Moxostoma sp. collected in the Little Tennessee River (dark grey) and Tuckasegee River (light grey). Sampling was not conducted in the Tuckasegee River prior to 2012 or the Little Tennessee River in 2018 and 2019.
Survival was more variable in the Little Tennessee River compared to the Tuckasegee River across sex (Figure 4). Survival in 2008 was the lowest observed in the Little Tennessee River, followed by low years in 2012 and 2016. Survival to 2008, 2012, and 2016 corresponds to low annual mean discharge (2008 = 19.22, 2012 = 27.28, and 2016 = 22.45 cms; Appendix B). Survival in the Tuckasegee River was consistently high each year, however, greater uncertainty was observed in 2013 and 2014. Survival was similar across sex in both rivers (Figure 4).
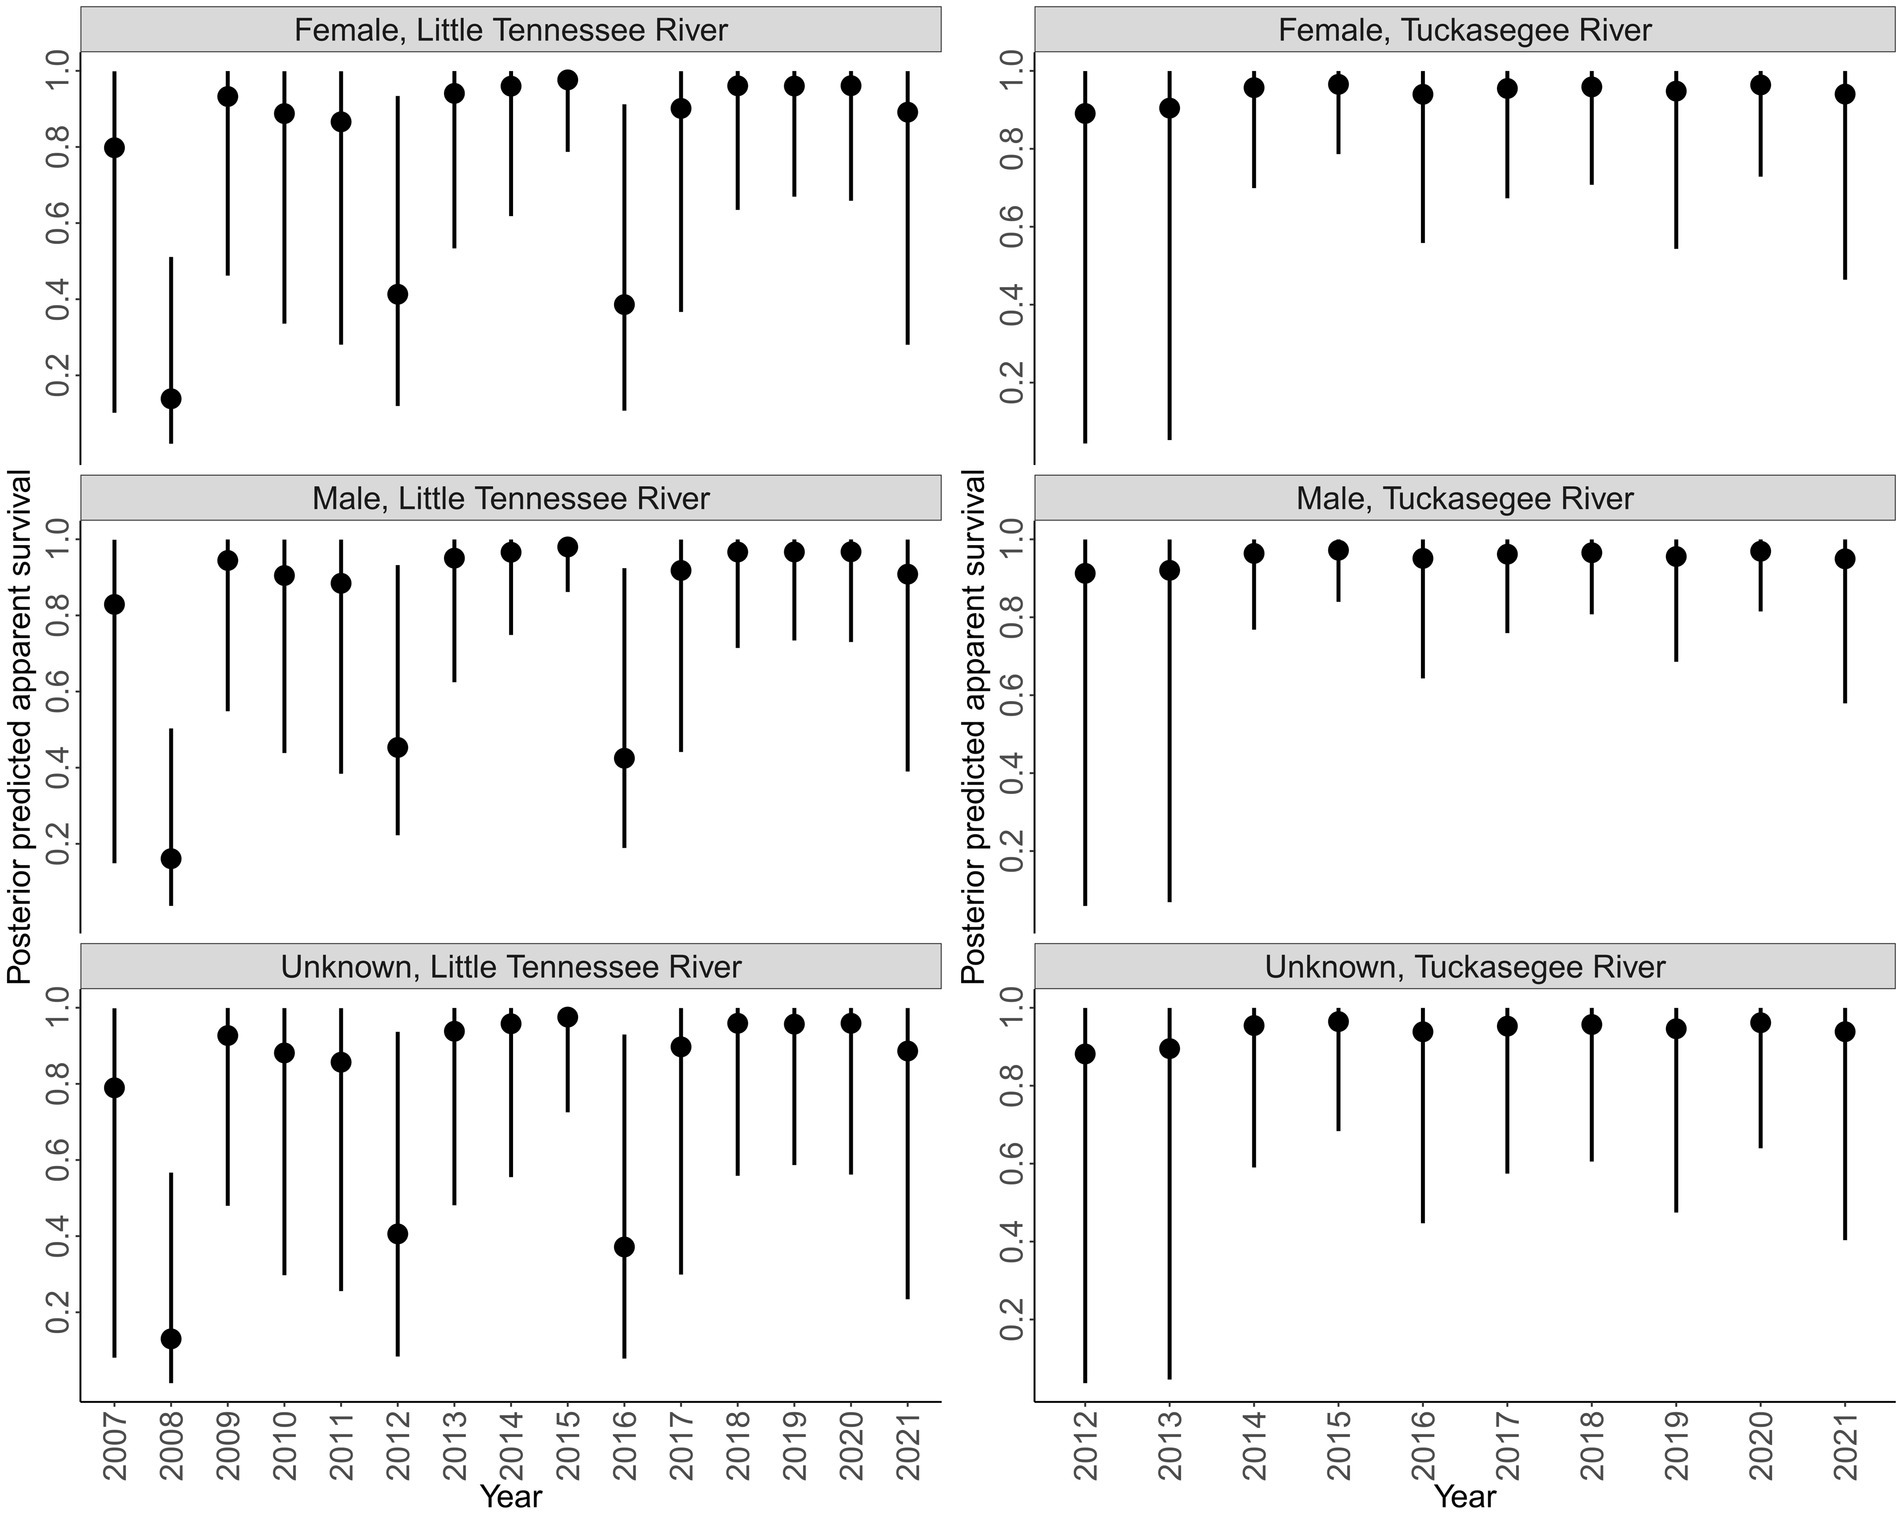
Figure 4. Posterior predicted annual survival of Sicklefin Redhorse Moxostoma sp. in the Little Tennessee River (left) and Tuckasegee River (right) for females, males, and unknown sex. Solid points represent the median and vertical black lines represent the bounds of the 95% credible intervals.
Discharge had a negative relationship with capture probability ( = −0.220, 95% CI = −0.448 to 0.006; Figure 5). Males had a higher capture probability than females and unknown sex based on a range of discharge (Figure 5). Male capture probability was approximately double that of females for all discharge values (Figure 5). Capture probability of unknown sex was highly variable across all discharge values. High variability for unknown sex is due to the combined males and females that could not be sexed, thus this parameter has to account for variation across all sexes. Annual posterior predicted capture probabilities were low in both rivers with the highest capture probability of 0.059 (95% CI = 0.033 to 0.104) in males sampled in the Tuckasegee River in 2016 (Figure 6).
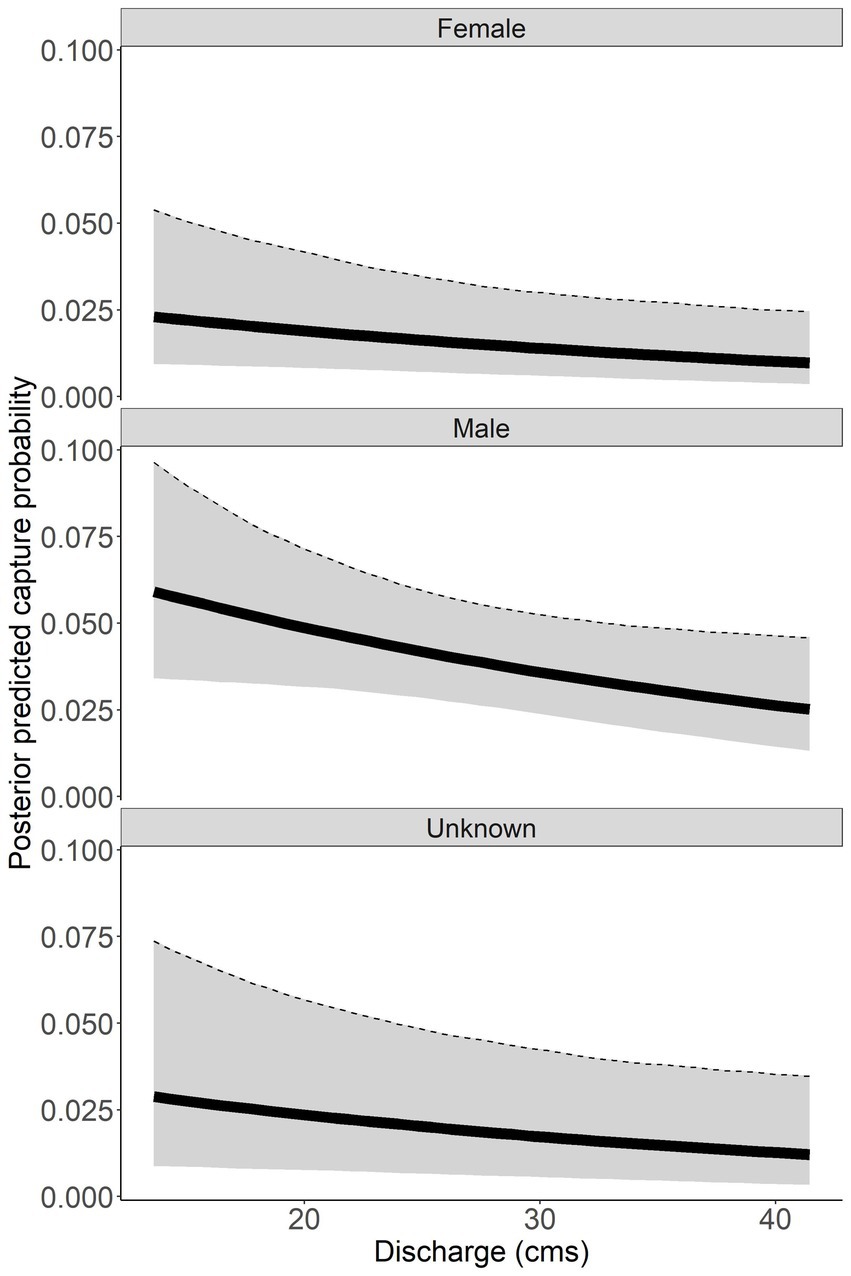
Figure 5. Posterior predicted capture probability of Sicklefin Redhorse Moxostoma sp. as a function of discharge (cubic meters per second, cms). Dark solid line represents the median and shaded area with dashed line represents the bounds of the 95% credible intervals.
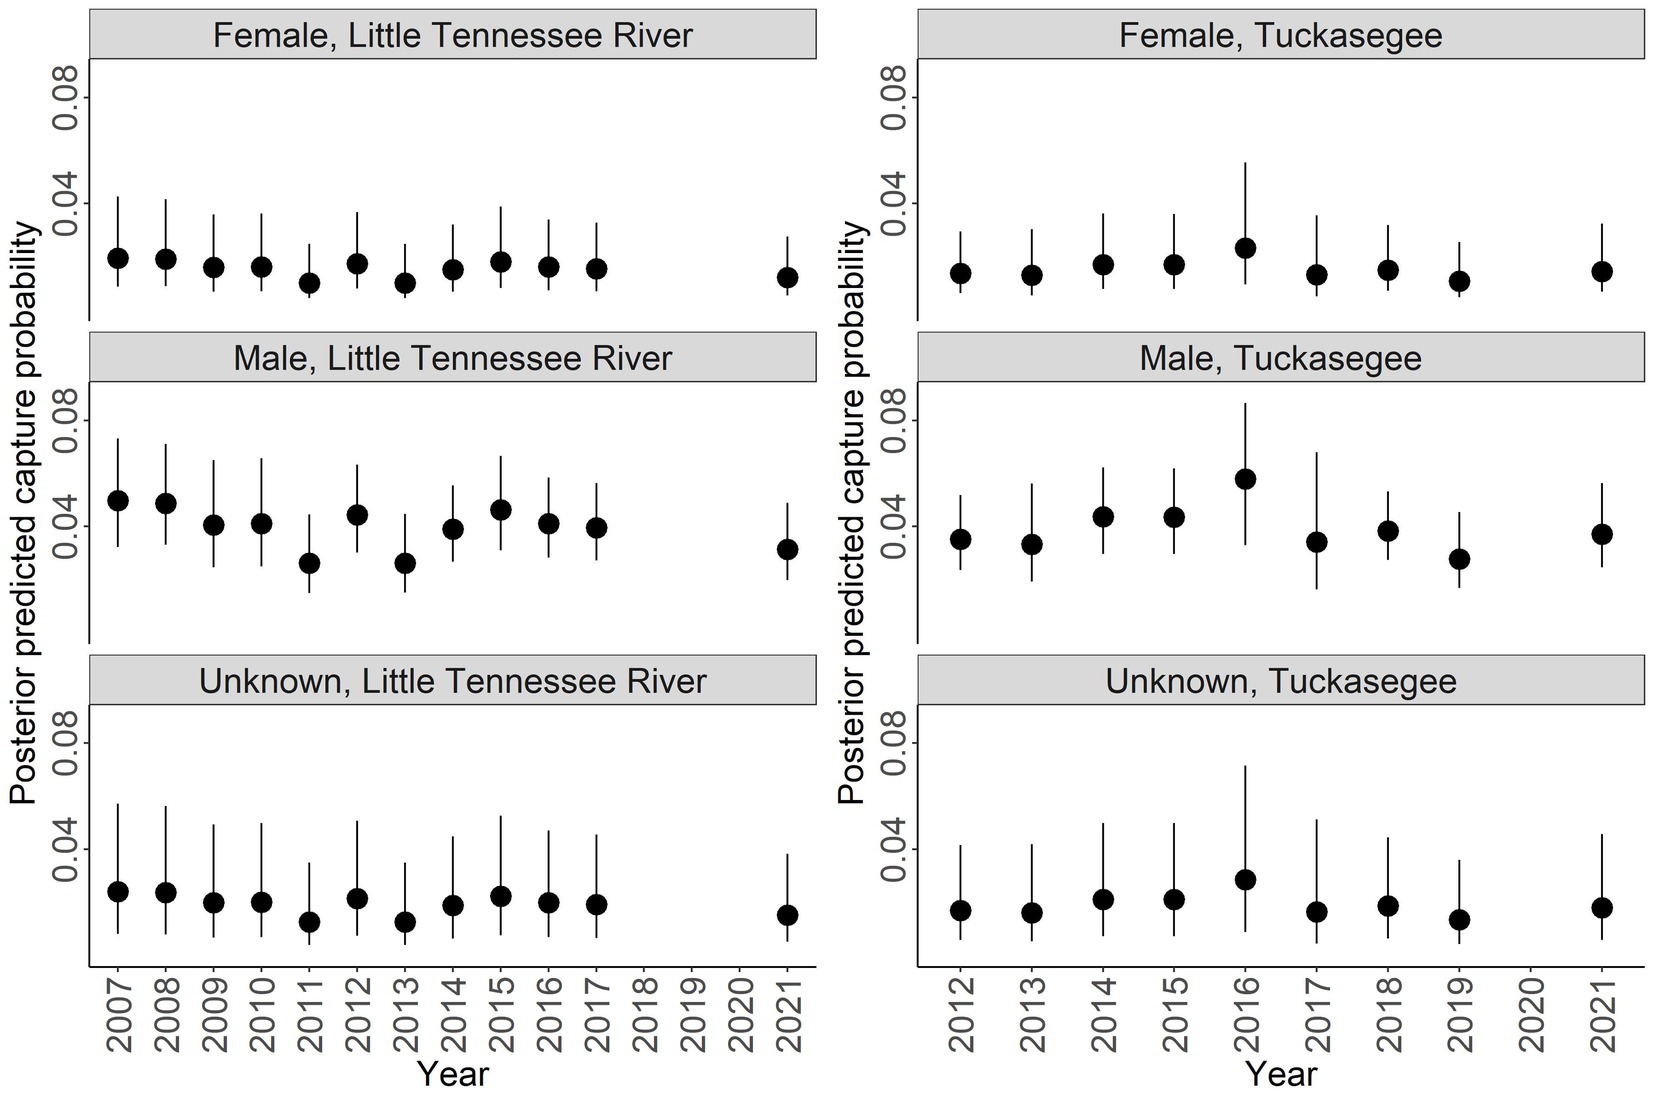
Figure 6. Posterior predicted capture probability of Sicklefin Redhorse Moxostoma sp. for the Little Tennessee River (left) and Tuckasegee (right) for female, male, and unknown sex. Dark solid line represents the median and shaded area with dashed line represents the bounds of the 95% credible intervals.
Sex specific population size varied across rivers and years (Figures 7, 8). Male population size was greater than females across all years in the Little Tennessee River. The dominant sex in the Tuckasegee River was variable across years. Females were most dominant in 2012, 2014, 2015, 2017, and 2018. Males were most dominant in 2013, 2016, 2019, and 2021. Total population size for the Little Tennessee River was highest in 2016 (total = 4,256, 95% CI = 2,847 – 6,854) and lowest in 2010 (total = 1,210, 95% CI = 721–2,165). Total population estimates for the Tuckasegee had a larger range across years with the highest estimate in 2019 (total = 3,357, 95% CI = 1,962 – 5,863) and lowest estimate in 2013 (total = 60, 95% CI = 36–104). However, the CV of population size in the Little Tennessee River ranged from 0.22 to 0.35 while CV in the Tuckasegee River ranged from 0.25 to 0.43. Population estimates of males were consistently higher than females in both rivers (Figures 7, 8).
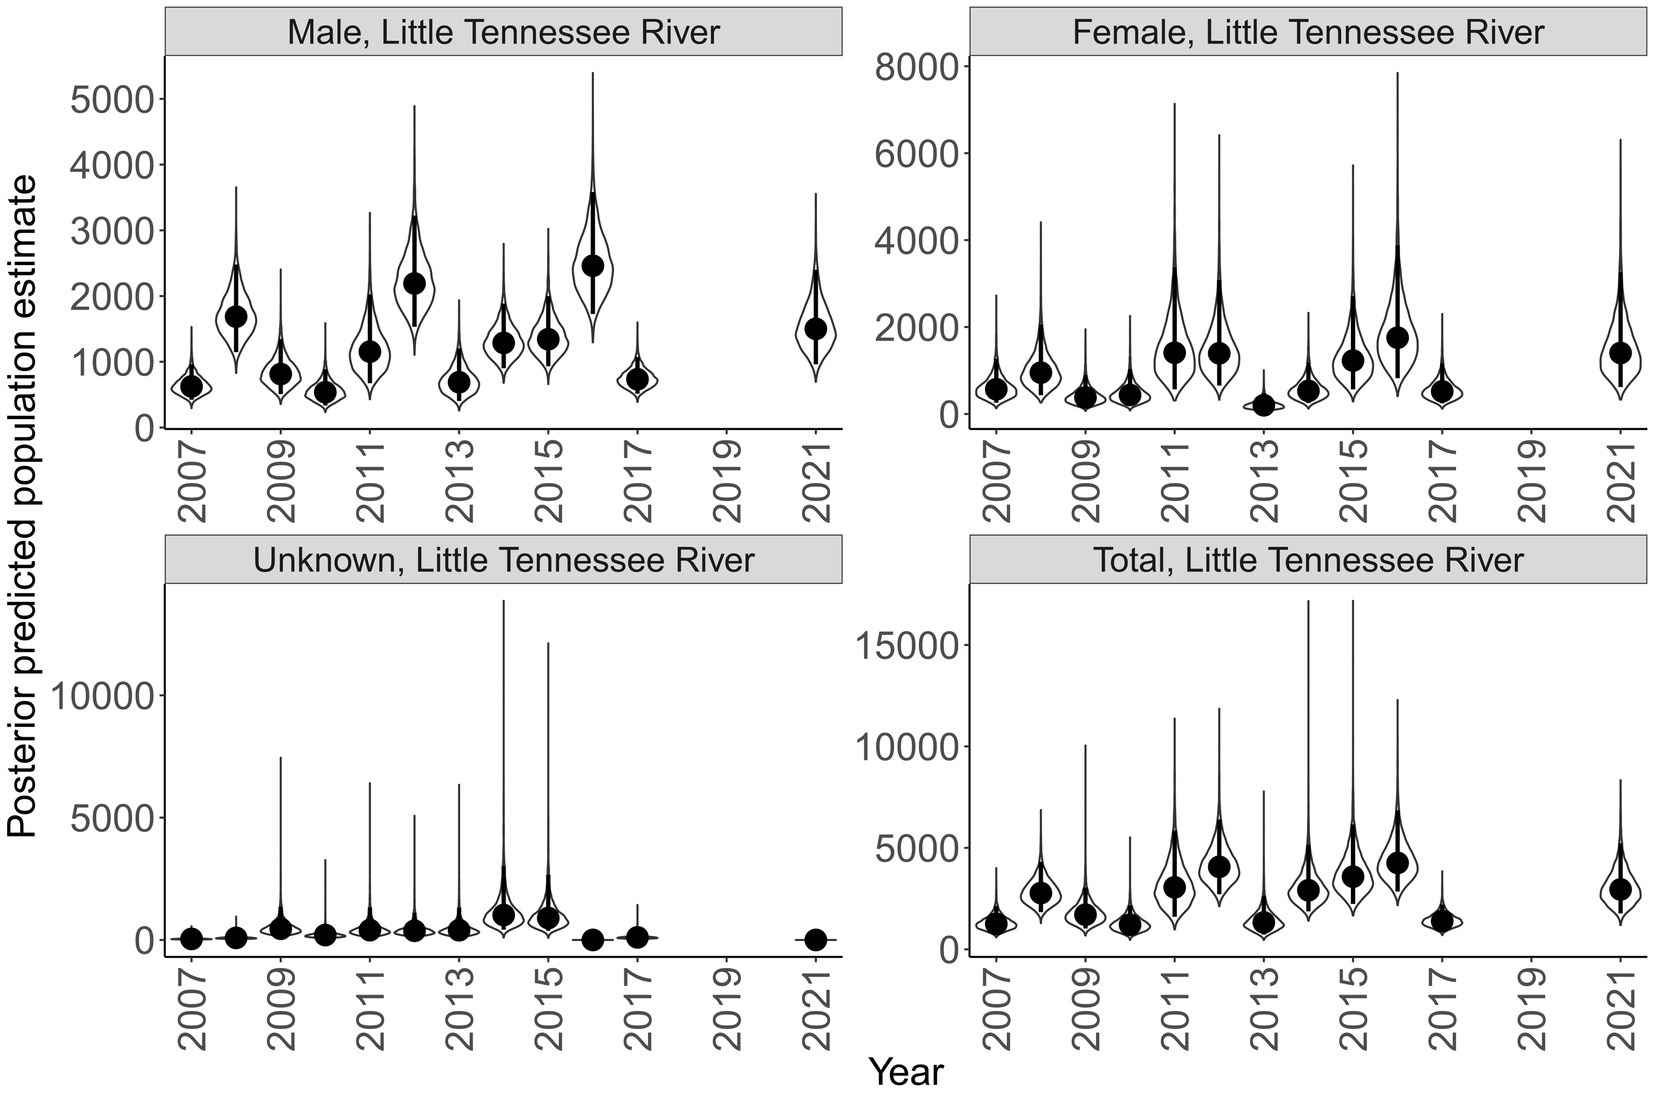
Figure 7. Annual population estimate of Sicklefin Redhorse Moxostoma sp. in the Little Tennessee River by sex and all sexes combined. Years without a plot indicate river was not sampled. Violin plots represent the shape of the full posterior distribution, dark circles represent the median of the posterior distribution, and solid vertical lines represent the bounds of the 95% credible intervals.
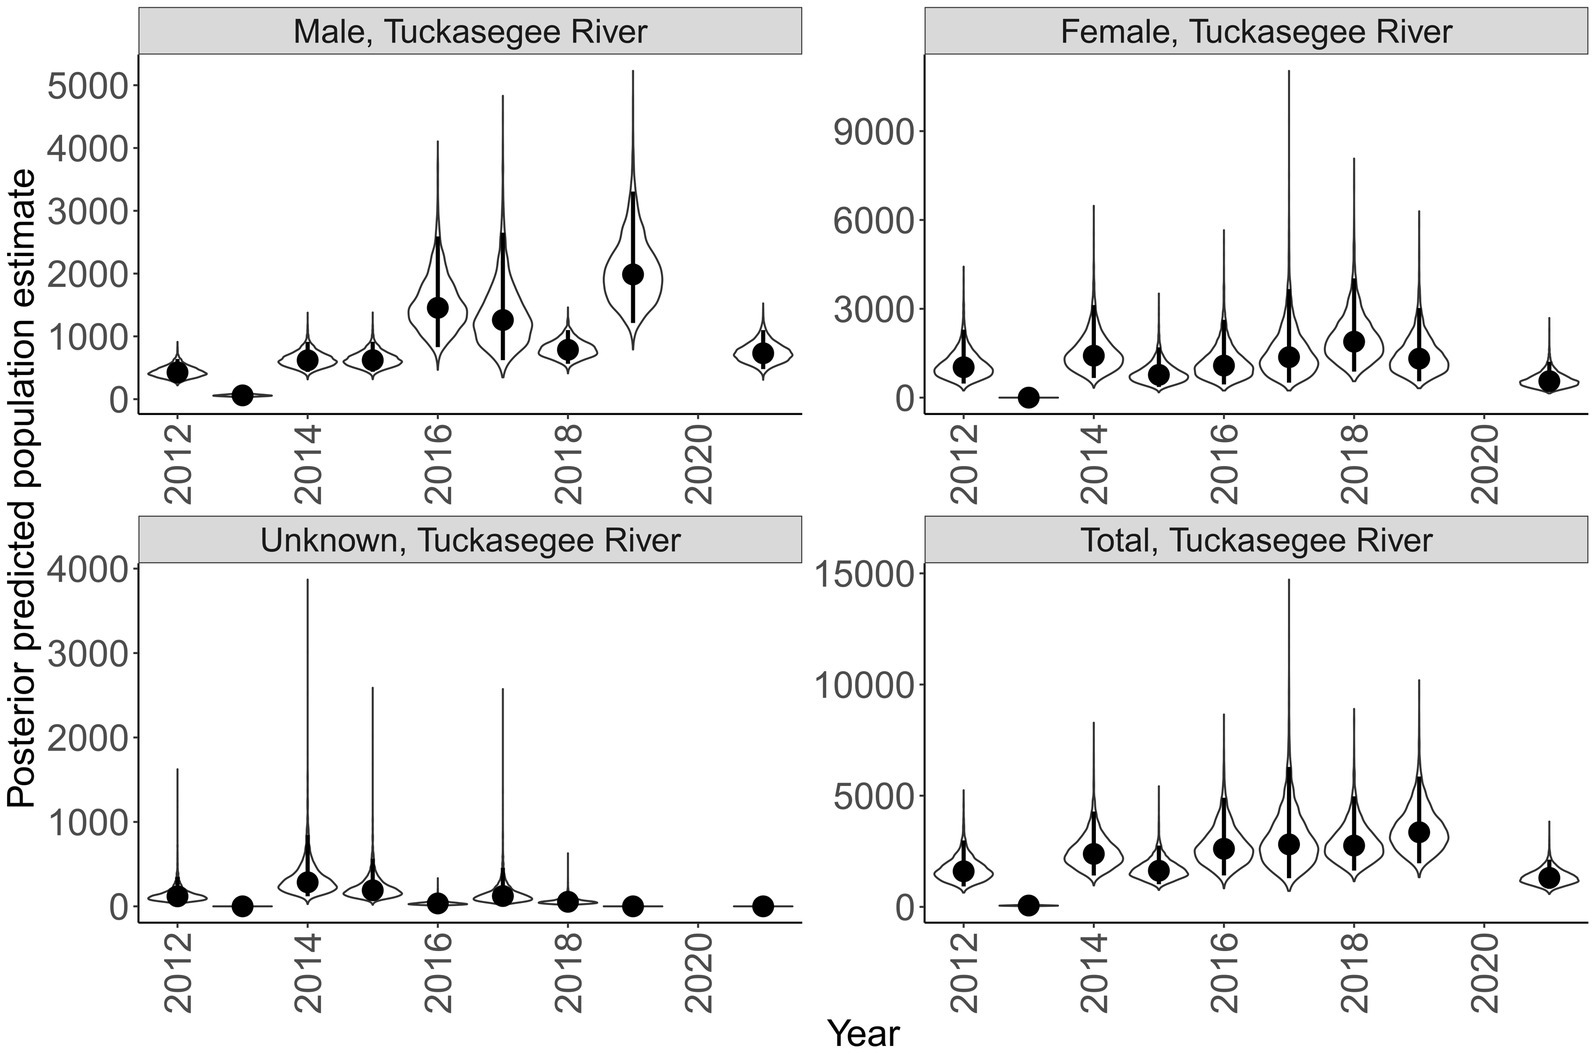
Figure 8. Annual population estimate of Sicklefin Redhorse Moxostoma sp. in the Tuckasegee River by sex and all sexes combined. Years without a plot indicate river was not sampled. Violin plots represent the shape of the full posterior distribution, dark circles represent the median of the posterior distribution, and solid vertical lines represent the bounds of the 95% credible intervals.
We described survival, population size, and capture probability of an endemic species and linked trends in capture probability to sex and river discharge. This is the first study to describe these three parameters for Sicklefin Redhorse. Because this is the first study, there are no published results to compare to. However, some conclusions can be drawn. Annual survival was generally consistent across years, but there was substantial uncertainty during years where data from only one river is available. Further, survival was similar between sex but there were differences between rivers. This suggests the adult population is relatively stable but understanding why survival differs between rivers is needed. Population estimates varied across years and males dominate the population in the Little Tennessee River while the dominant sex is not consistent across years in the Tuckasegee River. Population estimates of males in the Little Tennessee River follow a cyclical trend with peaks in 2008, 2010, and 2016. Population size cycles and consistent survival suggest recruitment fluctuations are driving the adult population size.
We did not include covariates of survival because this survey targeted adult fish only. Little is known about what factors influence adult Sicklefin Redhorse survival. However, other large bodied catastomids, Robust Redhorse and Notchlip Redhorse (Moxostoma collapsum), have been extensively studied and other life history metrics (e.g., age-0 survival) are related to discharge (Peterson et al., 2013). For example, Robust Redhorse and Notchlip Redhorse age-0 survival has been linked to river discharge (Peterson et al., 2013). It was found that mean maximum discharge during April and June was negatively related to age-0 abundance and intermediate duration of low flows was positively related to age-0 abundance. These results suggested short periods of low flow could increase spawning and reproductive success. The omission of discharge in the survival model used here does not imply Sicklefin Redhorse populations are not affected by stream flow. Discharge was not included in this study because only age-0 survival in other catastomids have been linked to discharge (Peterson et al., 2013) and this study only estimated survival of adult fish. Interestingly, the three years of low survival of adult Sicklefin Redhorse in the Little Tennessee River coincided with the three lowest discharge years in the time series. Low flow is not known to influence survival of catostomids. One possible explanation for low flow reducing survival estimates could be that low flow disrupts spawning migration.
Capture probabilities estimated for Sicklefin Redhorse were low and varied by sex and discharge. This suggests CPUE data should be interpreted with caution, particularly if data are not separated by sex. Although capture probabilities have not been reported for Sickelfin Redhorse, they have been reported for Robust Redhorse in the Ocmulgee River, Georgia (Grabowski et al., 2009). Grabowski et al. (2009) used a radio tagging study to estimate capture probability and abundance. They determined mean capture probability from electrofishing was 0.031 (95% Credible Interval = 0.002 to 0.111). These estimates are similar to what we observed in Sicklefin Redhorse. The results of Grabowski et al. (2009) and our findings suggest single boat electrofishing in large rivers is not an effective capture method for many large bodied catostomids. The negative relationship between river discharge and capture probability suggests future surveys should be cautious about sampling during moderately high discharge events and sampling should be standardized with a maximum discharge threshold. Increased discharge has been found to be negatively associated with capture probabilities of numerous fish species (Lyon et al., 2014). A study of capture probabilities was estimated for the Murry River, Australia, where the researchers marked up to 424 fish each year for seven years using a mark-recapture study design (Lyon et al., 2014). They found that capture efficiency decreased as daily river discharge increased for most species studied. Others have also identified discharge to be an important environmental covariate that should be considered when evaluating population metrics and the flow-ecology relationship of fish (McManamay et al., 2014; Gwinn et al., 2016).
The state-space model used here requires several assumptions to be met for inference to be valid (Lebreton et al., 1992). First, every marked individual has the same capture probability. Our data, without predictors, violate this assumption because of potential sex specific differences and variable sampling effort. Both effects were incorporated into the model to ensure variability in capture probability is constant or explained by model covariates. Second, every marked individual has the same survival probability. We partially relaxed this assumption by incorporating model covariates by year. The model still assumes individuals have the same survival probability within year. Third, sampling periods are instantaneous and the same time between captures is the same. All sampling within a single year was completed within a two-week period and survival was not likely to change during sampling. Further, the annual time steps were consistent each year. Fourth, emigration is assumed to be permanent. The sampling location in the study was a fixed location where spawning is known to occur and fish do leave the location after spawning. Although we did not directly measure emigration, Sicklefin Redhorse have high site fidelity (Stowe, 2014), suggesting emigration from the study system and sites of capture is minimal. Finally, the last assumption is each individual is independent. There are no individual level covariates in this model, thus, this assumption remains.
This study has important implications on the conservation of this species by describing survival and factors that influence capture probability. Understanding these components can be used to direct future management and surveys. Our results suggest annual survival of Sicklefin Redhorse is more variable in the Little Tennessee River. It is currently unknown why survival is lower in the Little Tennessee River; however, the lowest survival years do correspond to low discharge years. Further, the cycling of male population size in the Little Tennessee River suggests variable recruitment. Future work should attempt to identify what is driving recruitment of this species. Our results also suggest discharge is an important predictor of capture probability. Because of this, sampling should be restricted to a narrow range of discharge to minimize the influence of variable discharge on capture probabilities.
Conservation of endemic species remains a challenge and detailed information about their population dynamics are needed to maintain and restore their populations. Regardless of the species, surveys to accurately estimate population dynamics require complex study design. Specifically, accurate estimates of survival require accounting for imperfect detection (Monk, 2013; Pfaller et al., 2013). Yet few studies (23%) attempt to account for imperfect detection (Kellner and Swihart, 2014). Survey designs that account for imperfect detection include line transects (Jarvis and Robertson, 1999), distance surveys (Judge et al., 2021), and capture-recapture (Labonne and Gaudin, 2005). These methods have been applied to endemic species but often treat imperfect detection as a single parameter that does not vary (Labonne and Gaudin, 2005; Smith and Kwak, 2014; Judge et al., 2021). Capture probabilities are almost never constant and can vary across time (Corkrey et al., 2008) and due to a variety of environmental (Pollock et al., 1984; Letcher et al., 2015) and biological (Hedger et al., 2018) factors. Thus, it is important to include covariates of detection as fixed effects (Hense et al., 2010) or random effects (Letcher et al., 2015). Both fixed and random effects were used in this study.
Determining abundance of endemic species can be difficult given their limited distribution and often low abundances. True estimates of abundance require extensive amounts of information that are obtained over a spatial (Royle, 2004) or temporal (Dail and Madsen, 2011) range. The replicate sampling increases the cost but can provide a more accurate estimate of abundance. For example, raw catch per day in this study suggest the population fluctuated widely between 2014 and 2019 in the Tuckasegee River (Figure 3, grey bars), however, population estimates which account for imperfect detection suggests a much more stable population (Figure 8). By ignoring the impact imperfect detection can have on survival and abundance estimates, managers could mistakenly conclude the population is much less stable than what it is. Our study adds to the literature that demonstrates the need to conduct complex sampling to better understand population dynamics, particularly those of endemic species.
The raw data supporting the conclusions of this article will be made available by the authors, without undue reservation.
Ethical review and approval was not required for the animal study because the data were collected by state and federal agency biologists. The main/corresponding author did not participate in any field work.
LE and DO collected field data. JD conducted the data analysis and wrote the manuscript. All authors contributed to the article and approved the submitted version.
Funding for this project was provided by the Candidate Conservation Agreement for the Sicklefin Redhorse.
We are grateful for the field assistance by the numerous North Carolina Wildlife Resources, Tennessee Valley Authority, Duke Energy, Eastern Band of Cherokee Indians, and US Fish & Wildlife Biologists.
The authors declare that the research was conducted in the absence of any commercial or financial relationships that could be construed as a potential conflict of interest.
All claims expressed in this article are solely those of the authors and do not necessarily represent those of their affiliated organizations, or those of the publisher, the editors and the reviewers. Any product that may be evaluated in this article, or claim that may be made by its manufacturer, is not guaranteed or endorsed by the publisher.
The Supplementary material for this article can be found online at: https://www.frontiersin.org/articles/10.3389/fevo.2023.1097389/full#supplementary-material
Bataille, A., Cunningham, A. A., Cedeño, V., Patiño, L., Constantinou, A., Kramer, L. D., et al. (2009). Natural colonization and adaptation of a mosquito species in Galápagos and its implication for disease threats to endemic wildlife. Proc. Natl. Acad. Sci. U. S. A. 106, 10230–10235. doi: 10.1073/pnas.0901308106
Begley, M., Coghlan, S. M. Jr., and Zydlewski, J. (2018). Modeling white sucker (Catostomus commersonii) populations to assess commercial harvest influence on age structure. J. Freshw. Ecol. 33, 413–428. doi: 10.1080/02705060.2018.1496951
Bessert, M. L., and Orti, G. (2008). Genetic effects of habitat fragmentation on blue sucker populations in the upper Missouri River (Cycleptus elongatus Lesueur, 1918). Conserv. Genet. 9, 821–832. doi: 10.1007/s10592-007-9401-4
Bettinger, J. M., and Crane, J. S. (2011). Validation of annulus formation in otoliths of Notchlip redhorse (Moxostoma collapsum) and brassy Jumprock (Moxostoma sp.) in Broad River, South Carolina, with observations on their growth and mortality. Southeast. Nat. 10, 443–458. doi: 10.1656/058.010.0305
Biggins, R. G. (1987). Endangered and threatened wildlife and plants; determination of threatened status for the blackside dace. Fed. Regist. 52, 22580–22584.
Biggins, R. G. (1988). Endangered and threatened wildlife and plants; determination of threatened status for the boulder darter. Fed. Regist. 53, 33996–33998.
Bonn, A. A. S. L., Rodrigues, A. S. L., and Gaston, K. J. (2002). Threatened and endemic species: are they good indicators of patterns of biodiversity on a national scale? Ecol. Lett. 5, 733–741. doi: 10.1046/j.1461-0248.2002.00376.x
Caldwell, K. L., Carter, T. C., and Doll, J. C. (2019). A comparison of bat activity in a managed central hardwood forest. Am. Midl. Nat. 181, 225–244. doi: 10.1674/0003-0031-181.2.225
Cooke, S. J., Bunt, C. M., Hamilton, S. J., Jennings, C. A., Pearson, M. P., Cooperman, M. S., et al. (2005). Threats, conservation strategies, and prognosis for suckers (Catostomidae) in North America: insights from regional case studies of a diverse family of non-game fishes. Biol. Conserv. 121, 317–331. doi: 10.1016/j.biocon.2004.05.015
Corkrey, R., Brooks, S., Lusseau, D., Parsons, K., Durban, J. W., Hammond, P. S., et al. (2008). A Bayesian capture-recapture population model with simultaneous estimation of heterogeneity. J. Am. Stat. Assoc. 103, 948–960. doi: 10.1198/016214507000001256
Cormack, R. M. (1964). Estimates of survival from the sighting of marked animals. Biometrika 51, 429–438. doi: 10.1093/biomet/51.3-4.429
Crivelli, J. A. (1995). Are fish introductions a threat to endemic freshwater fishes in the northern Mediterranean region? Biol. Conserv. 72, 311–319. doi: 10.1016/0006-3207(94)00092-5
Dail, D., and Madsen, L. (2011). Models for estimating abundance from repeated counts of an open metapopulation. Biometrics 67, 577–587. doi: 10.1111/j.1541-0420.2010.01465.x
Dextrase, A. J., Mandrak, N. E., and Schaefer, J. A. (2014). Modelling occupancy of an imperiled stream fish at multiple scales while accounting for imperfect detection: implications for conservation. Freshw. Biol. 59, 1799–1815. doi: 10.1111/fwb.12384
Dirnböck, T., Essl, F., and Rabitsch, W. (2010). Disproportional risk for habitat loss of high-altitude endemic species under climate change. Glob. Chang. Biol. 17, 990–996. doi: 10.1111/j.1365-2486.2010.02266.x
Doll, J. C., Etchison, L., and Owensby, D. (2020). Population estimation of the state and federally threatened Spotfin chub Erimonax monochus. N. Am. J. Fish Manag. 40, 342–353. doi: 10.1002/nafm.10414
Doll, J. C., and Jacquemin, S. J. (2018). An introduction to Bayesian modeling and inference for fisheries scientists. Fish. Mag. 43, 152–161. doi: 10.1002/fsh.10038
Doll, J. C., Wood, C. J., Goodfred, D. W., and Rash, J. (2021). Incorporating batch mark-recapture data into an integrated population model of Brown trout Salmo trutta. N. Am. J. Fish Manag. 41, 1390–1407. doi: 10.1002/nafm.10650
Elkins, D., Sweat, S. C., Kuhajda, B. R., George, A. L., Hill, K. S., and Wenger, S. J. (2019). Illuminating hotspots of imperiled aquatic biodiversity in the southeastern US. Glob. Ecol. Conserv. 19:e00654. doi: 10.1016/j.gecco.2019.e00654
Favrot, S.D. (2009). Sicklefin redhorse reproductive and habitat ecology in the upper Hiwassee River basin of the southern Appalachian Mountains. MS Thesis. Raleigh, NC: North Carolina State University, Raleigh, NC.
Favrot, S. D., and Kwak, T. J. (2018). Behavior and reproductive ecology of the Sicklefin redhorse: an imperiled southern Appalachian Mountain fish. Trans. Am. Fish. Soc. 147, 204–222. doi: 10.1002/tafs.10010
Gelman, A., Jakulin, A., Pittau, M. G., and Su, Y. S. (2008). A weakly informative default prior distribution for logistic and other regression models. Ann. Appl. Stat. 2, 1360–1383. doi: 10.1214/08-AOAS191
Grabowski, T. B., Ferguson, T. D., Peterson, J. T., and Jennings, C. A. (2009). Capture probability and behavioral response of the robust redhorse, a cryptic riverine fish, to electrofishing. N. Am. J. Fish Manag. 29, 721–729. doi: 10.1577/M08-060.1
Grabowski, T. B., and Isely, J. J. (2006). Seasonal and diel movements and habitat use of robust redhorses in the lower Savannah River, Georgia and South Carolina. Trans. Am. Fish. Soc. 135, 1145–1155. doi: 10.1577/T05-230.1
Grabowski, T. B., Ratterman, N. L., and Isely, J. J. (2007). Demographics of the spawning aggregations of four catastomid species in the Savannah River, South Carolina and Georgia, USA. Ecol. Freshw. Fish 17, 318–327. doi: 10.1111/j.1600-0633.2007.00284.x
Gwinn, D. C., Bacheler, N. M., and Shertzer, K. W. (2019). Integrating underwater video into traditional fisheries indices using a hierarchical formulation of a state-space model. Fish. Res. 219:105309. doi: 10.1016/j.fishres.2019.105309
Gwinn, D. C., Beesley, L. S., Close, P., Gawne, B., and Davies, P. M. (2016). Imperfect detection and the determination of environmental flows for fish: challenges, implications and solutions. Freshw. Biol. 61, 172–180. doi: 10.1111/fwb.12684
Habel, J. C., Rasche, L., Schneider, U. A., Engler, J. O., Schmid, E., Rödder, D., et al. (2018). Final countdown for biodiversity hotspots. Conserv. Lett. 12:e12668. doi: 10.1111/conl.12668
Hedger, R. D., Diserud, O. H., Sandlund, O. T., Saksagard, L., Ugedal, O., and Bremset, G. (2018). Bias in estimates of electrofishing capture probability of juvenile Atlantic salmon. Fish. Res. 208, 286–295. doi: 10.1016/j.fishres.2018.08.005
Hense, Z., Martin, R. W., and Petty, J. T. (2010). Electrofishing capture efficiencies for common stream fish species to support watershed-scale studies in the Central Appalachians. N. Am. J. Fish Manag. 30, 1041–1050. doi: 10.1577/M09-029.1
Hobbs, J. P. A., Jones, G. P., and Munday, P. I. (2011). Extinction risk in endemic marine fishes. Conserv. Biol. 25, 1053–1055. doi: 10.1111/j.1523-1739.2011.01698.x
Hostetler, J. A., and Chandler, R. B. (2015). Improved state-space models for inference about spatial and temporal variation in abundance from count data. Ecology 96, 1713–1723. doi: 10.1890/14-1487.1
Hoyle, S. D., and Maunder, M. N. (2004). A Bayesian integrated population dynamics model to analyze data for protected species. Anim. Biodivers. Conserv. 27, 247–266.
Ivasauskas, T.J. (2017). Early life history of suckers (Catostomidae) in a southern Appalachian River system. Dissertation. Raleigh, NC: North Carolina State University.
Jarvis, A. M., and Robertson, A. (1999). Predicting population sizes and priority conservation areas of 10 endemic Namibian bird species. Biol. Conserv. 88, 121–131. doi: 10.1016/S0006-3207(98)00060-3
Jenkins, R. E. (1999). “Sicklefin redhorse Moxostoma sp., undescribed species of sucker (Pisces, Catostomidae) in the upper Tennessee River drainage, North Carolina and Georgia – description, aspects of biology, habitat, distribution, and population status.” in Report to the U.S. Department of interior, fish and wildlife service, Asheville, North Carolina, and the North Carolina wildlife resources commission, Raleigh, North Carolina.
Jenkins, R. E. (2005). “Sicklefin redhorse Moxostoma sp. 2005 update. Report to the U.S.” in Department of Interior, fish and wildlife services, Asheville, North Carolina, and the North Carolina wildlife resources commission, Raleigh, North Carolina.
Jennings, C. A., Dilts, E. W., Shelton, J. L. Jr., and Peterson, R. C. (2010). Fine sediment affects on survival to emergence of robust redhorse. Environ. Biol. Fish 87, 43–53. doi: 10.1007/s10641-009-9561-9
Jolly, G. M. (1965). Explicit estimates from capture-recapture data with both death and immigration-stochastic model. Biometrika 52, 225–247. doi: 10.2307/2333826
Jonsen, I. (2016). Joint estimation over multiple individuals improves behavioral state inference from animal movement data. Sci. Rep. 6:20625. doi: 10.1038/srep20625
Judge, S. W., Warren, C. C., Camp, R. J., Berthold, L. K., Mounce, H. L., Hart, P. J., et al. (2021). Population estimates and trends of three Maui Island-endemic Hawaiian honeycreepers. J. Field Ornithol. 92, 115–126. doi: 10.1111/jofo.12364
Kellner, K. F., and Swihart, R. K. (2014). Accounting for imperfect detection in ecology: a quantitative review. PLoS One 9:e111436. doi: 10.1371/journal.pone.0111436
Kéry, M., and Royle, J.A.. (2016). Applied hierarchical modeling in ecology: analysis of distribution, abundance and species richness in R and BUGS, Elsevier, Academic Press. London, United Kingdom.
Korman, J., Yard, M., Walters, C., and Coggins, L. G. (2009). Effects of fish size, habitat, flow, and density on capture probabilities of age-0 rainbow trout estimated from electrofishing at discrete sites in a large river. Trans. Am. Fish. Soc. 138, 58–75. doi: 10.1577/T08-025.1
Kumar, R., Cadigan, N. G., Zheng, N., Varkey, D. A., and Morgan, M. J. (2020). A state-space spatial survey-based stock assessment (SSURBA) model to inform spatial variation in relative stock trends. Can. J. Fish. Aquat. Sci. 77, 1638–1658. doi: 10.1139/cjfas-2019-0427
Labonne, J., and Gaudin, P. (2005). Exploring population dynamics patterns in a rare fish, Zingel asper, through capture-mark-recapture methods. Conserv. Biol. 19, 463–472. doi: 10.1111/j.1523-1739.2005.00013.x
Lebreton, J. D., Burnham, K. P., Clobert, J., and Anderson, D. R. (1992). Modeling survival and testing biological hypothese using marked animals – a unified approach with case studies. Ecol. Monogr. 62, 67–118. doi: 10.2307/2937171
Letcher, B. H., Schueller, P., Bassar, R. D., Nislow, K. H., Coombs, J. A., Sakrejda, K., et al. (2015). Robust estimates of environmental effects on population vital rates: an integrated capture-recapture model of seasonal brook trout growth, survival and movement in a stream network. J. Anim. Ecol. 84, 337–352. doi: 10.1111/1365-2656.12308
Loarie, S. R., Carter, B. E., Hayhoe, K., McMahon, S., Moe, R., Knight, C. A., et al. (2008). Climate change and the future of California’s endemic flora. PLoS One 3:e2502. doi: 10.1371/journal.pone.0002502
Loyola, R. D., Kubota, U., and Lewinsohn, T. M. (2007). Endemic vertebrates are the most effective surrogates for identifying conservation priorities among Brazilian ecoregions. Divers. Distrib. 13, 389–396. doi: 10.1111/j.1472-4642.2007.00345.x
Lyon, J. P., Bird, T., Nicol, S., Kearns, J., O’Mahony, J., Todd, C. R., et al. (2014). Efficiency of electrofishing in turbid lowland rivers: implications for measuring temporal change in fish populations. Can. J. Fish. Aquat. Sci. 71, 878–886. doi: 10.1139/cjfas-2013-0287
Mayani-Parás, F., Botello, F., Castañeda, S., Munguía-Carrara, M., and Sánchez-Cordero, V. (2021). Cumulative habitat loss increases conservation threats on endemic species of terrestrial vertebrates in Mexico. Biol. Conserv. 253:108864. doi: 10.1016/j.biocon.2020.108864
McManamay, R. A., Orth, D. J., and Jager, H. I. (2014). Accounting for variation in species detection in fish community monitoring. Fish. Manag. Ecol. 21, 96–112. doi: 10.1111/fme.12056
Monk, J. (2013). How long should we ignore imperfect detection of species in the marine environment when modelling their distribution? Fish Fish. 15, 352–358. doi: 10.1111/faf.12039
Munkittrick, K. R., Portt, C. B., Van Der Kraak, G. J., Smith, I. R., and Rokosh, D. A. (1991). Impact of bleached Kraft mil effluent on population characteristics, liver MFO activity, and serum steroid levels of a Lake Superior white sucker (Catostomus commersoni) population. Can. J. Fish. Aquat. Sci. 48, 1371–1380. doi: 10.1139/f91-164
Myers, M. (1988). Threatened biotas: “hot spots” in tropical forests. Environmentalist 8, 187–208. doi: 10.1007/BF02240252
Pace, R. M. III, Corkeron, P. J., and Kraus, S. D. (2017). State-space mark-recapture estimates reveal a recent decline in abundance of North Atlantic right whales. Ecol. Evol. 7, 8730–8741. doi: 10.1002/ece3.3406
Patterson, T. A., Thomas, L., Wilcox, C., Ovaskainen, O., and Matthiopoulos, J. (2008). State-space models of individual animal movement. Trends Ecol. Evol. 23, 87–94. doi: 10.1016/j.tree.2007.10.009
Peterson, R. C., Jennings, C. A., and Peterson, J. T. (2013). Relationship between river discharge and abundance of age 0 redhorse (Moxostoma spp.) in the Oconee River, Georgia, USA. With implications for robust redhorse. River Res. Appl. 29, 734–742. doi: 10.1002/rra.2566
Pfaller, J. B., Bjorndal, K. A., Chaloupka, M., Williams, K. L., Frick, M. G., and Bolten, A. B. (2013). Accounting for imperfect detection in critical for inferring marine turtle nesting population trends. PLoS One 8:e62326. doi: 10.1371/journal.pone.0062326
Pollock, K. H., Hines, J. E., and Nichols, J. D. (1984). The use of auxiliary variables in capture-recapture and removal experiments. Biometrics 40, 329–340. doi: 10.2307/2531386
Pouteau, T., Brunel, C., Dawson, W., Essl, F., Kreft, H., Lenzner, B., et al. (2020). Environmental and socioeconomic correlates of extinction risk in endemic species. Divers. Distrib. 28, 53–64. doi: 10.1111/ddi.13438
R Core Team . (2022). R: a language and environment for statistical computing. R Foundation for Statistical Computing, Vienna, Austria.
Robinson, O. J., Ruiz-Gutierrez, V., Fink, D., Meese, R. J., Holyoak, M., and Cooch, E. G. (2018). Using citizen science data in integrated population models to inform conservation. Biol. Conserv. 227, 361–368. doi: 10.1016/j.biocon.2018.10.002
Royle, J. A. (2004). Generalized estimators of avian abundance from count survey data. Anim. Biodivers. Conserv. 27, 375–386.
Royle, JA, and Dorazio, RM. (2008). Hierarchical modeling and inference in ecology: the analysis of data from populations, Metapopulations and Communities, San Diego, CA. Academic Press.
Saunders, S. P., Cuthbert, F. J., and Zipkin, E. F. (2018). Evaluating population viability and efficacy of conservation management using integrated population models. J. Appl. Ecol. 55, 1380–1392. doi: 10.1111/1365-2664.13080
Schmetterling, D. A., and McFee, J. A. (2006). Migrations by fluvial largescale suckers (Catostomus macrocheilus) after transport upstream of Milltown dam, Montana. Northw. Sci. 80, 18–25.
Schofield, M.R. (2007). Hierarchical capture-recapture models. PhD thesis. Dunedin: Department of Statistics, University of Otago.
Schooley, J. D., and Marsh, P. C. (2007). Stocking of endangered razorback suckers in the lower Colorado River basin over three decades: 1974-2004. N. Am. J. Fish Manag. 27, 43–51. doi: 10.1577/M05-088.1
Scoppettone, G. G., Rissler, P. H., Fabes, M. C., and Shea, S. P. (2015). Population dynamics of the cui-ui of pyramid Lake, Nevada: a potamodromous Catostomid subject to failed reproduction. N. Am. J. Fish Manag. 35, 853–864. doi: 10.1080/02755947.2015.1057350
Seber, G. A. F. (1965). A note on the multiple-recapture census. Biometrika 52, 249–260. doi: 10.1093/biomet/52.1-2.249
Smith, W. E., and Kwak, T. J. (2014). A capture-recapture model of amphidromous fish dispersal. J. Fish Biol. 84, 897–912. doi: 10.1111/jfb.12316
Stan Development Team (2022a). Stan modeling language users guide and reference manual, version 2.30. Available at: http://mc-stan.org.
Stan Development Team (2022b). RStan: the R interface to Stan. R package version 2.26.13. Available at: http://mc-stan.org.
Stowe, K.A. (2014). Movement patterns and habitat use by juvenile and adult Sicklefin redhorse (Moxostoma sp.) in the Tuckasegee River basin. MS Thesis. Cullowhee, NC: Western Carolina University.
Stuart, C. E., Doll, J. C., Forsythe, P. S., and Feiner, Z. F. (2022). Estimating population size and survival of adult northern pike (Esox lucius) in lower Green Bay. Fish. Manag. Ecol. 29, 298–309. doi: 10.1111/fme.12534
Thompson, A. R., Baskin, J. N., Swift, C. C., Haglund, T. R., and Nagel, R. J. (2010). Influence of habitat dynamics on the distribution and abundance of the federally threatened Santa Ana sucker, Catostomus santaanae, in the Santa Ana River. Environ. Biol. Fish 87, 321–332. doi: 10.1007/s10641-010-9604-2
Thuiller, W., Midgley, G. F., Hughes, G. O., Bomhard, B., Drew, G., Rutherford, M. C., et al. (2006). Endemic species and ecosystem sensitivity to climate change in Namibia. Glob. Chang. Biol. 12, 759–776. doi: 10.1111/j.1365-2486.2006.01140.x
Tyus, H. M., and Saunders, J. F. III (2000). Nonnative fish control and endangered fish recovery: lessons from the Colorado River. Fisheries 25, 17–24. doi: 10.1577/1548-8446(2000)025<0017:NFCAEF>2.0.CO;2
U.S. Environmental Protection Agency (US EPA) (2020). Watershed index Online. Available at: http://www.epa.gov /wsio/
U.S. Fish and Wildlife Service (2015). Candidate conservation agreement for the Sicklefin redhorse (Moxostoma sp.). Asheville, NC: U.S. Fish and Wildlife Service. 40.
Upton, G. (2020). Measuring abundance; methods for the estimation of population size and species richness (data in the wild). Pelagic Publishing. Exeter, United Kingdom.
Walsh, J. C., Venter, O., Watson, J. E. M., Fuller, R. A., Blackburn, T. M., and Possingham, H. P. (2012). Exotic species richness and native species endemism increase the impact of exotic species on islands. Glob. Ecol. Biogeogr. 21, 841–850. doi: 10.1111/j.1466-8238.2011.00724.x
Keywords: population estimate, endemic, Bayesian, capture probability, discharge
Citation: Doll JC, Etchison L and Owensby D (2023) State-space models to describe survival of an endemic species in the Little Tennessee River basin. Front. Ecol. Evol. 11:1097389. doi: 10.3389/fevo.2023.1097389
Edited by:
Shovonlal Roy, University of Reading, United KingdomReviewed by:
Dana Weigel, University of Idaho, United StatesCopyright © 2023 Doll, Etchison and Owensby. This is an open-access article distributed under the terms of the Creative Commons Attribution License (CC BY). The use, distribution or reproduction in other forums is permitted, provided the original author(s) and the copyright owner(s) are credited and that the original publication in this journal is cited, in accordance with accepted academic practice. No use, distribution or reproduction is permitted which does not comply with these terms.
*Correspondence: Jason C. Doll, amFzb24uZG9sbEBmbWFyaW9uLmVkdQ==
Disclaimer: All claims expressed in this article are solely those of the authors and do not necessarily represent those of their affiliated organizations, or those of the publisher, the editors and the reviewers. Any product that may be evaluated in this article or claim that may be made by its manufacturer is not guaranteed or endorsed by the publisher.
Research integrity at Frontiers
Learn more about the work of our research integrity team to safeguard the quality of each article we publish.