 Zhuo Liu1,2†
 Mingjie Shi1,2,3†Hongqi Wu1,2*Pingan Jiang1,2*Haoyu Zhang4
 Panxing He5Kai Zheng1,2Tong Dong6Yue Zhang1,2
- 1College of Resources and Environment, Xinjiang Agricultural University, Ürümqi, China
- 2Xinjiang Key Laboratory of Soil and Plant Ecological Processes, Xinjiang Agricultural University, Ürümqi, China
- 3Key Laboratory of Land Surface Pattern and Simulation, Institute of Geographic Sciences and Natural Resources Research, Chinese Academy of Sciences, Beijing, China
- 4College of Geography and Remote Sensing Sciences, Xinjiang University, Ürümqi, China
- 5Henan Normal University, Xinxiang, China
- 6Key Laboratory of Coastal Science and Integrated Management, First Institute of Oceanography, Ministry of Natural Resources, Qingdao, Shandong, China
Drylands in northwest China have limited water resources, which negatively impacts economic development, ecological security, and the United Nations Sustainable Development Goals. However, few studies have examined water supply and demand under multiple future spatial patterns of land use, particularly under sustainable development scenarios. Further research is therefore needed to determine how affect water output services under various land use patterns. We used the GMOP-PLUS (Gray Multi-objective Optimization-Patch-generating Land Use Simulation) and the InVEST (Integrated Valuation of Ecosystem Services and Tradeoffs) models to investigate future land use programs and the current and future trends in water yield services supply and demand in the typical dryland region of Xinjiang, China. The GMOP-PLUS model was used to project the spatial patterns of land use/land cover (LULC) change in Xinjiang in 2025 and 2030 under programs of business-as-usual, rapid economic development, ecological land protection and sustainable development. We then used the InVEST model to project the spatiotemporal evolution of water yield services supply and demand under the four different scenarios. Our results show that Our results show that water production in Xinjiang decreases to 911.30 × 10⁸ m3 in 2020–2030 under the business-as-usual scenario, with an expansion in arable land and a reduction in forested land being the main causes of this decrease. The decline in water production under the ecological land protection scenario is 913.88 × 10⁸ m3. The retention effect of vegetation slows the decline in water production, but the ecological land protection scenario is not effective in controlling the reduction in arable land. The rapid economic development scenario produces a significant increase in water yield of 915.09 × 10⁸ m3, mainly due to an increase in the area of impervious surfaces caused by the expansion of built-up land; however, the rapid economic development scenario leads to a decreasing trend in ecological land. The sustainable development scenario produces 914.15 × 10⁸ m3 of water. The sustainable development scenario increases water production while balancing the development of Constructed and the protection of ecological land, and the arable land also shows a slow growth trend. Between 2025 and 2030, the water security index fluctuates between –0.0225 and –0.0400, with a continued future deficit in water supply and demand in Xinjiang and a high degree of spatial heterogeneity. Programs for advancing sustainable development narrow the supply–demand gap for services that produce water.
1. Introduction
The use of water resources has increased with the rapid socioeconomic development seen in recent years and water scarcity is now a global problem (Vorosmarty et al., 2000; Tang et al., 2018). Water scarcity is a key constraint in socioeconomic development, affecting ecological security, and hindering the sustainable development agenda and regional agricultural development. Industrialization, urbanization, and the continuous and widespread activities of humans seriously affect water production and other ecosystem services (Wang Y. et al., 2022). Water resources in China’s Xinjiang are mainly derived from alpine environments (Jasper et al., 2004). However, the supply of water from alpine rivers is severely affected by the combined effects of human activities and climate change (Bradley et al., 2006). It is expected that future conflicts arising from water scarcity and the uneven spatial and temporal distribution of water resources will make their distribution and management increasingly difficult (Luo et al., 2019). To meet the water resource needs of the 14th 5 years Plan, we need to combine multi-year data on temperature, precipitation, and land use to reveal the changing patterns in the supply of water resources (Cortinovis and Geneletti, 2020). The timely assessment of the water yield of terrestrial ecosystems is an important issue in current research (Liu et al., 2022).
Land use, one of the most dominant ways in which humans transform nature (Shi et al., 2023), has a dramatic impact on water yields in an ecosystem (Zheng et al., 2014). A single land use type cannot meet the needs of social development, so competition between land use types drives changes in land use. The study of planned land development under different scenarios helps to achieve the goal of sustainable regional development (Jin et al., 2019). Land use/land cover (LULC) affects the water production services of terrestrial ecosystems by changing the actual evapotranspiration through alteration of the Earth’s surface features (Lang et al., 2017). Previous studies of water output in the upper sections of the Black River Basin have shown that the physical characteristics of soils and the land cover alter gradually as the hydrothermal conditions change (Fuping et al., 2018). These changes, in turn, affect evapotranspiration and water yield by changing the surface roughness and the soil environment at the surface (Fuping et al., 2018). A study of water yield from ecosystem services in the Sanjiangyuan region found that changes in LULC led to changes in the surface albedo, the local circulation of water vapor, and surface runoff, which, in turn, affected the regional climate and thus the water yield (Tao et al., 2013). A study of water yield and the influence of environmental factors in the Aksu River Basin showed that increased vegetation cover effectively contributes to increased water yield and that changes in water yield are related to the direction of land use changes (Guo et al., 2020). Previous studies have shown that the impact of changes in land use on ecosystem water yields depends mainly on the type of ecosystem and the direction of land use transfer, providing a guide to optimizing land use structure with the goal of balancing water supply and demand. However, few studies have explored changes in LULC scenarios and their ecosystem water yield in the context of regional sustainable development scenarios at spatial and temporal scales (Zhu et al., 2019). The China Sustainable Development Water Resources Strategy Report clearly states that China’s water resources will face serious challenges in the next two decades.
Many studies have modeled future trends in water resources. For example, in the Upper Mississippi River Basin, the Soil and Water Assessment Tool (SWAT) hydrological model has been used to determine the impact of climate change on hydrological ecosystems (Jha et al., 2006). However, the SWAT model does not allow for multi-scale simulations, the accuracy of the weather generator data is low, the model relies on monitoring data, and the results are not spatially visualized. A systems dynamics model was used in one study to project supply and demand mechanisms to evaluate the present and potential vulnerability of water in the Bayinguole region. The results indicated that water supply and demand could be mitigated by reducing the demand for irrigation water by 20% per hectare and increasing the total water supply by 5% (Wu et al., 2013). However, the study did not set up different scenarios for analysis and therefore the future trends are uncertain and need to be explored in a different geographical context.
Previous studies have used statistical and economic regression models to examine and project Beijing’s industrial water demand and supply. The results suggested that industries in Beijing will face severe water shortages in the future (Wei et al., 2010). The use of the FLUS model in the Beijing-Tianjin-Hebei urban agglomeration to simulate and forecast the spatial distribution pattern of land use in 2045 under multiple scenarios, with a subdivision of built-up land simulated, is rarely seen in the past. The InVEST model was then used to predict and quantify future ecosystem services such as habitat quality and water production in the region, and a hierarchical analysis was constructed to compare the overall levels of multiple ecosystem services under different scenarios and to explore the impact of land use change on ecosystem services (Ry et al., 2023). However, most of the previous studies were based on a single ecological model and most of the studies sought to maximize either the ecological or economic benefits. There is a lack of studies coupling land use with multiple ecological models and multiple scenarios, and few assessments of water supply and demand under sustainable development scenarios (Wu et al., 2022).
To cover these research gaps, we assessed the water production of terrestrial ecosystems in Xinjiang under several land use situations for 2025 and 2030 using the GMOP-PLUS model in conjunction with the InVEST model and analyzed the balance of supply and demand. A variety of future land use scenarios in Xinjiang need to be considered to clarify the pattern of water yield services supply and demand and to coordinate and resolve inter-regional conflicts over water use.
The main objectives of this study were: (1) to plan four different land use development scenarios applicable to Xinjiang; (2) to value and map the supply and demand for water yield services under these four development scenarios by 2025 and 2030; and (3) assess and analyze Xinjiang’s water supply and demand balance under these four land use scenarios in 2025 and 2030.
2. Materials and methods
2.1. Study area
The Xinjiang region is located in northwest China (73° 40′–96° 18′ E, 34° 25′–48° 10′ N) and has a total area of roughly 1.66 × 10⁶ km2 (Figure 1). The climate is typically temperate continental. The annual amount of sunshine is 2,500–3,500 h. This arid inland region has a dry climate and scarce water resources. Xinjiang as a whole is rich in water resources, but the total amount of water resources is small (Luo et al., 2019). With recent economic developments and the promotion of the Belt and Road Initiative, Xinjiang has become increasingly prominent in the national regional synergy strategy due to its position as an significance node on the overland Silk Road. Water scarcity and other reasons have led to an increasingly fragile ecological environment in Xinjiang, which can also have a negative impact on regional economic development. Faced with the current problems of the incongruous relationship between people and water in Xinjiang and the outstanding contradiction between supply and demand of water resources, in-depth studies are needed.
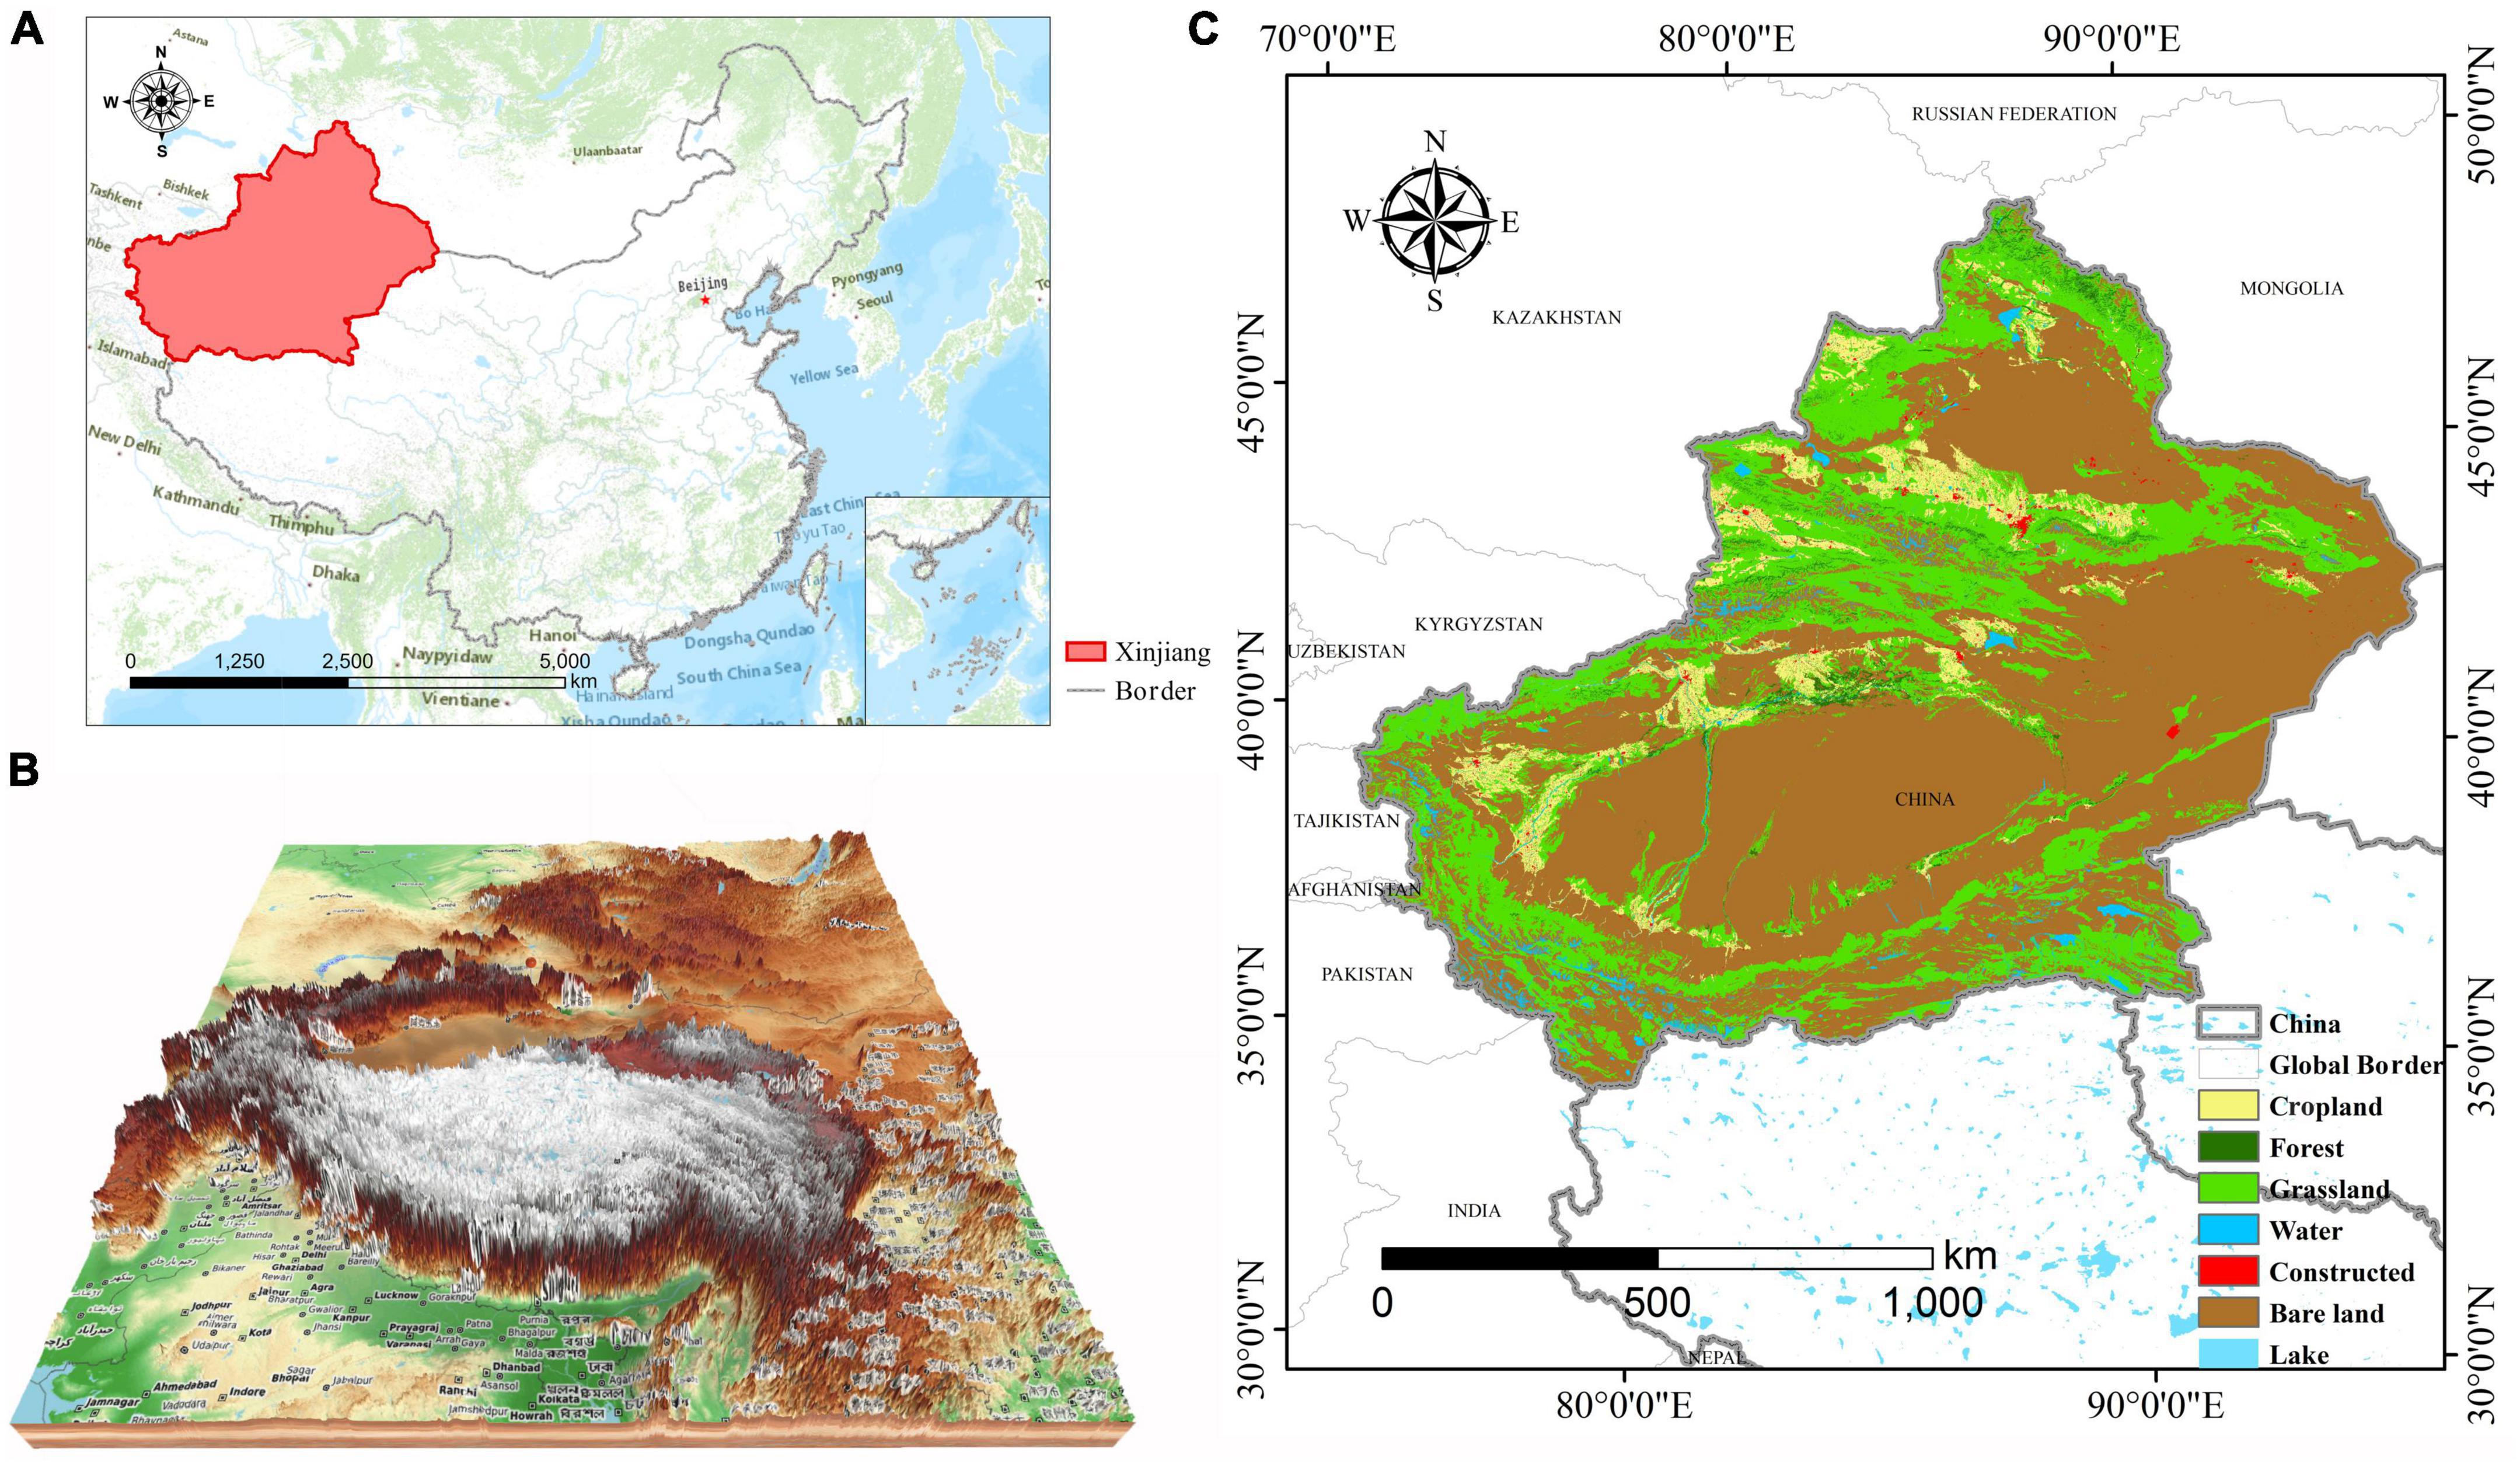
Figure 1. (A) Location of the research region in China, (B) terrain heights and (C) land use.
2.2. Data sources and processing
The Data Center for Resource and Environmental Sciences of the Chinese Academy of Sciences (RESDC)1 provided the basic geographical data, including the administrative divisions and water systems. The LULC data at 30 m resolution for five time periods (2000, 2005, 2010, 2015, and 2020) were also obtained from the RESDC. To enhance the display of the role of different LULC types on water yield services and to highlight the differences in impact, six land use types were classified according to the China Land Use Category 1 classification system: cropland; forest; grassland; water; constructed; and bare land (Liang et al., 2021).
The raster of soil types was derived from the Food and Agriculture Organization of the United Nations.2 The absolute soil depth (i.e., surface to rock depth) and the available moisture content of vegetation were obtained from the World Harmony Soil Database, a scientific data center for cold and dry regions.3 The slope data were retrieved from the digital elevation model available from the Geospatial Data Cloud.4
The meteorological data included the annual average temperature, precipitation, and potential evapotranspiration, with the temperature and precipitation data obtained from the RESDC (see text footnote 1) and the potential evapotranspiration data are from the multi-year average potential evapotranspiration dataset (30 arc-seconds) published by Zomer et al. (2022).
The RESDC (see text footnote 1) provided us with socioeconomic data, including the spatial distribution of the population and the gross domestic product kilometer grid. The distance to rail, the distance to major roads, the distance to secondary roads, and the distance to water were determined using Open Street Map.5 Euclidean distance analysis is required after the data has been downloaded. The China Research Data Service6 provided night-time lighting data. The hydrological data included data on the total water resources, water supply, and water consumption from the Xinjiang Uygur Autonomous Region Water Resources Bulletin7 and the Xinjiang Statistical Yearbook. To ensure the robustness of the model and the consistent accuracy of the spatial data, by using the cropping and resampling tools in ArcGIS 10.7, we converted the model drivers and land use data into a uniform (250 m × 250 m) precision raster file.
2.3. GMOP-PLUS model
2.3.1. PLUS
The PLUS model is a new model built on the cellular automaton model of meta cellular automata (Hu et al., 2022). Existing cellular automata models typically struggle to predict patch-level changes in a variety of land use types in a spatially and temporally dynamic manner, making them of limited utility in determining the causes of changes in LULC (Yang J. et al., 2020). The PLUS model, which integrates the Land Expansion Analysis Strategy (LEAS) and the multi-class random patch-seeding-based cellular automaton model (CARS), overcomes the shortcomings of existing cellular automaton models in terms of both translational rule mining strategies and simulation strategies for landscape dynamics (Liang et al., 2021). Under the development probability constraint, this is paired with random seed generation and a threshold-reducing process to optimize the land use structure (Liang et al., 2021; Hu et al., 2022).
In the CARS module, the following parameters were set: the “Start Amounts” in the land requirements were calculated automatically by the model and the “Future Amounts” were filled in according to the Markov module in the model. The transfer matrix and domain weights were set according to the needs of the different land use scenarios, taking into account the results of previous studies (Shi et al., 2021; Wang J. et al., 2022).
2.3.2. GMOP-PLUS
The GMOP model is an optimization system derived from gray prediction theory and multi-objective linear programming (Ma et al., 2023). The optimum land use structure under the conditions set by the decision maker and the future development trend of the optimum land use structure can be obtained through gray multi-objective dynamic planning (Wang and Wang, 1997; Zhao et al., 2004). The GMOP model is practically applicable and can take into account ecological and environmental protection, socioeconomic developments, and comprehensive benefits; optimizing the LULC structure is an effective method to achieve rational allocation and sustainable land use (Zhang and Zhang, 2011). We used the GMOP model and LINGO 12.0 software to simulate the trends of LULC patterns for each LULC type in 2025 and 2030 under the sustainable development scenario and to construct an optimum spatial configuration of LULC that maximized the ecological and economic benefits (Yang et al., 2013).
2.3.3. Constructing the objective function
We established the functions in terms of both economic and ecological benefits—namely, maxEd(x), and maxEp(x).
The maximum economic efficiency objective function is:
where Ed(x) denotes the economic efficiency, xi denotes the variable land type i (i = 1, 2, …, 6), and di denotes the economic efficiency coefficient of that land type per unit area. di is calculated based on the total output value of agriculture, forestry, grassland, fisheries, and secondary and tertiary industries in the Xinjiang Statistical Yearbook and the land area of the Site type corresponding to the production of the output values.
The maximum coefficiency objective function is:
where Ep(x) denotes the ecoefficiencyxi denotes ground class variable i (i = 1, 2, …, 6), and pi denotes the ecoefficiency of this land class per unit area The coefficient of ecoefficiency refers to the research results of Xie et al. (2017).
Maximizing both the economic and ecological efficiency objective functions to obtain the optimum LULC structure under the sustainable development scenario gives:
2.3.4. Objective function constraints
The constraints on the marker function are based our previous research methods (Shi et al., 2022) that defined the total surface of the land and the land area of the six land use types.
2.3.5. Objective function solving
LINGO 12.0 was used to solve the objective function to obtain the land demands of the six LULC types, which is the LULC pattern in 2025 under sustainable development. By analogy, the constraints of the objective function can be set for the 2030 sustainable development scenario and solved to obtain the land use pattern for that scenario.
2.4. Research framework
Ecosystem water yield services—as an integrated ecological process based on temperature, precipitation, soil type, land use practices, and other factors—have an important role in ecosystem sustainability. We used the same representative multi-year average data (except for land use data) during the simulation of water yield.
The study was broadly divided into three steps. First, we collected and processed LULC data and data for various drivers to develop conversion rules for LULC in different contexts. Second, the PLUS model and a Markov chain were used to optimize the spatial pattern of future LULC and to plan four different land use development scenarios. The third part of the study involved simulating water yield under different land use scenarios using the InVEST model’s water yield module. A freshwater security index (FSI) was used to analyze and assess the supply and demand balance of the water production. Figure 2 shows the logic framework and flow chart for this study.

Figure 2. Evaluation framework and impact of changes in land use on water yield.
2.5. Scenario setting
Four scenarios were set up to project future LULC patterns using the methods of Shi et al. (2022): business-as-usual (BAU), which is similar to historical trends; rapid economic development (RED), where the expansion of constructed land is rapid; ecological land protection (ELP), where various ecological conservation projects are implemented; and a sustainable development (SD) programme with maximum economic and ecological benefits.
2.6. LULC accuracy verification
Comparison of simulated year data with actual year data. The accuracy test showed that the kappa coefficient for the projected 2015 LULC was 0.931, with an overall accuracy of 0.964. The kappa coefficient for the projected 2020 LULC was 0.905, with an overall accuracy of 0.949. The test results met the accuracy requirements (Huang et al., 2019).
2.7. Supply and demand for water production
2.7.1. Supply of water production
Water production services are extremely important in terrestrial ecosystems (Li et al., 2017). We used the InVEST model to evaluate water supply services in Xinjiang (Chaplin-Kramer et al., 2019). The model is based on the balance of precipitation and evapotranspiration and takes into account the effects of precipitation, surface evapotranspiration, plant transpiration, root depth, and soil depth for simulation (Sun and Shi, 2020). The calculation formula is as follows:
where Yx is the water yield of image element x; Px is the average annual precipitation; AETxj is the actual annual evapotranspiration of image element x; ωx is a parameter used to describe the soil properties and natural climate as a ratio of the annual plant water demand to precipitation; Rxj is the ratio of the potential evaporation to precipitation (the drying index); Z is the Zhang coefficient, a constant that characterizes the seasonality of precipitation and which varies from region to region; AWCx is the vegetation water content; kxj is the evapotranspiration coefficient of the vegetation; and ET0x is the potential evapotranspiration.
Given the interannual variation in precipitation, we used the arithmetic mean of the four periods of annual average precipitation data for 2000, 2005, 2010, and 2015 instead of the precipitation data for 2025 and 2030. A multi-year average evapotranspiration data set was used for the potential evapotranspiration data. We used the absolute soil depth. The plant available water content is the amount of water obtained from the soil by the plant root system and was calculated based on data from studies of the depth of the plant root system combined with literature research on the main types of vegetation in the study area.
2.7.2. Confidence arguments for results of water yield simulation
We assessed the confidence level of the modeling results in relation to the total water resources in the Xinjiang Water Resources Bulletin issued by the Xinjiang Water Resources Department to ensure that the modeling results were scientific and reasonable and to avoid unrealistic conclusions due to the low confidence level of the results. The Water Resources Bulletin showed that the total water resources in Xinjiang in 2015 were 917.60 × 10⁸ m3 and the simulated water production was 911.54 × 10⁸ m3 with an overall accuracy of 99.34%. These data are the best simulation results.
2.8. Demand for water production
In light of the definition of hydrological information in the Water Resources Bulletin and considering the characteristics of water use in Xinjiang, the water demand was divided into three parts: water for production; water for living; and water for ecology. The primary water demand in the production sector includes water for irrigation, fishpond replenishment, and livestock; the secondary water demand includes water for industry and construction; and the tertiary water demand is water for the service sector. The water requirements for the study area were calculated as:
where Di is the total water demand of Xinjiang in year i; Dproi is the production water demand of Xinjiang in year i; Dlifi is the domestic water demand of Xinjiang in year i; and Decoi is the ecological water demand of Xinjiang in year i.
We calculated the water use statistics for each sector in the Xinjiang region from the water consumption and water demand and expressed the results spatially according to the spatial distribution of LULC type to give a spatial discretization of the water demand for each sector. Irrigation water was mainly allocated to cropland, ecological water to forest and grassland, livestock water to grassland, and domestic and industrial water to constructed land.
2.9. Evaluation of the water yield services supply and demand balance
The FSI was used to evaluate the balance of water yield services supply and demand in the research region (Li et al., 2017). The FSI is calculated as:
where FSIi is the water security index of Xinjiang in year i; Si is the water production service supply of Xinjiang in year i; and Di is the water production service demand of Xinjiang in year i. If FSI > 0, then there is a surplus of water production service supply and demand in Xinjiang. If FSI ≤ 0, then there is a deficit of water yield service supply and demand in Xinjiang.
3. Results and analysis
3.1. LULC projection and analysis under multiple scenarios
The PLUS model was used to project the LULC data for Xinjiang in 2025 and 2030 based on four different programs (Tables 1, 2). The BAU program continues the historical changes for Xinjiang of a slow expansion of cropland and constructed land, with increases in area of 3.70 and 2.26%, respectively, in 2025 and 3.54 and 2.19%, respectively, in 2030 (Figure 3). According to the RED program, the area of constructed and cropland land will increase by 4.39 and 4.48%, respectively, in 2025, whereas the areas of forest and grassland decrease by 0.74 and 0.87%, respectively. The areas of cropland and constructed land in 2030 increase by 4.76 and 7.25%, respectively, whereas the areas of forest and grassland decrease by 1.48 and 2.30%, respectively (Figure 3). Under the ELP program, areas of grassland and forest increase by 2.01 and 1.25%, respectively, in 2025 and by 2.92 and 1.74%, respectively, in 2030 (Figure 3). In the sustainable development scenario, the trend is more balanced across the land types, with a slow expansion of arable land and forested grassland alongside the expansion of constructed land (Figure 3).
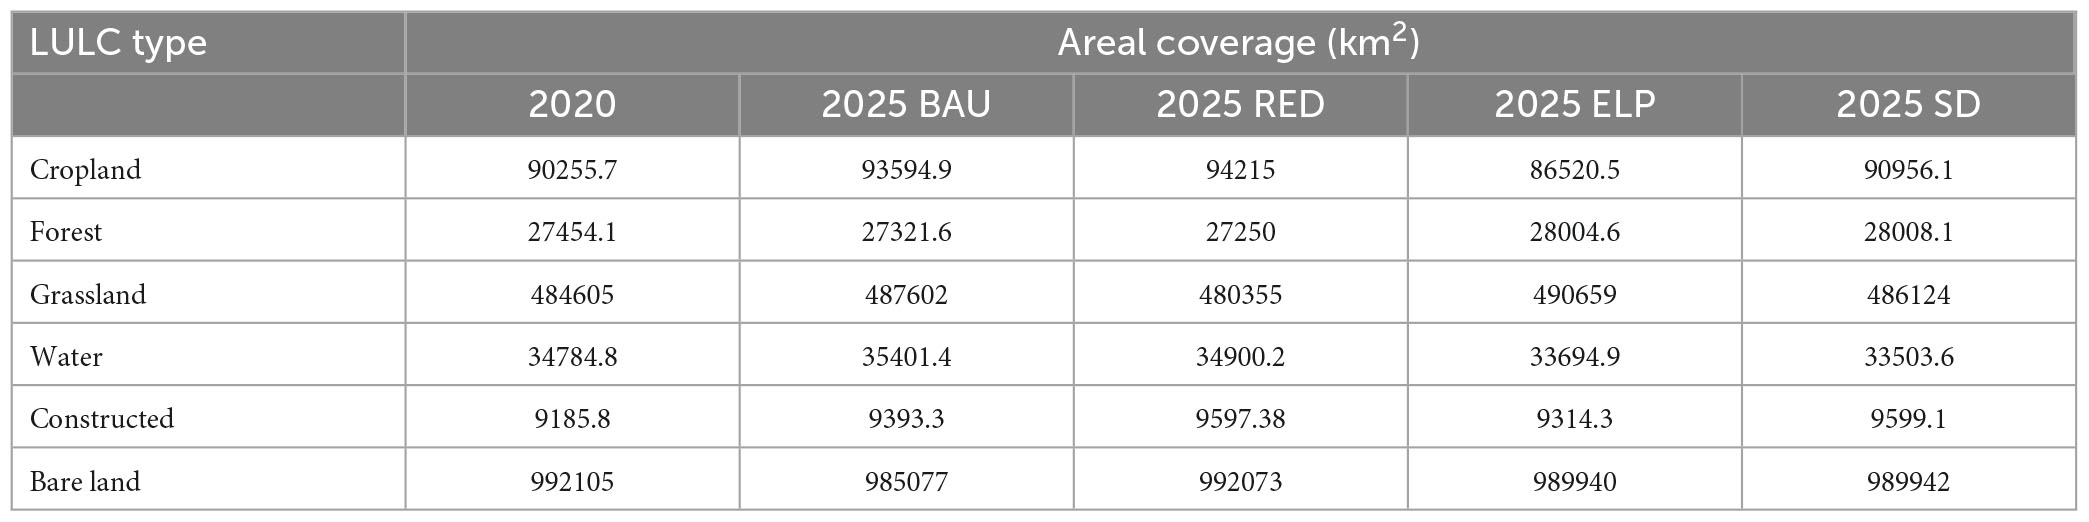
Table 1. Change in area for each land use/land cover (LULC) category in 2025 under each scenario.

Table 2. Change in area for each land use/land cover (LULC) category in 2030 under each scenario.
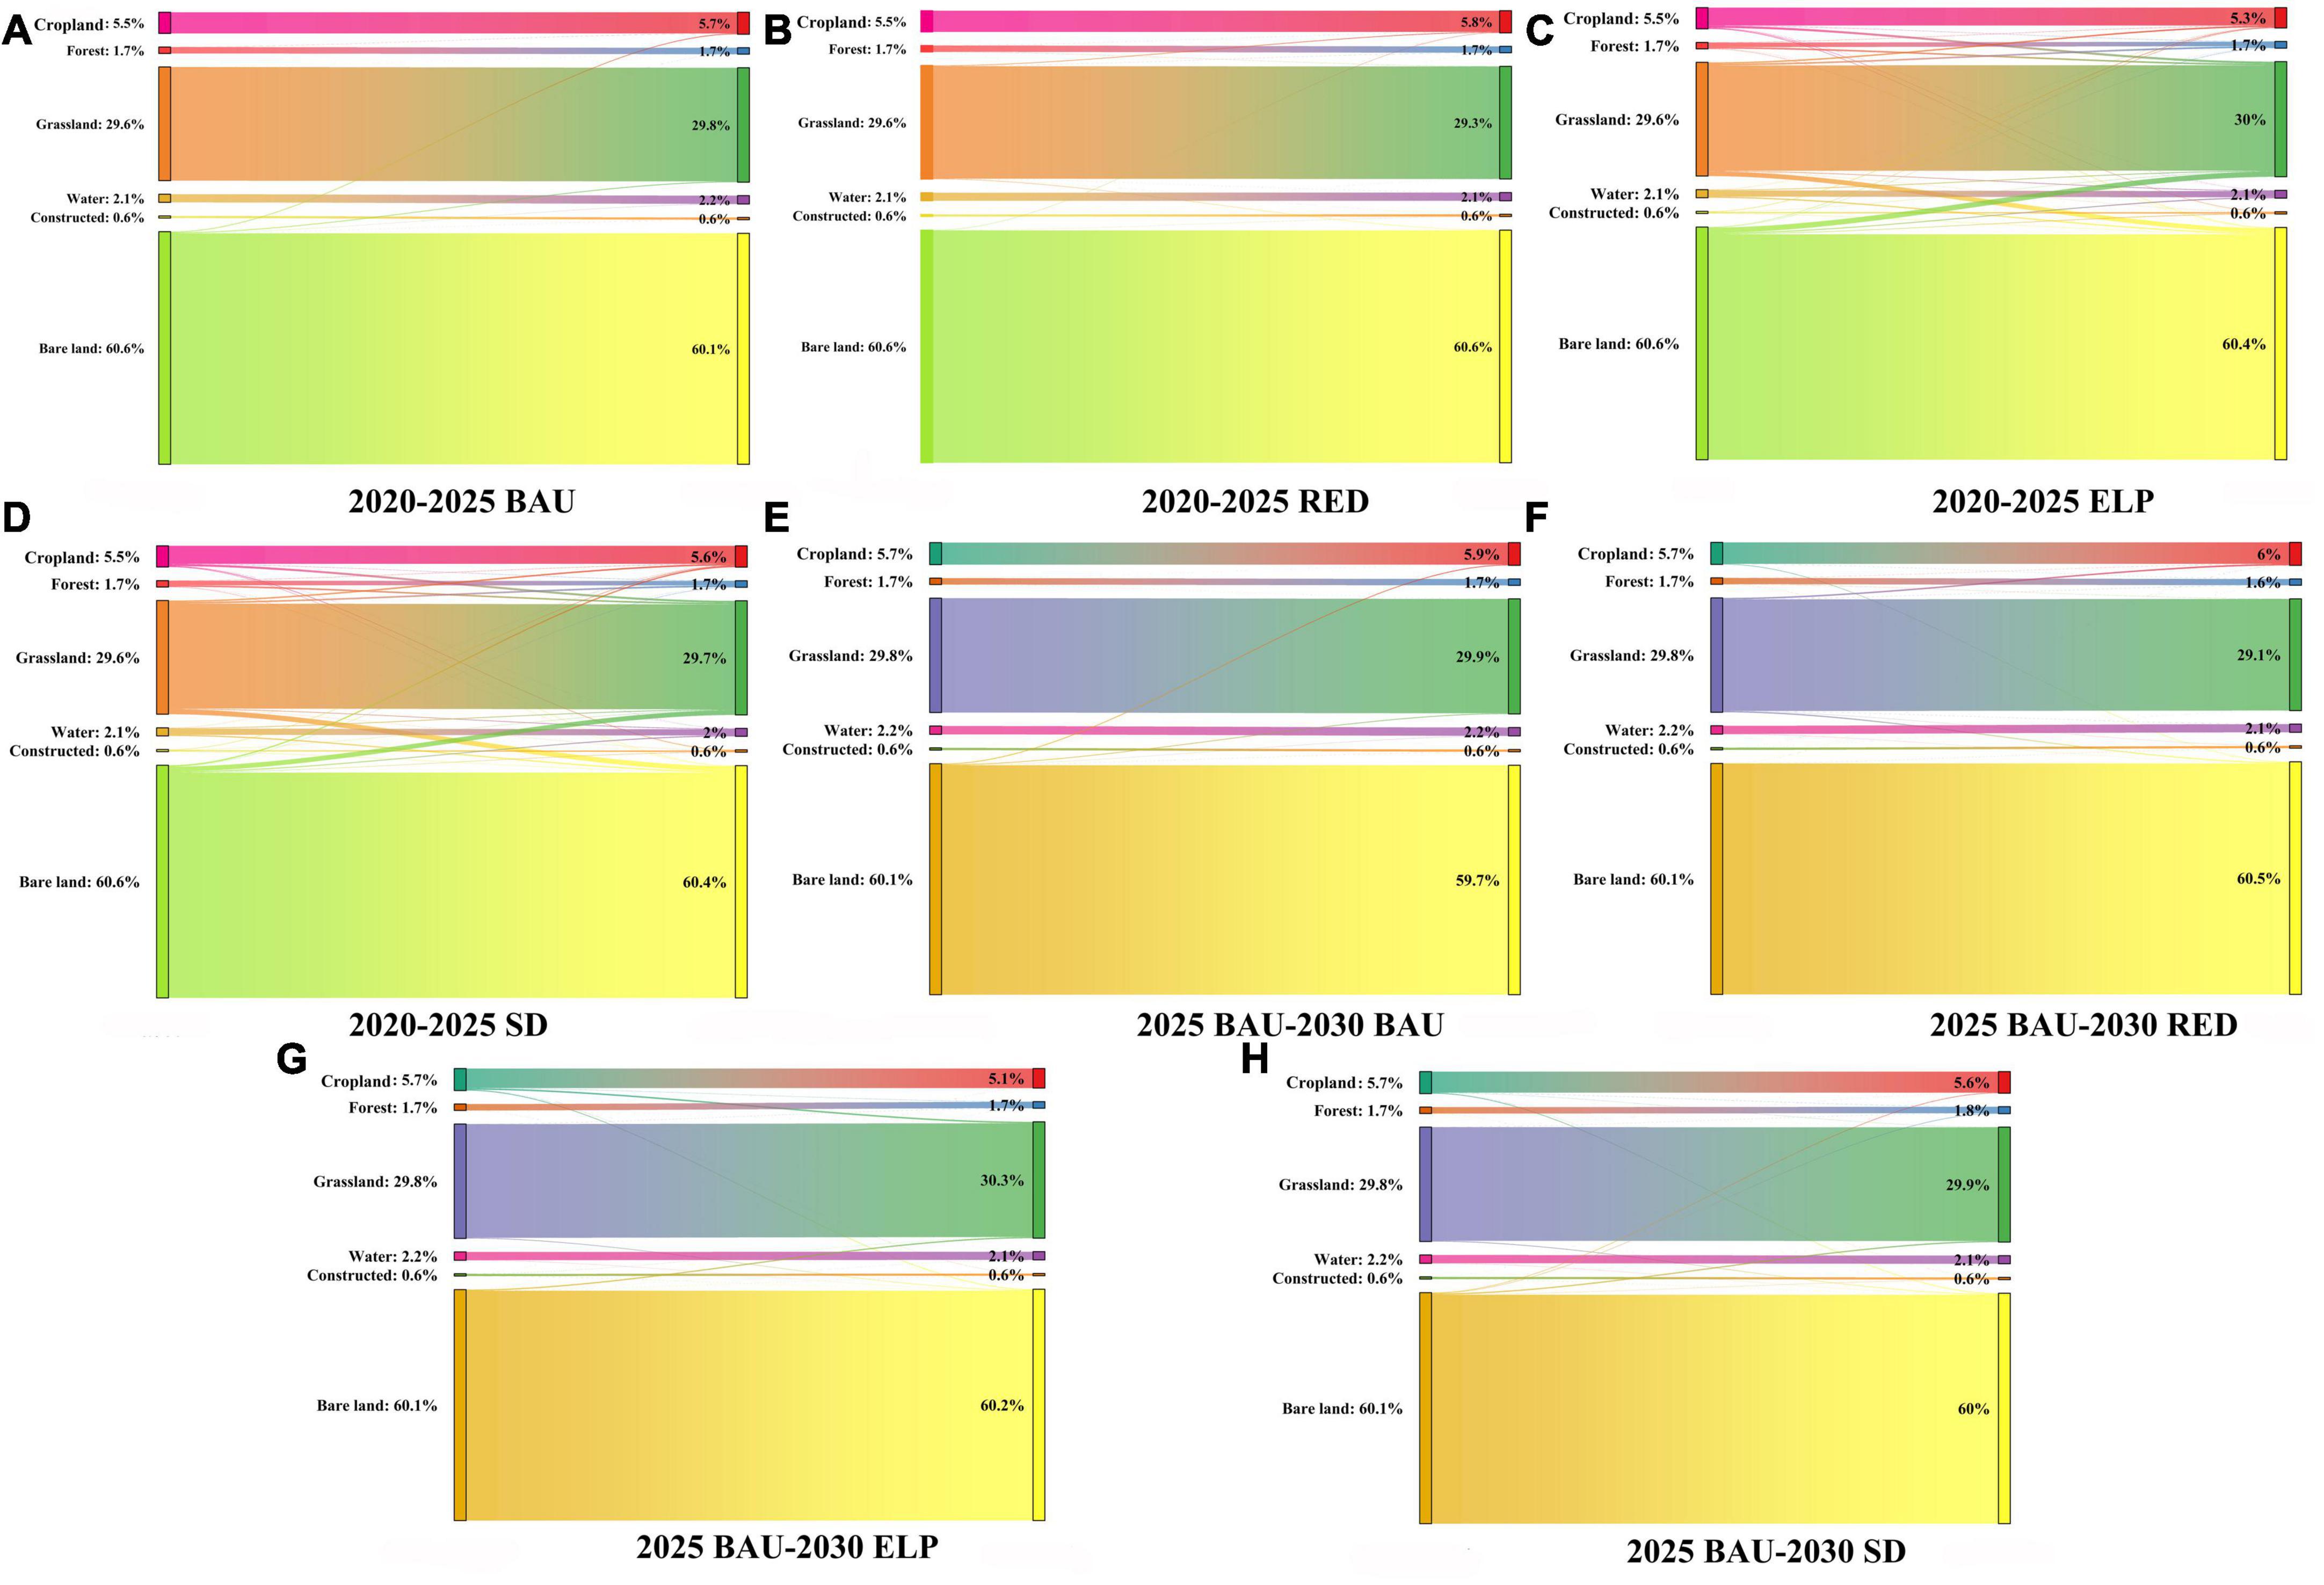
Figure 3. Transfer matrix alluvium map for the four different land use/land cover (LULC) scenarios in Xinjiang (2020–2030). Panel (A) is an alluvial map of the land use transfer matrix for the business as usual scenario from 2020 to 2025. Panel (B) is an alluvial map of the land use transfer matrix for the rapid economic development scenario from 2020 to 2025. Panel (C) is an alluvial map of the land use transfer matrix for the ecological land protection scenario from 2020 to 2025. Panel (D) is an alluvial map of the land use transfer matrix for the sustainable development scenario from 2020 to 2025. Panel (E) is an alluvial map of the land use transfer matrix from the 2025 business as usual scenario to the 2030 business as usual scenario. Panel (F) is an alluvial map of the land use transfer matrix from the 2025 business as usual scenario to the 2030 rapid economic development scenario. Panel (G) is an alluvial map of the land use transfer matrix from the 2025 business as usual scenario to the 2030 ecological land protection scenario. Panel (H) is an alluvial map of the land use transfer matrix from the 2025 business as usual scenario to the 2030 sustainable development scenario. BAU, business as usual; RED, rapid economic development; ELP, ecological land protection; SD, sustainable development.
We calculated the area of each LULC type separately for the time period 2020–2030 to assess the spatial and temporal differentiation of landscape patterns under the four LULC scenarios in Xinjiang (Figure 4). In 2025, cropland showed a significant growth trend, with increases in area of 3339.2, 3959.3, and 700.4 km2 in 2025 under the BAU, RED, and sustainable development programs, respectively. The expansion of arable land is closely linked to water resources, with arable land expanding firstly in central areas where water and soil resources are coordinated, secondly on the edges of oases where water resources are more plentiful and, with the development of water conservation techniques in Xinjiang, a small amount of arable land will be distributed in areas where water is scarce. The area of forest land showed slight reductions in 2025 of 132.5 and 204.1 km2 under the BAU and RED programs, respectively. There were reductions in the Altai Mountains, Ili Valley, and the buffer zone of the river valley near the Kunlun Mountains. The ELP scenario shows a trend of woodland expansion, with the expansion areas located within natural forest conservation projects, and the expansion of woodland benefiting from a series of ecological conservation projects. In 2030, rapid economic development in Xinjiang led to a continuous expansion of constructed land, which was particularly pronounced in the RED program, with an expansion in area of about 681.3 km2. The construction of transport facilities and the exploitation of resources such as oil are the main reasons for the expansion of land for construction.
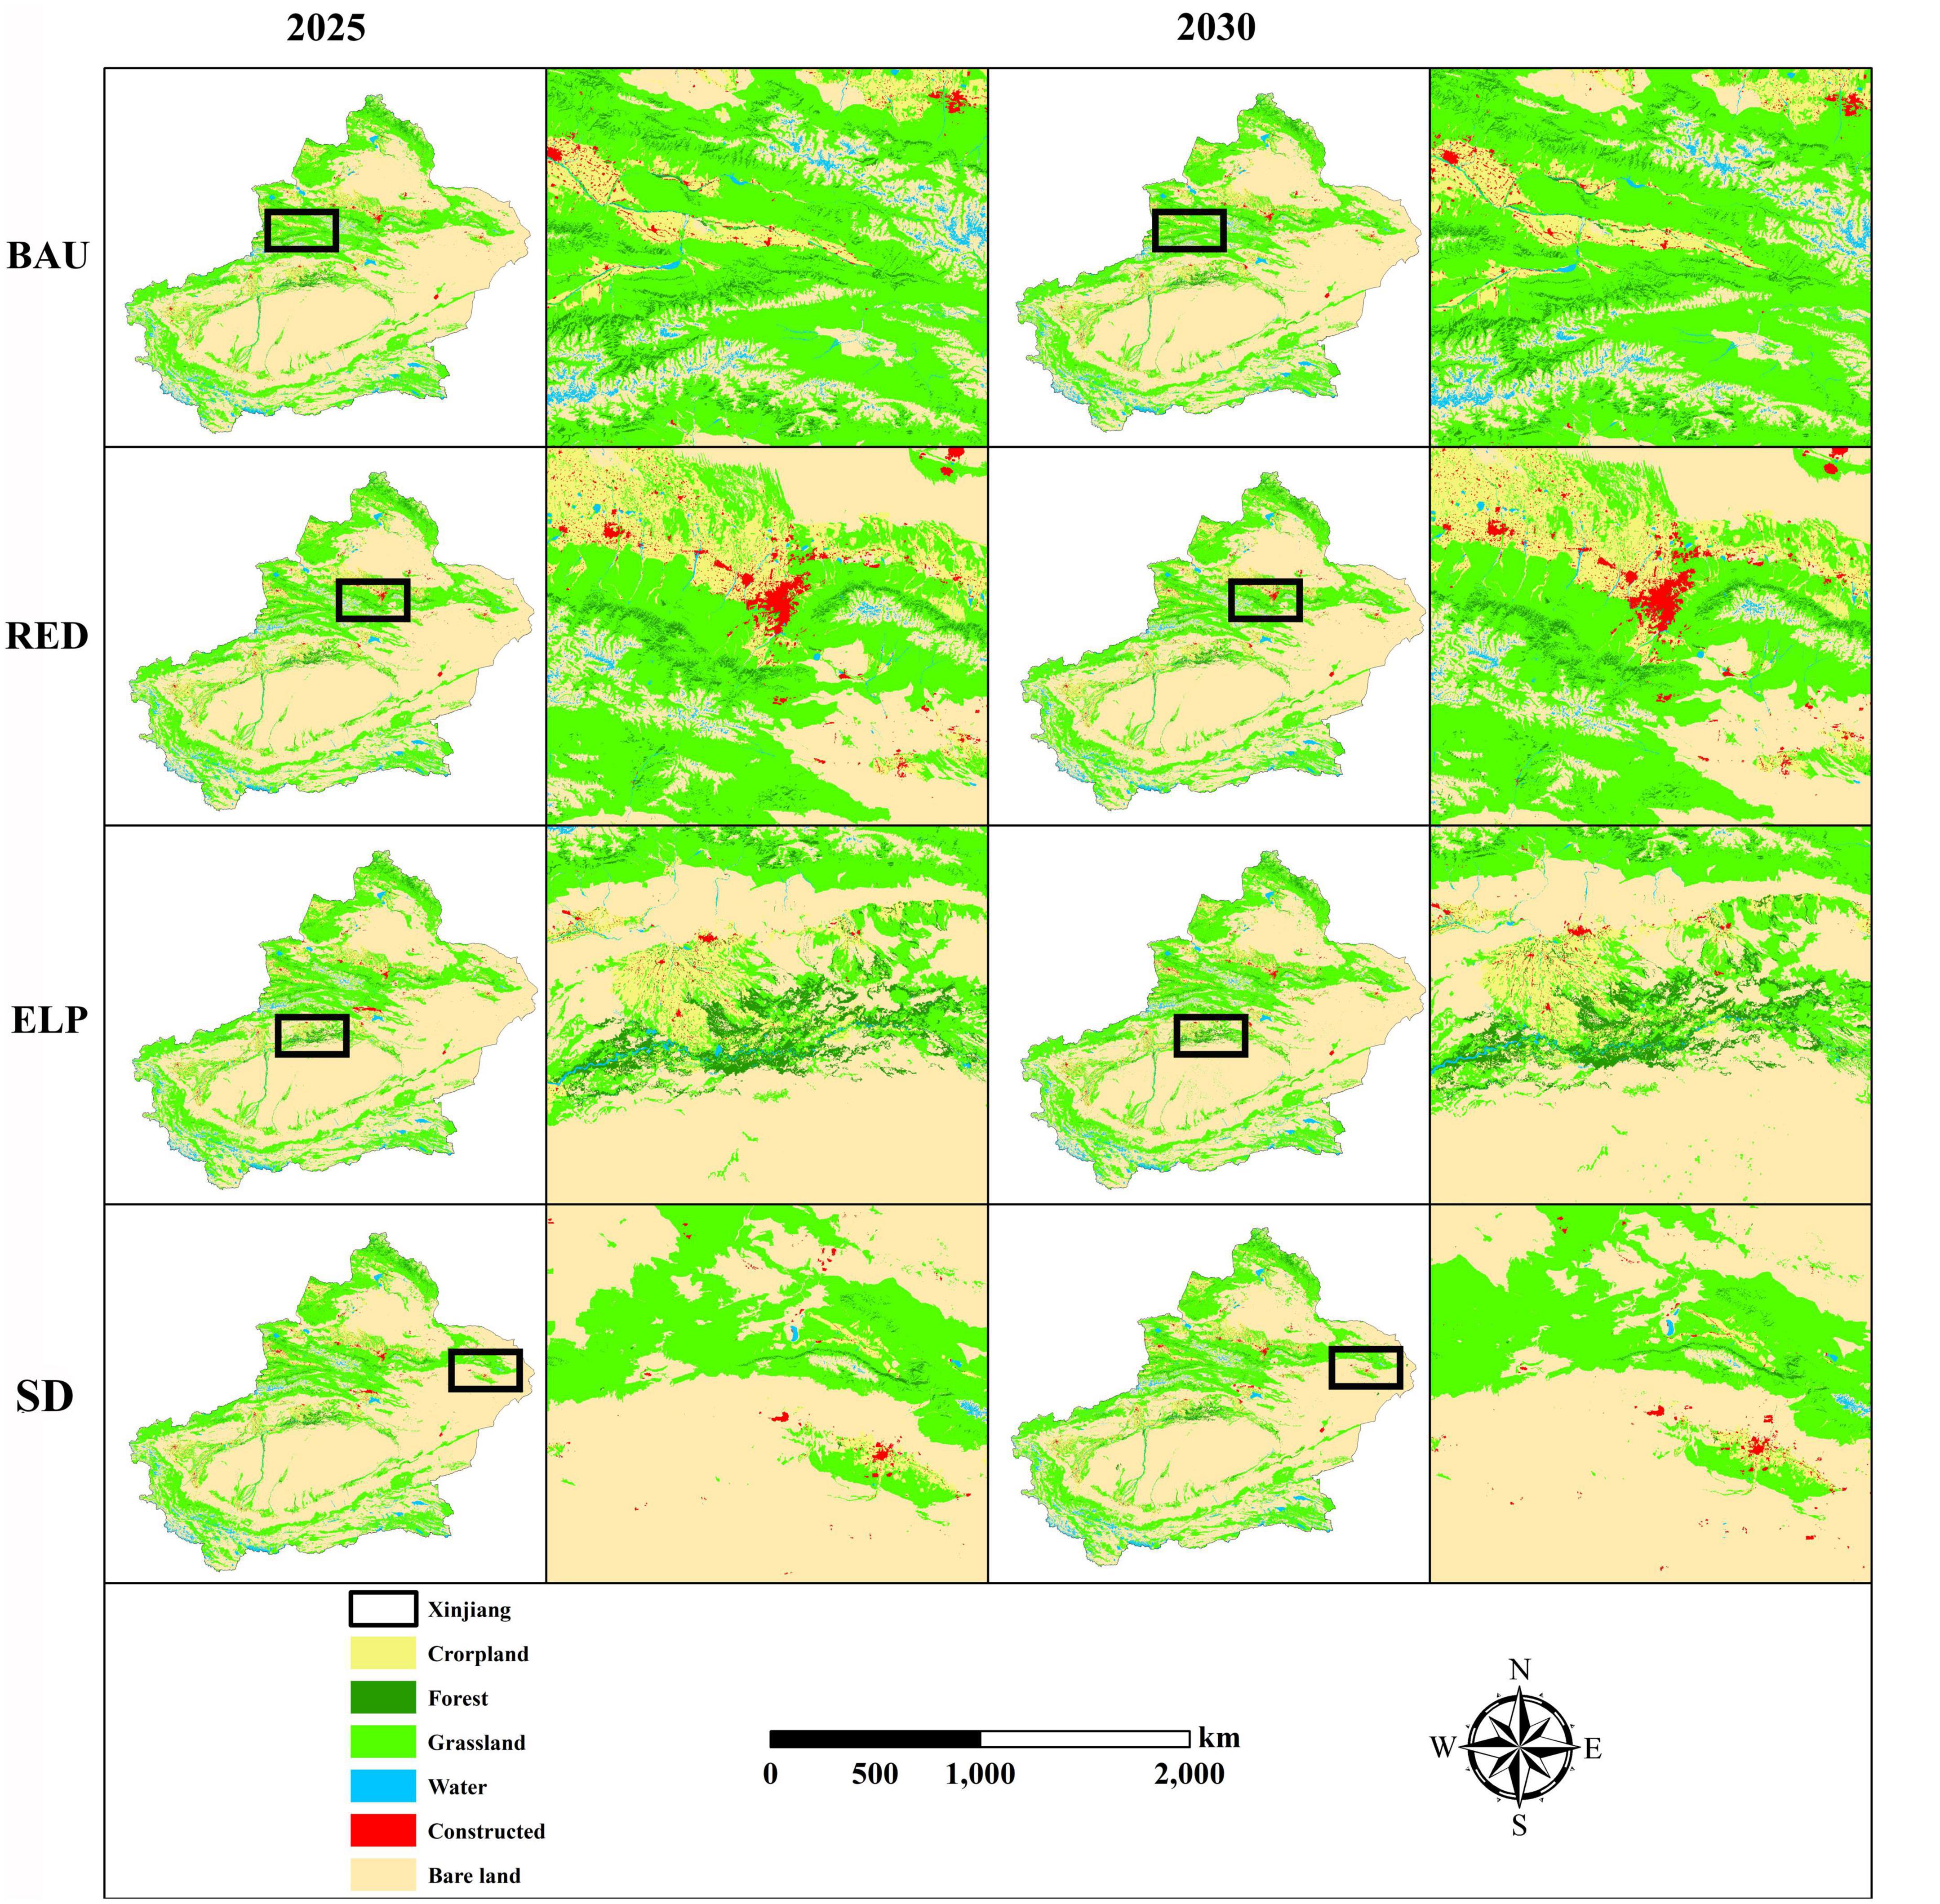
Figure 4. Changes in the spatial pattern of each land type in Xinjiang between 2020 and 2030.
3.2. Projection of future water demand and supply based on different land use scenario
Analysis of the temporal changes in future water yield showed varying degrees of fluctuation from 2025 to 2030 under all four land use scenarios (Figure 5). The water yields for the BAU, RED, ELP, and sustainable development scenarios all showed a downward trend between 2025 and 2030, decreasing by 2.76 × 10⁸, 0.19 × 10⁸, 1.96 × 10⁸, and 1.47 × 10⁸ m3, respectively. In 2025, the RED scenario produced 1.22 × 10⁸ more water than the BAU scenario, due to the expansion of constructed land leading to an increase in impervious surface and consequently a decrease in water infiltration. The ELP and sustainable development scenarios produced 0.56 × 10⁸ and 0.34 × 10⁸ m3 more water than the RED scenario, respectively. The ELP scenario shows a slower decline in water production due to the retention effect of vegetation, but arable land shows a decrease, probably due to ecological construction and conservation projects such as reforestation. The fluctuations in water production in 2030 under the four different land use scenarios were similar to those in 2025. The calculations based on the total water resources and water supply data from the Water Resources Bulletin published by the Xinjiang Water Resources Department in previous years showed that water supply accounts for about 62% of the total water resources in the target year and therefore the supply of water produced in 2025 and 2030 under the different land use scenarios can be calculated (Table 3).
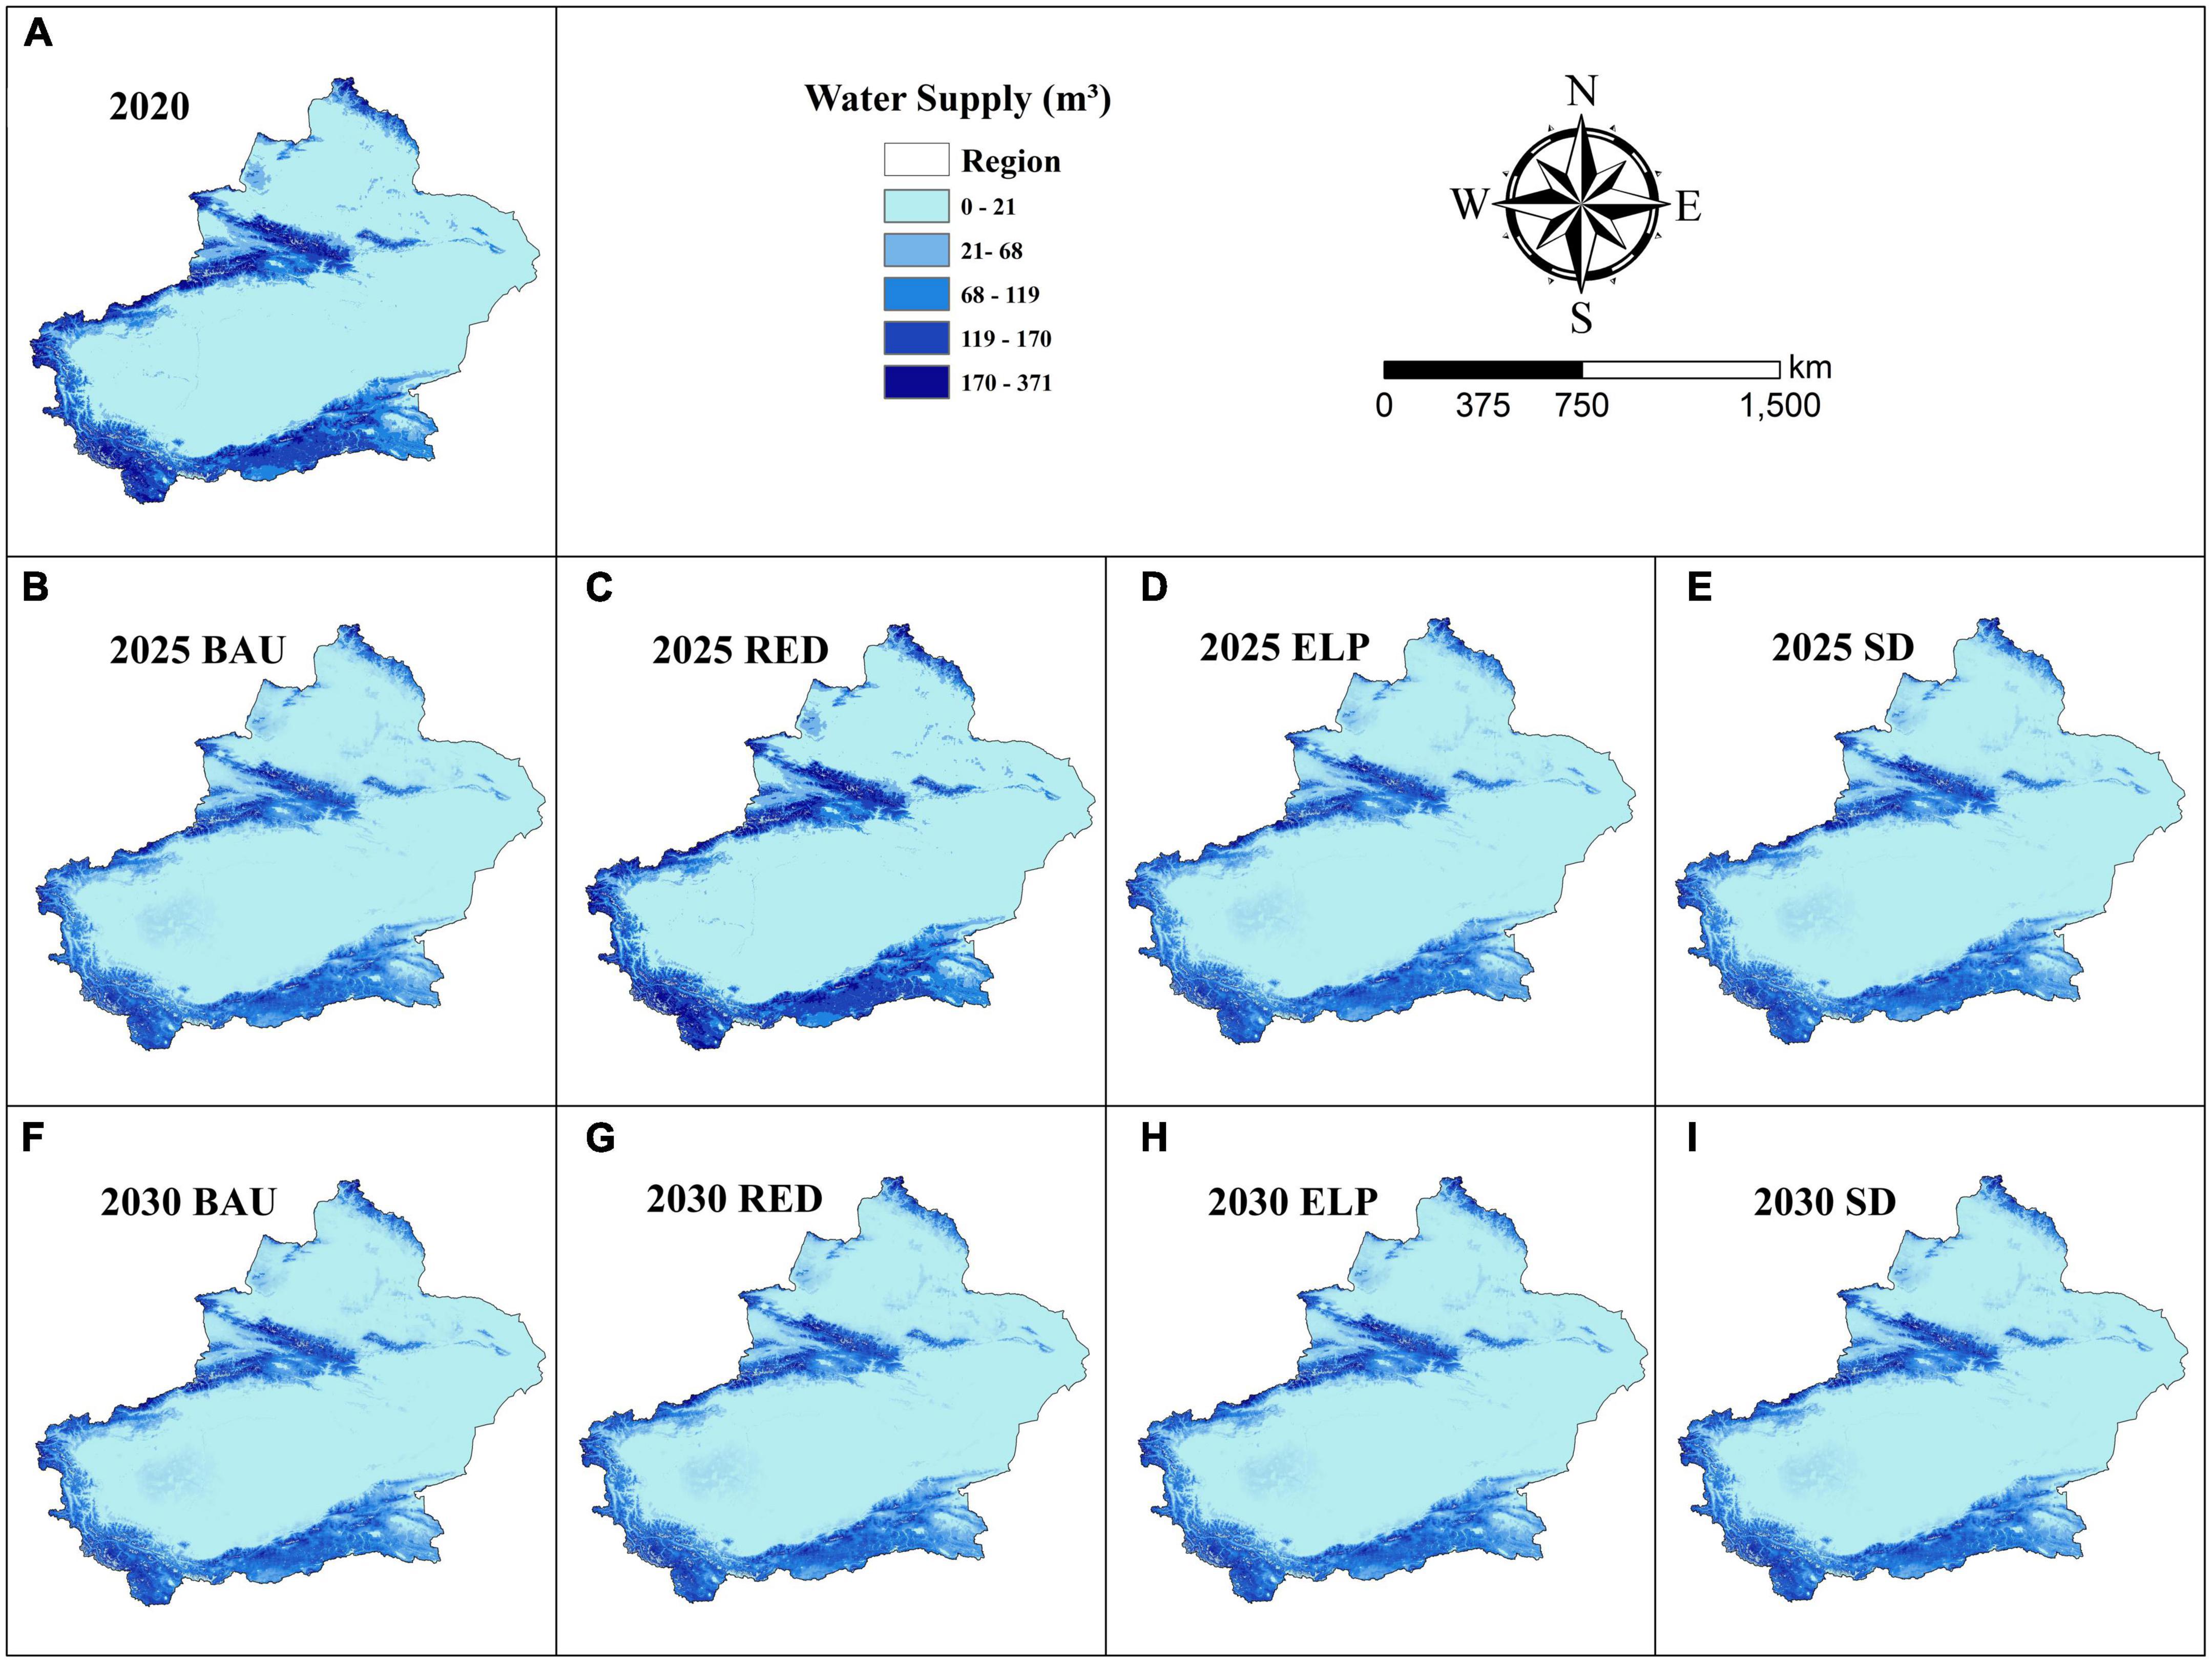
Figure 5. Spatial and temporal distribution of water production under the four different scenarios. Panel (A) shows the amount of water produced in 2020. Panel (B) shows the water production in 2025 under the business as usual scenario. Panel (C) shows the water production in 2025 under the rapid economic development scenario. Panel (D) shows the water production in 2025 under the ecological land protection scenario. Panel (E) shows the water production in 2025 under the sustainable development scenario. Panel (F) shows the water production in 2030 under the business as usual scenario. Panel (G) shows the water production in 2030 under the rapid economic development scenario. Panel (H) shows the water production in 2030 under the ecological land protection scenario. Panel (I) shows the water production in 2030 under the sustainable development scenario. BAU, business as usual; RED, rapid economic development; ELP, ecological land protection; SD, sustainable development.
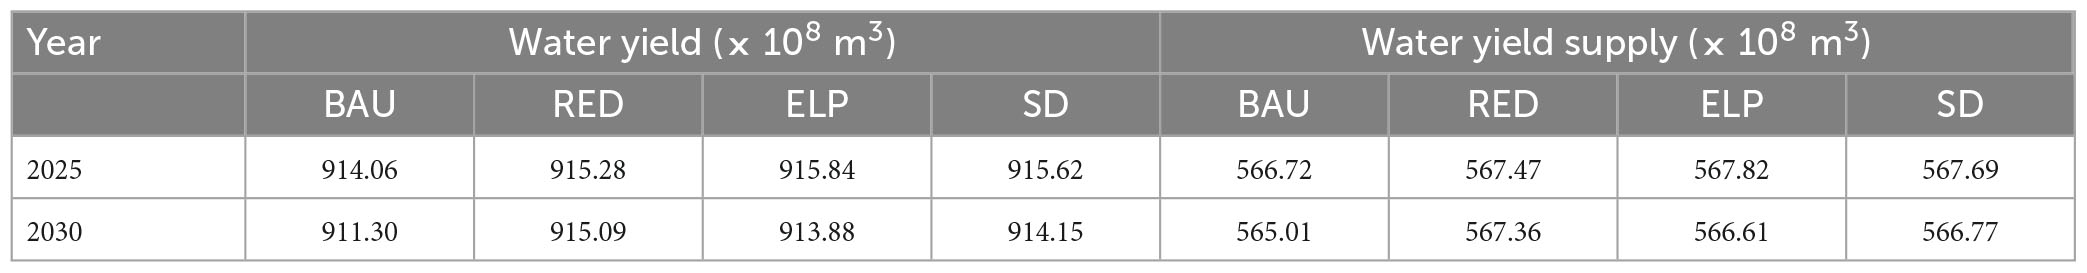
Table 3. Water production and supply for each scenario in 2025 and 2030.
The water supply was largest in northern Xinjiang, followed by southern Xinjiang, whereas the water supply in eastern Xinjiang was extremely scarce. A majority of the water supply in northern Xinjiang was found near urban areas located on the northern slopes of the Tian shan Mountains, the Ili Valley, and the Altay Mountains, whereas in southern Xinjiang, water was mainly supplied from the Kashgar region and Kunlun Mountains, showing an uneven spatial distribution.
We collected data on production water, domestic water use, and ecological water demand in the study area from 2000 to 2020 (at intervals of 5 years) and then used linear regression in conjunction with data from the Xinjiang Water Resources Bulletin to forecast production water use, domestic water use, and ecological water use in 2025 and 2030. Based on this approach, the total water demand for the future time period was forecast in conjunction with the total water demand formula (Table 4 and Figure 6). The water demand was assumed to be the same for each scenario in the forecast year.
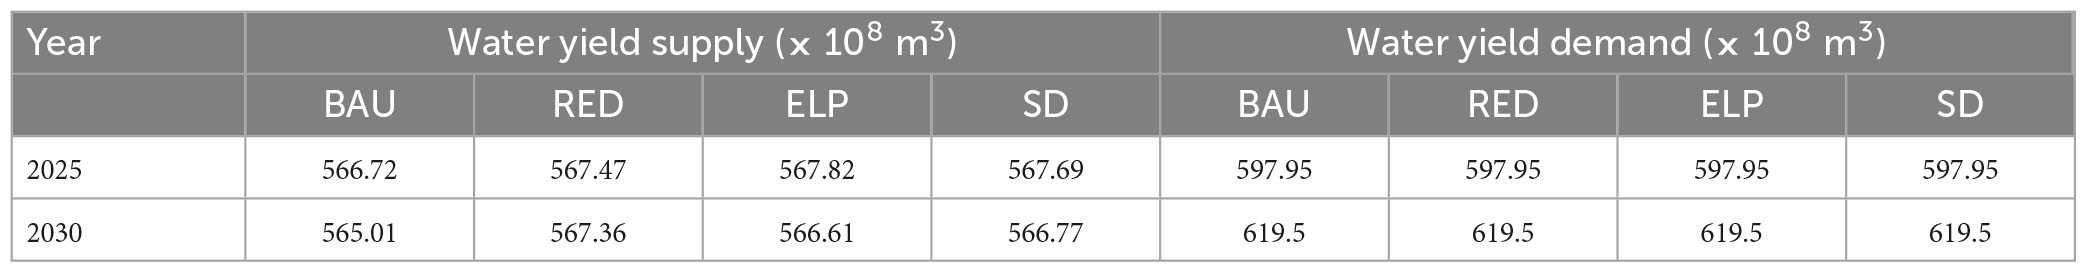
Table 4. Water yield service supply and demand for each scenario between 2025 and 2030.
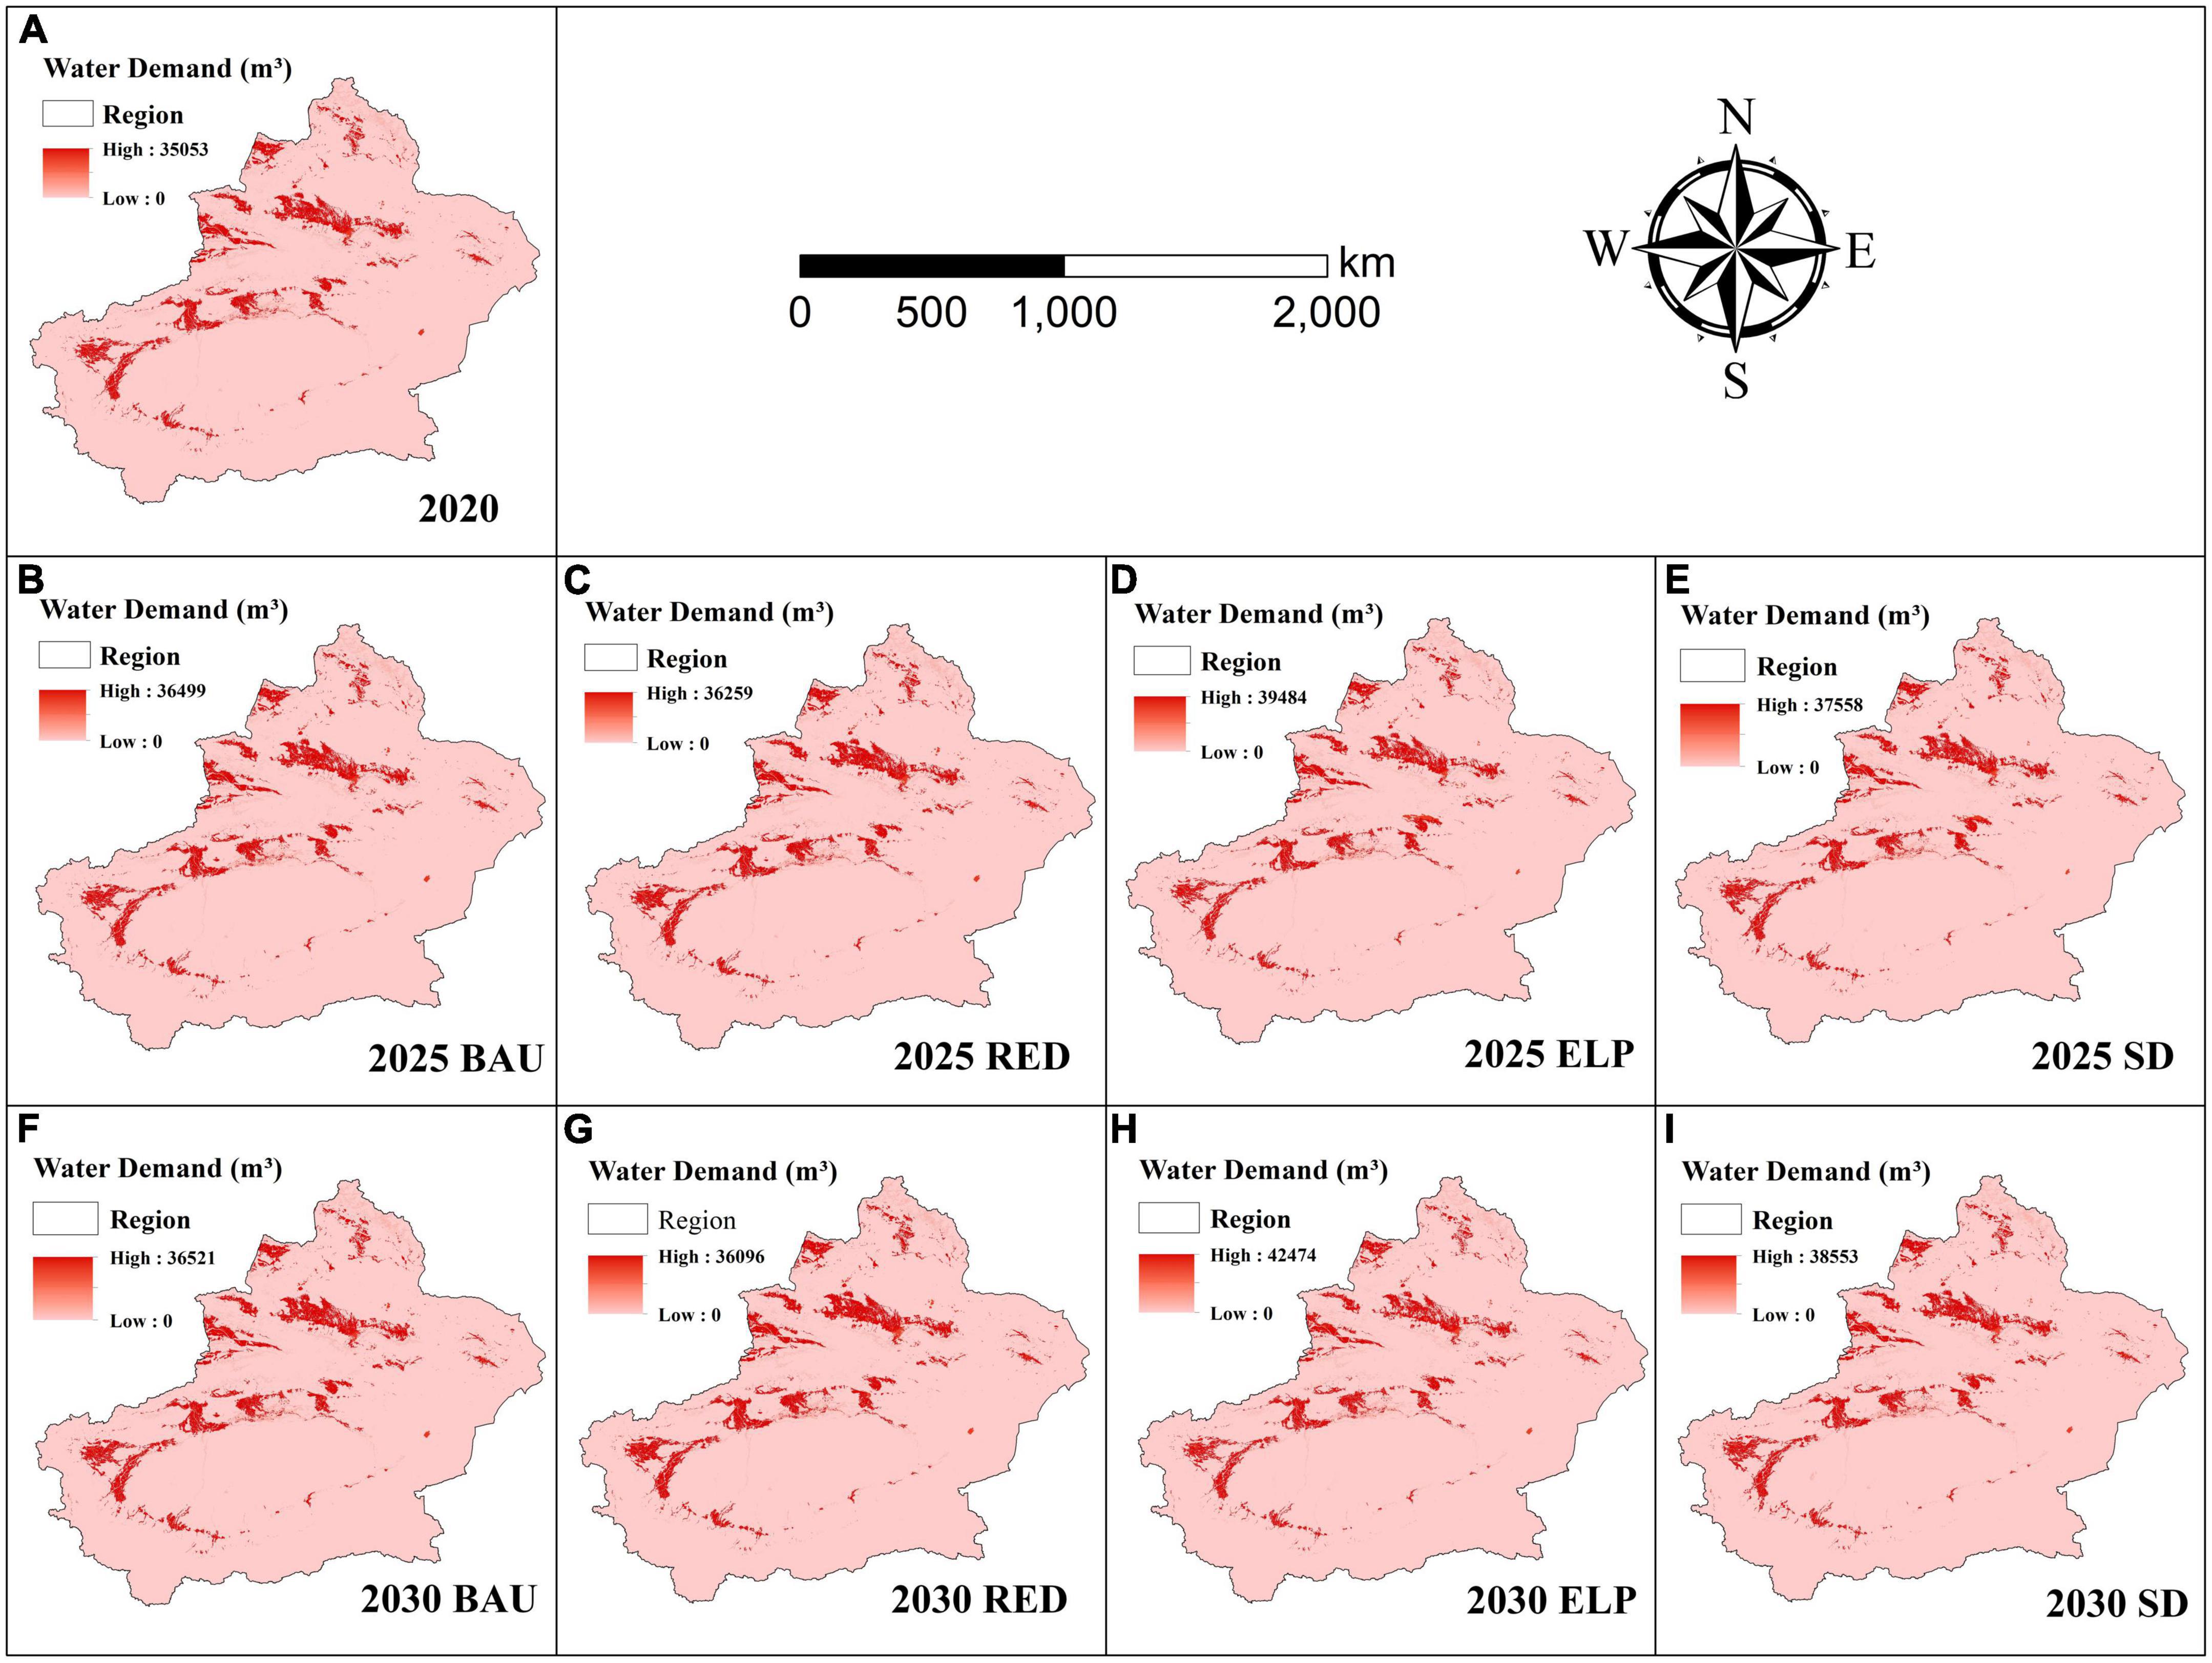
Figure 6. Spatiotemporal distribution of water demand under the four different scenarios. Panel (A) shows the amount of water demand in 2020. Panel (B) shows the water demand in 2025 under the business as usual scenario. Panel (C) shows the water demand in 2025 under the rapid economic development scenario. Panel (D) shows the water demand in 2025 under the ecological land protection scenario. Panel (E) shows the water demand in 2025 under the sustainable development scenario. Panel (F) shows the water demand in 2030 under the business as usual scenario. Panel (G) shows the water demand in 2030 under the rapid economic development scenario. Panel (H) shows the water demand in 2030 under the ecological land protection scenario. Panel (I) shows the water demand in 2030 under the sustainable development scenario. BAU, business as usual; RED, rapid economic development; ELP, ecological land protection; SD, sustainable development.
3.3. Water production service supply and demand balance under different future programs
We calculated the spatiotemporal correlations between water production service supply and water demand in study area to give water security indices for 2025 and 2030 of –0.0233 and –0.0400, respectively, under the BAU scenario, –0.0227 and –0.0382, respectively, under the RED scenario, –0.0225 and –0.0388, respectively, under the ELP scenario, and –0.0226 and –0.0386, respectively, under the sustainable development scenario. The water security index increased in the sustainable development scenario relative to the BAU and RED scenarios, but decreased relative to the ELP scenario. Both the 2025 and 2030 water security indices indicated an overall shortage of water resources in Xinjiang under all four scenarios, with an imbalance between supply and demand. Changes and differences in water supply and demand were the main cause of the differences. The more imbalanced water supply and demand in the RED scenario is likely to be due to the rapid expansion of constructed land, resulting in industrial activities with a higher water use and agricultural irrigation activities with a higher water demand, combined with concentrated population growth, which results in higher domestic water use. In terms of water supply and demand, the ELP and sustainable development programs were closer to equilibrium than the other scenarios as a result of the conservation of ecological land, which increases the amount of vegetation and traps water resources, increasing the amount of water available, although this is still relatively scarce in this arid region of China.
4. Discussion
4.1. Future LULC changes in different scenarios
The GMOP-PLUS model was coupled with the water production module of the InVEST model. We then simulated the land use patterns and spatiotemporal distribution of water production in Xinjiang in 2025 and 2030 by formulating conversion rules and designing sustainable development scenarios that accounted for both ecological and economic benefits. In the BAU scenario, each land type continues the historical trend, with a slight increase in cropland land and constructed land as the economy grows. In the RED program, the rapid economic development and rapid expansion of land for construction will inevitably encroach on some ecological land, resulting in a slight decrease in forest land and grassland. In the ELP scenario, the implementation of ecological conservation projects leads to an increasing trend, with forest land and grassland expansion concentrated in the Ili Valley and the alpine forest–grassland belt. Under the sustainable development scenario, the land use pattern is more reasonably configured: economic development is balanced with the protection of the ecological environment and the expansion of constructed land slows down, while the area of ecological land grows slowly.
Previous studies (Shi et al., 2021) in the Ili Valley have shown that, in the future ecological conservation scenario, constructed land expands more rapidly near the cultivated zone of the river valley plain, which is consistent with this study. Previous studies in Bortala Mongol Autonomous Prefecture (Wang Z. et al., 2022) have shown that all scenarios lead to a continuous expansion of constructed land. In this study, the four scenarios also showed a continuous expansion of constructed land and a more rapid expansion in the RED scenario, consistent with previous studies. In addition, we found that the sustainable development scenario, while balancing ecological and economic benefits, also limits the increase in construction land and to some extent prevents its uncontrolled expansion (Peng et al., 2021).
4.2. Evaluation of supply and demand for water production services under four future scenarios
Ecosystem water yield services—as an integrated ecological process based on temperature, precipitation, soil type, and land use practices—are an important ecosystem supply service. The impact of LULC on evapotranspiration mainly occurs through changes in the substratum conditions and thus the water yield (Lang et al., 2017). It difficult for local governments to reasonably allocate water between production, domestic and ecological uses (Liu, 2018). Different ecological processes will occur as a result of different land use patterns, which, in turn, affect the production of water.
A GMOP-PLUS model was coupled with the InVEST model to simulate LULC patterns under different programs for 2025 and 2030 to investigate the role of changes in land use on the balance between water production service supply and demand. The water production in 2025–2030 showed varying degrees of fluctuation under all four LULC programs. The water yield in the BAU, RED, ELP, and sustainable development scenarios all showed a decreasing trend between 2025 and 2030, which may be due to an increase in the annual evapotranspiration as a result of global warming (Chattopadhyay and Hulme, 1997). Alternatively, the future year 2025 could be a partial water year and 2030 a water-rich year. In 2025, the RED scenario produced more water than the BAU scenario due to rapid economic growth and an increase in constructed land, which increases the area of impervious surfaces. The sustainable development scenario, balancing economic and ecological benefits, yielded more water than the RED scenario, indicating that vegetation retains more water and that increasing the proportion of ecological land can contribute to an increase in water yield (Yang Y. et al., 2020).
4.3. Water supply and demand balance assessment
Previous simulations and scenarios applying a systems dynamics approach to the carrying capacity of water resources in Xinjiang have shown that neither the pursuit of high economic and population growth, nor the sacrifice of economic and population growth to reduce water consumption, is able ensure both sustainable water resources and socioeconomic development, consistent with the results of this study (Aman and Fang, 2020).
A study of different scenarios for the carrying capacity of water resources in Xinjiang based on a back-propagation neural network (Yang et al., 2016) showed that a sustainable development scenario aimed at enhancing the ecological efficiency of water resources could resolve the tension between water supply and demand, with a surplus of 4.23% by 2020. This may be due to differences between the back-propagation neural network and the InVEST model used in our study. It could also be due to differences in the settings of the sustainability scenarios, with the earlier study setting the sustainable development scenario by adjusting the development and utilization rate of water resources and the industrial water use efficiency parameters. By contrast, our study used the GMOP-PLUS model to set the sustainable development scenario with both ecological and economic benefits, making our results more accurate. A significant reduction in the risks associated with water supply and demand in agricultural production has been achieved through the promotion of water-saving agriculture (Li et al., 2016).
The water security index was developed to assess the future water yield service supply and demand balance in the study area (He et al., 2022). Under the four different scenarios, both the 2025 and 2030 water security indices showed an overall lack of water resources in Xinjiang, with a mismatch between supply and demand. Changes and differences in water supply and demand were the main cause of the differences in the water production service supply and demand conditions. There is still a need for more in-depth research on how to build a configuration model for the synergistic development of water resources, socioeconomic growth, and ecological environment; how to reach the sustainable use of water resources; and how to make more accurate and reasonable simulations of the future supply and demand of water yield services based on future changes in land use and global climate change (Sun et al., 2017).
4.4. Limitations and perspectives
The PLUS and InVEST models have been applied to the assessment and trade-off of ecosystem services in many regions, including studies of the regional yield of water resources, and are well-suited to the regional context (Pan et al., 2020; Wei et al., 2021). However, the model still has some limitations due to its set-up and simplification algorithms. We only modeled four different land use scenarios; however, future land use development is uncertain and these four scenarios are not representative of future trends. We should therefore consider more comprehensive scenarios and combine future climate data and relevant government policies for in more in-depth study. In this study, when using the PLUS model to predict the 2025 and 2030 LULC, it is necessary to project the demand for each land use type in 2025 and 2030. The demand for land use types in the BAU scenario is estimated using the Markov model, which is objective, but the other scenario settings and parameter adjustments are different due to the purpose of the simulation and the method chosen, thus increasing the subjectivity of the user. Whether a more objective estimation method can be chosen for the future demand for each scenario site type, the transfer cost matrix, the parameterization of the neighborhood factors, and the construction of the constraint functions needs to be further investigated. This study without considering the interaction between LULC and climate, which is very complex and holds vast research promise, and therefore requires more in-depth study (Hu and Gao, 2020).
In this study all data were replaced with mean values except for the LULC data. The reason for choosing data substitution in this study, apart from the difficulty in obtaining future data, was to highlight the role of future LULC scenario-setting and to minimize the excessive differential impact of other variables on the simulation results (Baosheng et al., 2020). The InVEST model water production module ignores the interaction between surface water and groundwater. Also the errors arising from the coupling of multiple models need to be discussed in depth. By linking ecosystem services to human needs to determine human wellbeing, this study enables a more scientific dissection of nature’s contribution to people and the needs of people to benefit from nature. It is therefore of great relevance to analyse the supply and demand of water produced by ecological supply services in the study area.
5. Conclusion
We coupled the GMOP-PLUS model with the InVEST model to simulate the spatiotemporal distribution of water production under different land use scenarios. We formulated conversion rules and designed sustainable development scenarios that considered both ecological and economic benefits to project LULC patterns in Xinjiang for 2025 and 2030 and then evaluated the balance of water production services supply and demand under these programs. All four scenarios for 2025 and 2030 indicated a shortage of water resources in the Xinjiang region, with continued deficits in future supply and demand.
The more imbalanced supply and demand of water production service in the RED scenario was due to the rapid increase in constructed land, resulting in more industrial activities with higher water consumption and agricultural irrigation activities with higher water demand, combined with concentrated population growth, resulting in higher domestic water consumption. The ELP and sustainable development scenarios were closer to equilibrium than the other scenarios because the conservation of ecological land increased the amount of vegetation. This, in turn, increased the retention of water resources, resulting in an increase in water supply, although the total amount of water was still low.
Water supply and demand were highly unequal under all four LULC scenarios, not only in terms of quantity, but also in terms of the spatial pattern. The supply of water production services was concentrated in the high mountain forests and grasslands and the less accessible areas around the Kunlun and Altai mountains, whereas the demand was concentrated in the more populated areas along the valley farming belt. Our sustainable development scenarios may help to alleviate this spatial imbalance. Local governments can use our results to formulate policies to reduce the withdrawal of water from agricultural land and industrial regions while maximizing ecological water use. Local governments should set up buffer zones of forest and grassland near the cultivation zones of the river valley plains, change the large water-flooding cultivation methods used in agriculture and develop water-saving ecological agriculture techniques, enrich the diversity of vegetation, improve industrial water conservation techniques, and control water pollution. These strategies will ensure a balanced and reasonable distribution of water among the various sectors.
Data availability statement
The original contributions presented in this study are included in the article/supplementary material, further inquiries can be directed to the corresponding authors.
Author contributions
MS, HZ, and PH: conception and design of the study. YZ: validation, formal analysis, and project administration. TD: supervision, investigation, and resources. KZ and YZ: data curation. ZL: writting the first draft of the manuscript. HW and PJ: writing—review and editing. All authors contributed to the article and approved the submitted version.
Funding
This research was financially supported by the Major Science and Technology Special Projects in Xinjiang Uygur Autonomous Region, China (Integrated demonstration of high quality, high yield and high efficiency standardized production technology for cotton, No. 2020A01002), the Major Science and Technology Special Project of Science and Technology Department of Xinjiang Uygur Autonomous Region, China (No. 2022A02011), and the 2023 Xinjiang Uygur Autonomous Region Graduate Innovation Project.
Acknowledgments
We appreciate the editor and reviewers’ valuable suggestions and comments, which were greatly helpful for improving the original manuscript.
Conflict of interest
The authors declare that the research was conducted in the absence of any commercial or financial relationships that could be construed as a potential conflict of interest.
Publisher’s note
All claims expressed in this article are solely those of the authors and do not necessarily represent those of their affiliated organizations, or those of the publisher, the editors and the reviewers. Any product that may be evaluated in this article, or claim that may be made by its manufacturer, is not guaranteed or endorsed by the publisher.
Footnotes
- ^ http://www.resdc.cn
- ^ https://www.fao.org
- ^ http://bdc.casnw.net
- ^ http://www.gscloud.cn
- ^ http://www.openstreetmap.org
- ^ https://www.cnrds.com
- ^ https://slt.xinjiang.gov.cn
References
Aman, R., and Fang, C. (2020). System dynamics simulation and scenario modelling of water resources carrying capacity in Xinjiang. Environ. Sci. Technol. 43, 205–215. doi: 10.19672/j.cnki.1003-6504.2020.06.027
Baosheng, W., Huaxiang, C., Zheng, D., Wei, Z., Quanyi, Q., and Lina, T. (2020). Impact of land use change on the water conservation service of ecosystems in the urban agglomeration of the golden triangle of Southern Fujian, China, in 2030. Acta Ecol. Sin. 40, 484–498. doi: 10.5846/stxb201902180286
Bradley, R., Vuille, M., Diaz, H., and Vergara, W. (2006). Threats to water supplies in the tropical Andes. Science 312, 1755–1756. doi: 10.1126/science.1128087
Chaplin-Kramer, R., Sharp, R., Weil, C., Bennett, E., Pascual, U., Arkema, K., et al. (2019). Global modeling of nature’s contributions to people. Science 366, 255–258. doi: 10.1126/science.aaw3372
Chattopadhyay, N., and Hulme, M. (1997). Evaporation and potential evapotranspiration in india under conditions of recent and future climate change. Agric. Forest Meteorol. 87, 55–73. doi: 10.1016/S0168-1923(97)00006-3
Cortinovis, C., and Geneletti, D. A. (2020). Performance-based planning approach integrating supply and demand of urban ecosystem services. Landsc. Urban Plan. 201:103842. doi: 10.1016/j.landurbplan.2020.103842
Fuping, Z., Xiaojuan, L., Qi, F., Huwei, W., Yongfen, W., and Hao, B. (2018). Spatial and temporal variation of water conservation in the upper reaches of Heihe River Basin based on invest model. J. Desert Res. 38:1321. doi: 10.7522/i.ssn.1000-694X.2017.00085
Guo, L., Yin, X., Gou, Z., and Gao, J. (2020). Evaluation on water yield and analysis of its variation characteristics of Arku river basin based on in vest model. J. Shihezi Univ. 38, 216–224. doi: 10.13880/i.cnki.65-1174/n.2020.23.003
He, J., Zhao, Y., and Wen, C. (2022). Spatiotemporal variation and driving factors of water supply services in the three gorges reservoir area of china based on supply-demand balance. Water 14:2271. doi: 10.3390/w14142271
Hu, F., Zhang, Y., Guo, Y., Zhang, P., Lv, S., and Zhang, C. (2022). Spatial and temporal variation and prediction of land use and habitat quality in the weihe river basin based on plus and invest models. Arid Zone Geogr. 45, 1125–1136. doi: 10.12118/j.issn.1000-6060.2021.510
Hu, Y., and Gao, M. (2020). Evaluations of water yield and soil erosion in the Shaanxi-Gansu loess plateau under different land use and climate change scenarios. Environ. Dev. 34:100488. doi: 10.1016/j.envdev.2019.100488
Huang, D., Huang, J., and Liu, T. (2019). Delimiting urban growth boundaries using the clue-S model with village administrative boundaries. Land Use Policy 82, 422–435. doi: 10.1016/j.landusepol.2018.12.028
Jasper, K., Calanca, P., Gyalistras, D., and Fuhrer, J. (2004). Differential impacts of climate change on the hydrology of two Alpine River Basins. Clim. Res. 26, 113–129. doi: 10.3354/cr026113
Jha, M., Arnold, J., Gassman, P., Giorgi, F., and Gu, R. (2006). Climate change sensitivity assessment on upper Mississippi river basin Streamflows Using Swat 1. J. Am. Water Resour. Assoc. 42, 997–1015. doi: 10.1111/j.1752-1688.2006.tb04510.x
Jin, G., Chen, K., Wang, P., Guo, B., Dong, Y., and Yang, J. (2019). Trade-offs in land-use competition and sustainable land development in the North China Plain. Technol. Forecast. Soc. Change 141, 36–46. doi: 10.1016/j.techfore.2019.01.004
Lang, Y., Song, W., and Zhang, Y. (2017). Responses of the water-yield ecosystem service to climate and land use change in Sancha River Basin, China. Phys. Chem. Earth Parts A/B/C 101, 102–111. doi: 10.1016/j.pce.2017.06.003
Li, D., Wu, S., Liu, L., Liang, Z., and Li, S. (2017). Evaluating regional water security through a freshwater ecosystem service flow model: A case study in Beijing-Tianjian-Hebei Region, China. Ecol. Indicat. 81, 159–170. doi: 10.1016/j.ecolind.2017.05.034
Li, J., Luo, G., Ding, J., Xu, W., and Zheng, S. (2016). Effect of progress in artificial irrigation and drainage technology on the change of cultivated land pattern in the past 50 years in Manasi River Watershed. J. Nat. Resour. 31, 570–582. doi: 10.11849/zrzyxb.20150370
Liang, X., Guan, Q., Clarke, K., Liu, S., Wang, B., and Yao, Y. (2021). Understanding the drivers of sustainable land expansion using a patch-generating land use simulation (plus) model: A case study in Wuhan, China. Comput. Environ. Urban Syst. 85:101569. doi: 10.1016/j.compenvurbsys.2020.101569
Liu, X., Liu, Y., Wang, Y., and Liu, Z. (2022). Evaluating potential impacts of land use changes on water supply–demand under multiple development scenarios in Dryland Region. J. Hydrol. 610:127811. doi: 10.1016/j.jhydrol.2022.127811
Liu, Y. (2018). Introduction to land use and rural sustainability in China. Land Use Policy 74, 1–4. doi: 10.1016/j.landusepol.2018.01.032
Luo, M., Liu, T., Meng, F., Duan, Y., Bao, A., Xing, W., et al. (2019). Identifying climate change impacts on water resources in Xinjiang, China. Sci. Total Environ. 676, 613–626. doi: 10.1016/j.scitotenv.2019.04.297
Ma, R., Fan, Y., Wu, H., Zhu, L., Ma, X., Fan, X., et al. (2023). Simulation of land-use patterns in arid areas coupled with GMOP and PLUS models. J. Agric. Resour. Environ. 40, 143–153. doi: 10.13254/ijare.2021.0865
Pan, J., Wei, S., and Li, Z. (2020). Spatiotemporal pattern of trade-offs and synergistic relationships among multiple ecosystem services in an arid inland river basin in NW China. Ecol. Indicat. 114:106345. doi: 10.1016/j.ecolind.2020.106345
Peng, K., Jiang, W., Ling, Z., Hou, P., and Deng, Y. (2021). Evaluating the potential impacts of land use changes on ecosystem service value under multiple scenarios in support of sdg reporting: A case study of the Wuhan Urban Agglomeration. J. Clean. Prod. 307:127321. doi: 10.1016/j.jclepro.2021.127321
Ry, M., Lx, P., Xx, C., Ss, S., Zl, F., X, L., et al. (2023). Multi-scenario simulation of land use change and its impact on ecosystem services in Beijing-Tianjin-Hebei region based on the flus-invest model. Acta Ecol. Sin. 43. doi: 10.5846/stxb202201280269
Shi, M., Wu, H., Fan, X., Jia, H., Dong, T., He, P., et al. (2021). Trade-offs and synergies of multiple ecosystem services for different land use scenarios in the Yili River Valley, China. Sustainability 13:1577. doi: 10.3390/su13031577
Shi, M., Wu, H., Jiang, P., Shi, W., Zhang, M., Zhang, L., et al. (2022). Cropland expansion mitigates the supply and demand deficit for carbon sequestration service under different scenarios in the future—the case of Xinjiang. Agriculture 12:1182. doi: 10.3390/agriculture12081182
Shi, M., Wu, H., Jiang, P., Zheng, K., Liu, Z., Dong, T., et al. (2023). Food-water-land-ecosystem nexus in typical Chinese dryland under different future scenarios. Sci. Total Environ. 880:163183. doi: 10.1016/j.scitotenv.2023.163183
Sun, S., and Shi, Q. (2020). Global spatio-temporal assessment of changes in multiple ecosystem services under four IPCC SRES land-use scenarios. Earths Future 8:e2020EF001668. doi: 10.1029/2020EF001668
Sun, Y., Liu, N., Shang, J., and Zhang, J. (2017). Sustainable utilization of water resources in China: A system dynamics model. J. Clean. Prod. 142, 613–625. doi: 10.1016/j.jclepro.2016.07.110
Tang, X., Zhao, X., Bai, Y., Tang, Z., Wang, W., Zhao, Y., et al. (2018). Carbon pools in China’s terrestrial ecosystems: New estimates based on an intensive field survey. Proc. Natl. Acad. Sci. U.S.A. 115, 4021–4026. doi: 10.1073/pnas.1700291115
Tao, P., Shao-hong, W., Er-fu, D., and Yu-jie, L. (2013). Spatiotemporal variation of water source supply service in three rivers source area of china based on invest model. Yingyong Shengtai Xuebao 24, 183–189. doi: 10.13287/j.1001-9332.2013.0140
Vorosmarty, C., Green, P., Salisbury, J., and Lammers, R. (2000). Global water resources: Vulnerability from climate change and population growth. Science 289, 284–288. doi: 10.1126/science.289.5477.284
Wang, H., and Wang, M.-L. A. (1997). Fuzzy Multiobjective Linear Programming. Fuzzy Sets Syst. 86, 61–72. doi: 10.1016/0165-0114(95)00393-2
Wang, J., Zhang, J., Xiong, N., Liang, B., Wang, Z., and Cressey, E. (2022). Spatial and temporal variation, simulation and prediction of land use in ecological conservation area of Western Beijing. Remote Sens. 14:1452. doi: 10.3390/rs14061452
Wang, Y., Wang, X., Wang, K., Chevallier, F., Zhu, D., Lian, J., et al. (2022). The size of the land carbon sink in China. Nature 603, E7–E9. doi: 10.1038/s41586-020-2849-9
Wang, Z., Li, X., Mao, Y., Li, L., Wang, X., and Lin, Q. (2022). Dynamic simulation of land use change and assessment of carbon storage based on climate change scenarios at the city level: A case study of Bortala, China. Ecol. Indicat. 134:108499. doi: 10.1016/j.ecolind.2021.108499
Wei, P., Chen, S., Wu, M., Deng, Y., Xu, H., Jia, Y., et al. (2021). Using the invest model to assess the impacts of climate and land use changes on water yield in the upstream regions of the Shule River Basin. Water 13:1250. doi: 10.3390/w13091250
Wei, S., Lei, A., and Islam, S. (2010). Modeling and simulation of industrial water demand of Beijing municipality in China. Front. Environ. Sci. Eng. China 4, 91–101. doi: 10.1007/s11783-010-0007-6
Wu, G., Li, L., Ahmad, S., Chen, X., and Pan, X. A. (2013). Dynamic model for vulnerability assessment of regional water resources in arid areas: A case study of Bayingolin, China. Water Resour. Manag. 27, 3085–3101. doi: 10.1007/s11269-013-0334-z
Wu, X., Fu, B., Wang, S., Song, S., Li, Y., Xu, Z., et al. (2022). Decoupling of SDGs Followed by Re-Coupling as Sustainable Development Progresses. Nat. Sustain. 5, 452–459. doi: 10.1038/s41893-022-00868-x
Xie, G., Zhang, C., Zhen, L., and Zhang, L. (2017). Dynamic changes in the value of china’s ecosystem services. Ecos. Serv. 26, 146–154. doi: 10.1016/j.ecoser.2017.06.010
Yang, H., Zhang, J., and Yang, Z. (2013). Rational land planning utilization structure optimization based on multi-objective linear programming model of foshan. Adv. Mater. Res. 616, 1243–1248.
Yang, J., Gong, J., Tang, W., and Liu, C. (2020). Patch-based cellular automata model of urban growth simulation: Integrating feedback between quantitative composition and spatial configuration. Comput. Environ. Urban Syst. 79:101402. doi: 10.1016/j.compenvurbsys.2019.101402
Yang, L., Li, B., and Fu, Q. (2016). Scenario analysis of water resources carrying capacity in Xinjiang based on BP neural network model. J. Beijing Norm. Univ. 52, 216–222. doi: 10.16360/j.cnki.jbnuns.2016.02.018
Yang, Y., Bao, W., Li, Y., Wang, Y., and Chen, Z. (2020). Land use transition and its eco-environmental effects in the Beijing–Tianjin–Hebei Urban Agglomeration: A production–living–ecological perspective. Land 9:285. doi: 10.3390/land9090285
Zhang, H., and Zhang, X. (2011). Land use structural optimization of lilin based on Gmop-Esv. Trans. Nonferr. Metals Soc. China 21, s738–s742. doi: 10.1016/S1003-6326(12)61672-0
Zhao, B., Kreuter, U., Li, B., Ma, Z., Chen, J., and Nakagoshi, N. (2004). An ecosystem service value assessment of land-use change on chongming Island, China. Land Use Policy 21, 139–148. doi: 10.1016/j.landusepol.2003.10.003
Zheng, Z., Fu, B., Hu, H., and Sun, G. A. (2014). Method to identify the variable ecosystem services relationship across time: A case study on Yanhe Basin, China. Landsc. Ecol. 29, 1689–1696. doi: 10.1007/s10980-014-0088-x
Zhu, W., Zhang, J., Cui, Y., Zheng, H., and Zhu, L. (2019). Assessment of territorial ecosystem carbon storage based on land use change scenario: A case study in Qihe River Basin. Acta Geogr. Sin. 74, 446–459. doi: 10.11821/dlxb201903004
Keywords: land use/land cover change, different scenarios, terrestrial ecosystem services, water yields, Xinjiang
Citation: Liu Z, Shi M, Wu H, Jiang P, Zhang H, He P, Zheng K, Dong T and Zhang Y (2023) Quantity and spatial imbalance of supply and demand for water yield services in terrestrial ecosystems under different future land use scenarios in Xinjiang, China. Front. Ecol. Evol. 11:1094409. doi: 10.3389/fevo.2023.1094409
Received: 10 November 2022; Accepted: 17 April 2023;
Published: 05 May 2023.
Edited by:
Emilio Rodriguez Caballero, University of Almería, SpainReviewed by:
Gui Jin, China University of Geosciences, ChinaHailu Kuma, Wolaita Sodo University, Ethiopia
Copyright © 2023 Liu, Shi, Wu, Jiang, Zhang, He, Zheng, Dong and Zhang. This is an open-access article distributed under the terms of the Creative Commons Attribution License (CC BY). The use, distribution or reproduction in other forums is permitted, provided the original author(s) and the copyright owner(s) are credited and that the original publication in this journal is cited, in accordance with accepted academic practice. No use, distribution or reproduction is permitted which does not comply with these terms.
*Correspondence: Hongqi Wu, d2hxQHhqYXUuZWR1LmNu; Pingan Jiang, eGphdWRieGJAeGphdS5lZHUuY24=
†These authors have contributed equally to this work and share first authorship