 Lauren Stoczynski
 Mark C. Scott2,4
 Luke Bower
 Brandon K. Peoples
94% of researchers rate our articles as excellent or good
Learn more about the work of our research integrity team to safeguard the quality of each article we publish.
Find out more
ORIGINAL RESEARCH article
Front. Ecol. Evol., 17 March 2023
Sec. Biogeography and Macroecology
Volume 11 - 2023 | https://doi.org/10.3389/fevo.2023.1077994
This article is part of the Research TopicSpatial Constraints on Multiple Dimensions of BiodiversityView all 6 articles
Introduction: Beta diversity represents changes in community composition among locations across a landscape. While the effects of human activities on beta diversity are becoming clearer, few studies have considered human effects on the three dimensions of beta diversity: taxonomic, functional, and phylogenetic. Including anthropogenic factors and multiple dimensions of biodiversity may explain additional variation in stream fish beta diversity, providing new insight into how metacommunities are structured within different spatial delineations.
Methods: In this study, we used a 350 site stream fish abundance dataset from South Carolina, United States to quantify beta diversity explainable by spatial, natural environmental, and anthropogenic variables. We investigated three spatial delineations: (1) a single whole-state metacommunity delineated by political boundaries, (2) two metacommunities delineated by a natural geomorphic break separating uplands from lowlands, and (3) four metacommunities delineated by natural watershed boundaries. Within each metacommunity we calculated taxonomic, functional, and phylogenetic beta diversity and used variation partitioning to quantify spatial, natural environmental, and anthropogenic contributions to variations in beta diversity.
Results: We explained 25–81% of the variation in stream fish beta diversity. The importance of these three factors in structuring metacommunities differed among the diversity dimensions, providing complementary perspectives on the processes shaping beta diversity in fish communities. The effect of spatial, natural environmental, and anthropogenic factors varied among the spatial delineations, which indicate conclusions drawn from variation partitioning may depend on the spatial delineation chosen by researchers.
Discussion: Our study highlights the importance of considering human effects on metacommunity structure, quantifying multiple dimensions of beta diversity, and careful consideration of user-defined metacommunity boundaries in beta diversity analyses.
Freshwater systems are threatened by many anthropogenic effects including habitat fragmentation, land cover change, and disruption of the natural flow regime (Vörösmarty et al., 2010; Heino, 2013). Human effects on taxonomic and functional composition of freshwater communities are well documented (Poff, 1997; Allan, 2004) to the point that they are foundational to the paradigm of contemporary environmental assessment (Karr, 1981; Bailey et al., 2004). Landscape level studies have assessed the dependence of measured shifts in fish communities upon current and past land use changes, with some evidence of generalization in thresholds for urbanization and agriculture effects on compositional and richness changes (Chen and Olden, 2020). While land use variables provide the first evidence that urbanization and agriculture change fish communities, pinpointing the specific variables associated with these land uses can give additional insight into what environmental monitors should be measured when completing bioassessments (Waite et al., 2021; Iacarella, 2022). For example, Stoczynski et al. (2021) found that dam density affected how species replaced one another across the landscape, Ortega et al. (2021) identified impervious surfaces as a proxy for urbanization, and Waite et al. (2021) highlighted how contaminants in water and sediment were just one of multiple urbanization and agricultural stressors. Thus, disentangling anthropogenic effects from ‘natural’ environmental variables in metacommunity analyses may increase our ability to explain factors structuring beta diversity within metacommunities (Duarte et al., 2018; Gianuca et al., 2018). However, few studies have examined stream fish metacommunities from the lens of anthropogenic effects (Erős et al., 2012; Borges et al., 2020; Stoczynski et al., 2021).
Biodiversity is represented by three dimensions: taxonomic, phylogenetic, and functional diversity; patterns of beta diversity can be unique for each dimension. Taxonomic diversity indexes counts and proportions of taxa (typically species or genera). Alternatively, functional diversity represents the range of traits present in a location, regardless of species (Tilman, 2001), while phylogenetic diversity refers to the degree of variation in evolutionary history in a community (Webb et al., 2002). Most analyses of beta diversity have focused solely on taxonomic diversity and have not considered that co-occurring species may be from different phylogenetic positions and/or have different functional roles within the community (Jarzyna and Jetz, 2016). All species have traits which correspond to their roles and habitat preferences within a community. Functional beta diversity describes differences in these traits between communities (Wootton, 2012; Leibold and Chase, 2017). Phylogenetic beta diversity allows us to investigate evolutionary differences among communities (Weinstein et al., 2014; Nakamura et al., 2017, 2021; Li F. et al., 2021; Li Z. et al., 2021). Thus, metacommunity approaches can also use functional and phylogenetic beta diversity to complement taxonomic beta diversity to provide additional insights and a more complete diversity picture (Anderson et al., 2011; Leibold and Chase, 2017; Cai et al., 2019; Jia et al., 2020).
Riverine fishes provide a unique study system for testing metacommunity concepts. The dendritic structure of river networks restricts movement of fishes to the stream network (Brown and Swan, 2010; Tonkin et al., 2018). This framework creates a dual habitat-connectivity gradient in which (a) some headwater streams contain more isolated communities and thus are more prone to the effects of species sorting and stochastic effects, and (b) other headwaters with similar habitats are well connected to mainstem rivers resulting in a greater influence from dispersal processes (Brown and Swan, 2010; Hitt and Angermeier, 2011; Heino et al., 2015a; Henriques-Silva et al., 2019). Moreover, watersheds are arranged hierarchically; small watersheds are nested within larger watersheds separated by discrete spatial boundaries caused by mountainous and marine areas, creating discrete spatial units for delineating metacommunities as statistical units in large-scale analyses (Jelinski and Wu, 1996; Patrick and Yuan, 2019). While watershed boundaries create distinct dispersal barriers for fishes that naturally delineate metacommunities, data availability or constraints often lead researchers to delineate metacommunities based on other features such as political boundaries or natural geomorphic breaks across the landscape such as ecoregions (Cai et al., 2019; Henriques-Silva et al., 2019; Lech and Willig, 2020). However, few studies have investigated how the choice of spatial delineation may affect the outcome and interpretation of results. Conducting separate analyses on the same dataset with different delineation scenarios representative of existing metacommunity studies will provide important methodological context for conducting metacommunity analyses.
In this study, we used an extensive stream fish abundance dataset covering the state of South Carolina, USA, to quantify variation in the three dimensions of beta diversity attributable to spatial, natural environment, and anthropogenic effects. Our first objective was to quantify variation in stream fish taxonomic, functional, and phylogenetic beta diversity. We expected to see more explained variation in functional and phylogenetic beta diversity because of the association between species traits and common resource utilization. Additionally, relatedness between those traits may be masked by taxonomic diversity in functionally redundant communities (Leibold and Chase, 2017; Gianuca et al., 2018; Cai et al., 2019). Our second objective was to measure the relative variation explained by spatial, natural environmental, and anthropogenic variables. We expected that the use of anthropogenic variables more specific than land use would explain appreciable amounts of variation in all three beta diversity dimensions because of the extensive alterations to stream systems in South Carolina in recent centuries (Allan, 2004; Walters et al., 2005; Wenger et al., 2008; Marion et al., 2015; Langerhans and Kern, 2020). We conducted analyses for these objectives separately for three different spatial delineations: one based on the entire state, one based on a natural geomorphic ecoregion break, and one based on discrete watershed boundaries. In doing so, we highlight the importance of a priori methodological decisions when conducting beta diversity analyses.
Located in the southeastern United States, the state of South Carolina contains five level III ecoregions: The northwestern part of the state (thereon referred to as the upstate) comprises the Blue Ridge to the far northwest corner and the Piedmont to the east. The southeastern part of the state (thereon referred to as the lowlands) comprises the Southeastern Plains, Middle Atlantic Coastal Plains, and Southern Coastal Plain (Figure 1; Omernik, 1987). The division between the Piedmont and Southeastern Plains, referred to as the fall line, divides streams into two distinct types (Paller, 1994): upstate and lowland streams. Upstate streams (above the fall line) have well defined channels with stable flow, which contain heterogenous habitat with riffles, runs, glides, and pools containing a mixture of sand and coarse substrates (Wallace et al., 1992; Denison et al., 2021a,b). A broad transitional zone containing relatively steep elevational change separates the upstate and lowland streams. Lowland streams (below the fall line) tend to be poorly defined with more unstable flow regimes and are more homogeneous with habitats characterized by pools, runs, and fine substrates (Paller, 1994; Rohde et al., 2009; Marion et al., 2015). Because of these geomorphic differences, and the fact that the upland rivers have been isolated from each other over longer evolutionary time, fish metacommunities above and below the fall line differ taxonomically. Due to watershed separation, fish assemblages in different upstate watersheds contain more phylogenetically related species causing them to be more taxonomically different but functionally similar. In contrast, lowland streams contain a greater number of shared species due to watershed connection during colonization following over bank flooding events and more recent hydrologic connectivity associated with sea level rise and fall (Rohde et al., 2009).
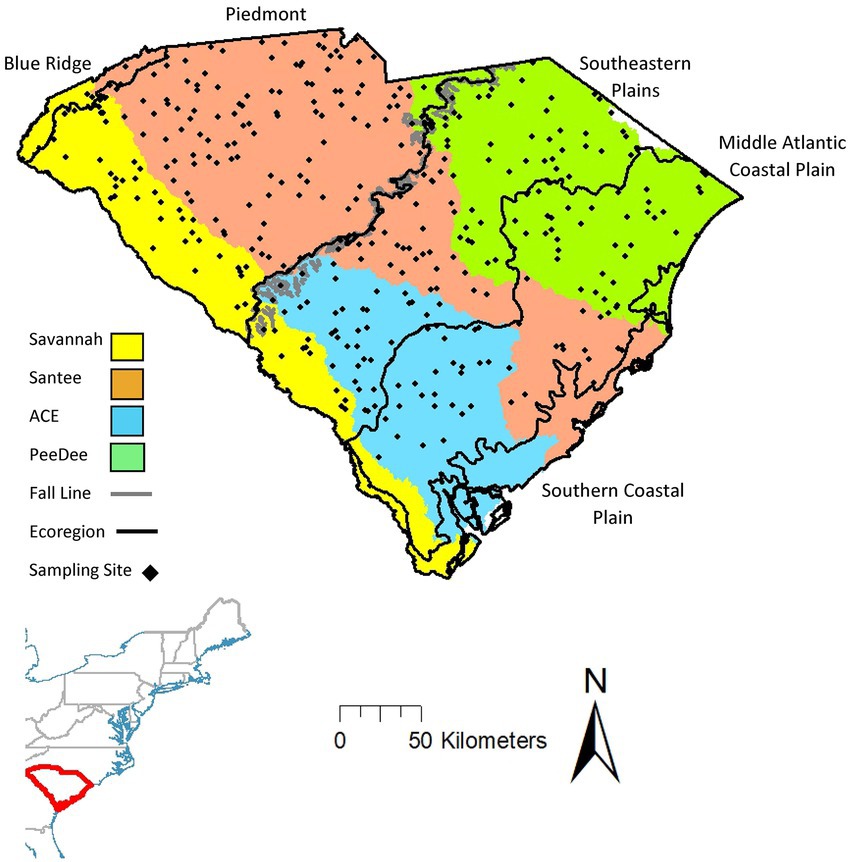
Figure 1. South Carolina, USA with sampling site locations and watershed color delineations used in analysis. The fall line crosses through the middle of the state and divides streams into two distinct types: with the upstate to the northwest and lowland to the southeast.
Researchers from the South Carolina Department of Natural Resources (SCDNR) collected stream fish abundance data during the summers of 2006–2011 as part of the small stream assessment program (Figure 2A). Detailed methods can be found in Scott et al. (2009), but briefly, sites were selected randomly from streams across the state to proportionally represent all ecoregions and river basins. All samples were collected using backpack electrofishing. Sites sampled above the fall line used one electrofishing pass equal to 30 times the average wetted width (m) with most habitats sampled in an upstream direction while an 2.5–3 m seine with mesh size 6.4 mm was used to more effectively capture benthic species in riffles habitats. Sites below the fall line were sampled using three electrofishing passes with a reach length equal to 20 times the average stream width. Average total effort with standard deviation was 5361.04 ± 3791.36 s, 1.95 ± 0.95 number of passes, and 121.92 ± 42.73 meters of sampled distance. Fishes were netted, measured, identified to the species level, and then returned to the stream (Scott et al., 2009). This dataset has been used in other studies to identify statewide community patterns (Marion et al., 2015; Denison et al., 2021a,b; Bower et al., 2022). The dataset contains 350 sites representing 101 species from 51 genera, 17 families, and 14 orders.
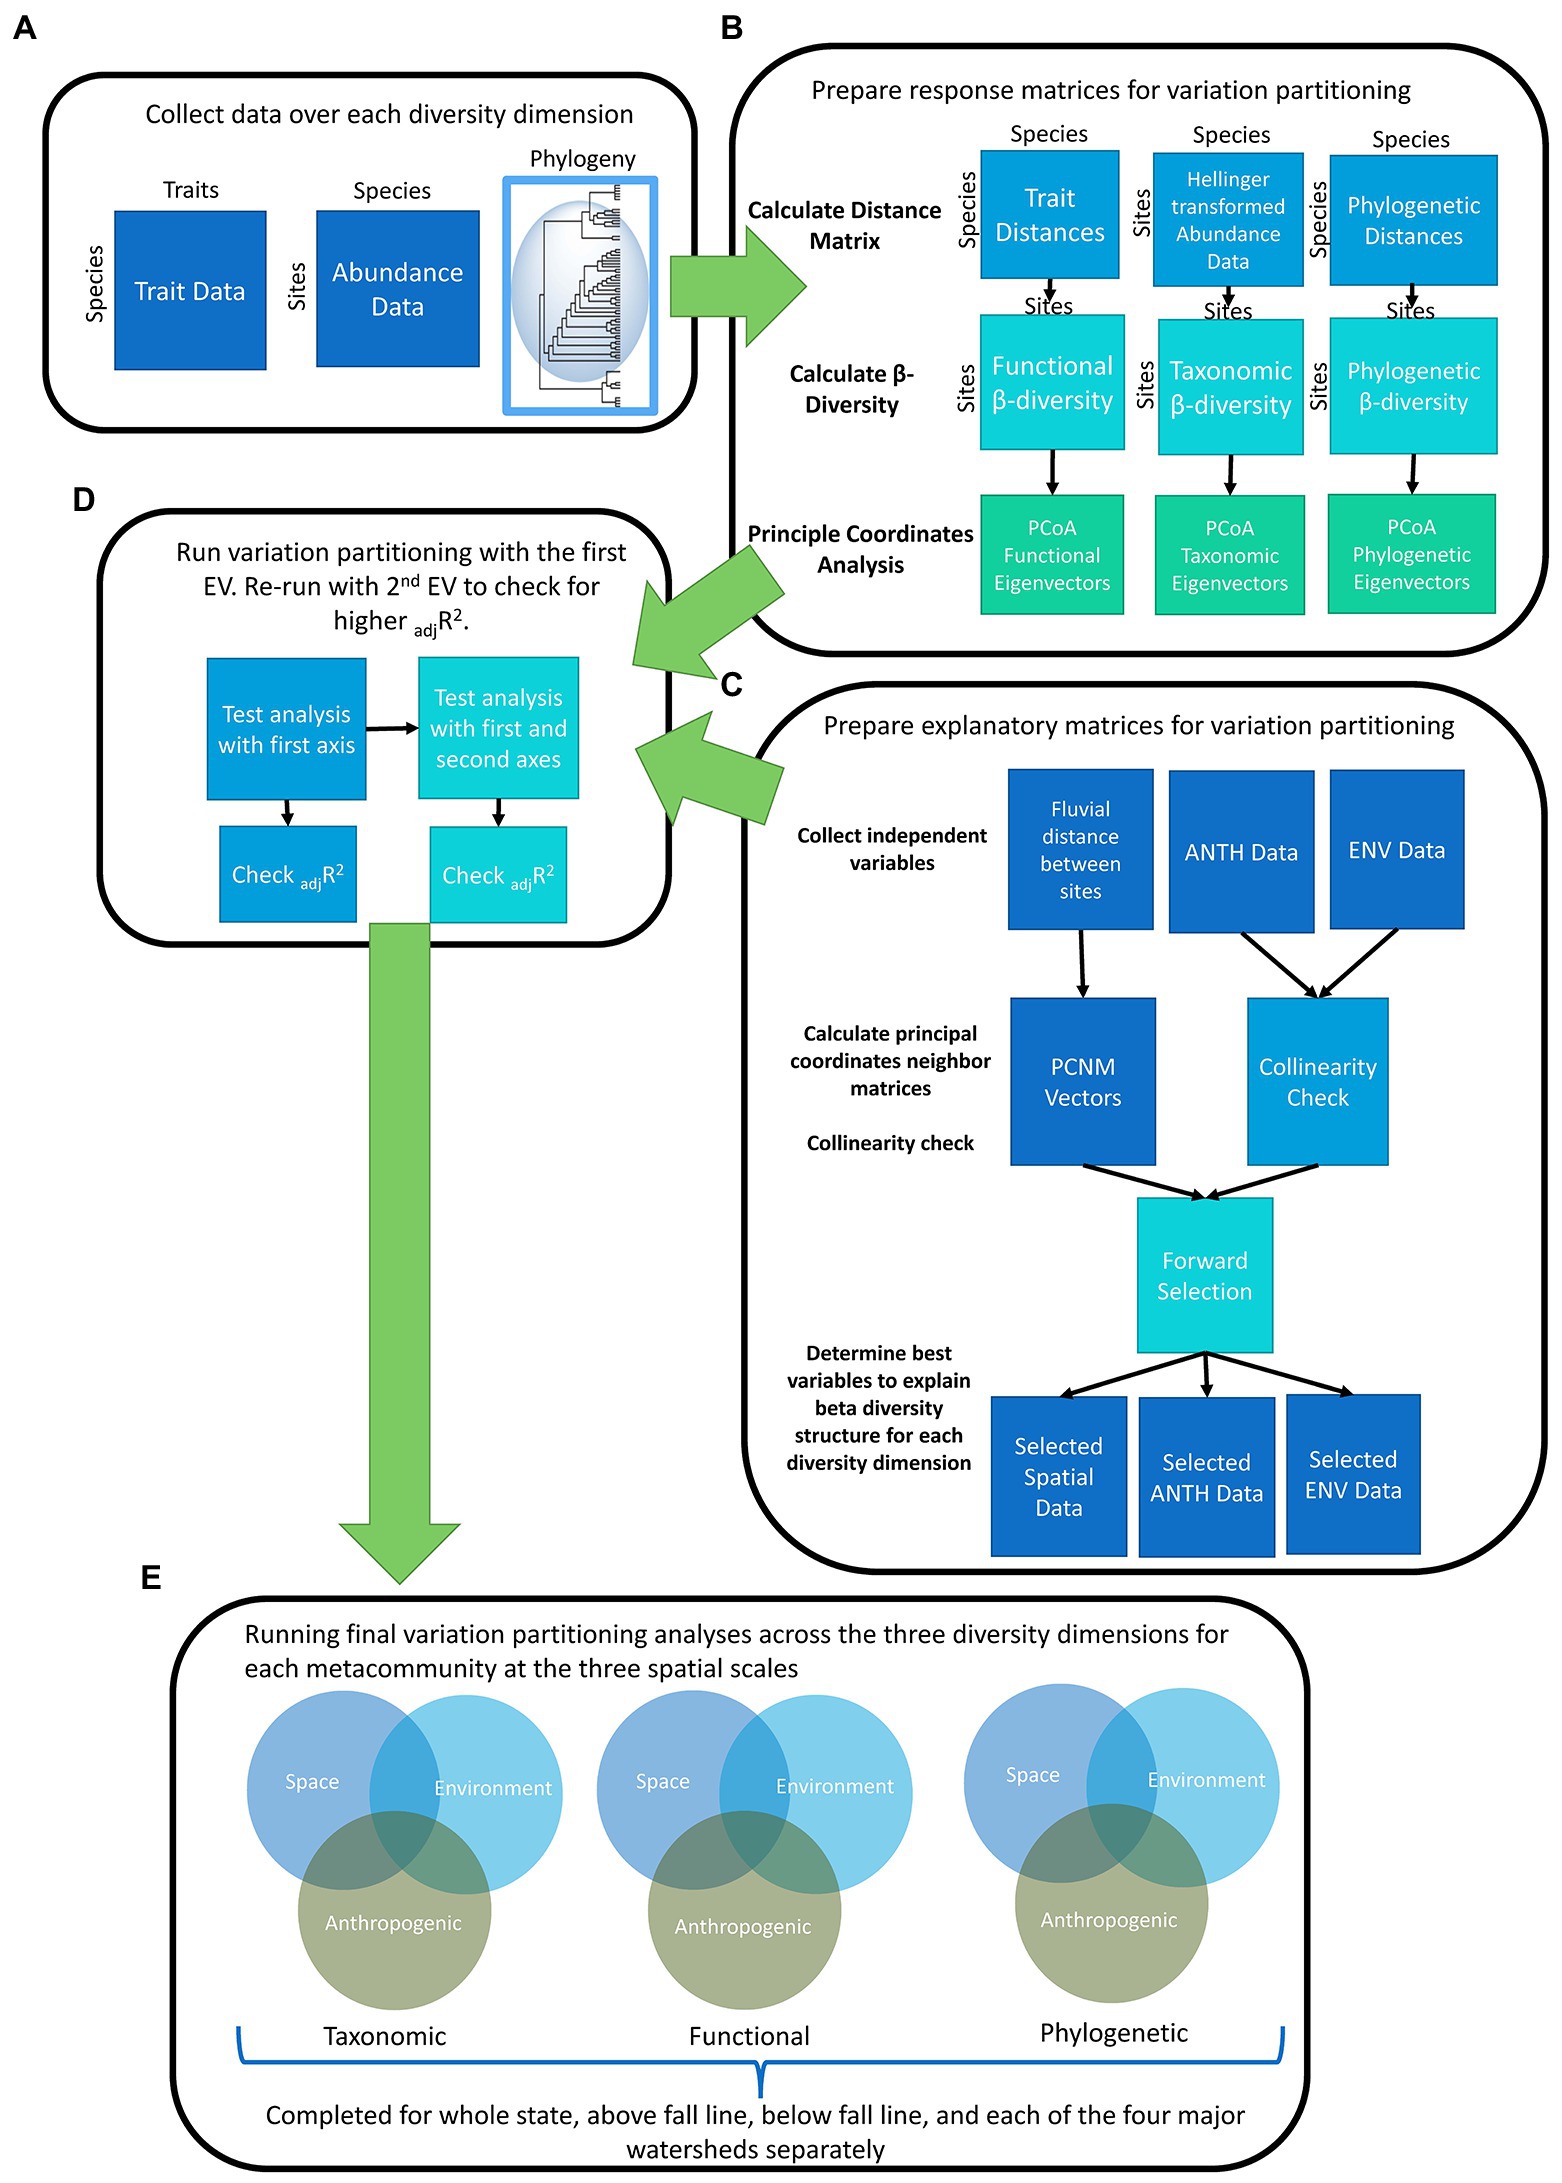
Figure 2. Flowchart for statistical analysis completed by collection of stream fish abundance data (A), preparation of response (B) and explanatory matrices (C), preparation for variation partitioning (D), and final variation partitioning run (E) over our spatial delineations and diversity dimensions. ANTH, anthropogenic; ENV, Natural Environmental; PCNM, Principal coordinate neighbor matrices; EV, Environmental Variable.
We collected 16 available traits using the FishTraits database (Frimpong and Angermeier, 2009; Table 1), and calculated shape factor (body depth/body length) and swim factor (caudal peduncle depth/caudal fin depth) using high quality fish images (Supplementary Table S1 and Figure 2A). Traits were chosen to ensure we were capturing as much of a species’ niche dimension as possible. The use of traits covering many niche dimensions provides an overview of community structure (Trisos et al., 2014; Fitzgerald et al., 2017). Traits such as shape and swim factor provide information on habitat niche dimension and dispersal capabilities (Lamouroux et al., 2002; Sagnes and Statzner, 2009; Pease et al., 2012). Any gaps in fish traits were filled in through literature searches of the species in question or the nearest relative (Near et al., 2011), and if literature searches failed to provide information (few cases), then we used the ‘missForest’ package (Stekhoven, 2011) in R version 4.0.2 (R Core Team, 2021) to impute the missing trait values using those trait values from individuals within the same genus. This approach was only used for a handful of traits within a few species. The ‘missForest’ package uses random forest models to predict and impute missing data based on relationships within that fish family. Imputations relied on 1,000 iterations and 100 trees to fill in the few missing traits.
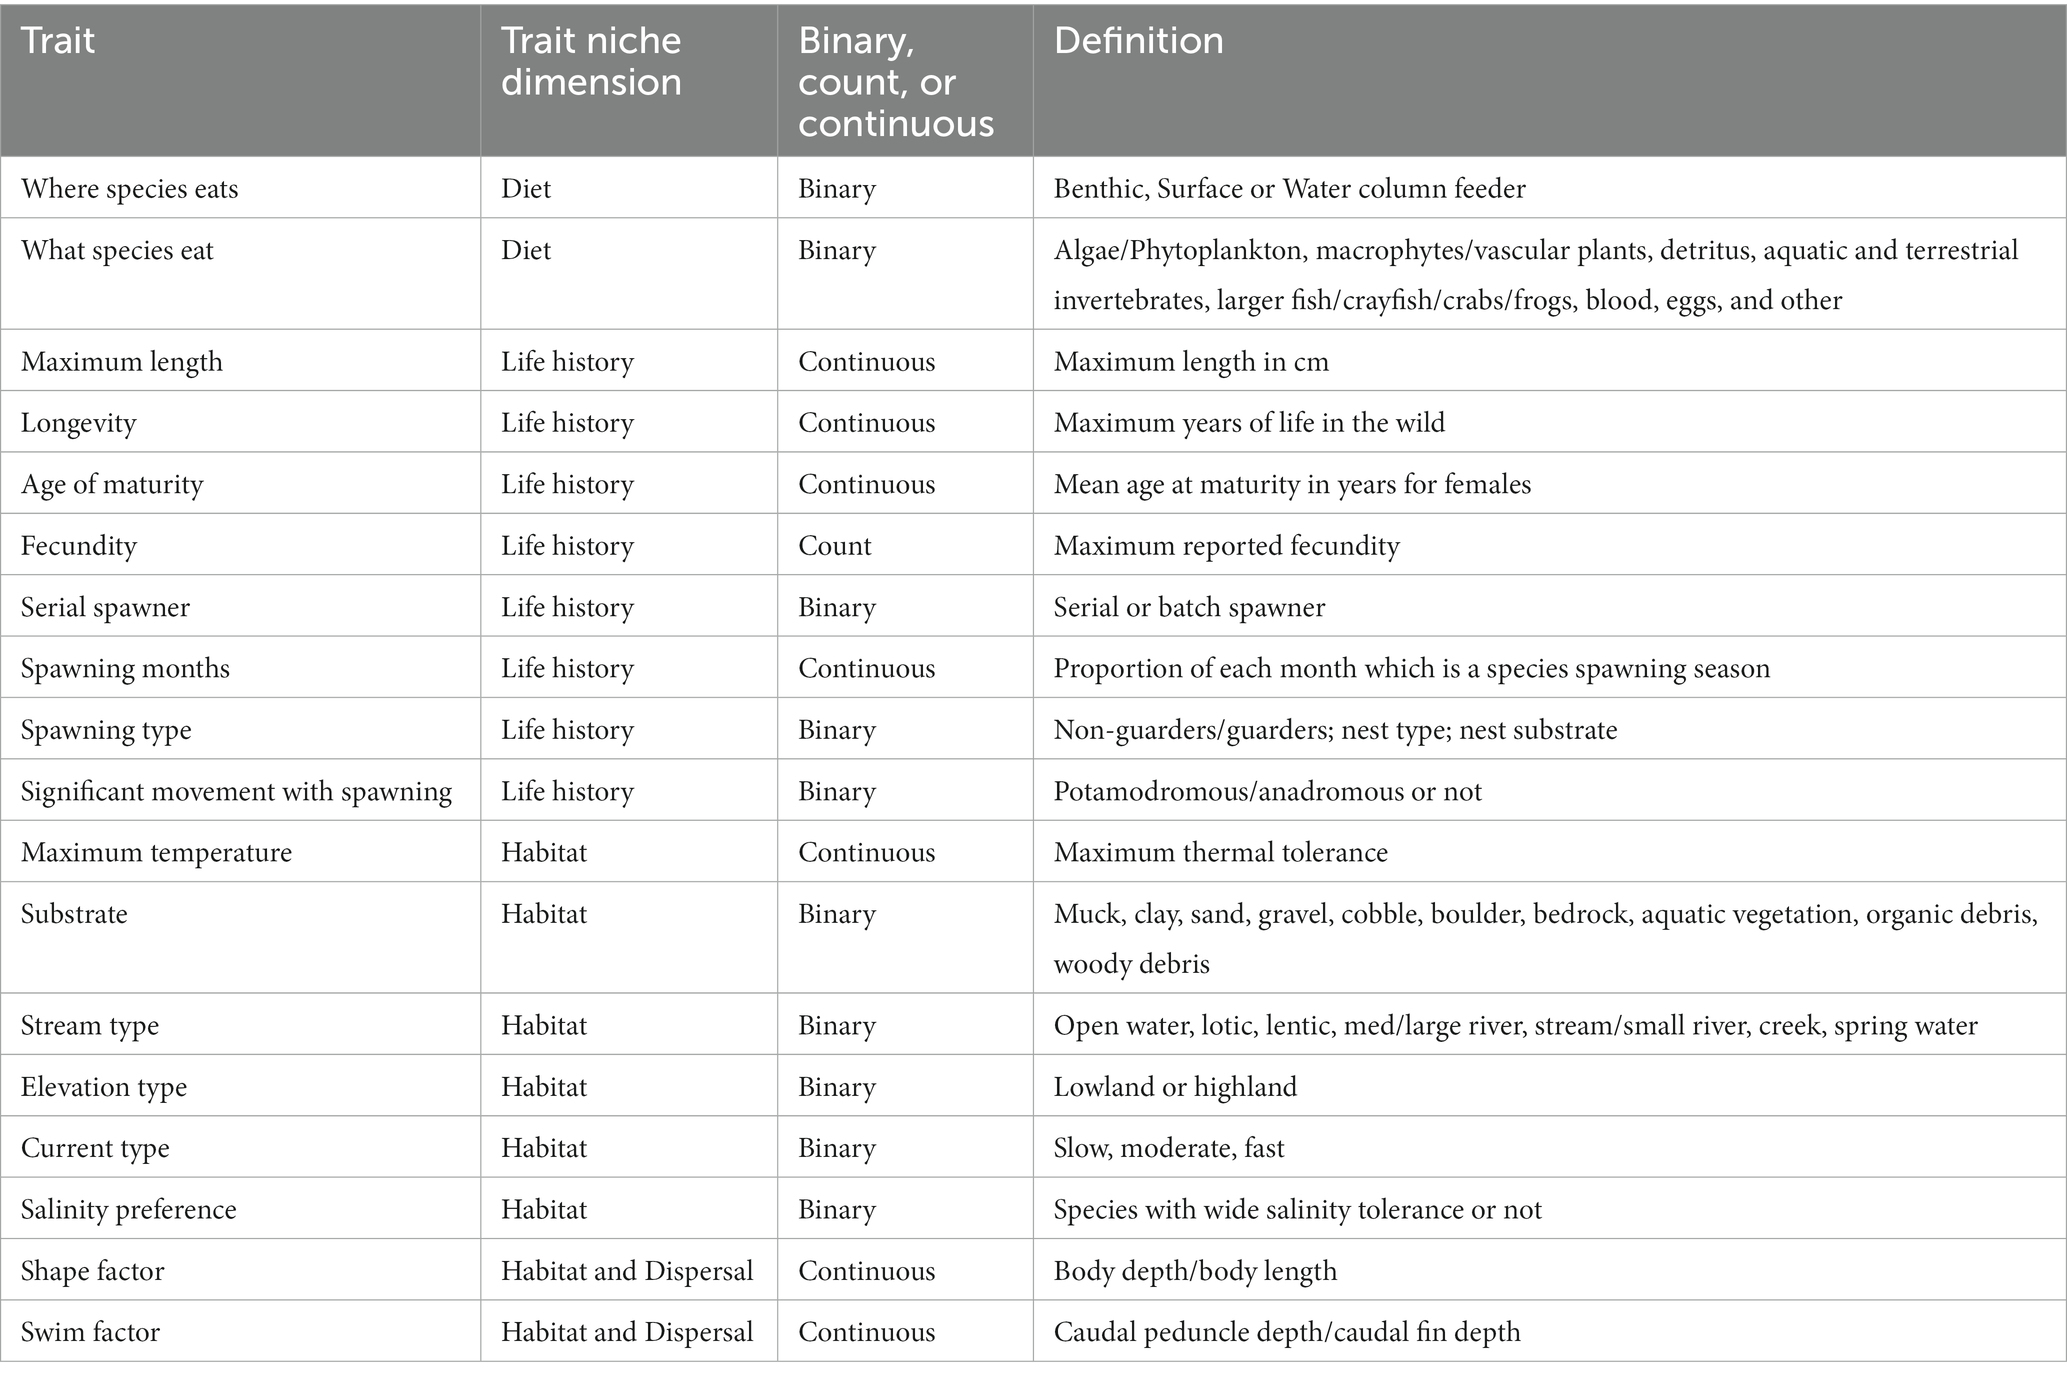
Table 1. Fish traits used for calculating functional beta diversity.
The phylogenetic tree used for our study was trimmed from an extensive phylogeny of Actinopterygii, the class containing the majority of fish diversity (Rabosky et al., 2018; Figure 2A). Two species were manually added to the tree, Notropis cummingsae (Myers, 1925) and Pteronotropis stonei (Fowler, 1921), from reading relevant phylogenetic research (Hollingsworth et al., 2013; Mayden and Allen, 2015). This tree contains phylogenetic distances along the branch lengths and can thus be used to calculate phylogenetic distance among species. The trimmed tree is rooted at the ancestor between the outgroup of the Neopterygiian Bowfin (Amia calva; Linnaeus, 1766) and Spotted Gar (Lepisosteus osseus; Linnaeus, 1758), which represent the two most ancestral members of Actinopterygii, relative to other species (Supplementary Figure S1).
We calculated a response matrix for fish beta diversity in each diversity dimension (taxonomic, functional, and phylogenetic; Figure 2B). We first Hellinger transformed fish abundance data (Legendre and Gallagher, 2001). We then calculated Bray-Curtis taxonomic beta diversity for all pairs of sites using the beta.pair.abund function in the ‘Betapart’ package (Baselga and Orme, 2012). We used Bray–Curtis dissimilarity because this beta diversity metric is widely used with abundance data and is the most robust to taxonomic error and geographic undersampling (Schroeder and Jenkins, 2018). We calculated functional distances (species x species matrix) with the gowdis function in the ‘FD’ package (Laliberté et al., 2010) for all trait variables using Gower distance because we have a mixture of continuous and categorical traits. We calculated phylogenetic distances (species x species matrix) using the cophenetic.phylo function in the ‘ape’ package (Paradis and Schliep, 2019). We weighted the phylogenetic and functional distances by the Hellinger transformed abundance data (site x species matrix) to calculate for pairwise functional and phylogenetic beta diversity (site x site matrix) for all sites using the comdist function from the ‘picante’ package (Kembel et al., 2010). We conducted principal coordinate analysis (PCoA) for each beta diversity matrix (response matrices) using the pcoa function from the ‘ape’ package to have all data in a similar reduced dimensionality format for variation partitioning using Bray Curtis dissimilarity (Zhang et al., 2021). Using all axes of the PCoA could lead to bias interpretation of the results, so we limit variation partitioning to the first and second axes. To visualize beta diversity in the diversity dimensions, red, green, blue (RGB) color plots were produced using the metaMDS function from the ‘vegan’ package to first perform nonmetric multidimensional scaling (NMDS) followed by the recluster.plot.sites.col function from the ‘recluster’ package (Dapporto et al., 2013), to place sites in the RGB color space. Similar colors indicate sites with similar species composition, as colors become more distinct the beta diversity between those two sites increases.
Water quality measurements, collected at each site on the date of fish sampling, included water temperature (°C), dissolved oxygen (mg/L), conductivity (μs/cm), pH, and salinity (ppm), while a turbidimeter measured turbidity (NTU). Water quality measurements were taken from the area of representative flow and from the middle of the water column (Scott et al., 2009). Instream habitat was also measured on the date of fish sampling; details for the protocols are found in Scott et al. (2009). Briefly, researchers measured depth (m), current velocity (m/s), and substrate type and diameter (mm) along 50 points in the sample transect after community assessment and calculated an average site value for each measurement. These habitat measurements were taken from equal portions of instream habitat types (runs, riffles, and pools). Current velocity was measured at 60% of the depth from the surface and 40% from the bottom. Substrate diameter measurements used the Wolman pebble count (Wolman, 1954). Inorganic material was registered as fine clay or sand, bedrock, or measuring particle to nearest mm, while organic material was categorized into one of five categories based on size and substance: fine particulate organic matter, coarse particulate organic matter, fine woody debris, large woody debris, or aquatic vegetation.
The stream-catchment (StreamCat) database maintained by the U.S. Environmental Protection Agency (USEPA) contains environmental and anthropogenic data for stream segments throughout the United States (Hill et al., 2016). StreamCat is linked with the National Hydrology Dataset Plus Version 2 (NHDPlusV2) to obtain natural environmental and anthropogenic variables for the associated catchment or for the full upstream watershed for millions of stream segments in the United States. We linked the StreamCat database with the 350 SCDNR sites to obtain environmental or anthropogenic variables associated with the stream segment each site was located on. Natural environmental and anthropogenic variable definitions, codes, and units can be found in Table 2, and are summarized in Supplementary Table S2.
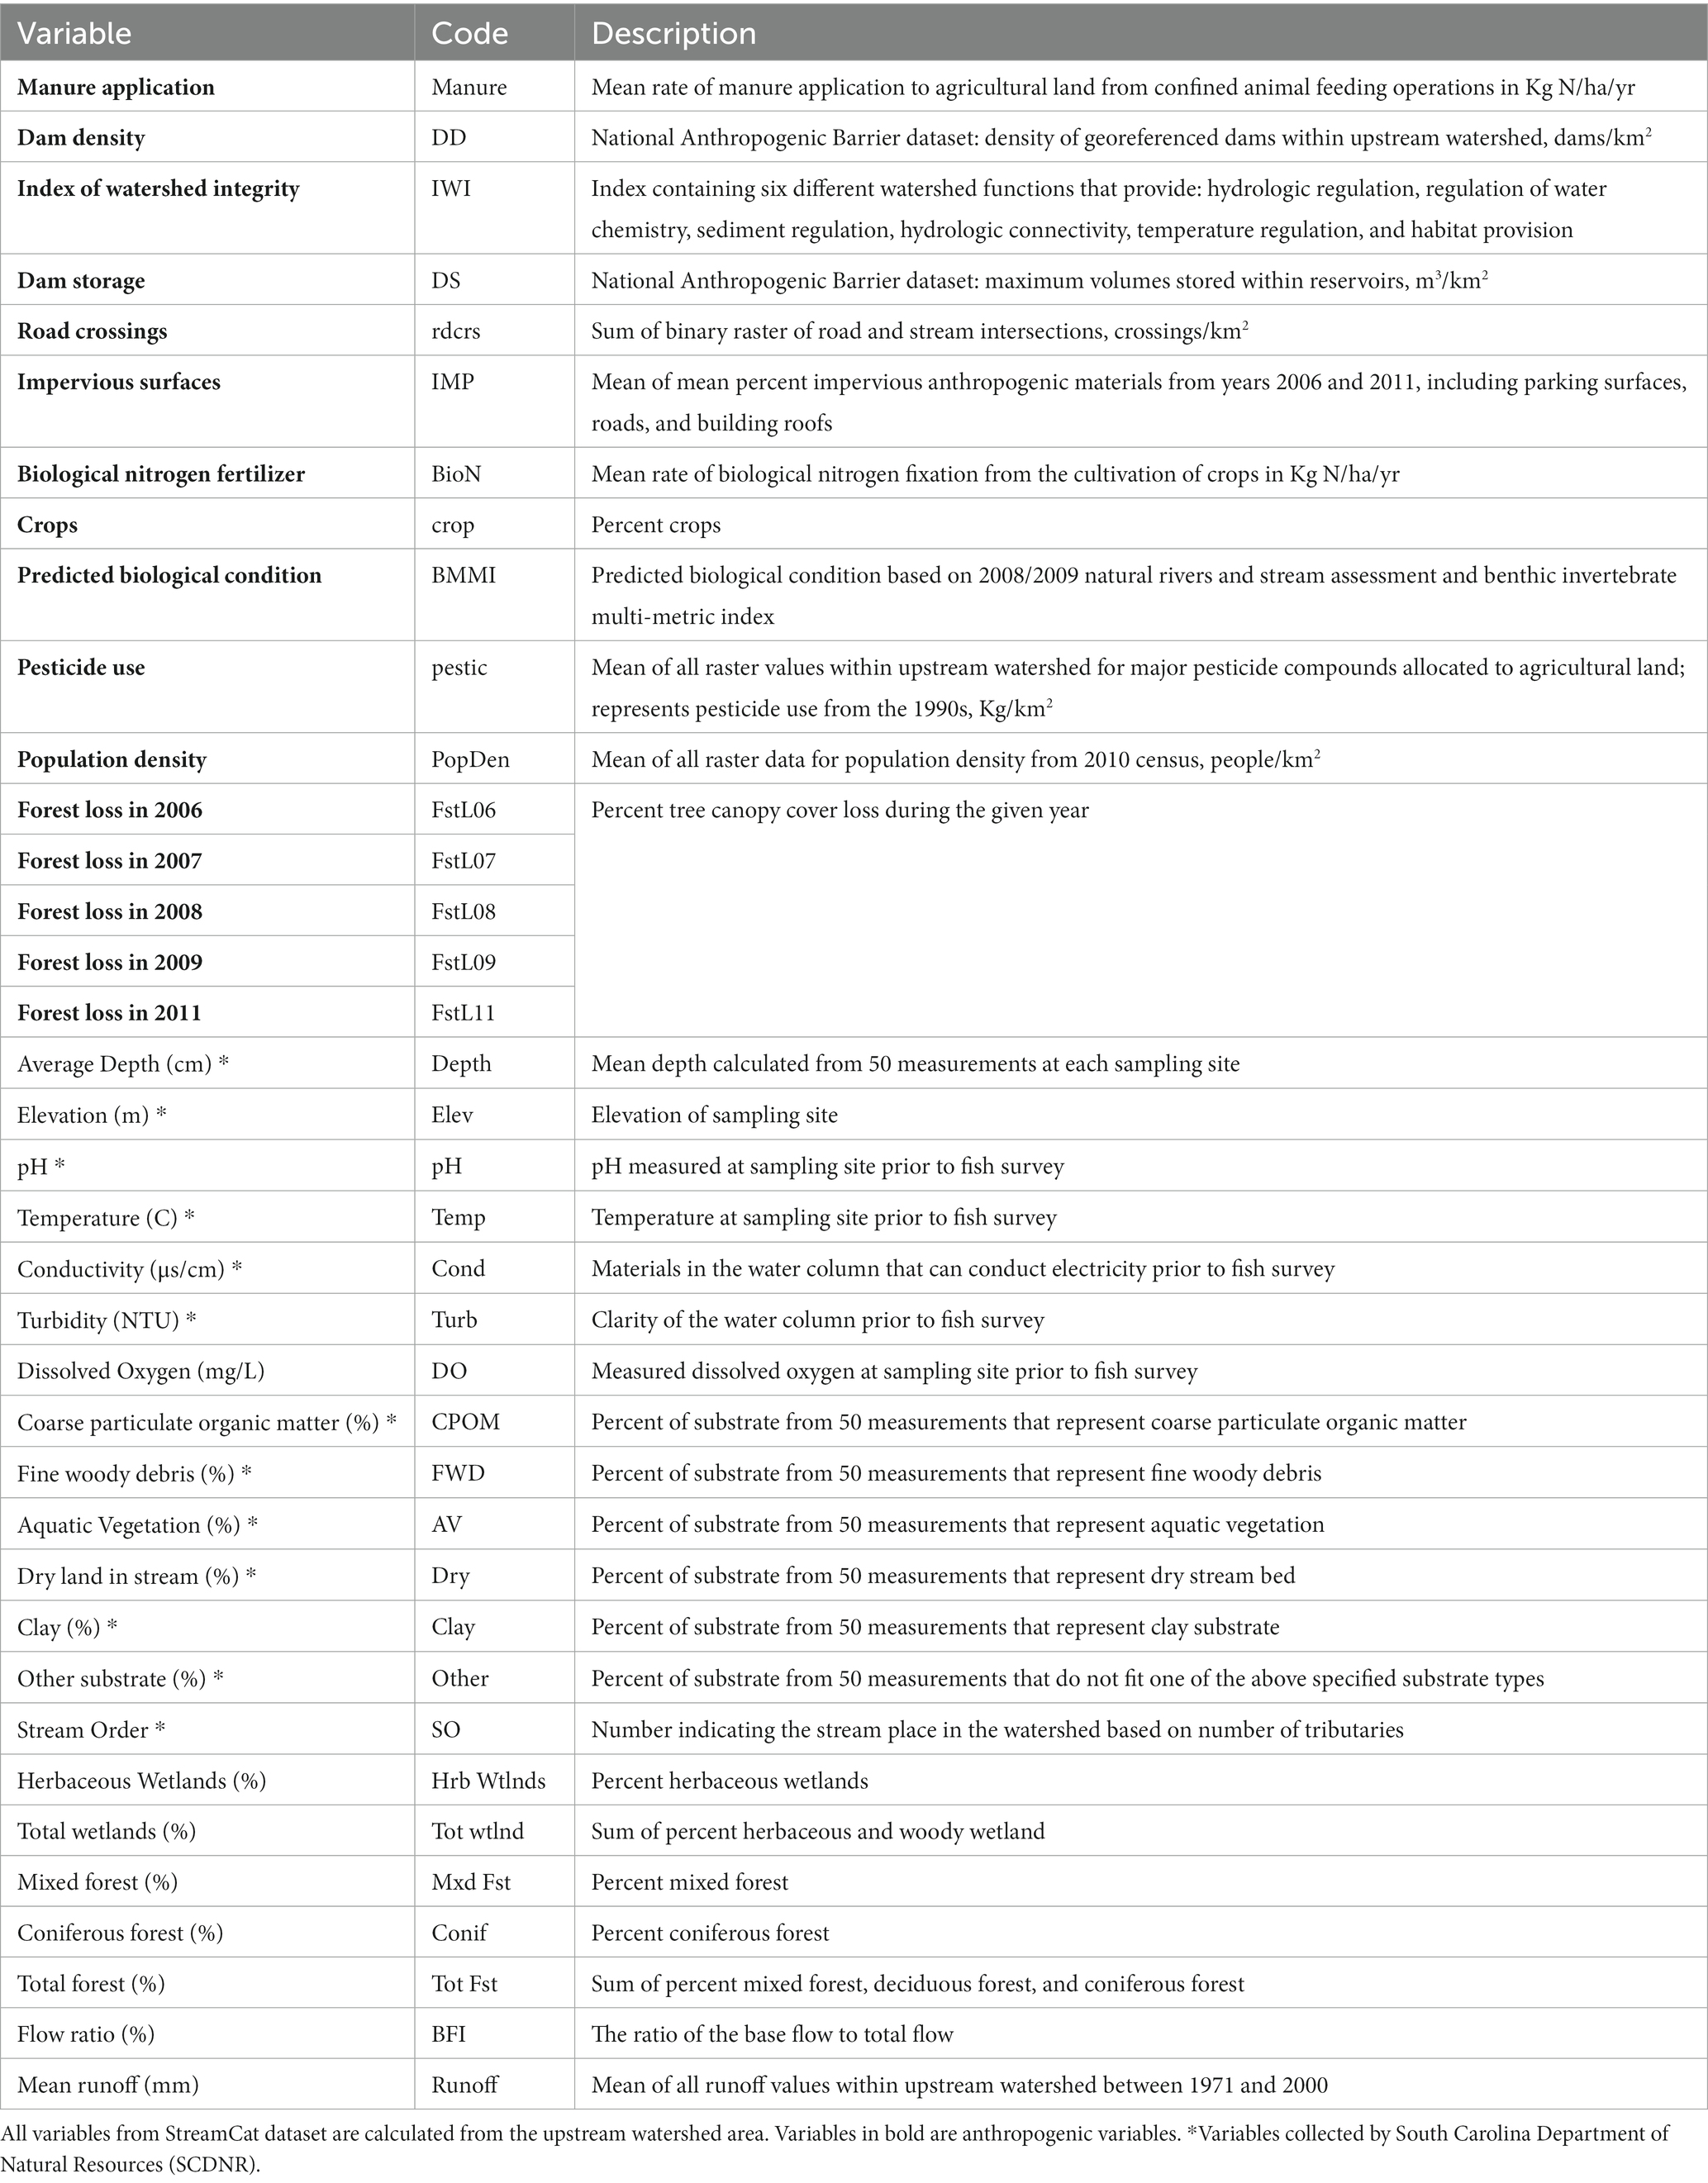
Table 2. Descriptions and codes for selected variables used in analyses of stream fish abundance.
We performed a collinearity check on all anthropogenic and environmental data by (1) performing a variance inflation factor (VIF) check on all variables and (2) finding variable pairs with a correlation of >0.5, followed by one of those variables being removed (Supplementary Table S3). We used forward selection process using the forward.sel function in the ‘adespatial’ package (Dray et al., 2018), to select the variables that explained the most variation in the PCoA axis for each of our metacommunities using a two-stop criterion: the adjR2 value for the global model and the significance value of 0.05 (Blanchet et al., 2008; Figure 2C). Forward selection first finds the explanatory variable that explains the greatest variation (adjR2). Then, the next best variable is found until the combined adjR2 values for all explanatory variables reaches the global adjR2 for each explanatory matrix. Selected natural environment and anthropogenic variables for each metacommunity can be found in Table 3.
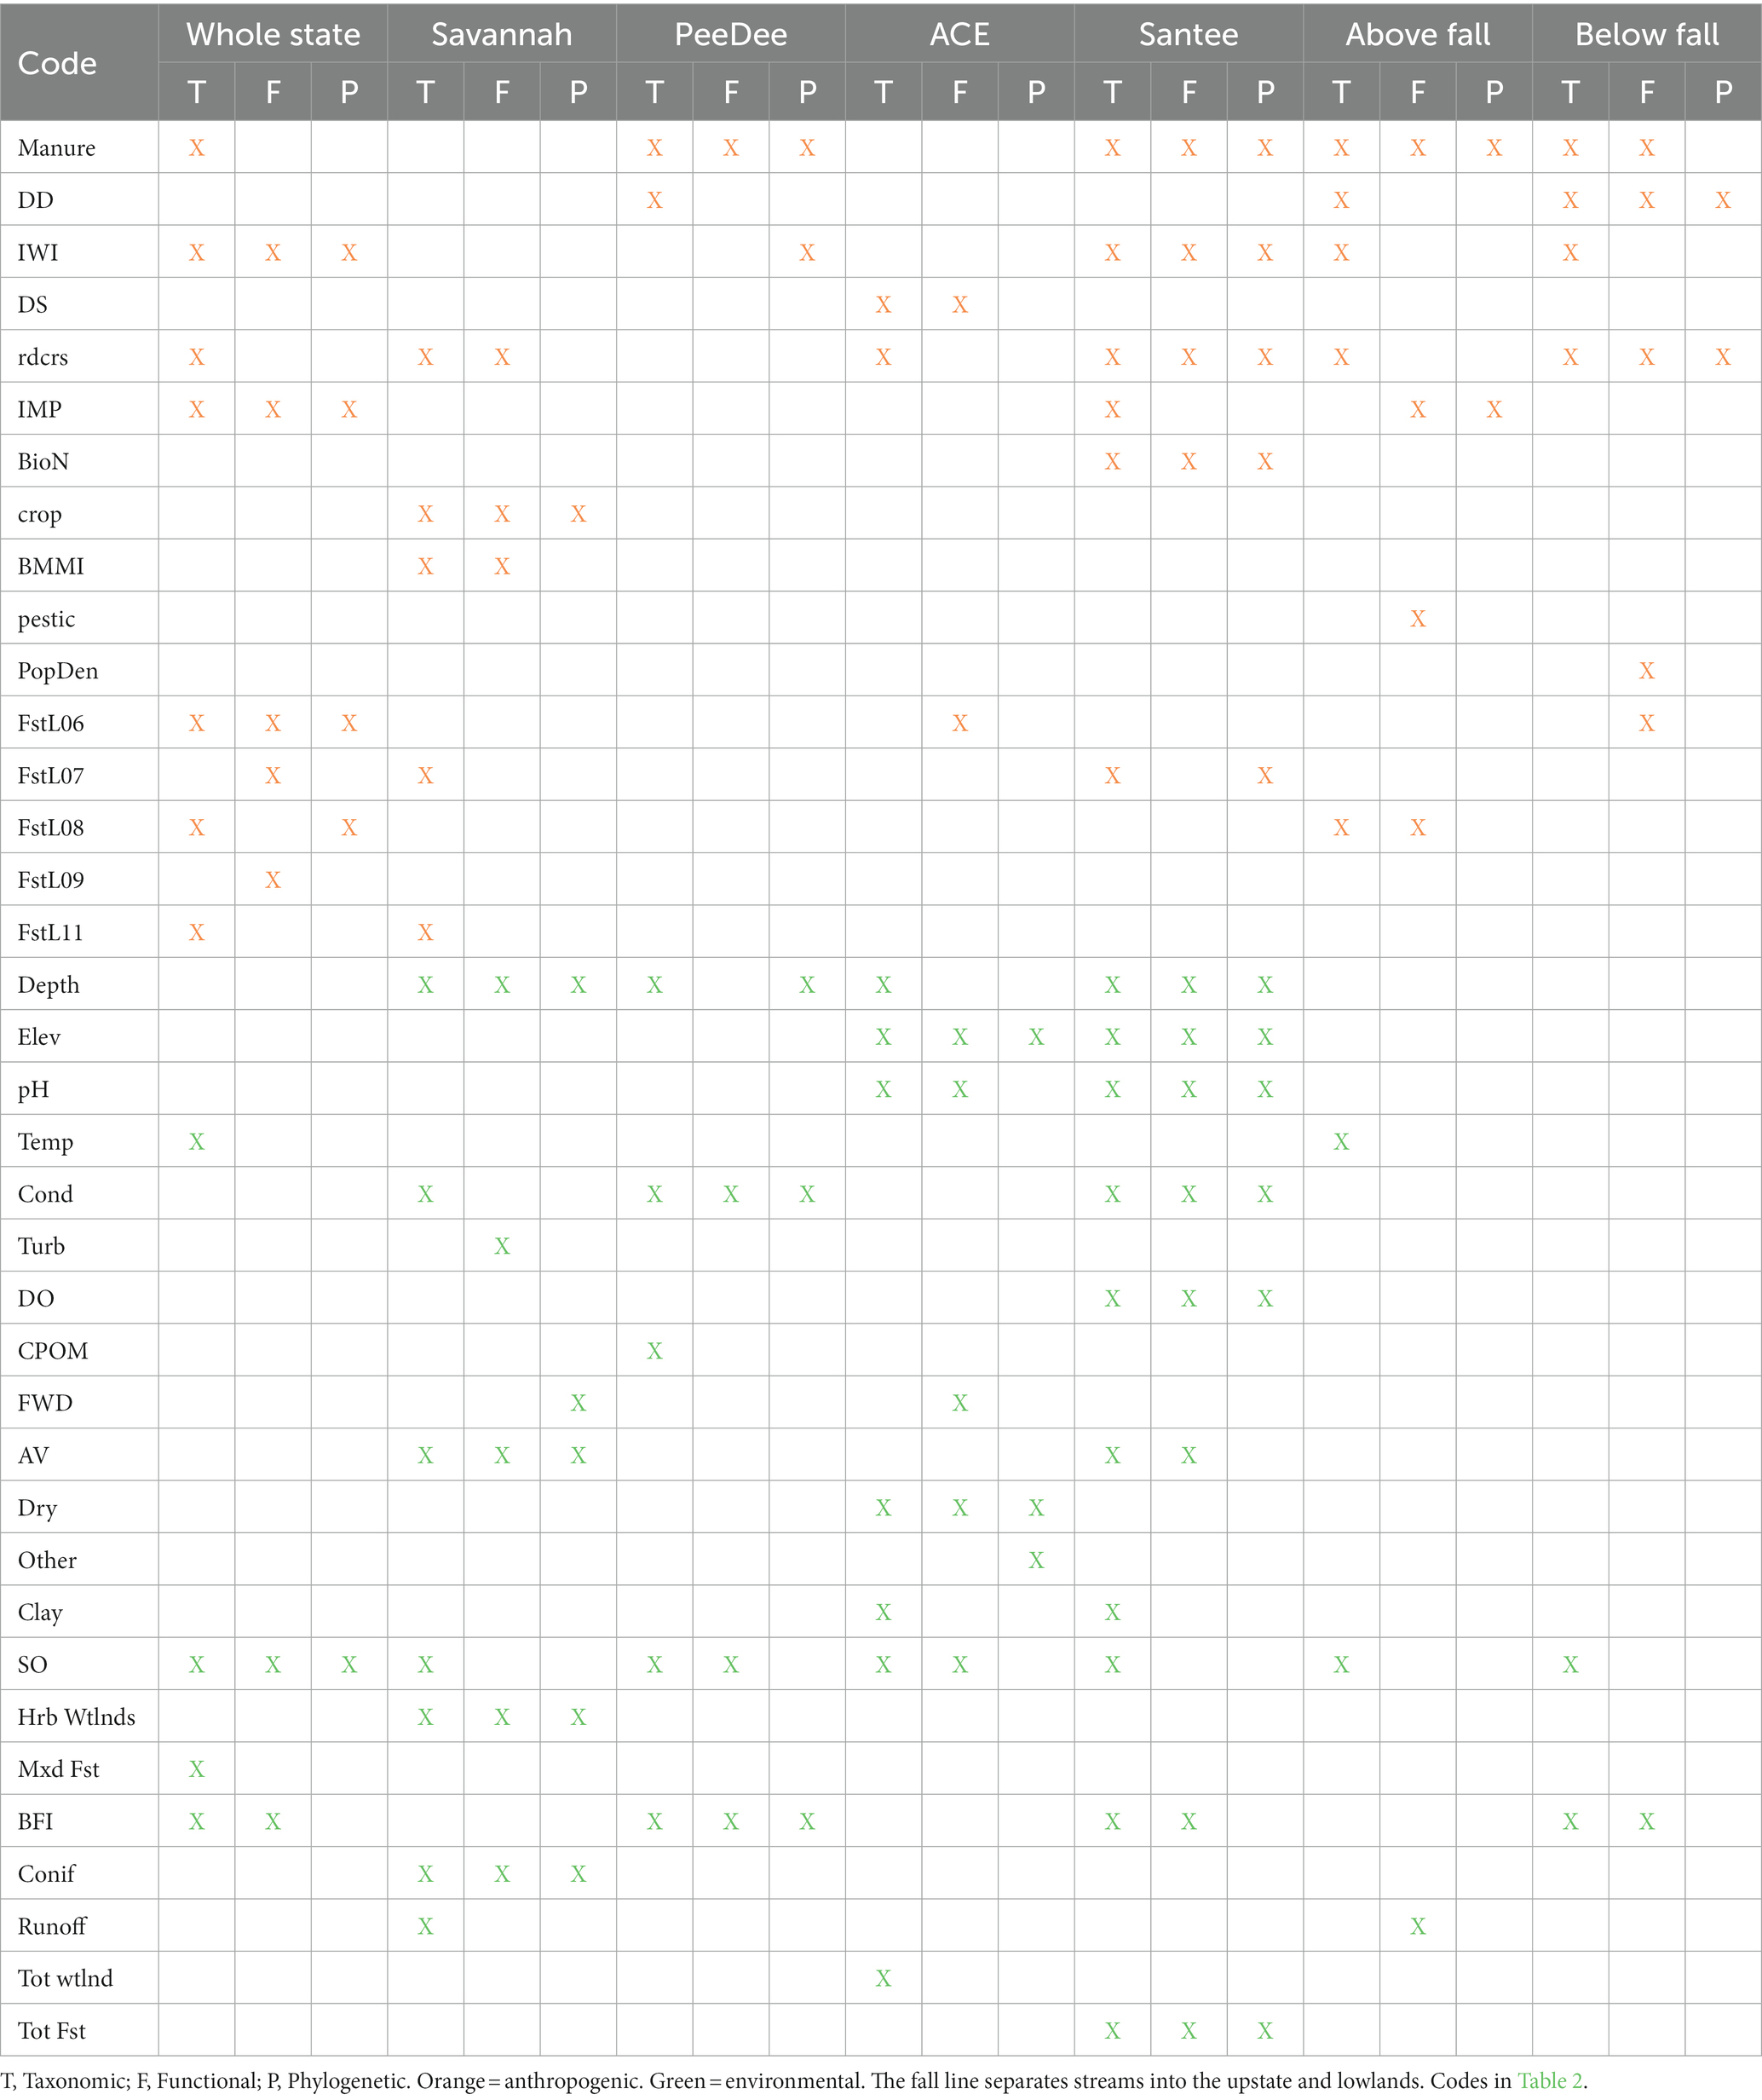
Table 3. Anthropogenic and environmental variables for each diversity dimension and metacommunity sampled from forward selection used in variation partitioning of stream fish abundance.
Vectors from principal coordinate neighbor matrices (PCNMs) define spatial scales, where the first vectors represent the largest spatial structure, and the last vectors represent finer spatial structure (Borcard and Legendre, 2002; Griffith and Peres-Neto, 2006). PCNMs chosen with small values represent large geographic, long temporal time scales. As PCNM number increases, these values indicate smaller geographic time scales including dispersal within a watershed or even between nearby stream reaches. Because of the dendritic layout of watersheds, using Euclidian distances for spatial variables would not produce the most realistic scenario when comparing distance among sites. We used an origin-distance cost matrix within ArcMap 10.6 (ESRI, 2018) to calculate the fluvial distance among sites. We then calculated PCNM vectors using the pcnm function in the ‘vegan’ package (Oksanen et al., 2015). When using PCNM vectors, the use of all vectors can lead to possible misunderstandings in result interpretation, so the appropriate vectors were extracted using forward selection with each of the response matrices in each diversity dimension for the corresponding metacommunity similar to anthropogenic and environmental variables (Figure 2C). Selected spatial variables for each metacommunity can be found in Supplementary Table S4.
We conducted analyses at three different spatial delineations representing logical breaks in the landscape based on natural watershed and geomorphic boundaries, as well as at the whole state level. By delineating our dataset into metacommunities of different spatial sizes, we can understand how stream fish communities are structured by space, natural environment, and anthropogenic variables in metacommunities with different underlying characteristics. The largest delineation analyzed was the whole state, which included all 350 sites and represents an artificially delineated metacommunity because the state boundary of South Carolina crosses both watersheds and ecoregions (Figure 1). While this delineation does not represent a truly natural metacommunity, conducting analyses at this delineation captures any patterns and variability from the entire dataset, offering a regional approach comparable to other studies (Wang et al., 2011; Heino et al., 2018; Cai et al., 2019). We also split the dataset into the four natural metacommunities delineated by watershed boundaries: the Savannah (58 sites); the Ashepoo, Combahee, and Edisto (ACE; 57 sites); the PeeDee (83 sites); and the Santee (152 sites). We also had two metacommunities delineated by the geomorphic properties of the upstate (167 sites) and lowlands (183 sites; Figure 1). All metacommunities designated for the analysis have enough sites to allow for robust analysis (Heino et al., 2015b).
We used adjR2 to determine the number of axes to be used in the variation partitioning (Figure 2D). If the adjR2 value for the first axis was larger than the first and second axes, just the first axis was sufficient to use in the final variation partitioning analysis (Anderson and Willis, 2003; Gianuca et al., 2018). Using only the first PCoA axis showed the highest R2adj value for all RDAs and was thus used for the variation partitioning analysis except for the metacommunity above the fall line, which required the use of the first and second axes to obtain the maximum R2adj value (Table 4). We used variation partitioning to determine the spatial, natural environmental, and anthropogenic variables explaining the most variation in the PCoA axis representing taxonomic, functional, and phylogenetic beta diversity separately for each metacommunity (Figure 2E). Because we used fluvial distance instead of Euclidean distance, we conducted a distance-based redundancy analysis (db-RDA) using the varpart function in the ‘vegan’ package to determine explained variation in our metacommunities.
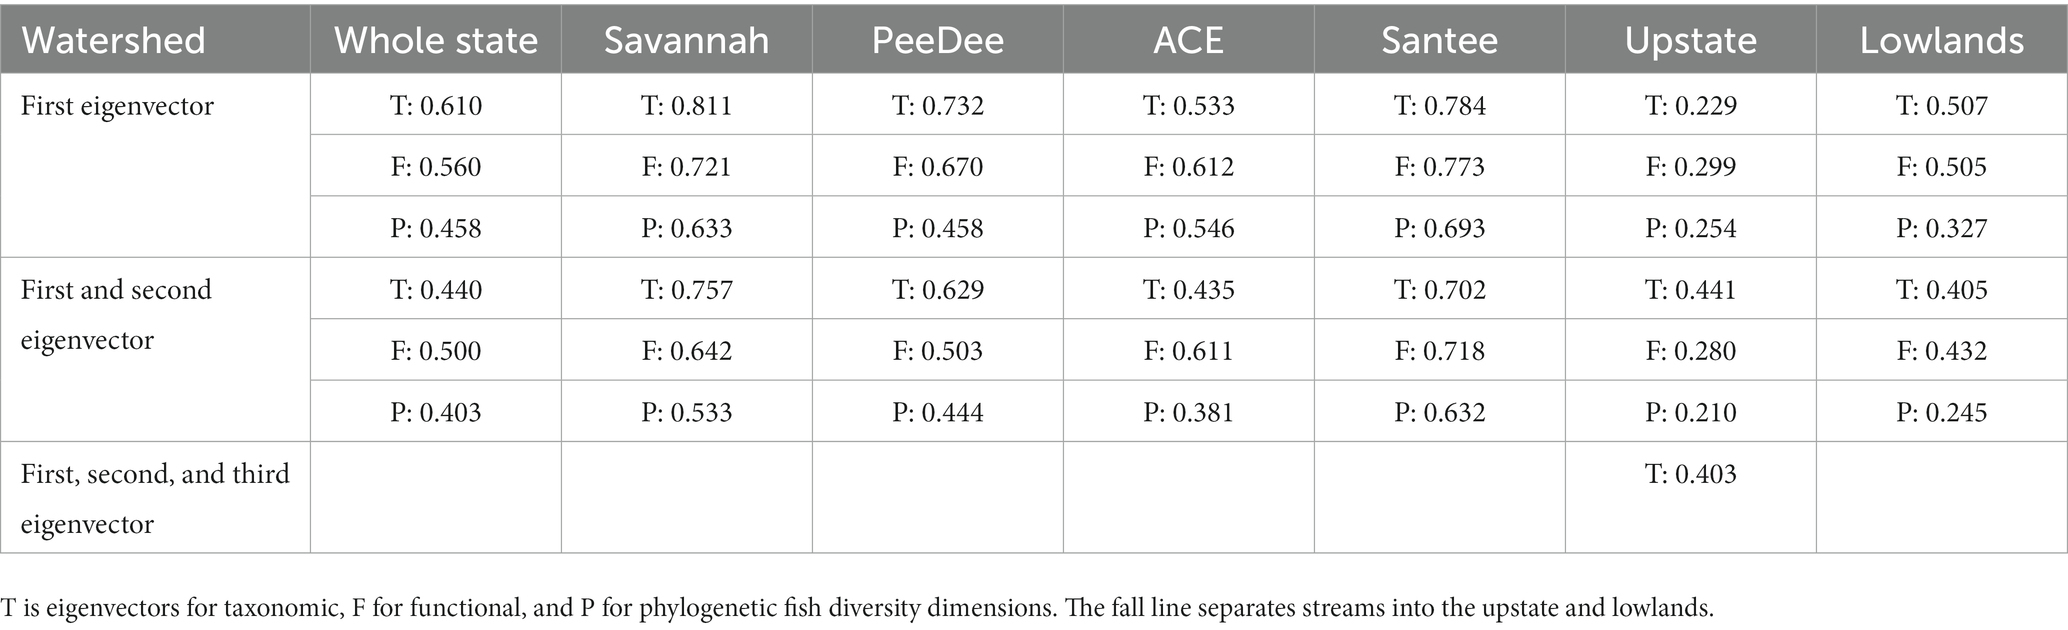
Table 4. Adjusted R2 values for first and second eigenvectors to be used in variation partitioning of stream fish abundance.
Variation partitioning explained 25–81% of variation in stream fish beta diversity, depending on the metacommunity delineation and dimension of beta diversity (Figure 3 and Table 4). All db-RDA analyses resulted in significant explained variance by the explanatory variables (all p-values <0.001; Table 5). We observed a strong phylogenetic signal in our fish traits for each metacommunity (Supplementary Table S5). We found that overall explained variation in stream fish beta diversity, the relative contribution of the three suites of variables to beta diversity, and the contribution of individual variables, all differed depending on how metacommunities were delineated—whether the entire state, above and below the fall line, or based on watershed boundaries. Breaking up our study region into the upstate and lowland metacommunities resulted in the least explained variance; however, the explained variance for anthropogenic portions alone was much higher than when metacommunities were distinguished based on major watersheds or the whole state (Figure 3 and Table 4).
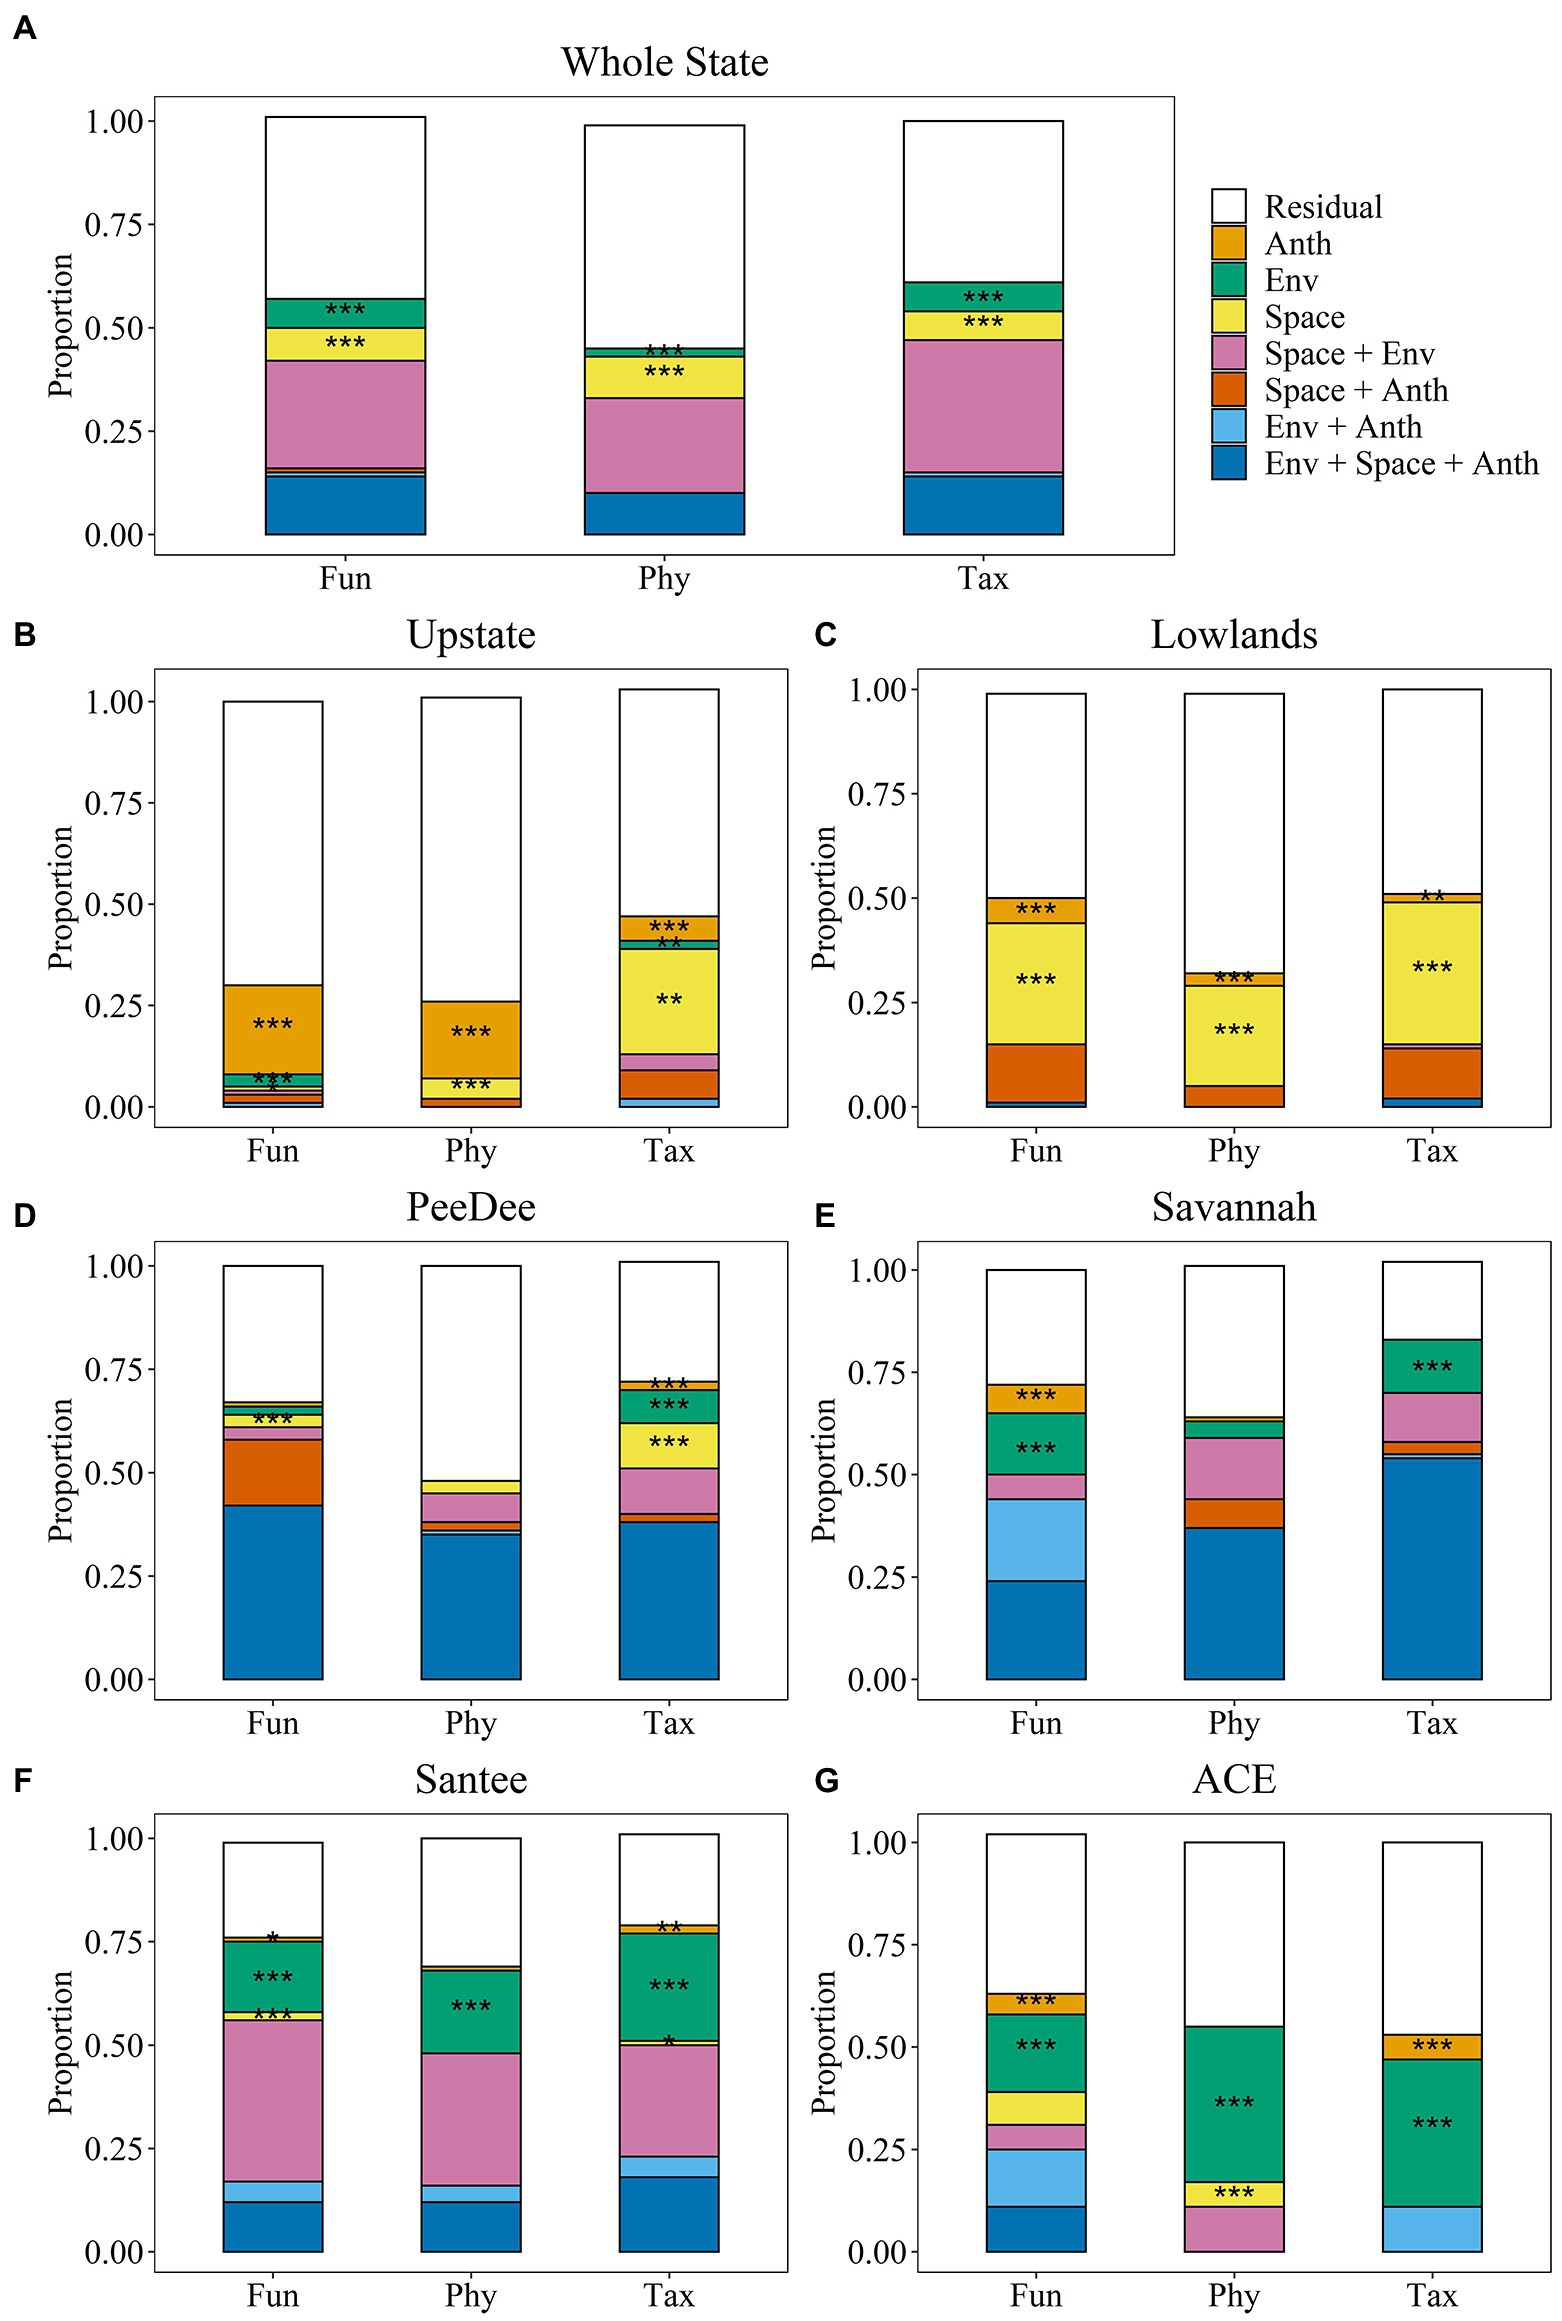
Figure 3. Variation partitioning results for stream fish beta diversity for the whole state (A) delineation, the fall line delineation of the upstate (B) and lowlands (C), as well as the watershed delineations of the PeeDee (D), Savannah (E), Santee (F), and ACE (G) watersheds. Asterisks show significance of the pure fractions of variation partitioning; *p < 0.05, **p < 0.01, ***p < 0.001. ANTH, Anthropogenic; ENV, Natural Environmental. Fun = functional; Phy = phylogenetic; Tax = taxonomic.
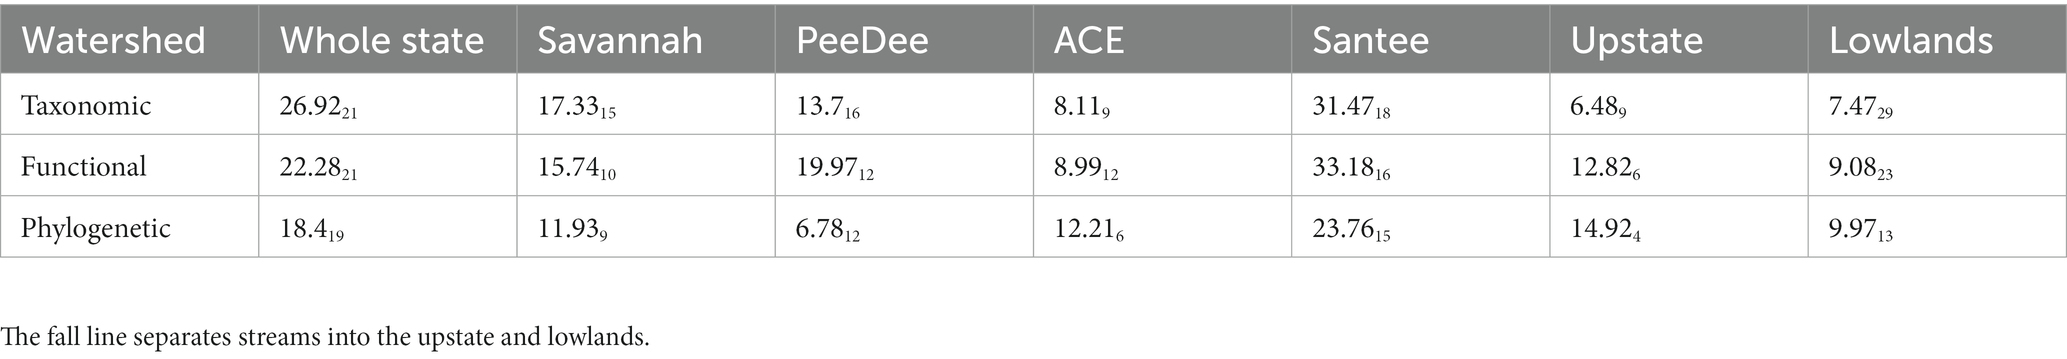
Table 5. Statistics (Fdf) from variation partitioning analysis of stream fish abundance; all whole model p-values were < 0.0001.
Variation in stream fish beta diversity across the whole state was best explained by the pure fractions of environmental (Tax: Fdf = 14.894, p = 0.001; Fun: Fdf = 26.592, p = 0.001; Phy: Fdf = 11.71, p = 0.003) and spatial variables (Tax: Fdf = 6.7410, p = 0.001; Fun: Fdf = 5.7314, p = 0.001; Phy: Fdf = 7.0111, p = 0.001) (Figure 3A). The most total variation was explained in the taxonomic dimension (61%), followed by the functional (56%), and phylogenetic dimensions (46%). The whole state was the only spatial delineation in which we observed no influence of solely anthropogenic variables on stream fish beta diversity for any of the dimensions. All three diversity dimensions were structured by stream order (Table 3). Functional and taxonomic beta diversity were additionally structured by base flow index, while taxonomic beta diversity was also structured by stream temperature and percent of mixed forest within the watershed (Table 3). Spatial vectors explaining beta diversity across each diversity dimension ranged between vectors explaining large and small spatial scales (Supplementary Table S4).
RGB plots showed two distinct regions of taxonomic, functional, and phylogenetic beta diversity roughly separated by the fall line (Figure 4). However, the differences between the upstate and lowland regions of South Carolina in phylogenetic beta diversity were smaller than between the functional or taxonomic dimensions.
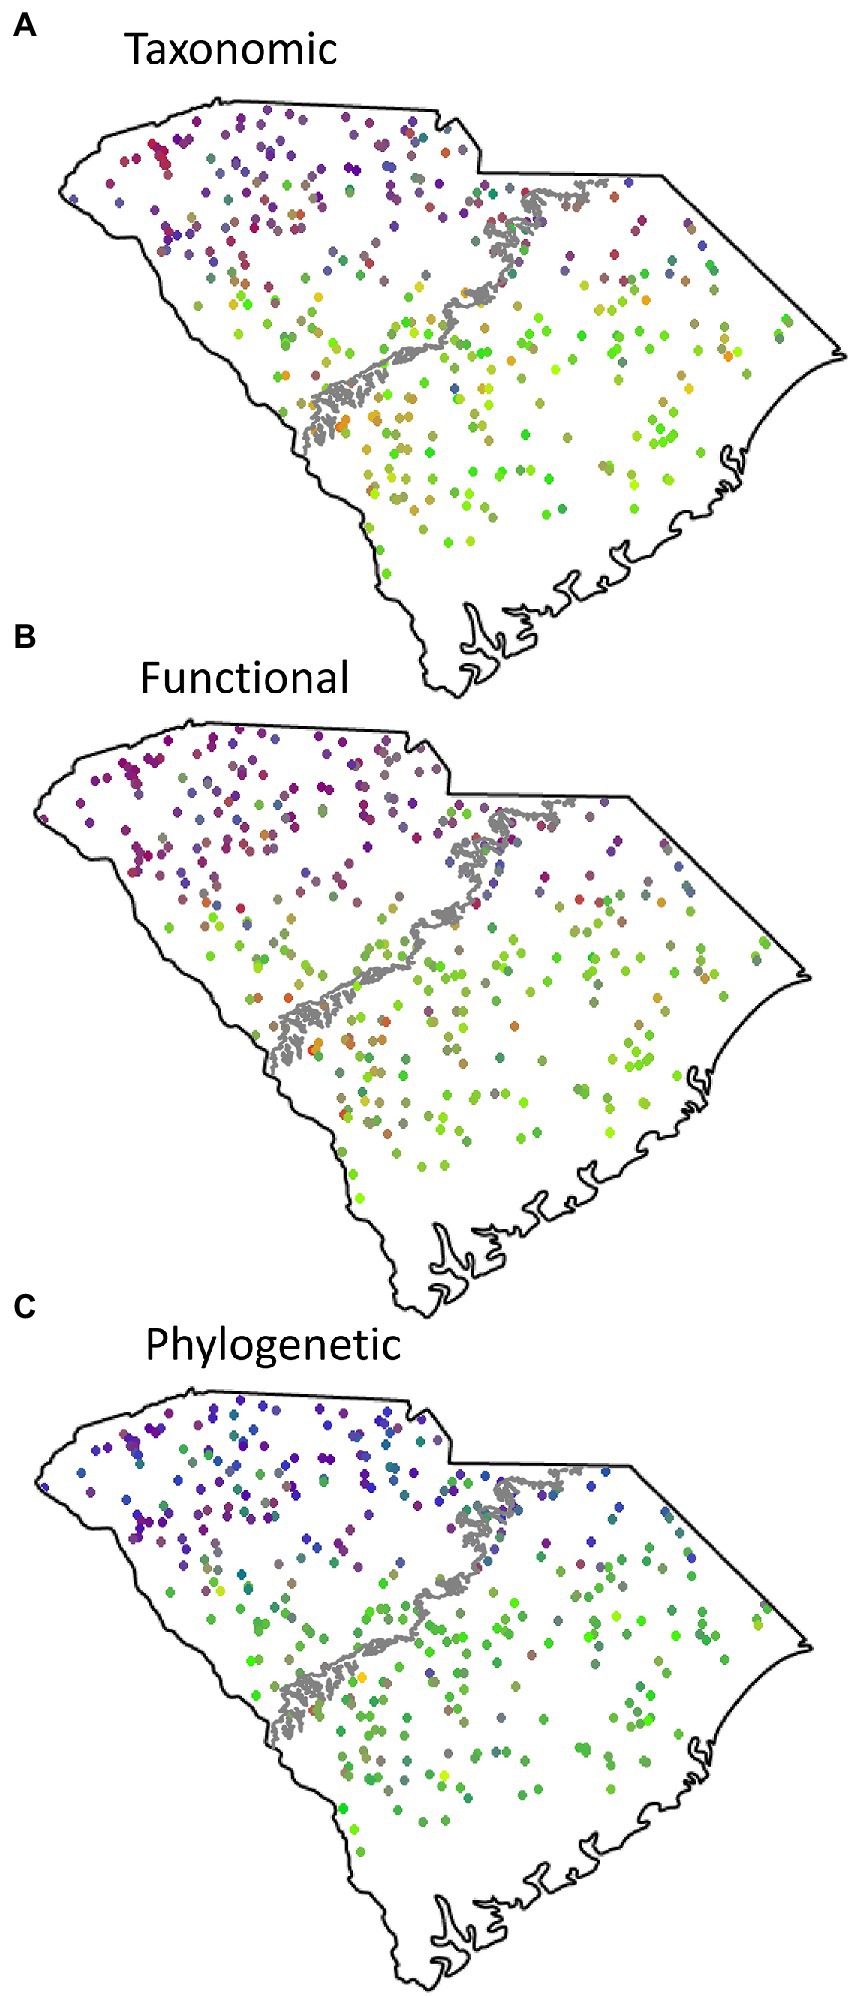
Figure 4. Red, green, blue (RGB) plots of fish beta diversity over taxonomic (A), functional (B), and phylogenetic (C) diversity dimensions. Similar colors reflect communities with similar species compositions, while differing colors reflect increased differences in species composition between sites.
The explained variation for the upstate and lowlands was less than the other spatial delineations (Figure 3 and Table 4). However, we observed the largest significant explained variance for just anthropogenic variables on the functional (Adj R2 = 0.22; Fdf = 13.754, p = 0.001) and phylogenetic (Adj R2 = 0.19; Fdf = 21.872, p = 0.001) dimensions in the upstate compared to other metacommunities (Figure 3B). Significant fractions of explained variance were observed across each diversity dimension for anthropogenic variables (Taxupstate: Adj R2 = 0.06; Fdf = 4.875, p = 0.002; Taxlowland: Fdf = 2.944, p = 0.016; Funlowland: Fdf = 5.005, p = 0.001; Phylowland: Fdf = 8.062, p = 0.001). In the upstate, beta diversity for all three diversity dimensions was explained by the amount of manure application to agricultural land (Table 3). In total, taxonomic beta diversity was explained by five variables, functional beta diversity by four variables, and phylogenetic beta diversity by two variables (Table 3). In the lowlands, beta diversity in all three dimensions was explained by dam density and road crossings. Functional beta diversity was explained by five variables, taxonomic by four, and phylogenetic by two variables (Table 3).
Only variation in beta diversity in the upstate showed any influence from natural environmental variables. Taxonomic beta diversity (Adj R2 = 0.02; Fdf = 4.282, p = 0.013) was structured by stream temperature and stream order, and functional beta diversity (Adj R2 = 0.03; Fdf = 7.541, p = 0.009) was structured by runoff (Table 3). While two environmental variables were picked for the lowlands, neither of these variables had a significant influence on beta diversity in any dimension.
Spatial variables showed greater importance within the lowlands compared to the upstate, though there was a large spatial fraction for the taxonomic dimension in the upstate (Adj R2 = 0.26; Fdf = 4.602, p = 0.01). Variance explained by spatial factors was greatest for the taxonomic dimension (Adj R2 = 0.34; Fdf = 6.3023, p = 0.001), followed by the functional (Adj R2 = 0.29; Fdf = 7.0817, p = 0.001) and phylogenetic (Adj R2 = 0.24; Fdf = 8.2911, p = 0.001) dimensions in the lowlands (Figure 4C). The lowlands had the most PCNM vectors selected to explain beta diversity variation compared to all other metacommunities analyzed. The upstate only had four vectors selected between the three diversity dimensions with PCNM1 and PCNM8 explaining taxonomic beta diversity, PCNM3 selected for but not significant in explaining functional beta diversity, and PCNM16 explaining phylogenetic beta diversity (Supplementary Table S4).
Significant portions of beta diversity were explained by anthropogenic variables alone in each watershed metacommunity (Figure 3). No anthropogenic variables were significant in explaining variation of phylogenetic beta diversity within any of the watershed metacommunities. Functional beta diversity showed the largest portion of explained variation from just anthropogenic variables for the Savannah (Adj R2 = 0.07; Fdf = 5.143, p = 0.006) and ACE (Adj R2 = 0.05; Fdf = 5.412, p = 0.005) watersheds (Figures 3E,G). Stream biological condition, percent cropland and road crossings contributed toward explained variation in beta diversity of the Savannah watershed, while maximum dam storage and road crossings explained the beta diversity variation in the ACE watershed (Table 3). Taxonomic beta diversity showed the largest portion of explained variance from just anthropogenic variables for the ACE watershed (Adj R2 = 0.05; Fdf = 4.262, p = 0.02).
Stream fish beta diversity explained only by natural environmental variables was seen in each watershed metacommunity. We observed the largest fractions of variation explained by only environmental variables in all three diversity dimensions for the Santee (Tax: Adj R2 = 0.26; Fdf = 18.2710, p = 0.001; Fun: Adj R2 = 0.17; Fdf = 14.308, p = 0.001; Phy: Adj R2 = 0.20; Fdf = 16.186, p = 0.001) and ACE watersheds (Tax: Adj R2 = 0.36; Fdf = 6.997, p = 0.001; Fun: Adj R2 = 0.19; Fdf = 10.015, p = 0.001; Phy: Adj R2 = 0.38; Fdf = 15.683, p = 0.001). The Savannah showed significant environmental signal for the functional (Adj R2 = 0.15; Fdf = 5.676, p = 0.001) and taxonomic (Adj R2 = 0.13; Fdf = 5.817, p = 0.001) dimensions, while only the taxonomic dimension (Adj R2 = 0.05; Fdf = 4.815, p = 0.001) showed an environmental signal for the PeeDee watershed (Figure 3 and Table 4). In the Santee watershed many variables were similar in explaining beta diversity, but the taxonomic and functional beta diversity dimensions were additionally explained by percent aquatic vegetation and base flow index, while taxonomic dimension also included percent clay substrate and stream order as influential variables (Table 3). Environmental variables differentially explaining beta diversity within the ACE watershed include stream depth, percent total wetlands, and percent clay substrate for taxonomic beta diversity, fine woody debris for functional beta diversity, and percent other substrates for phylogenetic beta diversity (Table 3).
Spatial variables contributed toward the explained variation for all watershed metacommunities. The highest explained variance from just the spatial fraction was found in the taxonomic dimension of the PeeDee watershed (Adj R2 = 0.11; Fdf = 4.239, p = 0.001), followed by the phylogenetic dimension of the ACE watershed (Adj R2 = 0.05; Fdf = 3.403, p = 0.031). PCNM2, which represents a large spatial scale was selected for all watershed metacommunities except the ACE. The ACE watershed was unique because no spatial variables explained taxonomic beta diversity. Additionally, the PCNMs selected for the functional and phylogenetic dimension in the ACE basin mostly related to fine spatial scales (Table 4). The PeeDee watershed had the most PCNMs selected to explain each of its diversity dimensions, however the PeeDee was one watershed where variation explained by just space, environment, or anthropogenic factors was only seen in the taxonomic dimension. Instead, distinguishing between how space, natural environment, and anthropogenic variables explained beta diversity in the PeeDee was unsuccessful due to the large fraction of explained variation from the overlap of all three matrices (Figure 3D). Large portions of explained variation due to overlap between two or more matrices were also observed for all three dimensions in the Savannah and Santee watersheds.
We investigated how spatial, natural environmental, and anthropogenic variables influence taxonomic, functional, and phylogenetic beta diversity for stream fish communities across South Carolina, USA. Our measured variation explaining beta diversity ranged from 25–81%, which is high relative to other studies investigating similar questions (Gianuca et al., 2018; Burdon et al., 2019; Benone et al., 2020). Many freshwater studies investigating drivers of beta diversity using variation partitioning have explained around 30% of the variation for a variety of taxa including stream macroinvertebrates, ostracods, fish, and macrophytes (Alahuhta and Heino, 2013; de Campos et al., 2018; Huang et al., 2019; Krynak et al., 2019). Accounting for biogeographical features of metacommunities while investigating taxonomic and functional beta diversity of Amazonian stream fishes resulted in explained community variance above 60% (Benone et al., 2020). Studies that added anthropogenic effects also increased the explained variance, similar to our results, where researchers described over 60% of the variance in freshwater macroinvertebrate community structure in Switzerland (Burdon et al., 2019). Variables including road crossings, impervious surfaces, fertilizer application, and forest loss were selected over generic land use variables. Our study, in conjunction with previous studies, indicates that the unexplained variance of past studies was due partly to information that the inclusion of anthropogenic effects provides. Our research highlights the importance of including anthropogenic variables in beta diversity studies and how these variables can provide better context for understanding human effects on stream fish beta diversity.
Quantifying beta diversity in functional and phylogenetic dimensions more fully captures the factors driving beta diversity by introducing traits and relatedness among taxa that is not captured by using taxonomy alone. We explained more variation using taxonomic beta diversity relative to the other diversity dimensions for all but one metacommunity. Large regional species pools provided a greater difference in species composition among sites to account for the increased explained variance of the taxonomic beta diversity compared to differences in traits or evolutionary relatedness, indicating higher redundancy of traits and evolutionary history for stream fish compared to other taxa. Substantial differences in explained variation between the diversity dimensions has been observed among macroinvertebrates (Gianuca et al., 2018; Hill et al., 2019; Bispo et al., 2021; Li Z. et al., 2021) and macrophytes (Garcia-Giron et al., 2019). Gianuca et al. (2018) observed up to three times more explained variation in functional and phylogenetic beta diversity compared to taxonomic diversity of zooplankton metacommunities over an urbanization gradient. Therefore, the inclusion of more than one diversity dimension can not only provide more explained variation but can offer differential insights on the factors structuring beta diversity. For example, functional diversity can provide insights into how environmental stressors effect community structure in stream fish (Jia et al., 2020; Zhang et al., 2020). The only other study to our knowledge which also investigated all three diversity dimensions in stream fish observed that instream habitat variables had a weak relationship with taxonomic beta diversity, while phylogenetic beta diversity values failed to show deterministic structuring processes (Roa-Fuentes et al., 2019). In contrast, our study showed phylogenetic beta diversity was best explained by varying degrees of spatial, natural environmental, or anthropogenic factors based on the spatial delineations within our study. Thus, the amount of explained variation in beta diversity is context dependent because even similar taxa can show different outcomes. Similar studies conducted on other regions of the world with varying climates, geography, and evolutionary histories would improve our understanding of context dependency.
We conducted analyses separately for three spatial delineations that are representative of commonly applied approaches—delineations based on political boundaries, natural geomorphic breaks, and watershed boundaries. Our results indicate that the choice of spatial delineation affects the outcome of and interpretation of variation portioning analyses, resulting in alternative interpretations of overall variance explained in metacommunity structure, as well as relative variable contributions to changes in beta diversity. Analyses based on the whole state delineation (based on political boundaries) emphasized the importance of natural environmental factors and spatial gradients indexing large-scale dispersal. Alternatively, analyses based on the fall line delineation provided different inference in which the importance of anthropogenic and spatial factors far outweighed the importance of environmental factors. This delineation also shed light on the fact that the relative contributions of anthropogenic and spatial dispersal gradients differ appreciably between the two regions, indicating different assembly rules structure stream fish metacommunities in different parts of the state. Finally, analyses based on watershed boundary delineations highlighted the synergistic effects of anthropogenic factors, spatial dispersal gradients, and natural environmental variables for structuring stream fish metacommunities. The latter analyses exposed differences between the three dimensions of stream fish beta diversity that were not evident in analyses based on the other two delineations. Many metacommunity studies are often applied to datasets that were collected without the expressed intent of quantifying beta diversity across the landscape, and are subject to variation according to methodological attributes of the dataset such as sampling density and intensity (Stoczynski et al., 2021). Likewise, our results show that user-defined choices of how metacommunities are defined a priori have important bearing on model results and ecological inference, and should be considered carefully before conducting metacommunity analyses.
Differences in the results of analyses based on different spatial delineations bring to the forefront how past geologic change affects community assembly processes across the state. The fall line represents the farthest inland the coast has been since the Cretaceous period when the sea levels were at their highest. The Appalachian uplands including the majority of the Piedmont ecoregion has been continuously above sea level since that time, which predates the modern ostariophysan fauna (Cavender, 1998). Accordingly, the faunas of river basins above the fall line have had an essentially uninterrupted evolutionary history of isolation and speciation, with geologic events such as stream capture permitting some dispersal across basins (Swift et al., 1986). This uninterrupted evolutionary history is evident in the occurrence of numerous sister species across these basins (e.g., in the families Leuciscidae and Percidae), and is reflected in the fact that factors affecting the three dimensions of beta diversity differed among basins and between the Upstate and Lowlands. In contrast, the lowering of sea level during periods of glaciation including the Pleistocene would have allowed gene flow in coastal plain drainages as rivers merged further out on the Atlantic Slope, with flood events in these low topographic relief areas enhancing interbasin dispersal. Rohde et al. (2009) noted that similarity was higher in the faunas of the Santee and Pee Dee basins, and in the Savannah and ACE basins than between those two basin pairs, indicating these watershed pairs shared more recent connections permitting dispersal. As recently as 20,000 years ago, potential basin connections occurred as sea level retreated to roughly 120 m below current sea level, placing the coast near the edge of the Continental Shelf (Miller et al., 2020). Fluctuations in shoreline location through geologic time resulted in observed differences in taxonomic beta diversity, including evidence that anthropogenic effects are greater in the upland region due to less historic mixing of communities compared to below the fall line on the Atlantic Coastal Plain.
The rise and fall of the coast resulted in different geological properties found above and below the fall line. Providing context to the geographical properties of our study region is important for allowing potential comparison between studies in different regions of the world. The South Carolina lowlands are characterized by a mosaic of highly populated areas and unpopulated more agricultural areas (Homer et al., 2015). Lowland streams are dominated by harsh environmental conditions, frequent exposure to extreme weather, and poorly defined stream channels. These streams are also connected more closely to large mainstem rivers and reservoirs and share more species among watersheds due to historical sea level change (Marion et al., 2015; Miller et al., 2020; Denison et al., 2021b). Moreover, the species inhabiting the lowland streams tend to have more dispersal-associated traits and have populations that respond more to connectivity than local-scale abiotic factors (Midway and Peoples, 2019). Humans also historically connected lowland watersheds during the canal boom of the 1790s–1830s that saw over 3,200 km of cross-watershed canal construction, as well as widespread channelization and woody debris removal (Kapsch, 2010). These disturbances have likely contributed to a landscape legacy of increased connectivity, which we observe in the spatial signals in the lowland metacommunity across each diversity dimension (Robinson et al., 2002; Wenger et al., 2008). When comparing rivers, geomorphic variables including the width and gradient of streams dictated community structure with constrained river valleys having more varied rocky substrate and log jams to provide fish cover and wide river valleys showing increased riparian vegetation, slower water velocities, and less woody debris (Walters et al., 2003; Shields et al., 2021). In contrast to the lowlands, beta diversity in the upstate was affected more by anthropogenic and natural environmental factors. In upland regions of the eastern United States, stream fish community structure is often dominated by more specialized species in less disturbed watersheds, which transition to communities dominated by generalists as watersheds become more disturbed (Scott and Helfman, 2001; Petersen et al., 2021), which would result in high beta diversity between the two ends of this continuum. Within the upstate, increased disturbance associated with higher gradient streams can result in increased sediment transport, flash flooding, channel incision, and nutrient or pollution pulses detected by the anthropogenic signal (Marion et al., 2015). The disparity in the anthropogenic signal between the upstate and lowlands may be due to the sensitivity of upstate fishes as well as the lower connectivity for recolonization after disturbance events. The geomorphic characteristics describing streams above and below the fall line may account for the lack of a large environmental signal observed in the fall line spatial delineation compared to the statewide and watershed spatial delineations (Warren et al., 2000; Smogor and Angermeier, 2001).
While we explained a large portion of variation in stream fish beta diversity, we still had some unexplained variance, as well as anthropogenic variables with poor explanatory power. Unexplained variation could be due to unmeasured variables such as biotic interactions and behavior (D’Ambrosio et al., 2009), as well as natural and anthropogenic variables not included in our study such as local hydrologic variation (Marion et al., 2015). We may have seen a lack of an anthropogenic signal in some watershed metacommunities due to the branching complexity within river networks and the environmental heterogeneity provided by geomorphic variables offering a natural defense against human induced environmental changes (Terui et al., 2021). Unexplained variation could be due to homogenization from fish introductions, resulting in disruptions to ‘natural’ riverine processes structuring species traits and relatedness (Peoples et al., 2020). However, delineating metacommunities by geomorphic variables may allow for the anthropogenic mechanisms driving community structure to become more apparent.
In conclusion, we found that human modification of the land and riverscape is evident and important for structuring stream fish beta diversity. These effects operate both independently and in concert with the natural ecological variables that are commonly included in metacommunity analyses, as well as spatial gradients representing potential for species dispersal and homogenization of stream fish community structure across the landscape. Future studies should consider these anthropogenic effects alongside natural environmental effects and dispersal to obtain a clearer picture of regional beta diversity. We also found that user-defined a priori metacommunity delineations have important consequences for the outcomes and interpretation of metacommunity analyses. Analyses based on different spatial delineations highlighted the importance of synergistic spatial and environmental effects, regional differences in assembly rules, and basin-specific differences in the factors affecting different dimensions of stream fish beta diversity. Researchers should give careful consideration to this important methodological aspect, and seek spatial delineations that are ecologically relevant, given ecology of their focal taxa.
The original contributions presented in the study are included in the article/Supplementary material, further inquiries can be directed to the corresponding author.
Ethical review and approval was not required for the animal study because the data collection requiring IACUC approval was not completed in this study. The authors were given a dataset that on stream fish abundance.
LS: conceptualization, formal analysis, writing—original draft, and visualization. LB: resources and writing—review and editing. MS: writing—review and editing and resources. BP: supervision and writing—original draft. All authors contributed to the article and approved the submitted version.
This work was supported in part by the NIFA/USDA, under project number SC-1700599, and represents technical contribution number 7136 of the Clemson Experiment Station. Any use of trade, firm, or product names is for descriptive purposes only and does not imply endorsement of the U.S. Government.
We would like to thank the South Carolina Department of Natural Resources personnel including Kevin Kubach and Drew Gelder for allowing us to use this dataset for our research purposes. We would also like to acknowledge that a version of this manuscript has appeared as the fourth chapter in the LS’s dissertation (Stoczynski, 2022).
The authors declare that the research was conducted in the absence of any commercial or financial relationships that could be construed as a potential conflict of interest.
All claims expressed in this article are solely those of the authors and do not necessarily represent those of their affiliated organizations, or those of the publisher, the editors and the reviewers. ny product that may be evaluated in this article, or claim that may be made by its manufacturer, is not guaranteed or endorsed by the publisher.
The Supplementary material for this article can be found online at: https://www.frontiersin.org/articles/10.3389/fevo.2023.1077994/full#supplementary-material
Alahuhta, J., and Heino, J. (2013). Spatial extent, regional specificity and metacommunity structuring in lake macrophytes. J. Biogeogr. 40, 1572–1582. doi: 10.1111/jbi.12089
Allan, J. D. (2004). Landscapes and riverscapes: the influence of land use on stream ecosystems. Annu. Rev. Ecol. Evol. Syst. 35, 257–284. doi: 10.1146/annurev.ecolsys.35.120202.110122
Anderson, M. J., Crist, T. O., Chase, J. M., Vellend, M., Inouye, B. D., Freestone, A. L., et al. (2011). Navigating the multiple meanings of β diversity: a roadmap for the practicing ecologist. Ecol. Lett. 14, 19–28. doi: 10.1111/j.1461-0248.2010.01552.x
Anderson, M. J., and Willis, T. J. (2003). Canonical analysis of principal coordinates: a useful method of constrained ordination for ecology. Ecology 84, 511–525. doi: 10.1890/0012-9658(2003)084[0511:CAOPCA]2.0.CO;2
Bailey, R. C., Norris, R. H., and Reynoldson, T. B. (2004). Bioassessment of Freshwater Ecosystems. Boston, MA: Springer.
Baselga, A., and Orme, C. D. L. (2012). Betapart: an R package for the study of beta diversity. Methods Ecol. Evol. 3, 808–812. doi: 10.1111/j.2041-210X.2012.00224.x
Benone, N. L., Leal, C. G., dos Santos, L. L., Mendes, T. P., Heino, J., Montag, D. A., et al. (2020). Unravelling patterns of taxonomic and functional diversity of Amazon stream fish. Aquat. Sci. 82, 1–11. doi: 10.1007/s00027-020-00749-5
Bispo, P. C., Branco, C. C. Z., Novaes, M. C., Costa, L. S., Yokoyama, E., Barfield, M., et al. (2021). Partitioning and drivers of aquatic insect beta diversity in mountain streams. Freshw. Sci. 40, 644–658. doi: 10.1086/717485
Blanchet, F. G., Legendre, P., and Borcard, D. (2008). Forward selection of explanatory variables. Ecology 89, 2623–2632. doi: 10.1890/07-0986.1
Borcard, D., and Legendre, P. (2002). All-scale spatial analysis of ecological data by means of principal coordinates of neighbour matrices. Ecol. Model. 153, 51–68. doi: 10.1016/S0304-3800(01)00501-4
Borges, P. P., Dias, M. S., Carvalho, F. R., Casatti, L., Pompeu, P. S., Cetra, M., et al. (2020). Stream fish metacommunity organisation across a neotropical ecoregion: the role of environment, anthropogenic impact and dispersal-based processes. PLoS One 15:e0233733. doi: 10.1371/journal.pone.0233733
Bower, L. M., Peoples, B. K., Eddy, M. C., and Scott, M. C. (2022). Quantifying flow–ecology relationships across flow regime class and ecoregions in South Carolina. Sci. Total Environ. 802:149721. doi: 10.1016/j.scitotenv.2021.149721
Brown, B. L., and Swan, C. M. (2010). Dendritic network structure constrains metacommunity properties in riverine ecosystems. J. Anim. Ecol. 79, 571–580. doi: 10.1111/j.1365-2656.2010.01668.x
Burdon, F. J., Munz, N. A., Reyes, M., Focks, A., Joss, A., Räsänen, K., et al. (2019). Agriculture versus wastewater pollution as drivers of macroinvertebrate community structure in streams. Sci. Total Environ. 659, 1256–1265. doi: 10.1016/j.scitotenv.2018.12.372
Cai, Y., Xu, J., Zhang, M., Wang, J., and Heino, J. (2019). Different roles for geography, energy and environment in determining three facets of freshwater molluscan beta diversity at broad spatial scales. Sci. Total Environ. 659, 451–462. doi: 10.1016/j.scitotenv.2018.12.373
Cavender, T. M. (1998). Development of the north American tertiary freshwater fish fauna with a look at parallel trends found in the European record. Italian J. Zool. 65, 149–161. doi: 10.1080/11250009809386807
Chen, K., and Olden, J. D. (2020). Threshold responses of riverine fish communities to land use conversion across regions of the world. Glob. Chang. Biol. 26, 4952–4965. doi: 10.1111/gcb.15251
D’Ambrosio, J. L., Williams, L. R., Witter, J. D., and Ward, A. (2009). Effects of geomorphology, habitat, and spatial location on fish assemblages in a watershed in Ohio, USA. Environ. Monit. Assess. 148, 325–341. doi: 10.1007/s10661-008-0163-3
Dapporto, L., Ramazzotti, M., Fattorini, S., Talavera, G., Vila, R., and Dennis, R. L. (2013). Recluster: an unbiased clustering procedure for beta-diversity turnover. Ecography 36, 1070–1075. doi: 10.1111/j.1600-0587.2013.00444.x
de Campos, R., Lansac-Tôha, F. M., da Conceição, E. D. O., Martens, K., and Higuti, J. (2018). Factors affecting the metacommunity structure of periphytic ostracods (Crustacea, Ostracoda): a deconstruction approach based on biological traits. Aquat. Sci. 80:16. doi: 10.1007/s00027-018-0567-2
Denison, C. D., Scott, M. C., Kubach, K. M., and Peoples, B. K. (2021a). Integrating regional frameworks and local variability for riverine bioassessment. Environ. Manag. 68, 126–145. doi: 10.1007/s00267-021-01479-6
Denison, C. D., Scott, M. C., Kubach, K. M., and Peoples, B. K. (2021b). Incorporating network connectivity into stream classification frameworks. Environ. Manag. 67, 291–307. doi: 10.1007/s00267-020-01413-2
Dray, S., Bauman, D., Guillaume, B., Borcard, D., Clappe, S., and Guenard, G. (2018). Package Adespatial.
Duarte, G. T., Santos, P. M., Cornelissen, T. G., Ribeiro, M. C., and Paglia, A. P. (2018). The effects of landscape patterns on ecosystem services: meta-analyses of landscape services. Landsc. Ecol. 33, 1247–1257. doi: 10.1007/s10980-018-0673-5
Erős, T., Sály, P., Takács, P., Specziár, A., and Bíró, P. (2012). Temporal variability in the spatial and environmental determinants of functional metacommunity organization–stream fish in a human-modified landscape. Freshw. Biol. 57, 1914–1928. doi: 10.1111/j.1365-2427.2012.02842.x
Fitzgerald, D. B., Winemiller, K. O., Sabaj Pérez, M. H., and Sousa, L. M. (2017). Seasonal changes in the assembly mechanisms structuring tropical fish communities. Ecology 98, 21–31. doi: 10.1002/ecy.1616
Frimpong, E. A., and Angermeier, P. L. (2009). Fish traits: a database of ecological and life-history traits of freshwater fishes of the United States. Fisheries 34, 487–495. doi: 10.1577/1548-8446-34.10.487
Garcia-Giron, J., Fernandez-Alaez, C., Fernandez-Alaez, M., and Alahuhta, J. (2019). Untangling the assembly of macrophyte metacommunities by means of taxonomic, functional and phylogenetic beta diversity patterns. Sci. Total Environ. 693:133616. doi: 10.1016/j.scitotenv.2019.133616
Gianuca, A. T., Engelen, J., Brans, K. I., Hanashiro, F. T. T., Vanhamel, M., van den Berg, E. M., et al. (2018). Taxonomic, functional and phylogenetic metacommunity ecology of cladoceran zooplankton along urbanization gradients. Ecography 41, 183–194. doi: 10.1111/ecog.02926
Griffith, D. A., and Peres-Neto, P. R. (2006). Spatial modeling in ecology: the flexibility of eigenfunction spatial analyses. Ecology 87, 2603–2613. doi: 10.1890/0012-9658(2006)87[2603:SMIETF]2.0.CO;2
Heino, J. (2013). The importance of metacommunity ecology for environmental assessment research in the freshwater realm. Biol. Rev. 88, 166–178. doi: 10.1111/j.1469-185X.2012.00244.x
Heino, J., Alahuhta, J., Fattorini, S., and Schmera, D. (2018). Predicting beta diversity of terrestrial and aquatic beetles using ecogeographical variables: insights from the replacement and richness difference components. J. Biogeogr. 46, 304–315. doi: 10.1111/jbi.13485
Heino, J., Melo, A. S., Siqueira, T., Soininen, J., Valanko, S., and Bini, L. M. (2015a). Metacommunity organisation, spatial extent and dispersal in aquatic systems: patterns, processes and prospects. Freshw. Biol. 60, 845–869. doi: 10.1111/fwb.12533
Heino, J., Soininen, J., Alahuhta, J., Lappalainen, J., and Virtanen, R. (2015b). A comparative analysis of metacommunity types in the freshwater realm. Ecol. Evol. 5, 1525–1537. doi: 10.1002/ece3.1460
Henriques-Silva, R., Logez, M., Reynaud, N., Tedesco, P. A., Brosse, S., Januchowski-Hartley, S. R., et al. (2019). A comprehensive examination of the network position hypothesis across multiple river metacommunities. Ecography 42, 284–294. doi: 10.1111/ecog.03908
Hill, M. J., Heino, J., White, J. C., Ryves, D. B., and Wood, P. J. (2019). Environmental factors are primary determinants of different facets of pond macroinvertebrate alpha and beta diversity in a human-modified landscape. Biol. Conserv. 237, 348–357. doi: 10.1016/j.biocon.2019.07.015
Hill, R. A., Weber, M. H., Leibowitz, S. G., Olsen, A. R., and Thornbrugh, D. J. (2016). The stream-catchment (StreamCat) dataset: a database of watershed metrics for the conterminous United States. J. Am. Water Resour. Assoc. 52, 120–128. doi: 10.1111/1752-1688.12372
Hitt, N. P., and Angermeier, P. L. (2011). Fish community and bioassessment responses to stream network position. J. N. Am. Benthol. Soc. 30, 296–309. doi: 10.1899/09-155.1
Hollingsworth, P. R., Simons, A. M., Fordyce, J. A., and Hulsey, C. D. (2013). Explosive diversification following a benthic to pelagic shift in freshwater fishes. BMC Evol. Biol. 13, 1–10. doi: 10.1186/1471-2148-13-272
Homer, C., Dewitz, J., Yang, L., Jin, S., Danielson, P., Xian, G., et al. (2015). Completion of the 2011 National Land Cover Database for the conterminous United States–representing a decade of land cover change information. Photogramm. Eng. Remote Sens. 81, 345–354. doi: 10.1016/S0099-1112(15)30100-2
Huang, L., Huang, J., Wu, Z., Mo, Y., Zou, Q., Jeppesen, E., et al. (2019). Beta diversity partitioning and drivers of variations in fish assemblages in a headwater stream: Lijiang River. China. Water 11:680. doi: 10.3390/w11040680
Iacarella, J. C. (2022). Fish zeta diversity responses to human pressures and cumulative effects across a freshwater basin. Divers. Distrib. 28, 830–843. doi: 10.1111/ddi.13486
Jarzyna, M. A., and Jetz, W. (2016). Detecting the multiple facets of biodiversity. Trends Ecol. Evol. 31, 527–538. doi: 10.1016/j.tree.2016.04.002
Jelinski, D. E., and Wu, J. (1996). The modifiable areal unit problem and implications for landscape ecology. Landsc. Ecol. 11, 129–140. doi: 10.1007/BF02447512
Jia, Y., Kennard, M. J., Liu, Y., Sui, X., Li, K., Wang, G., et al. (2020). Human disturbance and long-term changes in fish taxonomic, functional and phylogenetic diversity in the Yellow River, China. Hydrobiologia 847, 3711–3725. doi: 10.1007/s10750-020-04244-8
Kapsch, R. (2010). Canals and Waterways of South Carolina. Columbia: University of South Carolina Press.
Karr, J. R. (1981). Assessment of biotic integrity using fish communities. Fisheries 6, 21–27. doi: 10.1577/1548-8446(1981)006<0021:AOBIUF>2.0.CO;2
Kembel, S. W., Cowan, P. D., Helmus, M. R., Cornwell, W. K., Morlon, H., Ackerly, D. D., et al. (2010). Picante: R tools for integrating phylogenies and ecology. Bioinformatics 26, 1463–1464. doi: 10.1093/bioinformatics/btq166
Krynak, E. M., Lindo, Z., and Yates, A. G. (2019). Patterns and drivers of stream benthic macroinvertebrate beta diversity in an agricultural landscape. Hydrobiologia 837, 61–75. doi: 10.1007/s10750-019-3961-4
Laliberté, E., Legendre, P., Shipley, B., and Laliberté, M. E. (2010). Package ‘FD’. Measuring functional diversity (FD) from multiple traits, and other tools for functional ecology.
Lamouroux, N., Poff, N. L., and Angermeier, P. L. (2002). Intercontinental convergence of stream fish community traits along geomorphic and hydraulic gradients. Ecology 83, 1792–1807. doi: 10.1890/0012-9658(2002)083[1792:ICOSFC]2.0.CO;2
Langerhans, R. B., and Kern, E. M. (2020). “Urbanization and evolution in aquatic environments” in Urban Evolutionary Biology. eds. M. Szulkin, J. Munshi-South, and A. Charmantier (Oxford: Oxford University Press), 157–174.
Lech, J. D., and Willig, M. R. (2020). Unravelling the effects of multiple types of disturbance on an aquatic plant metacommunity in freshwater lakes. Freshw. Biol. 66, 1395–1409. doi: 10.1111/fwb.13725
Legendre, P., and Gallagher, E. D. (2001). Ecologically meaningful transformations for ordination of species data. Oecologia 129, 271–280. doi: 10.1007/s004420100716
Leibold, M. A., and Chase, J. M. (2017). Metacommunity ecology. Princeton, NJ: Princeton University Press.
Li, Z., Heino, J., Liu, Z., Meng, X., Chen, X., Ge, Y., et al. (2021). The drivers of multiple dimensions of stream macroinvertebrate beta diversity across a large montane landscape. Limnol. Oceanogr. 66, 226–236. doi: 10.1002/lno.11599
Li, F., Yan, Y., Zhang, J., Zhang, Q., and Niu, J. (2021). Taxonomic, functional, and phylogenetic beta diversity in the Inner Mongolia grassland. Glob. Ecol. Conserv. 28:e01634. doi: 10.1016/j.gecco.2021.e01634
Marion, C. A., Scott, M. C., and Kubach, K. M. (2015). Multiscale environmental influences on fish assemblage structure of South Atlantic coastal plain streams. Trans. Am. Fish. Soc. 144, 1040–1057. doi: 10.1080/00028487.2015.1059887
Mayden, R. L., and Allen, J. S. (2015). Molecular systematics of the phoxinin genus Pteronotropis (Otophysi: Cypriniformes). Biomed. Res. Int. 2015:298658. doi: 10.1155/2015/298658
Midway, S. R., and Peoples, B. K. (2019). Effects of life-history traits on stream fish abundances across spatial scales. Ecol. Freshw. Fish 28, 639–649. doi: 10.1111/eff.12482
Miller, K. G., Browning, J. V., Schmelz, W. J., Kopp, R. E., Mountain, G. S., and Wright, J. D. (2020). Cenozoic Sea-level and cryospheric evolution from deep-sea geochemical and continental margin records. Sci. Adv. 6:eaaz1346. doi: 10.1126/sciadv.aaz1346
Nakamura, G., Vicentin, W., and Súarez, Y. R. (2017). Functional and phylogenetic dimensions are more important than the taxonomic dimension for capturing variation in stream fish communities. Austral Ecol. 43, 2–12. doi: 10.1111/aec.12529
Nakamura, G., Vicentin, W., and Súarez, Y. R. (2021). Taxonomic and phylogenetic beta diversity in headwater stream fish communities of the Paraná and Paraguai River basins. Neotrop. Ichthyol. 19:e200126. doi: 10.1590/1982-0224-2020-0126
Near, T. J., Bossu, C. M., Bradburd, G. S., Carlson, R. L., Harrington, R. C., Hollingsworth, P. R. Jr., et al. (2011). Phylogeny and temporal diversification of darters (Percidae: Etheostomatinae). Syst. Biol. 60, 565–595. doi: 10.1093/sysbio/syr052
Oksanen, J., Blanchet, F. G., Kindt, R., Legendre, P., Minchin, P. R., O’hara, R. B., et al. (2015). Package ‘vegan’. Community ecology package, version 2.
Omernik, J. M. (1987). Ecoregions of the conterminous United States. Ann. Assoc. Am. Geogr. 77, 118–125. doi: 10.1111/j.1467-8306.1987.tb00149.x
Ortega, J. C., Bacani, I., Dorado-Rodrigues, T. F., Strüssmann, C., Fernandes, I. M., Morales, J., et al. (2021). Effects of urbanization and environmental heterogeneity on fish assemblages in small streams. Neotrop. Ichthyol. 19:e210050. doi: 10.1590/1982-0224-2021-0050
Paller, M. H. (1994). Relationships between fish assemblage structure and stream order in South Carolina coastal plain streams. Trans. Am. Fish. Soc. 123, 150–161. doi: 10.1577/1548-8659(1994)123<0150:RBFASA>2.3.CO;2
Paradis, E., and Schliep, K. (2019). ape 5.0: an environment for modern phylogenetics and evolutionary analyses in R. Bioinformatics 35, 526–528. doi: 10.1093/bioinformatics/bty633
Patrick, C. J., and Yuan, L. L. (2019). The challenges that spatial context present for synthesizing community ecology across scales. Oikos 128, 297–308. doi: 10.1111/oik.05802
Pease, A. A., González-Díaz, A. A., Rodiles-Hernández, R. O., and Winemiller, K. O. (2012). Functional diversity and trait–environment relationships of stream fish assemblages in a large tropical catchment. Freshw. Biol. 57, 1060–1075. doi: 10.1111/j.1365-2427.2012.02768.x
Peoples, B. K., Davis, A. J., Midway, S. R., Olden, J. D., and Stoczynski, L. (2020). Landscape-scale drivers of fish faunal homogenization and differentiation in the eastern United States. Hydrobiologia 847, 3727–3741. doi: 10.1007/s10750-019-04162-4
Petersen, K. N., Freeman, M. C., Kirsch, J. E., McLarney, W. O., Scott, M. C., and Wenger, S. J. (2021). Mixed evidence for biotic homogenization of southern Appalachian fish communities. Can. J. Fish. Aquat. Sci. 78, 1397–1406. doi: 10.1139/cjfas-2020-0372
Poff, N. L. (1997). Landscape filters and species traits: towards mechanistic understanding and prediction in stream ecology. J. N. Am. Benthol. Soc. 16, 391–409. doi: 10.2307/1468026
R Core Team (2021). R: A language and environment for statistical computing. Vienna, Austria: R Foundation for Statistical Computing.
Rabosky, D. L., Chang, J., Title, P. O., Cowman, P. F., Sallan, L., Friedman, M., et al. (2018). An inverse latitudinal gradient in speciation rate for marine fishes. Nature 559:392. doi: 10.1038/s41586-018-0273-1
Roa-Fuentes, C. A., Heino, J., Cianciaruso, M. V., Ferraz, S., Zeni, J. O., and Casatti, L. (2019). Taxonomic, functional, and phylogenetic β-diversity patterns of stream fish assemblages in tropical agroecosystems. Freshw. Biol. 64, 447–460. doi: 10.1111/fwb.13233
Robinson, C. T., Tockner, K., and Ward, J. V. (2002). The fauna of dynamic riverine landscapes. Freshw. Biol. 47, 661–677. doi: 10.1046/j.1365-2427.2002.00921.x
Rohde, F. C., Arndt, R. G., Foltz, J. W., and Quattro, J. M. (2009). Freshwater fishes of South Carolina. Columbia: University of South Carolina Press.
Sagnes, P., and Statzner, B. (2009). Hydrodynamic abilities of riverine fish: a functional link between morphology and velocity use. Aquat. Living Resour. 22, 79–91. doi: 10.1051/alr/2009008
Schroeder, P. J., and Jenkins, D. G. (2018). How robust are popular beta diversity indices to sampling error? Ecosphere 9:e02100. doi: 10.1002/ecs2.2100
Scott, M. C., and Helfman, G. S. (2001). Native invasions, homogenization, and the mismeasure of integrity of fish assemblages. Fisheries 26, 6–15. doi: 10.1577/1548-8446(2001)026<0006:NIHATM>2.0.CO;2
Scott, M. C., Rose, L., Kubach, K., Marion, C., Thomason, C., and Price, J. (2009). The South Carolina stream assessment standard operating procedures. Stream assessment task group of the freshwater fisheries section, South Carolina Dept of Natural Resources, Columbia, SC.
Shields, R., Pyron, M., Arsenault, E. R., Thorp, J. H., Minder, M., Artz, C., et al. (2021). Geomorphology variables predict fish assemblages for forested and endorheic rivers of two continents. Ecol. Evol. 11, 16745–16762. doi: 10.1002/ece3.8300
Smogor, R. A., and Angermeier, P. L. (2001). Determining a regional framework for assessing biotic integrity of Virginia streams. Trans. Am. Fish. Soc. 130, 18–35. doi: 10.1577/1548-8659(2001)130<0018:DARFFA>2.0.CO;2
Stoczynski, L. (2022). Incorporating human effects in quantifying mechanisms of stream fish community structure using metacommunity theory. Available at: https://tigerprints.clemson.edu/all_dissertations/3056
Stoczynski, L., Brown, B. L., Midway, S. R., and Peoples, B. K. (2021). Landscape features and study design affect elements of metacommunity structure for stream fishes across the eastern USA. Freshw. Biol. 66, 1736–1750. doi: 10.1111/fwb.13788
Swift, C. C., Gilbert, C. R., Bortone, S. A., Burgess, G. H., and Yerger, R. W. (1986). “Zoogeography of the freshwater fishes of the southeastern United States: Savannah River to Lake Pontchartrain” in The Zoogeography of North American Freshwater Fishes. eds. C. H. Hocutt and E. O. Wiley (New York: John Wiley and Sons), 213–266.
Terui, A., Kim, S., Dolph, C. L., Kadoya, T., and Miyazaki, Y. (2021). Emergent dual scaling of riverine biodiversity. Proc. Natl. Acad. Sci. 118:e2105574118. doi: 10.1073/pnas.2105574118
Tilman, D. (2001). Functional diversity. Encyclopedia Biodivers. 3, 109–120. doi: 10.1016/B0-12-226865-2/00132-2
Tonkin, J. D., Heino, J., and Altermatt, F. (2018). Metacommunities in river networks: the importance of network structure and connectivity on patterns and processes. Freshw. Biol. 63, 1–5. doi: 10.1111/fwb.13045
Trisos, C. H., Petchey, O. L., and Tobias, J. A. (2014). Unraveling the interplay of community assembly processes acting on multiple niche axes across spatial scales. Am. Nat. 184, 593–608. doi: 10.1086/678233
Vörösmarty, C. J., McIntyre, P. B., Gessner, M. O., Dudgeon, D., Prusevich, A., Green, P., et al. (2010). Global threats to human water security and river biodiversity. Nature 467, 555–561. doi: 10.1038/nature09440
Waite, I. R., Van Metre, P. C., Moran, P. W., Konrad, C. P., Nowell, L. H., Meador, M. R., et al. (2021). Multiple in-stream stressors degrade biological assemblages in five US regions. Sci. Total Environ. 800:149350. doi: 10.1016/j.scitotenv.2021.149350
Wallace, J. B., Webster, J. R., and Lowe, R. L. (1992). “High-gradient streams of the Appalachians” in Biodiversity of the Southeastern United States Aquatic Communities. eds. C. T. Hackney, S. M. Adams, and W. H. Martin (New York: John Wiley & Sons), 133–191.
Walters, D. M., Freeman, M. C., Leigh, D. S., Freeman, B. J., and Pringle, C. M. (2005). Urbanization effects on fishes and habitat quality in a southern Piedmont River basin. Am. Fish. Soc. Symp. 47, 69–85.
Walters, D. M., Leigh, D. S., Freeman, M. C., Freeman, B. J., and Pringle, C. M. (2003). Geomorphology and fish assemblages in a Piedmont River basin, USA. Freshw. Biol. 48, 1950–1970. doi: 10.1046/j.1365-2427.2003.01137.x
Wang, L., Infante, D., Lyons, J., Stewart, J., and Cooper, A. (2011). Effects of dams in river networks on fish assemblages in non-impoundment sections of rivers in Michigan and Wisconsin, USA. River Res. Appl. 27, 473–487. doi: 10.1002/rra.1356
Warren, M. L., Burr, B. M., Walsh, S. J., Bart, H. L. Jr., Cashner, R. C., Etnier, D. A., et al. (2000). Diversity, distribution, and conservation status of the native freshwater fishes of the southern United States. Fisheries 25, 7–31. doi: 10.1577/1548-8446(2000)025<0007:DDACSO>2.0.CO;2
Webb, C. O., Ackerly, D. D., McPeek, M. A., and Donoghue, M. J. (2002). Phylogenies and community ecology. Annu. Rev. Ecol. Syst. 33, 475–505. doi: 10.1146/annurev.ecolsys.33.010802.150448
Weinstein, B., Tinoco, B., Parra, J. L., Brown, L. M., McGuire, J. A., Stiles, F. G., et al. (2014). Taxonomic, phylogenetic, and trait Beta diversity in South American hummingbirds. Am. Nat. 184, 211–224. doi: 10.1086/676991
Wenger, S. J., Peterson, J. T., Freeman, M. C., Freeman, B. J., and Homans, D. D. (2008). Stream fish occurrence in response to impervious cover, historic land use, and hydrogeomorphic factors. Can. J. Fish. Aquat. Sci. 65, 1250–1264. doi: 10.1139/F08-046
Wolman, M. G. (1954). A method of sampling coarse river-bed material. EOS Trans. Am. Geophys. Union 35, 951–956. doi: 10.1029/TR035i006p00951
Zhang, D., Heng, W., Chu, L., Xu, D., Kang, B., and Yan, Y. (2020). Taxonomic and functional diversity in a subtropical stream: a longitudinal pattern analysis. Ecol. Freshw. Fish 29, 752–763. doi: 10.1111/eff.12551
Keywords: landscape ecology, spatial scale, taxonomic, functional, phylogenetic, anthropogenic effects
Citation: Stoczynski L, Scott MC, Bower L and Peoples BK (2023) Effects of environment and metacommunity delineation on multiple dimensions of stream fish beta diversity. Front. Ecol. Evol. 11:1077994. doi: 10.3389/fevo.2023.1077994
Edited by:
Francesco Cerasoli, University of L'Aquila, ItalyReviewed by:
Sarah Laske, United States Geological Survey (USGS), United States Department of the Interior, United StatesCopyright © 2023 Stoczynski, Scott, Bower and Peoples. This is an open-access article distributed under the terms of the Creative Commons Attribution License (CC BY). The use, distribution or reproduction in other forums is permitted, provided the original author(s) and the copyright owner(s) are credited and that the original publication in this journal is cited, in accordance with accepted academic practice. No use, distribution or reproduction is permitted which does not comply with these terms.
*Correspondence: Brandon K. Peoples, cGVvcGxlc0BjbGVtc29uLmVkdQ==
Disclaimer: All claims expressed in this article are solely those of the authors and do not necessarily represent those of their affiliated organizations, or those of the publisher, the editors and the reviewers. Any product that may be evaluated in this article or claim that may be made by its manufacturer is not guaranteed or endorsed by the publisher.
Research integrity at Frontiers
Learn more about the work of our research integrity team to safeguard the quality of each article we publish.