 Lindong Ma
 Weixiang Xu1
 Shouchao He
 Yuanxiao Hong
94% of researchers rate our articles as excellent or good
Learn more about the work of our research integrity team to safeguard the quality of each article we publish.
Find out more
ORIGINAL RESEARCH article
Front. Ecol. Evol., 03 March 2023
Sec. Urban Ecology
Volume 11 - 2023 | https://doi.org/10.3389/fevo.2023.1074827
Nowadays countries in the world are striving to transform their economic and social development modes to achieve the general goal of green development. With the rapid development of communication technology, digitalization has affected production and life, touching all aspects of society. Can digitalization make the world “greener”? To this end, this study conducts an empirical research based on the panel data of 276 cities in China from 2011 to 2020. Firstly, this paper separately measured the comprehensive level of urban digitalization and urban greening through the Entropy-TOPSIS method, then analyzed their spatial distribution characteristics and evolution process respectively, finally used the spatial Durbin model to explore the impact of digitalization on urban greening development. The following conclusions were drawn accordingly: (1). The development pattern of urban digitalization has changed from “multi-point” sporadic distribution to “group-type” aggregation with obvious spatial heterogeneity. The gap between cities is not narrowing. The Yangtze River Delta urban agglomeration has become an important high-level digital agglomeration area; (2). The urban greening develops with obvious spatial heterogeneity. The difference between eastern regions and western regions is prominent, and the urban spatial agglomeration characteristic is distinct. However, the spillover effect is weakened with distance, while the convergence characteristic becomes obvious; (3). Digitalization is significantly beneficial to the development of urban greening with obvious spatial heterogeneity. Digitalization in cities within urban agglomeration and in eastern regions has a stronger effect on promoting the urban greening, which is not obvious in cities located in western regions and non-urban agglomeration. Finally, according to the research results, suggestions for urban digitalization and greening development are put forward.
The Politburo meeting of the CPC Central Committee held on March 24, 2015 emphasized that “greening” must be added on the basis of new industrialization, urbanization, informatization, and agricultural modernization, indicating that urban greening has been officially recognized and valued. Promoting green transformation is of great significance for the central government to achieve high-quality development in China (Cui et al., 2020). With the continuous development of global economy and further deterioration of the environment, how to make the world better and more sustainable has become one of the important themes of the current era. Digitalization has become a new trend to accelerate the further development of regional economy and globalization. Whether this new development momentum is conducive to the healthy and benign green development of urban economy and society has become a topic worthy of further discussion.
As digitalization continues to penetrate into all aspects of economy and society, the research on it is also deepening. Currently, it is mainly reflected in three aspects. First is the measurement of digitalization (Jovanovic et al., 2018), including the selection of indicators; second is the relationship between digitalization and some certain aspects of socioeconomic development (Habibi and Zabardast, 2020; Zhao et al., 2020; Fan and Wu, 2021; Liu et al., 2021; Lee et al., 2022; Hao et al., 2023), such as the relationship between digitalization and high-quality development at the provincial level in China (Fan and Wu, 2021); third, the relationship between digitalization and the environment (Ahmadova et al., 2022; Cui et al., 2022), such as whether digitalization can improve environmental quality (Pang et al., 2021). Greening development has become the theme of the times. People not only pursue economic development, but also yearn for a better life. Therefore, not only the economic development should be green, but also the natural environment should reach a certain degree of greenness, and the social tolerance should be “greener” as well, for which the government should have better support. Accordingly, the current research on urban greening development is more reflected from the economic perspective by all green production factors (Cui et al., 2020), as well as green economic development (Loiseau et al., 2016; Hao et al., 2023) and green economic efficiency (Dong et al., 2021; Lee et al., 2022). Of course, there are also studies on urban greening development from resource and environmental perspectives (Fang et al., 2020; Abid et al., 2021). It can be found by reviewing the existing literature as follows. First, the existing studies of regional green development are mostly based on the perspective of ecology, economy or management, while ignoring the “process-pattern-mechanism” of green development from the perspective of geography (Vu and Asongu, 2020). Second, the existing literature research only focuses on one aspect of the regional greening development one-sidedly, such as the environment (Pang et al., 2021) or economic greening development (Fan and Wu, 2021; Liu et al., 2021), ignoring the fact that the regional greening development is a comprehensive system that includes economic, social, ecology, and even the ruling class. Third, the selection of existing research subjects is usually based on comparative studies between countries (Vu and Asongu, 2020) or at the provincial level within a country. The impact of digitalization on greening development in regions within a country was rarely studied (Liu et al., 2021) and it’s better to be filled at the level of cities. Fourth, although there are many literature conducted based on the green development of urban environment, economy and social greening development, corresponding indicators have been established with few of them standing for the green development of the entire city (Abid et al., 2021). They ignore the fact that the urban greening development involves the coordinated development of economy and ecology with multiple goals, in other words, it is a process of high-quality development and ecological environment construction. The indicators needs to be further refined. Fifth, from the perspective of spatial effect, the spatial spillover effects should consider more than adjacency, the spatial and economic forces of multiple adjacencies and regional heterogeneity should be further explored.
As the largest developing country and world’s second largest economy, China has developed rapidly over the past decades, but also paid serious ecological and environmental costs. To this end, China has accelerated digital transformation and upgrading in order to pursue a sustainable and virtuous cycle of green development. Can digitalization surely promote the urban greening development? Further analysis and verification are needed from both theoretical and empirical perspectives. Based on the above situation, this study explores the mechanism of digitalization affecting urban greening development. Specifically, based on the panel data of 276 prefecture-level cities in China from 2011 to 2020, we used measurement methods such as the spatial Durbin model to empirically test the influencing mechanism, and further tested the spatial heterogeneity in it. This study makes up for the insufficiency of the existing research, and the possible innovations are as follows: (1) Constructing an urban greening development index system, involving four aspects: economy, environment, society and government, which is different from previous studies only focusing on urban green economic development or environmental development. Because urban greening development is a new model of high-quality sustainable development, aiming at achieving the coordinated development of economy, society and ecology. This study scientifically and objectively measures it from four parts containing 16 indicators; (2) Using a spatial econometric model to explore the impact of digitalization on urban greening development from the perspective of geography at the city level, which supplements the existing research and examines the impact of digitalization on urban greening development from a more microscopic perspective; (3) This paper, respectively, analyzed the spatio-temporal evolution characteristics of urban digitalization and greening development by using the space-collar adjacency matrix and different spatial distance matrices; and (4) This study further improved the research about the spatial effect of digitalization on the urban greening development by cutting from the perspective of spatial heterogeneity and spillover boundary effect.
With the widespread application of digital technologies such as the Internet, cloud computing, and the Internet of Things, the phenomenon of “digitalization” has become common in production and life. Ritter and Pedersen (2020) and some other researchers believe that the application process of digital technology is digitalization; some scholars (Chen et al., 2020; Qi and Cai, 2020) analyzed the changes caused by digital technology, believing that the digitalization of enterprises is achieved by leveraging digital technology to improve enterprise competitiveness, and to realize the strategic behavior of profit appreciation. As we can see, although the application of digital technology is the basic manifestation of digitalization, fundamentally, digitalization is not simply about technical application, but a complex process involving various fields and causing constant changes in all aspects of economic and social life. Thereby, the impact of digitalization on the greening development of cities is also multi-faceted.
There are two ways for digitalization to affect the urban greening development through technological innovation. On the one hand, technologies such as big data, cloud computing, Internet of Things, and industrial Internet penetrate into the industry, bringing multi-dimensional optimization and upgrading of industrial pollution controlling strategies and energy management methods. It can also realize the interconnection of enterprise departments or production equipment by multi-dimensional sensors, communicate across different networks, and dynamically collect information on various elements and energy that are closely related to corporate sewage activities in real time, so as to optimize the energy structure and improve the utilization efficiency, and finally to achieve good economic benefits and re-optimize the combination of production factors. On the other hand, digital technology promotes the connection, innovation collaboration and knowledge sharing among innovation entities, which produces the empowerment effect of digital technology (Kohli and Melville, 2018), realizes the improvement of urban innovation capabilities, enhances the urban innovation environment through talent agglomeration and technological financial supply, accelerates the digital transformation and innovation in cities, and then catalyzes the emission reduction effects of technological innovation, thereby reducing social pollutant emissions and improving environmental greenness.
With the continuous improvement of digital infrastructure, the digital environment is improved and the digital effect is further enhanced accordingly. On the one hand, the wide coverage of access facilities and the low threshold of using equipment have made the digital access gap continue to narrow, and have promoted the formation of informal environmental regulations with the network public as the main body, which can optimize the relationship between the socio-economic system and the ecological environment system, and reshape environmental governance pattern. On the other hand, implementing the goal – digitalization promotes sustainable development must be realized through the linkage of digital infrastructure, such as the interconnection of urban elements by sensors, smart devices, communication platforms and other facilities to provide support for the government to promote urban greening and sustainable development policies. In addition, the improvement of digitally-driven intelligent manufacturing infrastructure also promotes greening. For example, intelligent manufacturing workshops can accurately assess and respond to weather conditions such as meteorology, based on digital data fusion drives. Overall, digitalization clearly benefits the prediction, control and improvement of the environment.
Digital development could stimulate the expansion of economic scale, but pollutants as a by-product of production would also increase, which will lead to the aggravation of environmental pollution and pressure on the environmental governance, adversely affecting environmental governance performance. Meanwhile, digital development can also optimize the economy through industrial structure optimization, economies of scale and competition mechanisms, ultimately reducing environmental pollution and achieving the purpose of promoting urban greening development. The structural optimization effect of digitalization on the industrial field is mainly due to technology penetration and industrial integration. In the context of rapid development of information technology, the Internet and the Internet of Things have gradually become important production and application tools by virtue of their characteristics of openness, collaboration, sharing and connection. In addition, digital network platforms can promote cross-industry and cross-field resource sharing through scale effects and competition effects, optimize traditional industrial production methods, supply chains and value chains, improve the operational efficiency of industrial organizations, and force the upgrading of low-end and backward industries. Scholars have demonstrated that industrial structure upgrading can effectively reduce pollutant emissions and play a role in reducing emissions with a variety of methods. The main reason is that the secondary industry concentrates most of the energy-intensive sectors, and there are significant differences in the energy structure between industrial industries and service industries, which means that in the process of gradually upgrading the industrial structure, the energy structure dominated by fossil energy can be greatly improved, reducing the pressure on urban pollution, thereby promoting the urban greening.
To sum up, with the advancement of digitalization process, beneficial factors such as technological innovation, environmental change and economic optimization would be brought to cities. However, due to the expansion of economic scale, it may also have negative impact: the total amount of pollutant emissions may increase, and social pressure may rise. In general, the advantages should outweigh the disadvantages, which need to be further verified empirically.
Currently, research on the urban digitalization remains to be further enriched, and the quantitative indicators for measurement are not consistent. Judging from the existing research, the evaluation of regional digitalization is roughly divided into three categories: first, single-variable indicators based on the Internet penetration rate and the number of Internet broadband access users per capita (Habibi and Zabardast, 2020) are used; second, borrowing indicators from the digital economy to characterize (Jovanovic et al., 2018), such as the EU Digital Economy and Society Index (DESI, Jovanovic et al., 2018); third, drawing on the related indicators of digital economy, informatization or something else, researchers selected indicators meeting their respective research needs. And multiple indicator systems are constructed from different perspectives (Fan and Wu, 2021; Jia et al., 2022).
Because digitalization is a complex and systematic process that drives the evolution of economy and social structures. Using a single indicator cannot accurately and comprehensively reflect the level of digital development in a region (Pang et al., 2021). Referring to the existing literature (Liu et al., 2021; Hao et al., 2023), this paper conducts a comprehensive evaluation system in four dimensions: digital infrastructure, digital application, digital industry development and digital financial inclusion. Among them, digital infrastructure is the hardware condition for regional digitalization; digital application is the embodiment of digital connotation, reflecting the integration degree among digitalization and regional economy and society; digital industry development is an important support for digital development (Pang et al., 2021); digital financial inclusion is an essential component in digital life, reflecting that digital finance can meet the needs of those small, medium and micro enterprises and low-income people who usually have difficulty in enjoying financial services, embodying the proper meaning of inclusive finance (Guo et al., 2020). Based on the availability of data, for the specific indicators, the development level of digital infrastructure is measured by the density of long-distance optical cables, the capacity of mobile phone switches per capita, and the number of Internet broadband access ports per capita (Yang Z. et al., 2022; Yang W. et al., 2022), which is the main carrier of information transmission and the basis for digitalization development at present; digital applications are measured from two aspects: production and life, through the number of websites owned by a company, the penetration rate of mobile phones (Lee et al., 2022), and the per capita express business volume; the development level of the digital industry is evaluated by the proportion of digital industry employment in urban unit employment, the proportion of digital industry fixed asset investment in the entire society’s fixed asset investment, and the proportion of digital industry income in regional GDP. For digital financial inclusion, the Peking University Digital Financial Inclusion Index of China (PKU-DFIIC; Guo et al., 2020) is used, which is based on the digitalization degree, breadth of coverage and depth of usage etc. Finally, the entropy weight method to assign weights to each evaluation index, and then use the TOPSIS method to quantify and sort the digitalization of each city to get the final value. The evaluation system of urban digitalization is constructed as shown in Table 1.
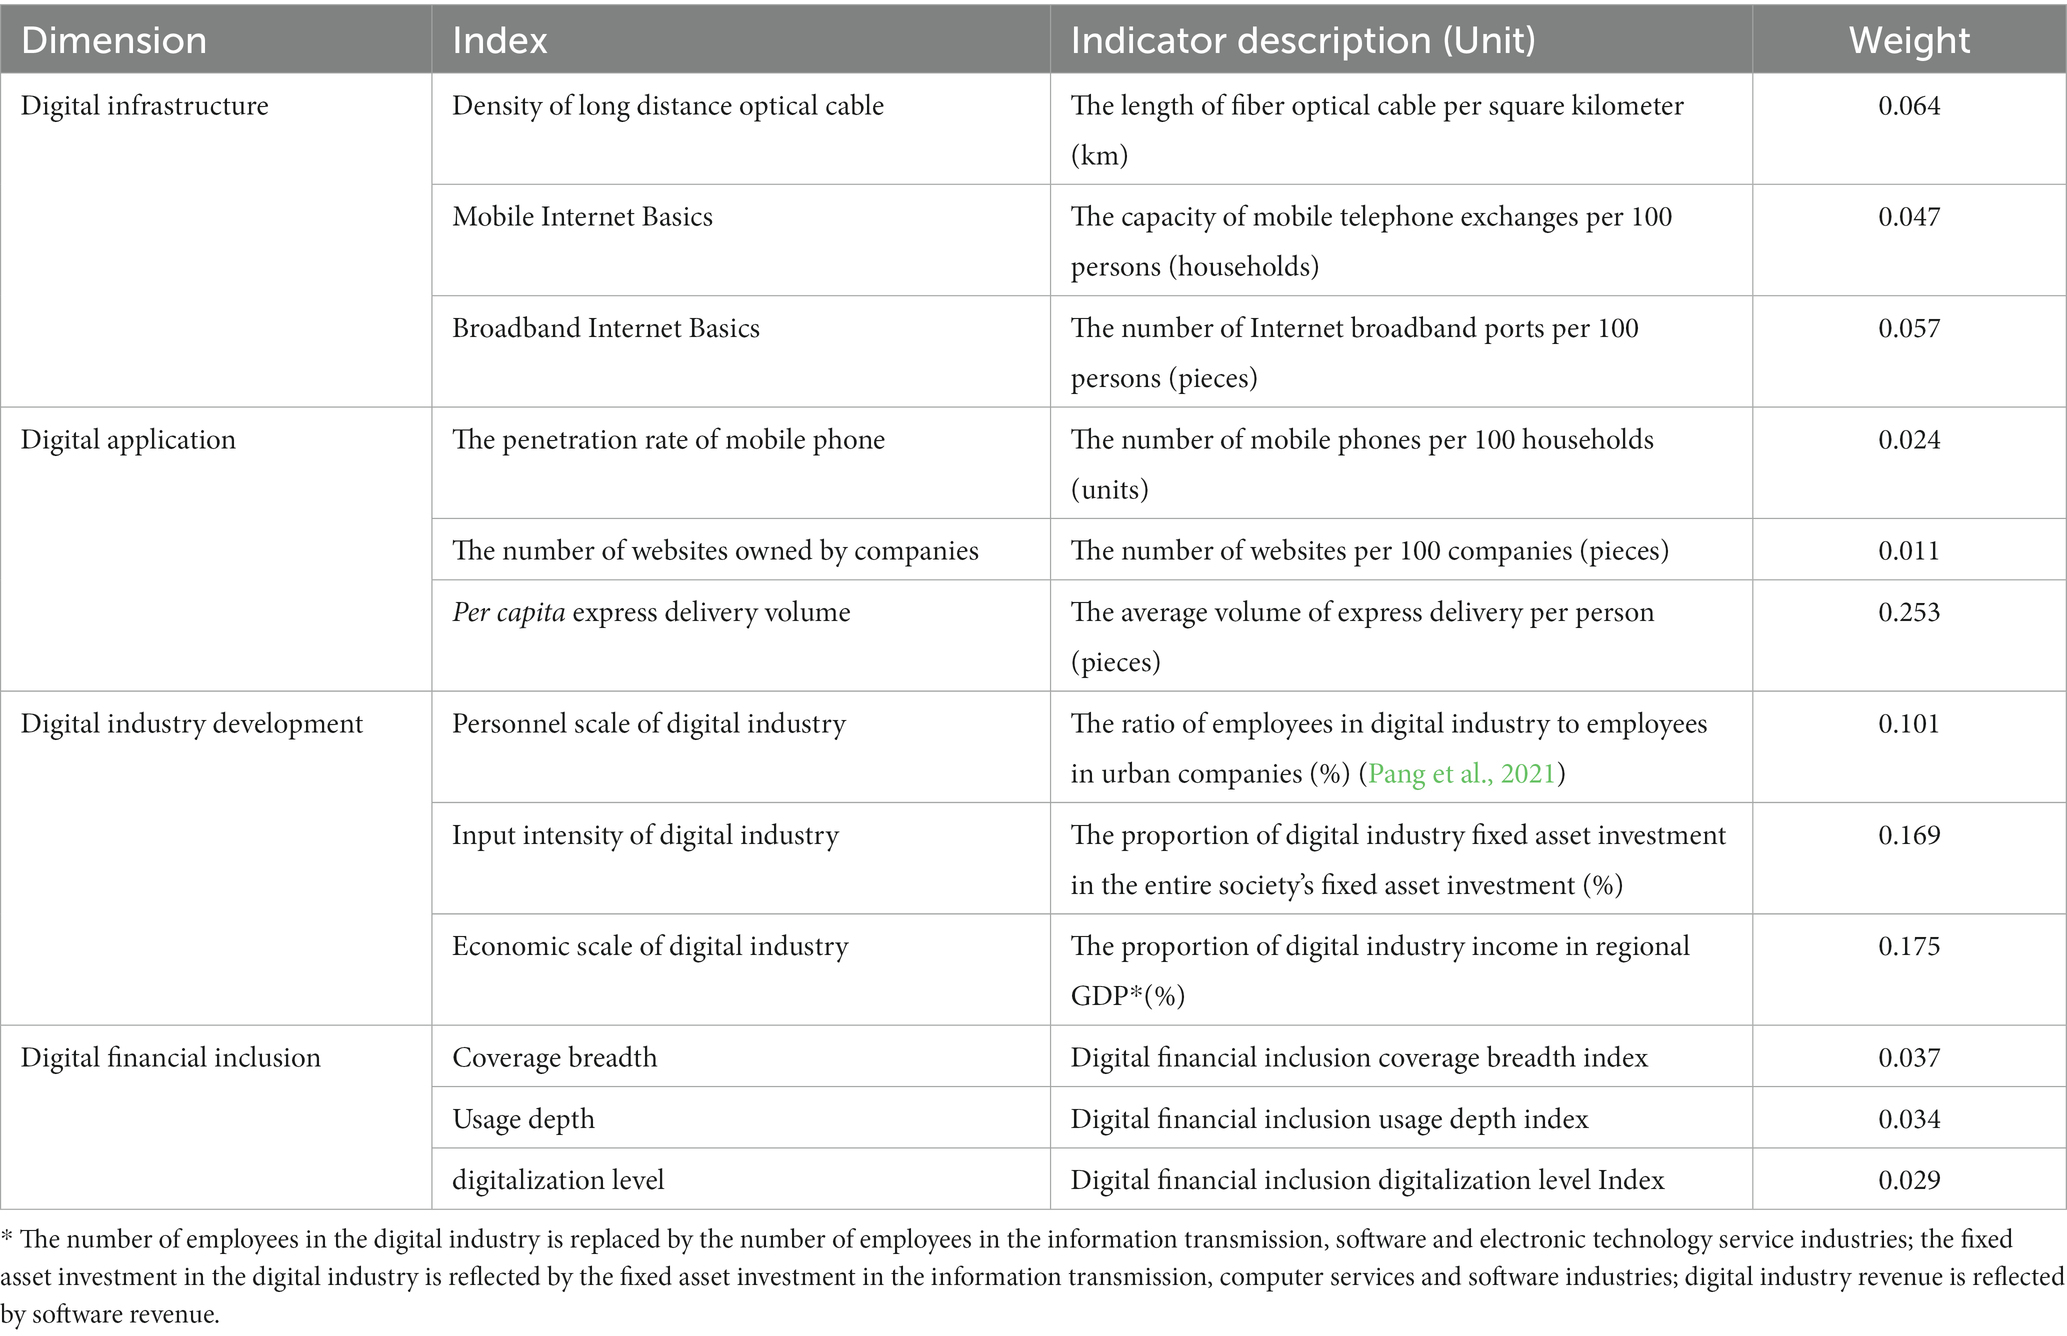
Table 1. Index system of urban digitalization.
Greening development does not simply refer to the scale expansion and total growth of social economy and material wealth, but refers to the overall transformation of regional growth patterns, development drivers, and resource allocation patterns (Fuyou et al., 2021). Greening development is systematic and multi-dimensional, paying more attention to the quality of factor supply and developing benefits, and optimizing economic structure and improving efficiency, so as to ultimately achieve sustainable social and economic development, better ecological environment development, and more adequate and balanced urban and rural economic and social development (Zhao et al., 2019). As a new model of high-quality sustainable development, greening development aims to achieve the coordinated development of economy, society and ecology through the all-round transformation in development mode, power mechanism, and resource allocation (Zou et al., 2022). Therefore, its essentials should be systematically and scientifically considered when constructing the greening development index system. Based on the existing research (Fuyou et al., 2021; Chen et al., 2022; Zou et al., 2022), this paper constructs a comprehensive evaluation index system of urban greening development involving four aspects: economy, environment, society and government. Economic greening is the core and premise of greening development. It promotes greening transformation and development through technological innovation at the micro level, industry ecological development at the meso level, and improves regional quality and efficiency and transforms the development mode at the macro level. Coordinated social development is an important support and inherent requirement for greening development, and it is achieved by means of integrated urban and rural development, equalization of basic public services, and equalization of opportunities for urban and rural development. Environmental greening is the carrier and characterization of greening development. It transforms the greening development mode through ecological environment endowment, pollutant discharge pressure and governance level, resource utilization efficiency and other means. Government regulation is the guide and guarantee of greening development. It promotes greening development through technological reform and innovation, industrial cultivation and optimization, and market optimization. Each evaluation aspect is measured by four index variables, making it more comprehensive and scientific to reflect the real situation of urban greening development. Finally, on the basis of obtaining each index value and each index weight assign gets through the entropy method (see Table 2), the comprehensive value of urban greening development level is obtained by Entropy-TOPSIS model, and classified by natural breakpoint method.
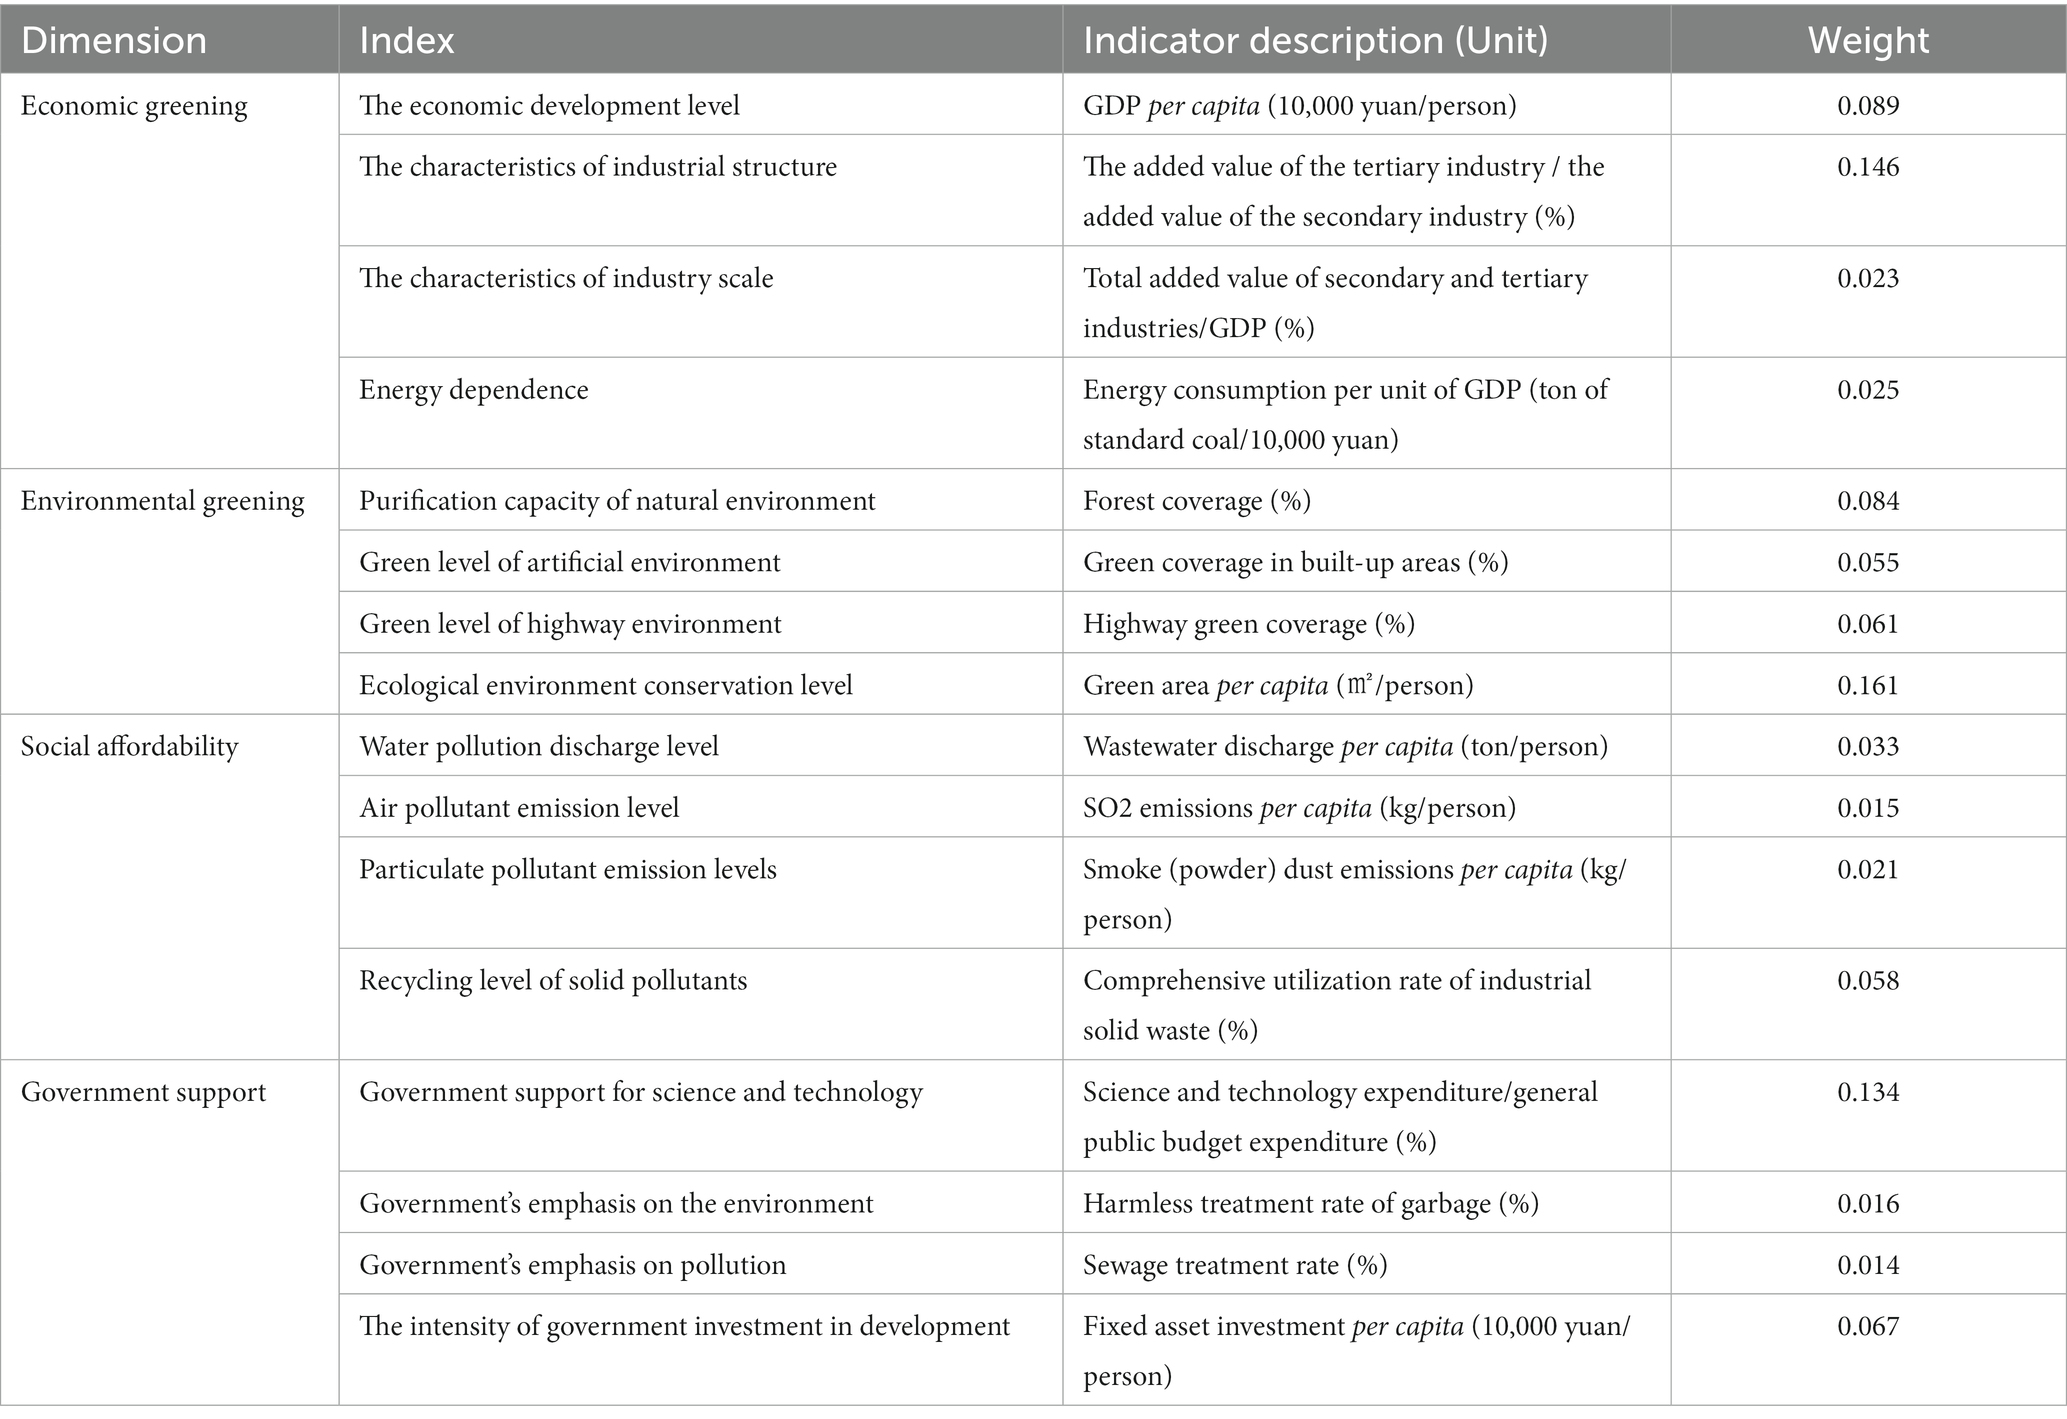
Table 2. Index system of urban greening development.
In view of sample continuity and data availability, this paper selects 276 prefecture-level cities in China from 2011 to 2020. The data involved are obtained from the “China Urban Statistical Yearbook,” “China Regional Economic Statistical Yearbook,” “China Statistical Yearbook,” “China Statistical Yearbook on Environment,” “China Industrial Economic Statistical Yearbook,” “China Electronic Information Industry Statistical Yearbook,” “Statistical Yearbook of China’s Basic Units,” “Statistical Report on China’s Internet Development,” “China Civil Affairs Statistical Yearbook.” In addition, some data that are not reported in the above yearbooks are collected from the statistical yearbooks and bulletins of all provinces, districts and municipalities. This map is based on the standard map of the Map Technical Review Center of the Ministry of Natural Resources [review number GS (2020) No. 4618].1
Regarding the measuring method of urban digitalization and greening, the Entropy-TOPSIS model, a comprehensive evaluation method, is used after referring to relevant research experience (Wang et al., 2021; Yi et al., 2021). The core idea is to use the entropy weight method to assign weights to each evaluation index (see Tables 1, 2) which is standardized beforehand, and then use the TOPSIS method to quantify and sort the digitalization and greening of each city to get the final value. The index weight value in entropy weight method is obtained based on the amount of information reflected by the variation degree of each evaluation index, which reduces the interference from human subjective factors. The TOPSIS method quantifies and sorts by comparing the relative distances between each measurement object and the optimal solution and the worst solution, which has the advantages of simple calculation and reasonable results (Li, 2021). The Entropy-TOPSIS method combines the advantages of the entropy weight method and the TOPSIS method, which makes the results more objective and reasonable (Huang et al., 2018). For the specific calculation steps, please refer to the existing literature (Lin et al., 2019).
A Markov chain is a Markov process with discrete time and state (Agovino et al., 2019). The method first discretizes the continuous urban digitalization level into k types, and then calculates the probability distribution of the corresponding types and their year-to-year variation, which approximates the entire process of regional evolution. Usually, the probability distribution of all urban greening types in year t is expressed as a 1 × k state probability vector Pt, denoted as Pt = [P1,t,P2,t,…,Pk,t]. The transition between urban greening types in different years can be represented by a k × k Markov transition probability matrix M (see Table 3). In Table 3, the element Pij represents the one-step transition probability that the area belonging to type i in year t will be transferred to type j in the next year, and is estimated by the following formula:
In the formula, nij represents the sum of areas belonging to type i in year t and transferred to type j in year t + 1 in the whole study period, and ni is the sum of areas belonging to type i in all years.
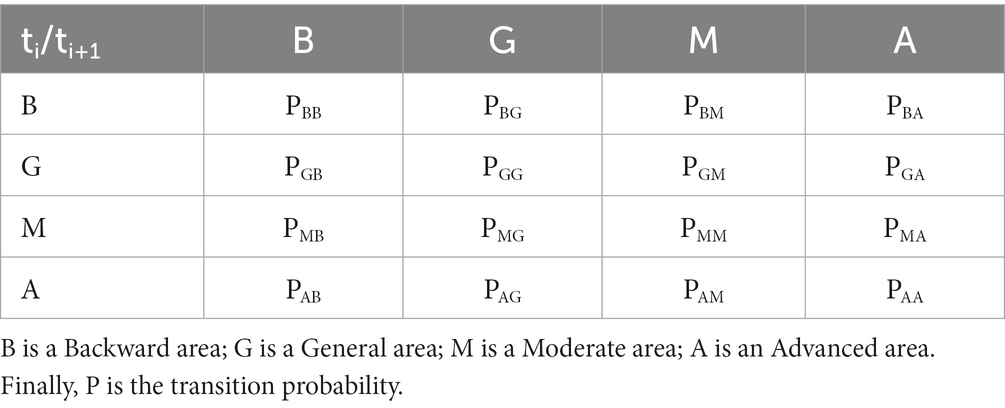
Table 3. Markov transition probability matrix (k = 4).
If the digitalization type of a city is i in the initial year and remains unchanged in the next year, the city’s type transition is steady. If the digitalization type of a city is improved, the type transfers upward; otherwise, the type transfers downward.
The Markov chain method can describe the spatial and temporal differentiation and evolution of digital development in cities, but it ignores the spatial effect of geographic proximity on digital development. With the rapid development of spatial metrology in recent years, the spatial effect has been introduced into the Markov chain. So this study also introduced the spatial lag effect into the Markov chain, namely the spatial Markov chain (Le Gallo, 2016).
Spatial Markov chain is the product of combining traditional Markov chain method with “spatial lag” (Chun and Xuetong, 2021). To accurately measure the spatial effect, firstly, a spatial weight matrix (W) must be established to show cities’ spatial relationship with the surrounding cities. Secondly, through the spatial lag operator, that is, the product (W*X) of the urban observation value vector (X) and the spatial weight matrix (W), the neighboring status of each city is determined, which provides a methodological basis for the subsequent quantitative analysis of the spatial distribution pattern in cities. Specifically, the spatial lag of a city is the weighted average of the city’s neighborhood observations, and the formula for the spatial lag value is as follows (Agovino et al., 2019):
In the formula, lag is the spatial lag value, which is used to judge the digitalization level of the spatially adjacent cities, Xi represents the digitalization level of city i, and Wij represents the spatial weight matrix. In this study, the first-order Rook adjacency principle is used to determine the spatial weight matrix (Agovino et al., 2019; Li et al., 2022).
The spatial Markov transition probability matrix is conditioned on the spatial lag type of city i in the initial year, and the traditional k × k (k = 4 in this study) Markov matrix (Table 1) is decomposed into k k × k conditional transition probability matrices (Table 4). For the k-th conditional matrix, the element pij(k) represents the one-step spatial transition probability that the area belongs to type i in this year and transitions into type j in the next year, conditioned on the area’s spatial lag type k in year t.
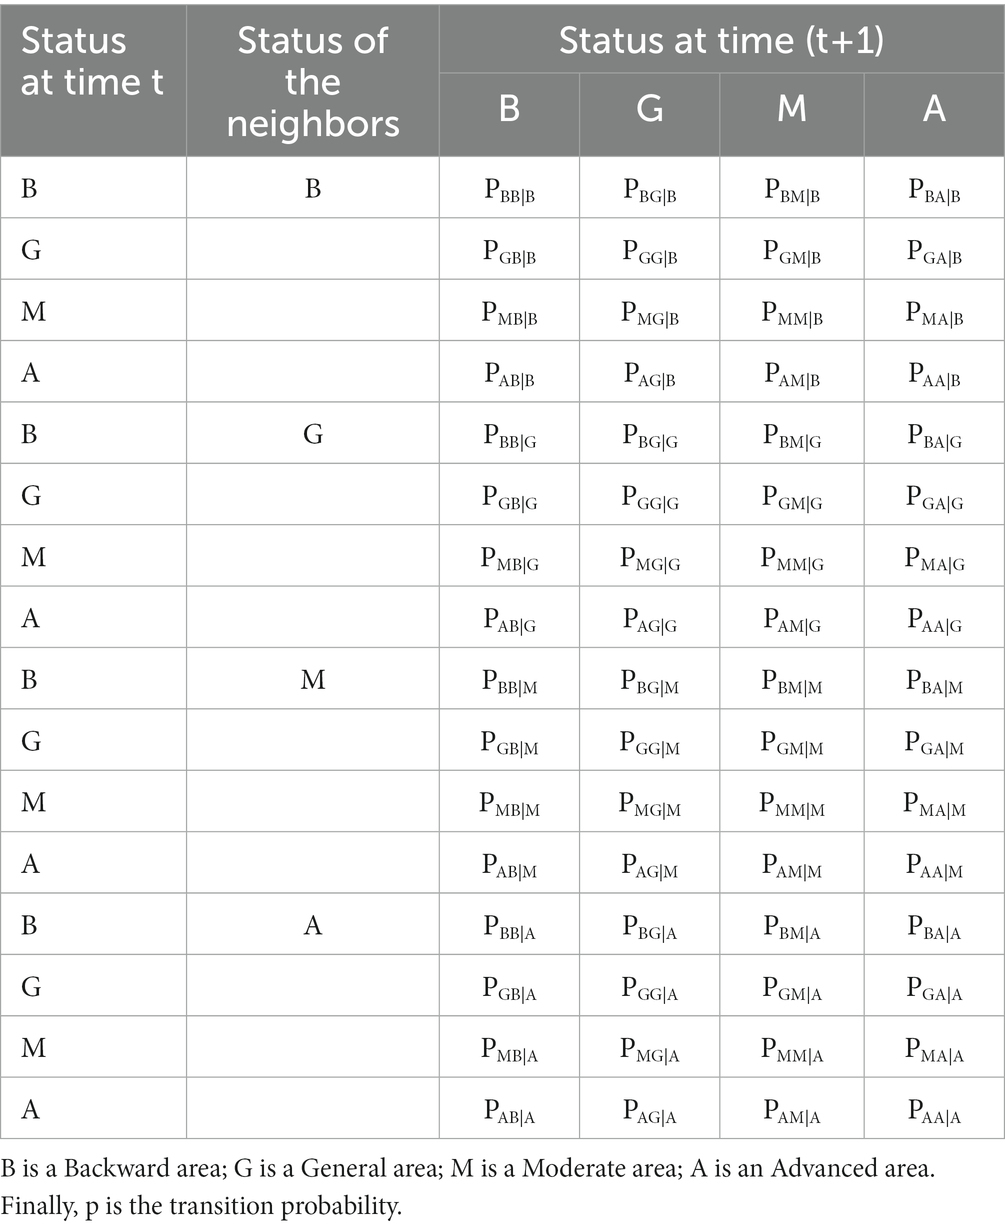
Table 4. A spatial Markov matrix.
Table 4 can be used to analyze the possibility of the digitalization level shifting upwards or downwards in a city in different contexts. For example, to examine the impact of the low-level neighbors on the digitalization type transition of a city, the conditional matrix with spatial lag type “B” in Table 4 can be analyzed. Among them, the matrix element PBG|B represents the probability that a Backward area will be shifted upward to a General area (G) when the digitalization type of the surrounding neighbors is Backward (B). Similarly, the impact of neighbors on digitalization type transition of a city in other contexts can also be analyzed. In addition, by comparing the corresponding elements in Markov matrix (Table 3) with that of spatial Markov matrix (Table 4), we can understand the relationship between the probability of a city’s upward or downward transition and its surrounding neighbors, then further explore the overall effect of surroundings on the city’s transition. For example, if PBG > PBG|B, it means that a backward digitized city (B) (regardless of neighbors) has a higher probability of transitioning upward into a General area (G) than when it has a Backward area (B) as its neighbor; if PBG < PBG|A, it means that the probability of a Backward digitized city (B) (regardless of neighbors) transitioning upward into a General area (G) is smaller than that of the case when it is adjacent to an Advanced digitized city (A). In other words, if the surrounding context of a city is not important to its digitalization transition, there are:
In this study, the global Moran’ I index is used to analyze the spatial autocorrelation of urban greening. The index was proposed by Patrick Alfred Pierce Moran in 1950. The relevant formula is as follows (Ma et al., 2022a):
In the formula, the value range of I is [−1, 1]. When I is greater than 0, it means that the distribution of greening development among cities has a positive spatial correlation, the larger the value, the stronger the spatial correlation; when I is less than 0, it means that the distribution of greening development among cities has a negative spatial correlation; when I is equal to 0, it means that the distribution of greening development among cities has no spatial correlation. , , respectively, represent the greening development level of the ith and jth city in China. is the mean value. n denotes the sum of all study units (Hao and Liu, 2016; Ma et al., 2022b).
According to the existing researches on urban greening (Wang et al., 2021; Tan et al., 2022; Yang Y. et al., 2022; Zhao et al., 2022), this study selects urban greening development level as the dependent variable. In addition to the core explanatory variable – urban digitalization, for more accurate results, this paper selects urbanization rate, innovation ability, degree of openness, city’s emphasis on environmental pollution and wealth level of urban residents as the independent variables to measure and analyze the impact of different factors on urban greening. There are obvious spatial correlations in urban greening, ignoring which may lead to bias in coefficient estimation when exploring the influencing factors of urban greening. Therefore, a spatial econometric model needs to be established. This study constructed the spatial Durbin model (SDM) as follows:
In the formula, denotes the level of urban greening; denotes the explanatory variable, including the core explanatory variable – urban digitalization level, and other control variables; denotes the spatial lag regression coefficient, which reflects that to what extent the greening of spatially adjacent areas affects each other; denotes the constant term; denotes the regression coefficient for the explanatory variable; represents the spatial lag regression coefficient of the explanatory variable; represents the regional effect; represents the time effect; is a random interference term.
Referring to the existing literature (Li et al., 2022; Zhao and Wang, 2022), this study adopts the Durbin model based on four spatial weight matrices for empirical exploration. Details about the four spatial weight matrices are as follows:
(i) Geographic adjacency weight matrix.
The principle of Rook adjacency on constructing Wij1 is that two cities are regarded as adjacent when they have a common boundary; otherwise, they are regarded as non-adjacent. Because Zhoushan city has no common boundary with other cities, this paper assumes that Zhoushan city is only adjacent to Ningbo city (Ma et al., 2022a,b), and other cities in the same situation are not covered by this study due to a lack of data. The elements in row i and column j of Wij1 are defined as follows:
(ii) Geographic distance weight matrix.
Tobler’s First Law of Geography states that the closer the geographical distance between regions, the higher the correlation degree of air pollution (Tobler, 1970). According to the limited distance proposed by Pace and Barry (1997), this paper constructs the geographical distance weight matrix Wij2, and provides the following definition:
where, dij is the spatial distance between the city i and city j based on Cartesian coordinates. In addition, in order to analyze the spatial effect of urban digitalization on urban greening under different geographical distance thresholds, a geographical distance threshold of every 100 km in 100–1,000 km is used to construct a geographical distance weight matrix, and the SDM model is used to perform continuous regression on it to analyze the spatial spillover effects of urban digitalization in multi-distance economic circles.
(iii) Economic weight matrix.
Considering the economic connection and the transfer of industries among cities, we construct the economic weight matrix Wij3 to reflect socio-economic factors. Wij3 is defined as:
(iv) Economic-geographic nested weight matrix.
Considering the economic connection and the transfer of industries among regions, we further construct the economic-geographic nested weight matrix Wij4 to reflect both geographic distance factors and socio-economic factors. Wij4 is defined as:
After reviewing a large number of literature (Wang et al., 2021; Tan et al., 2022; Yang Y. et al., 2022; Zhao et al., 2022), we found that scholars in various fields have conducted extensive and in-depth discussions on the influencing factors of urban greening development, mainly involving three aspects: population, economic development and industrial structure. As the academic research is deepening, factors such as urbanization, economic growth, foreign trade, and industrial structure have also been incorporated into the model by scholars. Based on the existing models and theories, the relevant research results of urban greening are integrated. In addition to the core explanatory variable – urban digitalization, for more accurate results, the urbanization rate that can reflect the development level of urbanization, the urban innovation level that reflects the innovation and development potential, the opening up level that reflects the degree of urban openness, diversity and internationalization, the intensity of urban environmental regulation that reflects the government’s emphasis and control over the ecological environment, and the wealth level of urban residents are selected as independent variables to measure and analyze the influence of different factors on urban greening. See Table 5 for details.
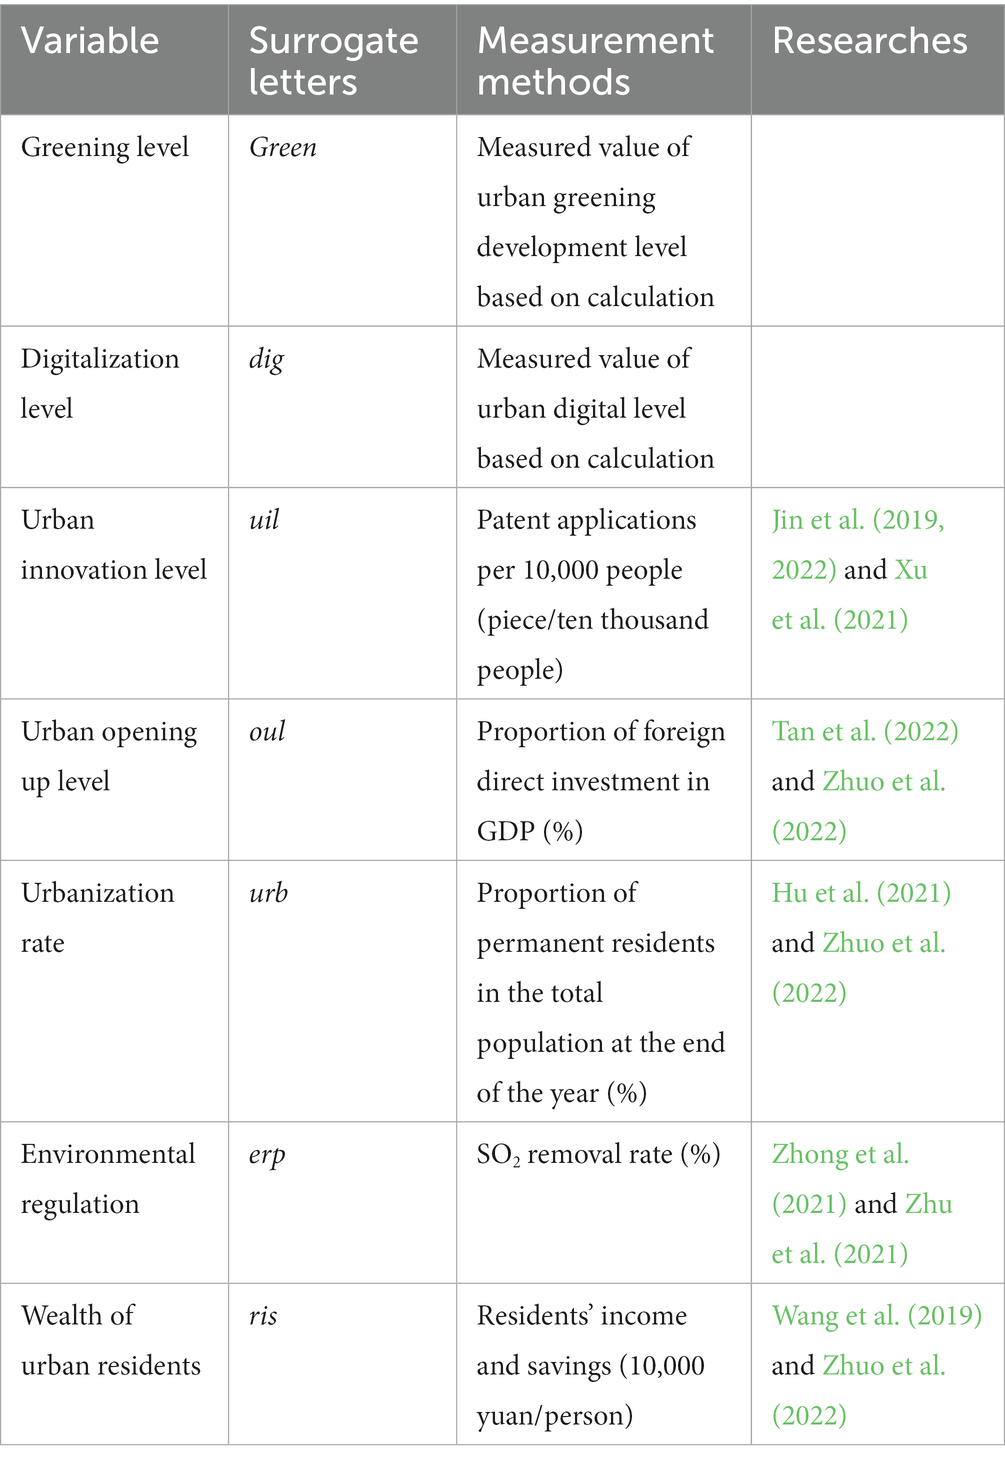
Table 5. Variable description.
Through Entropy-TOPSIS model, the comprehensive value of the digitalization level of each city is measured. By natural break-point method, the comprehensive value of all cities is divided into four level types: Backward area (<0.30), General area (0.30–0.45), Moderate area (0.45–0.60) and Advanced area (>0.6).
In order to analyze the spatio-temporal distribution and evolution characteristics of the urban digitalization process, ArcGIS 10.6 software is used for visual display, and the results are shown in Figure 1. Over time, the digitalization development pattern has changed from the “multi-point” sporadic distribution with the Advanced areas (A) as the core to the “group-type” aggregation pattern, and the digitalization level of most cities has improved. Especially, during the period from 2011 to 2016, Backward areas (B) began paying attention to digitalization development, showing a trend of being transitioned to General areas (G) or Moderate areas (M). However, due to the factors such as endowments, location, and development foundations, the gap in digitalization development levels among cities has not been improved significantly. Finally, a digitalization development pattern has been formed with urban agglomerations such as Beijing-Tianjin-Hebei, Yangtze River Delta, Guangdong-Hong Kong-Macao and coastal economic belts as the core, among which the Yangtze River Delta urban agglomeration is particularly prominent. The details are as follows: in 2011, the digitalization level ranged from 0.101 (Tongchuan city) to 0.636 (Shanghai). Due to the differences in digital foundation and industrial development level, the gap in digitalization development was obvious. The digitalization level of most cities was generally low. In 2020, the overall level of digitalization development was significantly improved. Its pattern showed a cluster form in which digitalization was spread from the core cities to surroundings (see Figure 1). To explore the reasons, on the one hand, the core cities affected the development of surrounding cities through the spillover effect of digital technology. On the other hand, digital resources diffused from the core cities improved the development pattern and structure of the surrounding cities through the optimal allocation of digital elements. The above can be clearly verified from the development of Yangtze River Delta urban agglomeration in Figure 1.
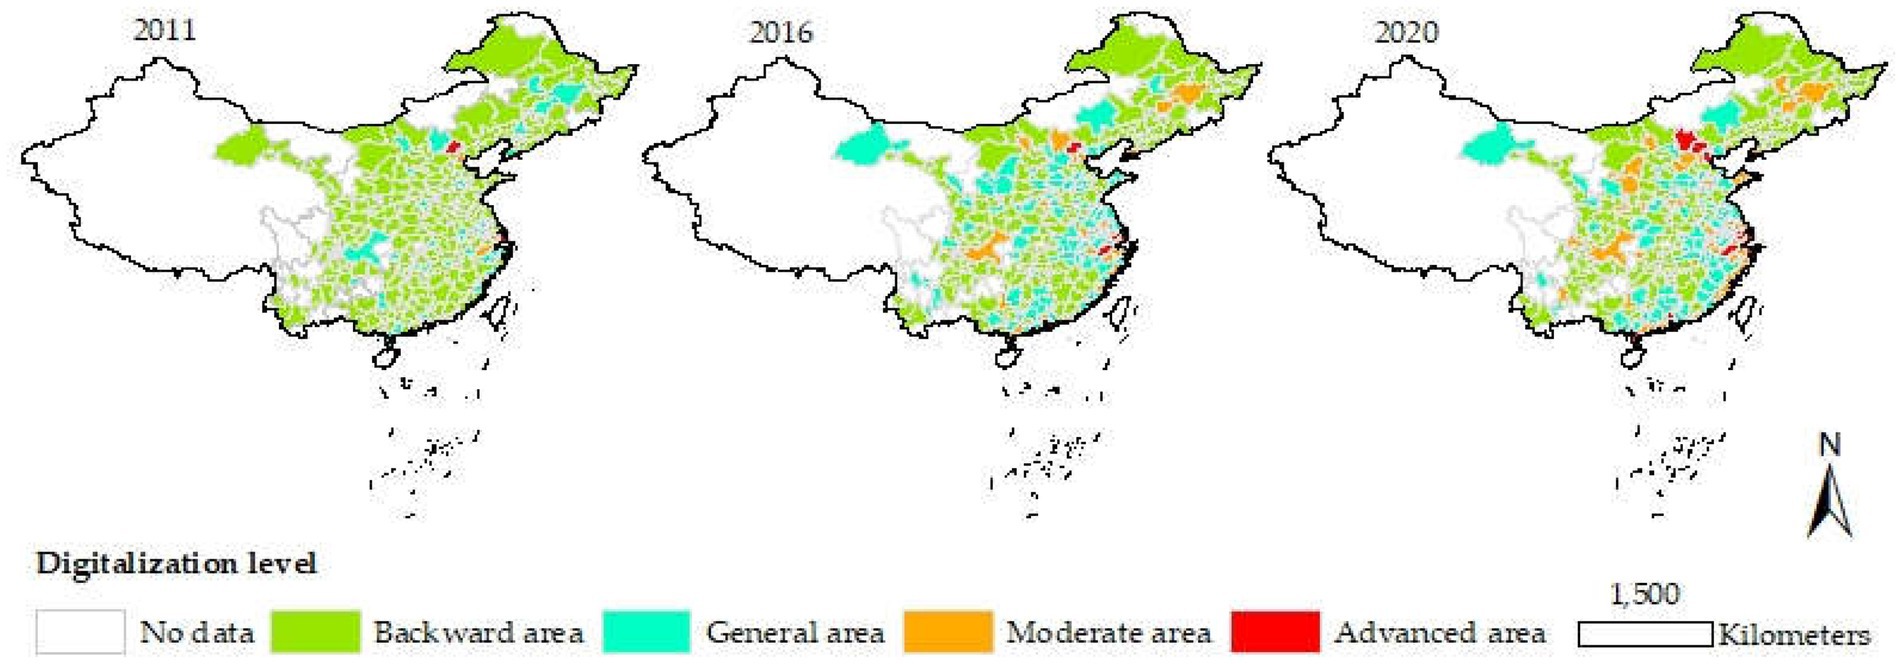
Figure 1. The spatiotemporal evolution of digitalization development in China’s cities. This map is based on the standard map of the Map Technical Review Center of the Ministry of Natural Resources [review number GS (2020) No. 4618], and the base map has not been modified.
In order to analyze the transition dynamics and vitality of urban digitalization development, this study calculates the transition probability of digitalization from 2011 to 2020 with the Markov chain method. The results are shown in Table 6. On the whole, the urban digitalization development in each area has obvious characteristic of club convergence with a generally low internal mobility. The value of the main diagonal reflects the probability that the digitalization level remains unchanged. From the probability values of the main diagonal, the Advanced area (A) of digitalization development has the highest transition probability, followed by the Backward area (B) and the General area (G), and the Moderate area (M) has a relatively low one. The main diagonal values are all greater than 0.80, which reflects that an obvious solidification phenomenon exists in the digitalization level. The values above the main diagonal reflect the probability of the digitalization development level shifting upward, indicating that the probability of transitioning from the Moderate area (M) to the Advanced area (A) is the highest, which is 0.186. However, in general, the probability of transitioning to the upper level is low, and the probability of leapfrogging upward is even lower, less than 0.037, which indicates that the digitalization development is still in a steady stage with an asymptotic trend, and it is difficult to carry out leapfrog development.
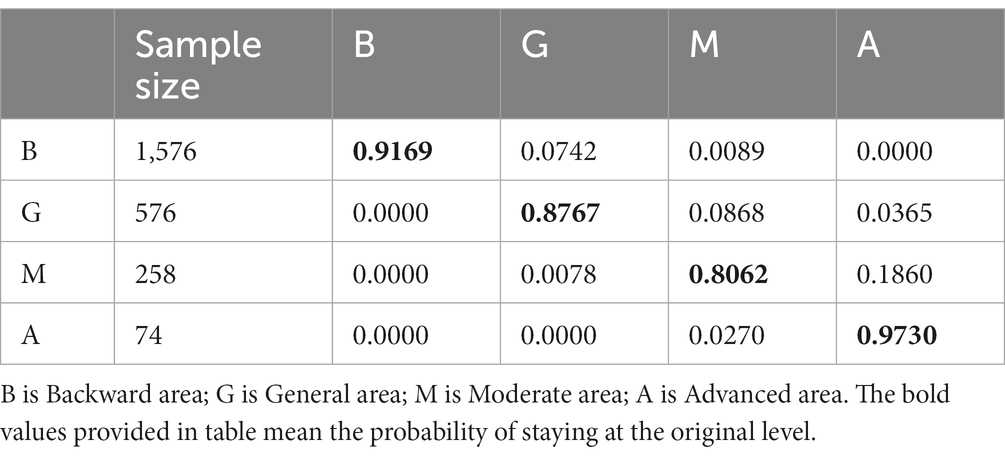
Table 6. Markov transition probability matrix (k = 4).
The spatial distribution of digitalization development shows a certain characteristic of spatial agglomeration. In this study, the spatial Markov transition matrix is used to explore the probability of digitalization level transition as it is affected by the adjacent areas. The results are shown in Table 7. For the transition probability of digitalization level in areas adjacent to Backward area (B), the probability values in Backward area (B), General area (G), Moderate area (M) and Advanced area (A) on the main diagonal are, respectively, 0.976, 0.981, 0.979, and 0.905, among which, the probability value of Advanced area (A) is the lowest, and that of General area (G) is the largest, which indicates that in the adjacent areas of the Backward area (B), the digitalization development level of the Advanced area (A) has the highest probability of downgrading and is the most active one, while the General area (G) is the opposite. Influenced by the adjoining Backward area (B), both Moderate area (M) and Advanced area (A) have downward transition situation. It tells us that the spatial effect of adjacent areas cannot be ignored. Besides, in the other three spatially adjacent situations, there is no downward transition phenomenon. For the areas adjacent to General area (G), the transition probability values in Backward area (B), General area (G), Moderate area (M) and Advanced area (A) on the main diagonal are, respectively, 0.918, 0.882, 0.949, and 1.000, among which, Advanced area (A) has the largest one, which indicates that its transition activity is weak, and the General area (G) has little influence on it. For the areas adjacent to Moderate area (M), the transition probability in Backward area (B), General area (G), Moderate area (M) and Advanced area (A) on the main diagonal are, respectively, 0.634, 0.857, 0.907, and 1.000, all of which are relatively low in transition vitality. For the areas adjacent to Advanced area (A), the transition probability in Backward area (B), General area (G), Moderate area (M) and Advanced area (A) on the main diagonal are, respectively, 0.182, 0.391, 0.216, and 1.000. Except for the Advanced area (A), the other three areas have high transition vitality, largely because they are in adjacent to the Advanced area (A). In particular, the upward transition probability in Backward area (B) and Moderate area (M) reached 0.636 and 0.784, respectively. Both Backward area (B) and General area (G) have certain probability of leapfrogging upward. In general, the state transition of urban digitalization has a certain spatial correlation and is affected by the digital development of surrounding cities. Moreover, the influence of different digitalization development levels in the dynamic transition process are obviously heterogeneous. Areas in high development levels can drive the common development of surrounding areas, increasing the transition probability toward higher clubs. However, the upward transition probability is still low on the whole, and there is a clear phenomenon of club convergence.
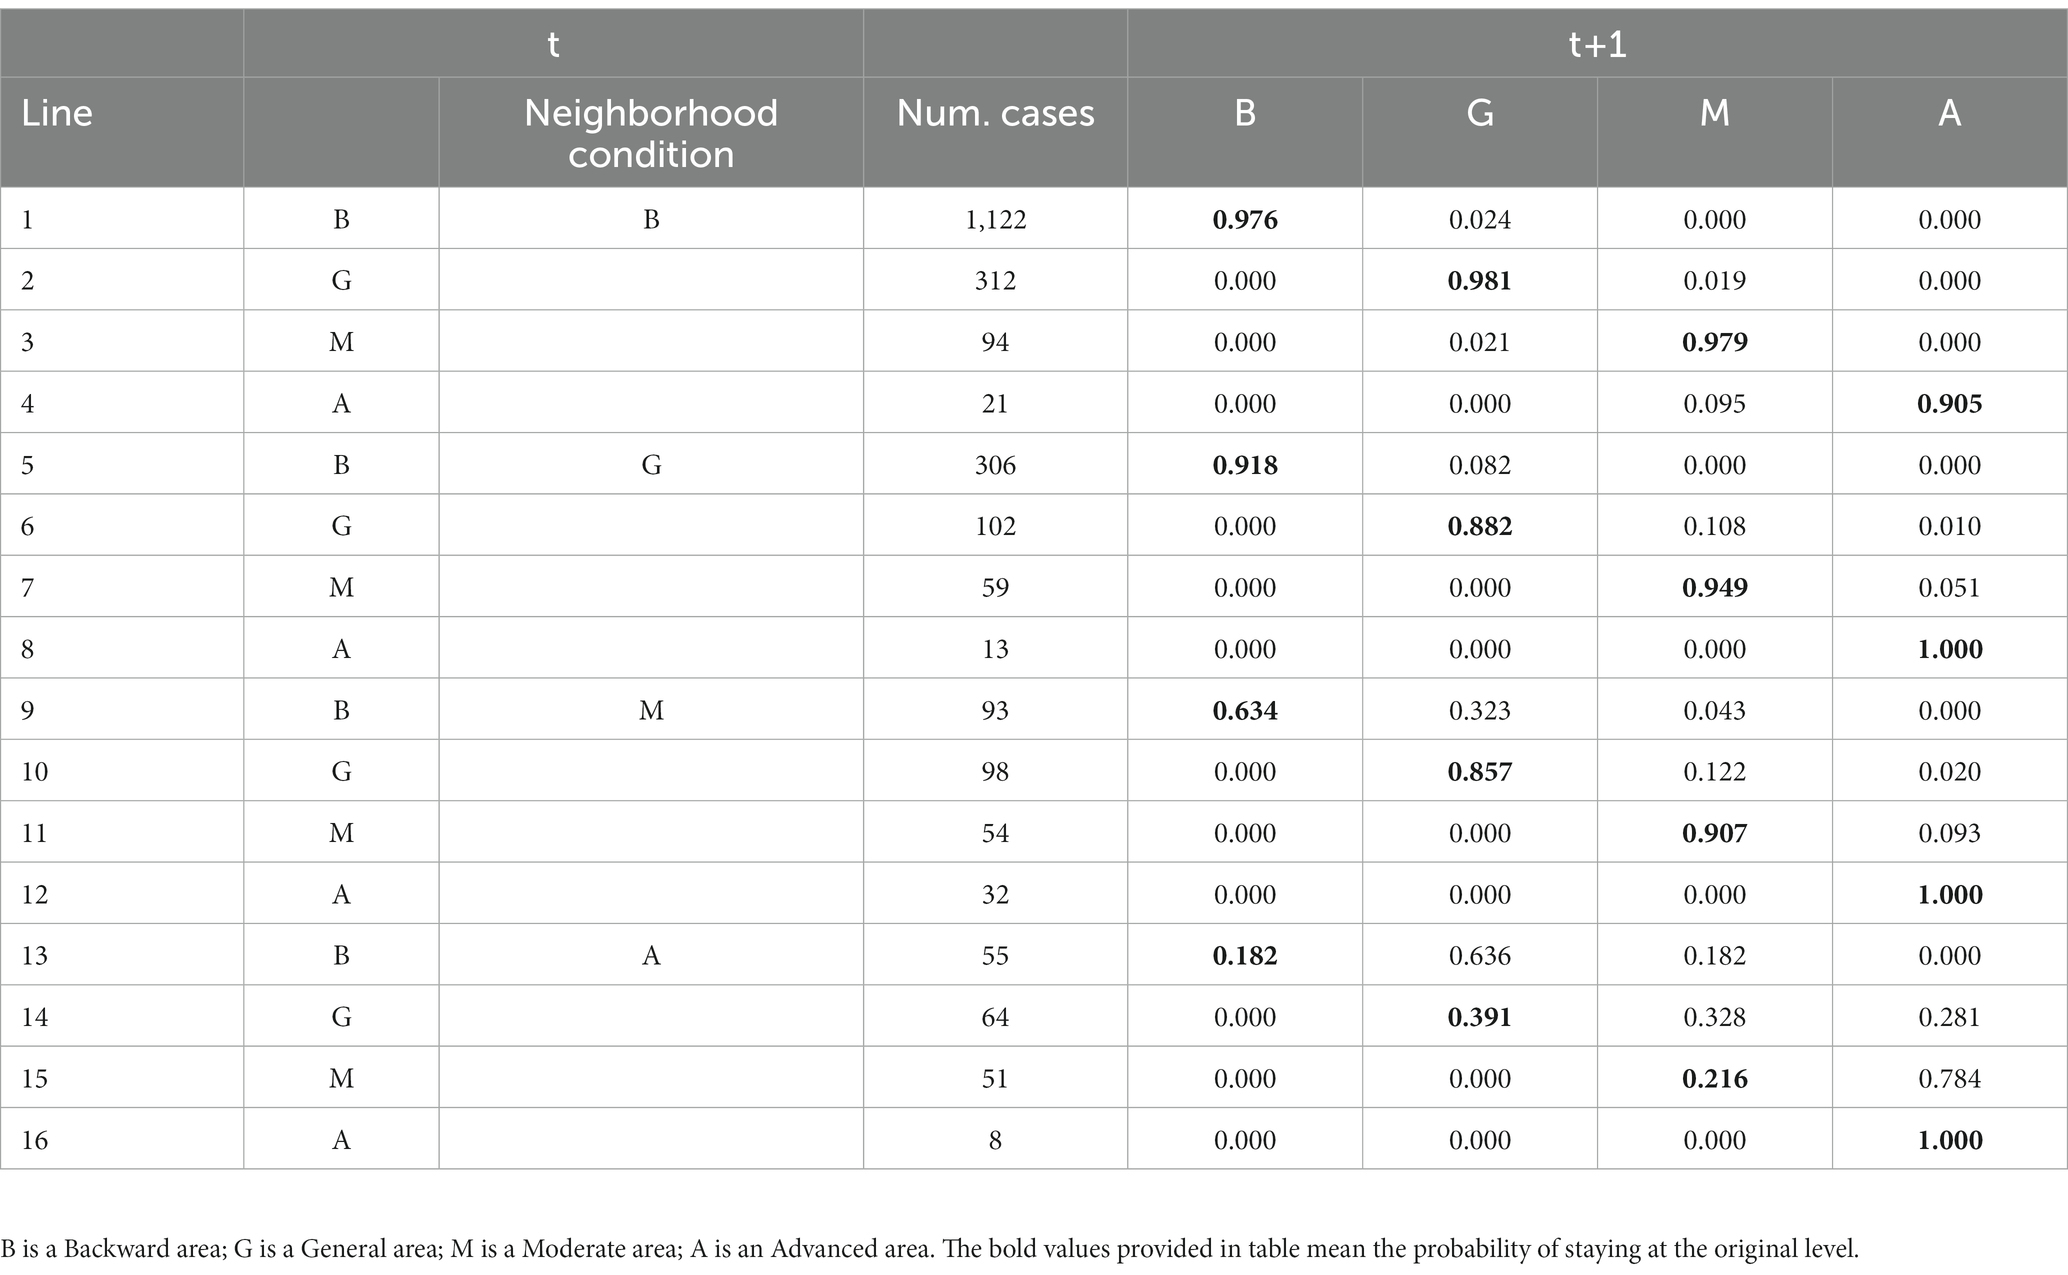
Table 7. Spatial Markov matrix.
In order to explore the greening distribution characteristics of 276 prefecture-level cities in China, the greening data of each city is divided into four levels: less than 0.3, 0.3–0.5, 0.5–0.7 and greater than 0.7 by the natural breakpoint method, and the ArcGIS 10.6 software is used for visual display. In general, the pattern of urban greening is low in the north and high in the south with prominent differences between the north and the south, which may be closely related to the relationship between energy consumption and the geographical environment. In addition, the Chengdu-Chongqing area, the Yangtze River Delta urban agglomeration, the Pearl River Delta urban agglomeration, and the central urban agglomeration represented by Wuhan also have a relatively high level of greening. These areas have high level of industrialization and high-tech, and other industries in these areas are highly green, too. The level of urban greening development has been significantly improved over time.
This paper employs the global Moran’s I index to explore the characteristics of urban greening development in China, which shows a certain degree of agglomeration. In order to deeply analyze the spatial correlation, global Moran’s I index of urban greening development under different spatial distance thresholds was calculated (Table 8). The results show that the p values of urban greening under different spatial distance thresholds from 2011 to 2020 are all less than 0.01, and the Z index test values are all positive and greater than 2.58, which indicates that urban greening development has significant spatial agglomeration. Specifically, as the spatial distance threshold increases, Moran’s I index continues to decrease. This is because the urban greening development process presents small-scale agglomeration, which is also verified from the urban greening development pattern shown in Figure 2. In addition, Moran’s I index showed a “W”-shaped fluctuation trend that first decreased and then increased. But overall the degree of spatial agglomeration is diminishing. The close connection between cities and their correlation in the process of economic development, as well as the equalization and convergence of national policies in recent years have certain influences. The urbanization process, social factors and natural environment will also have an impact on the correlation of urban greening development in China. The existing volatility reflects the transformation and convergence of the dynamic factors in the process of urbanization and greening in China.
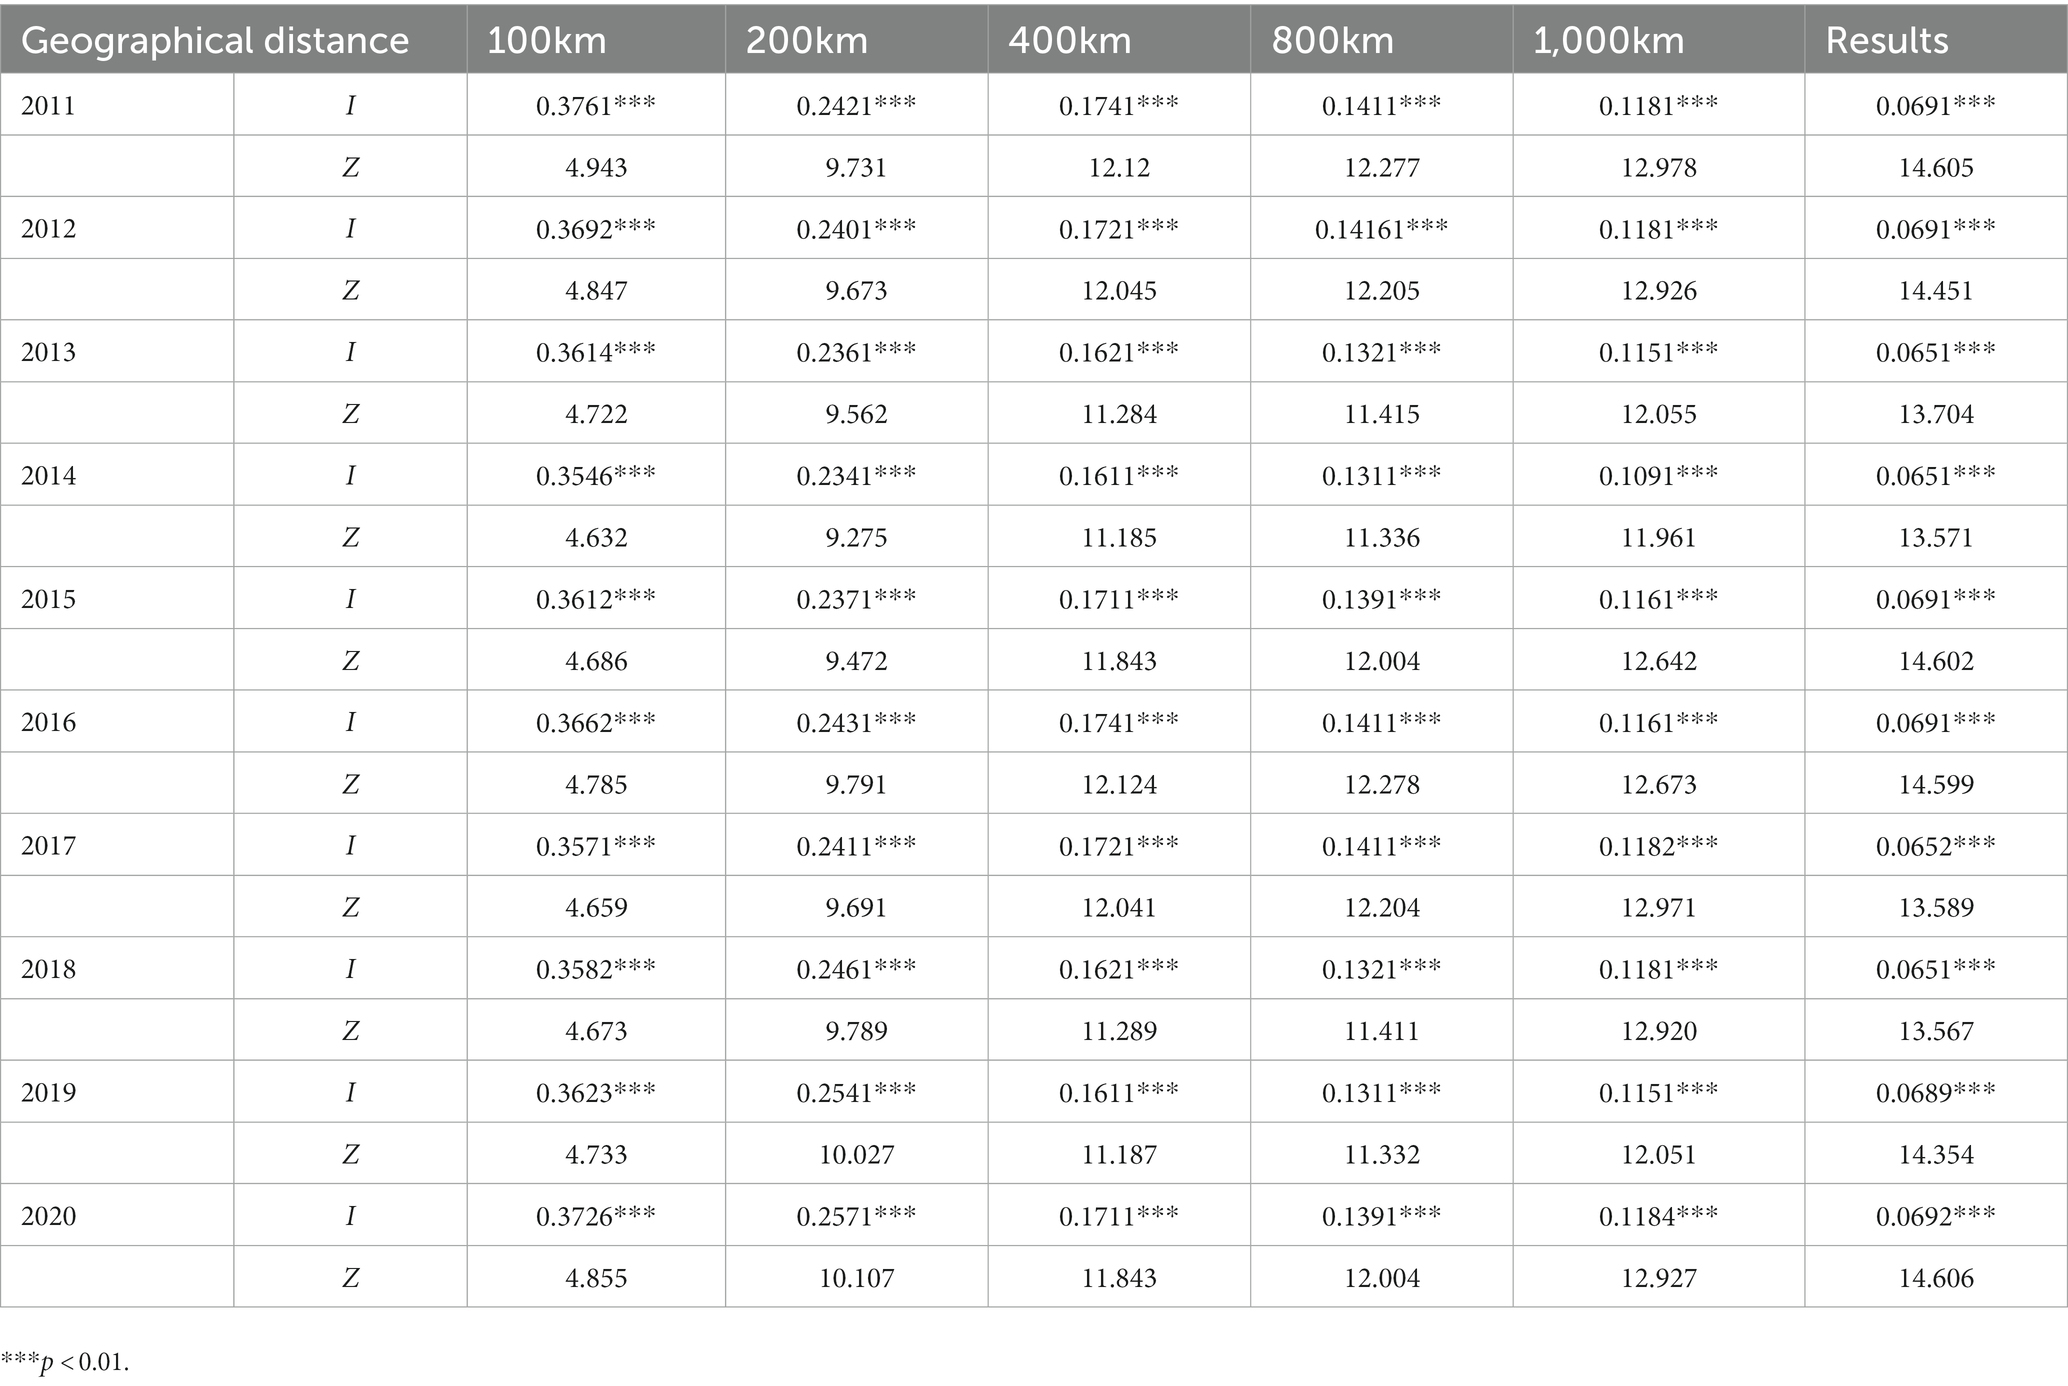
Table 8. Moran’s I index of urban greening development level under different spatial distance thresholds.
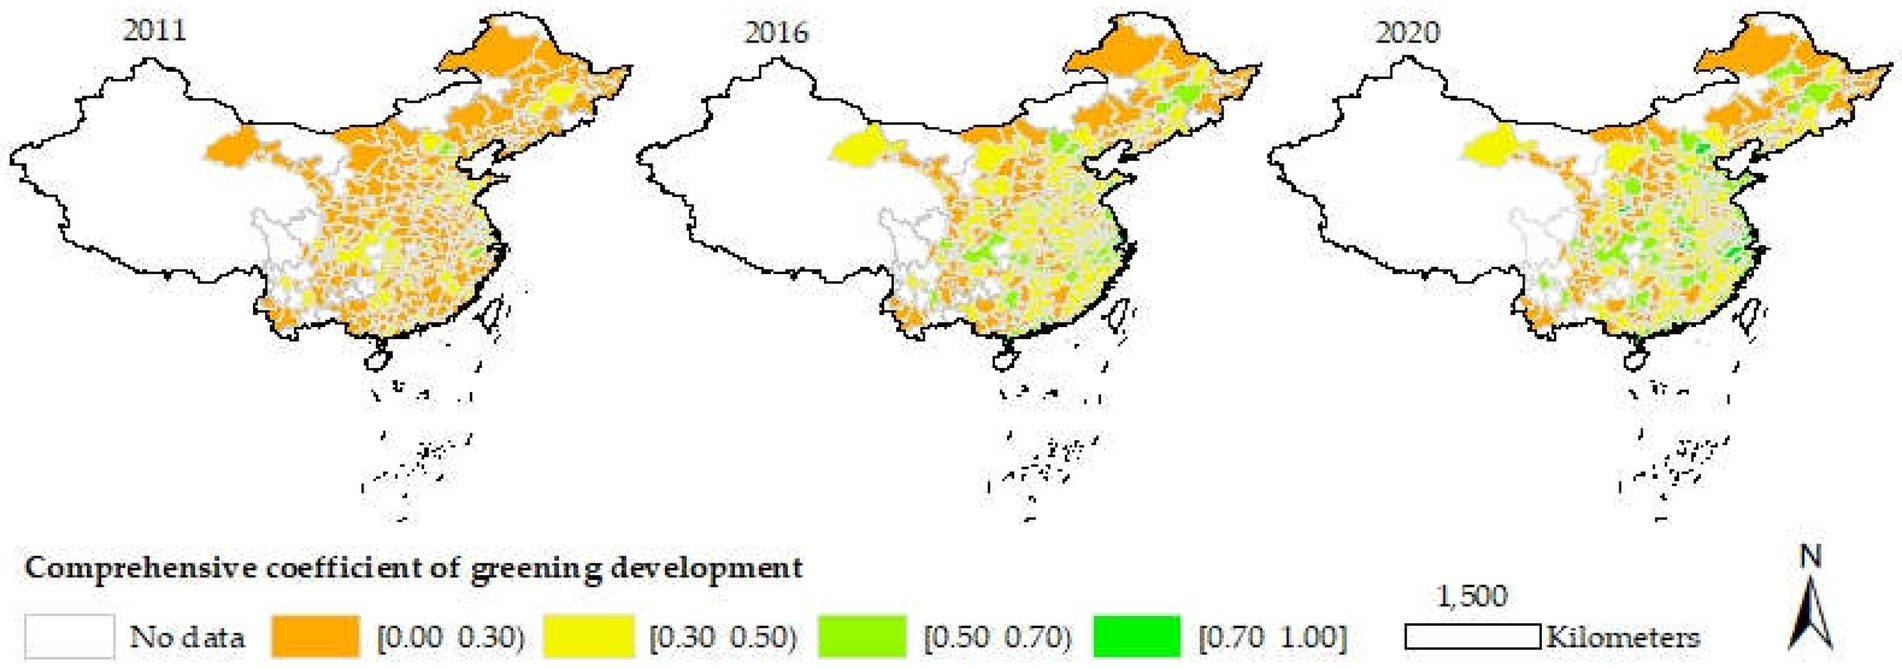
Figure 2. Spatio-temporal evolution of greening development in China’s cities. This map is based on the standard map of the Map Technical Review Center of the Ministry of Natural Resources [review number GS (2020) No. 4618], and the base map has not been modified.
For this part, Wald test and LR test were firstly performed, both of which passed the 1% significance test, thus rejected the null hypothesis of using the SLM model or the SEM model, indicating that the spatial error term and the spatial lag term exist at the same time. Therefore, this study used the spatial Durbin model (SDM) for analysis. As the calculated Hausman test results passed the 1% significance test, it proves to be better to choose a fixed-effects model. Because of the existence of spatial correlation, we used the quasi-maximum likelihood estimation (QMLE) rather than the traditional OLS method for more accurate estimation, whose final results were shown in Table 9. It can be seen from Table 9 that under the four weights, the influence coefficients of digitalization on urban greening development are all significantly positive, which indicates that the development of digitalization can significantly improve the greening level in cities. As digitalization keeps developing, technological progress has led to industrial upgrading, which in turn has promoted the adjustment of energy structure. The gradual penetration of the Internet of Things and big data have made urban resource allocation more effective, generating economic externalities to make industrial production and urban energy utilization more efficient, so that the environment can be further improved, and the pressure on the government can been weakened as well. In summary, digitalization has a positive effect on urban economy, environment, society and the government, leading to the further improvement of urban greening.
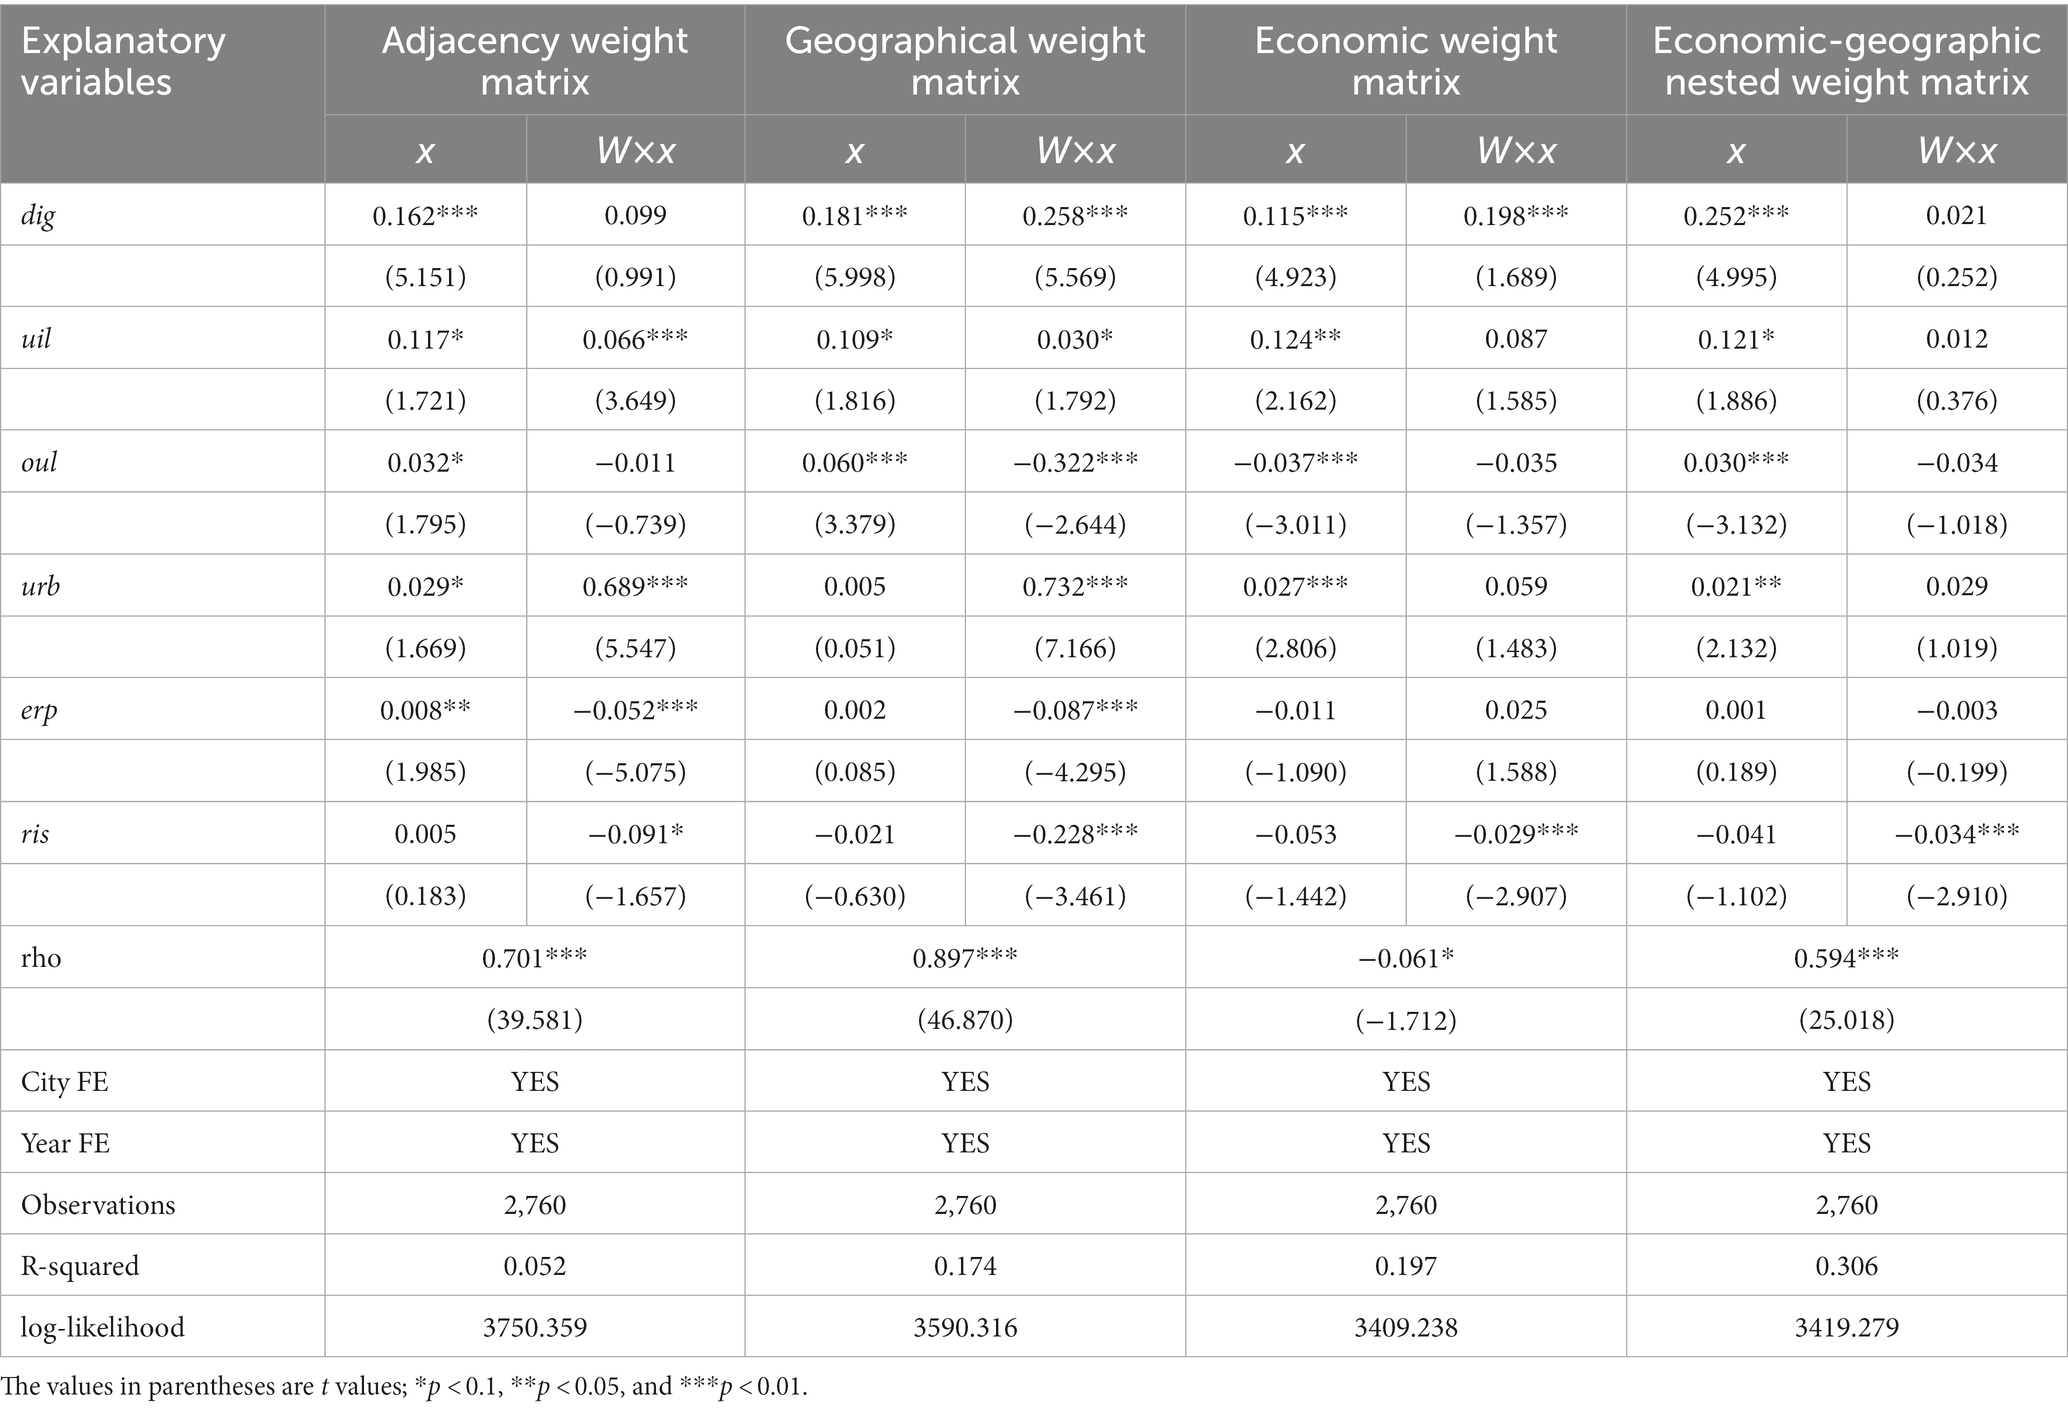
Table 9. Regression of results.
Regarding the control variables, the urban innovation capability (Uil), whose coefficient and significance are slightly different under different spatial weight matrices: under the adjacency weight matrix, it has a positive effect on the urban greening development of adjacent areas, which may be because innovation brings efficient usage of technology and energy, and has obvious spillover effect; under the economic weight and the economic-geographic nested weight matrix, the urban innovation capability has the most obvious effect on the urban greening development. This may be because in the process of economic development, the advancement of urban innovation level has led to the upgrading of industries and the optimization of energy utilization. As the environmental pollution has been fundamentally and technically improved, the urban greening level was significantly improved accordingly. Urban opening up level (oul), the coefficients of this variable are significantly different under the four weight matrices. Except for the economic weight matrix, the coefficients are positive under all the other three spatial weight matrices. The results are basically consistent with the research conclusions based on China’s provincial level (Fernandes et al., 2019). However, both spatial adjacency and economic adjacency have a negative effect on the improvement of urban greening level. The advancement of a city’s openness is not conducive to the greening development of its surrounding cities. The reason may be that the improvement of urban opening up level produces a siphon effect, forms agglomeration of openness to the outside world, attracts the agglomeration of surrounding industries such as foreign trade industry, and forms economies of scale for the target cities. As a result, it has a serious negative impact on the economic greening of surrounding cities, which can also be well proved by the negative results under the spatial economic weight matrix (Fernandes et al., 2019). The urbanization rate (Urb) variable does not show consistent results under the four weight matrices, all of which are beneficial to the promotion of urban greening development to varying degrees. Except for the spatial adjacency weight matrix, the urban environmental regulation level (Erp) variable under other matrices is beneficial to the development of urban greening, while the surrounding spatial effect is consistently negative. This is a good illustration of inconsistency in the environmental regulations, which would make heavily polluting enterprises and industries choose the surrounding areas with relatively loose environmental regulations. The urban residents’ affluence (Ris) variable shows inconsistent results under the four weight matrices: under the adjacency matrix, it is positive and beneficial to the improvement of urban greening level, but it has negative effects under the rest three matrices. This shows that increased wealth does not necessarily increase environmental awareness and promote greener industries and lifestyles, for example, in some resource-based cities social problems have occurred in residents who suddenly became rich due to demolition and relocation. In the current situation that China’s per capita income is still in the lower middle range, the impact of wealth level on the development of urban greening is not very obvious.
In order to further explore whether there is spatial heterogeneity in the impact of digitalization on the process of urban greening, the following study is carried out from two perspectives: region (eastern, central, and western) and urban agglomeration (19 national-level urban agglomerations). The classification basis is mainly drawn from the default classification and literature (Ma et al., 2022b). As the influence of spatial heterogeneity is mainly considered, the follow-up research is conducted with the geographic weight matrix to expand the estimation. First, it is divided into three regions: eastern, central and western, to test whether there is regional heterogeneity in the impact of digitalization on the development of urban greening. The regression results are shown in Table 10. In the eastern regions, urban digitalization not only significantly improved the urban greening of the target city, but also significantly promoted the greening process of the neighboring cities. The reason may be that the eastern regions have more obvious advantages in digital infrastructure and digital industry. And because the eastern regions have gathered a large number of digital innovation talents and innovation capital, it can better play a role of digital empowerment by virtue of various advantages. Thus, the role of digitalization in improving urban greening in the eastern regions is quite obvious. In the central regions, digitalization development can promote urban greening of the target city while shows no significant effect on its neighboring cities. This may be due to the fact that the cities in the central regions are still in the stage of rapid digitalization development, and the greening effect of digital infrastructure construction in these cities has not yet appeared. The core cities in the central regions have obvious advantages because of the siphon effect and agglomeration effect. But the cities outside the urban agglomeration lags behind, and it is difficult to exert the spillover effect in digitalization development. In the western regions, the variables of digitalization did not pass the significance test, which may be because the digitalization development in the western regions is still in its infancy with a generally low level (see Figure 1). The scale and agglomeration effects cannot be formed, and the effect of digital empowerment is minimal as well, which leads to the insignificant effect of digitalization on urban greening.
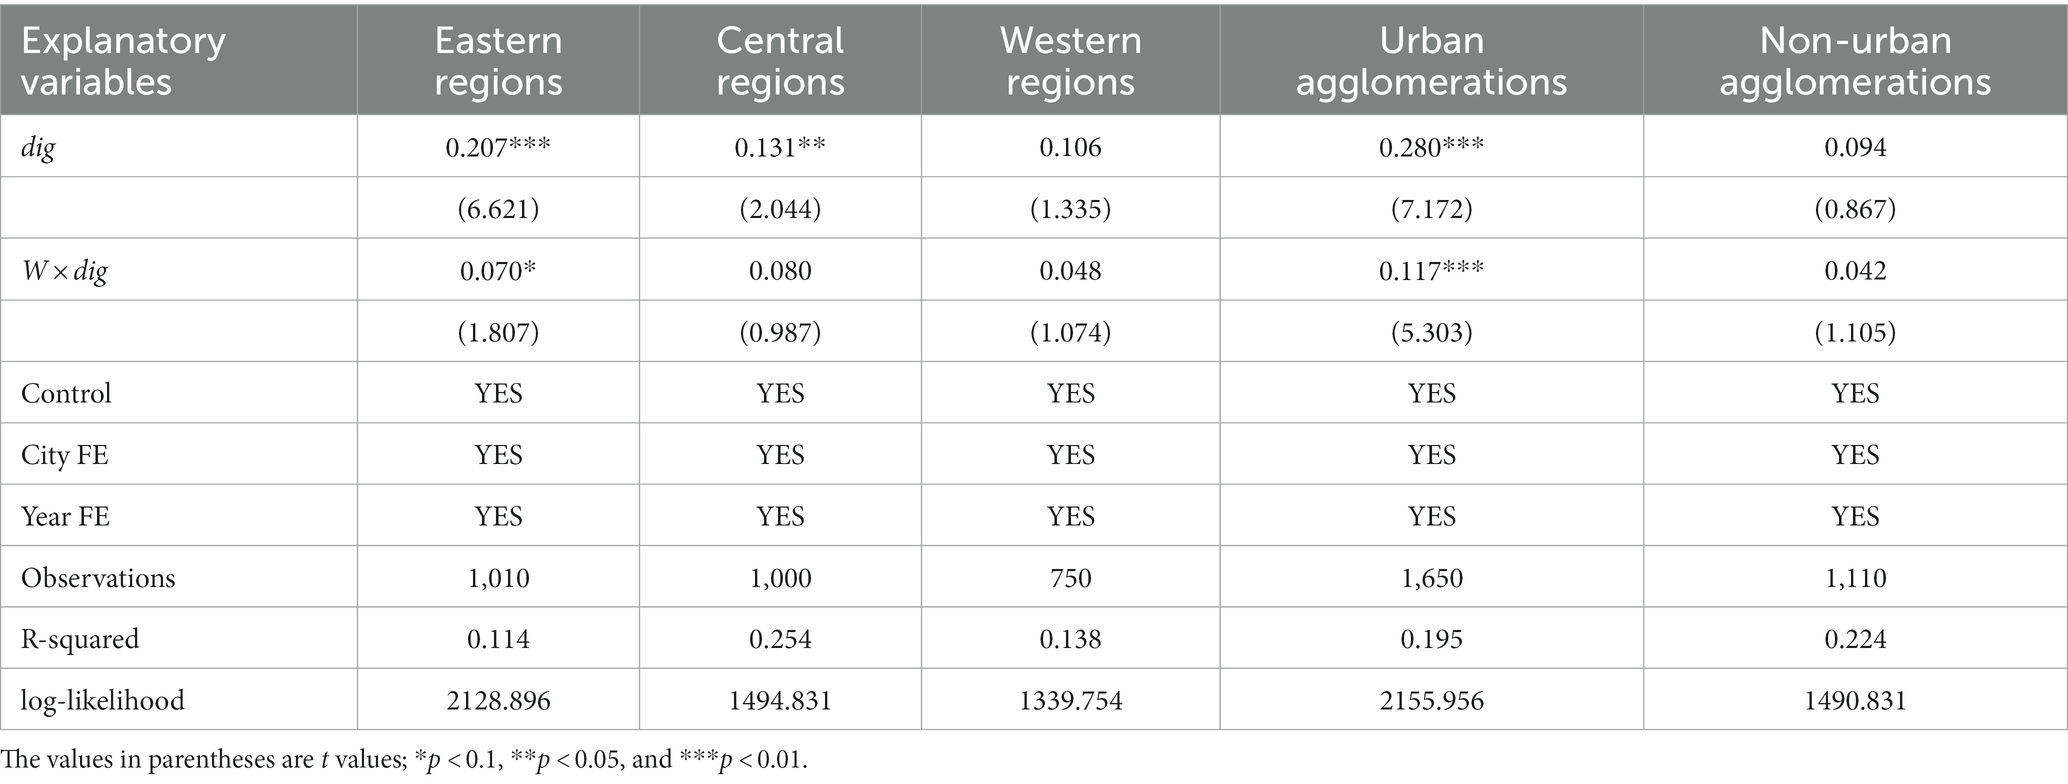
Table 10. Regression results of the spatial heterogeneity test.
From the perspective of urban agglomeration, within urban agglomerations, digitalization development in cities has played a significant role in promoting urban greening, and influences neighboring areas through spillover effects, which improves the greening development level of surrounding cities. Whereas, in non-urban agglomeration cities, digitalization development has no significant impact on urban greening. This is mainly because the cities in urban agglomerations generally have a relatively high level of digitalization (see Figure 1), initially forming scale and agglomeration effect. Relatively speaking, the digital industrialization level of these cities is also high. As an opposite, due to poor geographical location or limited resources, digitalization in non-urban agglomeration cities starts late, making little improvement in urban greening. Intuitively, the spatial evolution of urban greening development in Figure 2 can also well prove this point. Therefore, considering the spatial heterogeneity, cities in eastern regions and urban agglomerations have fully released digital dividends, making a significant impact on the urban greening. However, the digital effect of cities on the urban greening in western regions and non-urban agglomerations is not obvious.
It can be seen from the empirical results of this study (see Table 9) that digitalization is beneficial to the greening development in cities. However, the spatial effect based on the adjacency weight matrix or economic-geographic nested weight matrix fails to pass the 10% significance test. The reason may be that the development of network has its particularity in the process of digitalization. Network development breaks through the traditional regional restrictions. Spatial effects based on spatial geographic weight matrix and economic matrix have both passed the 1% significance test. According to existing research (Yang W. et al., 2022; Hao et al., 2023), the digitalization is beneficial to promote the city green economy development and the neighboring effect is significant, and the results are similar with the environment protection [reducing haze pollution (Wang and Xu, 2022) and carbon emissions (Ke et al., 2022)]. To sum up, digitalization can significantly promote urban greening development, but the spatial spillover effect is inconsistent with the findings in green economy and environment protection cases, the reason behind which may be that the urban greening development is a complex transformation process, much more complex than indicators such as green economic development and environment protection.
In different regions, the impact of digitalization on urban greening development is also quite different which is the same as in green economic development (Chen et al., 2022) and environment (Cui et al., 2022). It can be found from Table 10 that the eastern and central regions pass the significance test of 5%, while the western region is not significant. In addition, the coefficient for the eastern region is the largest, indicating that the influence is also the strongest. Therefore, the significance and magnitude of the impact of urban digitalization on greening development vary with region. The highly developed digitalization in the eastern region has a greater direct impact on regional greening development, followed by the central region. This may have something to do with the fact that the greater the degree of digitalization, the greater the influencing force. Only after a certain scale is formed, the economies of scale brought by digitalization have a marginal increasing effect. Therefore, the higher the degree of digitalization, the greater its role in promoting regional greening development. In addition, in the cities within the urban agglomerations, the direct effect of digitalization on greening is the largest (coefficient: 0.280), which passed the significance test of 1%. The corresponding adjacency spatial effect also has a similar conclusion. This indicates that the spatial integration within the urban agglomerations strengthens the role of digitalization in promoting urban greening development. The development of urban agglomerations, through regional integration actions such as national policies, industrial layout and internal governance optimization, forms more effective combination and realizes sharing through digitalization and informatization, thus promoting the coordinated development of economy, displaying the role of big data such as information flow, and effectively improving the service level of social governance and ecological welfare. Therefore, the spatial effect of digitalization will be further displayed along with the integration process within the urban agglomeration, and its influence will be further improved (the coefficient is the largest, 0.117, and passes the significance test of 1%). In conclusion, urban digitalization is beneficial to promoting the development of regional greening. However, the influence of its role depends on the actual development situation of each city, especially the level of digitalization development and the wellness of regional integration, which directly affects the strength of its force, the magnitude of spatial effect and whether it can pass the significance test from the empirical perspective.
This study analyzed the spatial evolution characteristics of urban digitalization and urban greening respectively, and further explored the spatial effect of digitalization on urban greening. The following conclusions are drawn:
(1) The urban digitalization development pattern has changed from the “multi-point” sporadic distribution with the Advanced area (A) as the core to the “group-type” aggregation distribution, and the digitalization development level in most cities has risen. However, the digitalization development has an obvious characteristic of club convergence in a steady and gradual trend. It is difficult to carry out multi-level leap-forward development. The urban digitalization development is affected by the neighboring cities.
(2) Affected by factors such as economy, environment, society and local government’s attention, the urban greening pattern presents the following characteristics: obvious spatial heterogeneity, prominent difference between east regions and west regions, and obvious spatial agglomeration, the degree of which decreases as the spatial distance threshold increases.
(3) Urban digitalization development can significantly improve the greening level, and produces a significant spatial spillover effect influencing the greening level of neighboring cities. Considering the spatial heterogeneity, digitalization in cities of the eastern regions and urban agglomerations can significantly improve the greening development level, while that is not obvious in the cities located in western regions and non-urban agglomerations.
Based on various indicators of urban digitalization and urban greening, this paper first obtained the respective comprehensive values of urban digitalization and urban greening through the Entropy-TOPSIS model, then analyzed the impact of digitalization on urban greening, finally further explored the spatial heterogeneity. In addition to broadening relevant research fields and supplementing the empirical research evidence, the following policy suggestions are put forward according to the research conclusions:
(1) The government should consolidate the digital infrastructure to comprehensively enhance digital empowerment. They need to promote the construction of new generation information infrastructure to accelerate the realization of higher-quality interconnection, to provide solid information infrastructure support for the development of urban digitalization, so as to expand the benefits of digitalization to a wider scope. They should explore the environmental regulation model with the participation of the whole society, and strengthen the role of digitalization in promoting the greening development in cities.
(2) The government should strengthen the influence of technological innovation on the urban greening development, and improve the technical support capabilities. On the one hand, they should increase the investment in innovation and research and development, promote the research and development of technologies such as cloud computing, industrial Internet and big data, and enhance the application and transformation of basic and public applicability technology to improve production efficiency. On the other hand, they should focus on researching and developing technology in energy utilization efficiency to catalyze the emission reduction effect of technological innovation.
(3) Based on regional differences in development, the government should implement heterogeneous governance strategies. As the endowments and the impact of digitalization on greening vary across cities. The government should adjust the pace of digitalization development in each city, break down industry barriers and geographical restrictions on new models and new formats, and harmonize the differences and synergy in digital governance in each city.
Even though this study supplemented relevant research on urban digitalization and urban greening, providing a theoretical reference for digitalization promoting greening in cities, there are still shortcomings in this study that need to be further improved. This study measures the digitalization development level of each city based on digital infrastructure, digital application level, digital industry development, and digital inclusive finance. On the one hand, limited by the availability of data, there are still certain defects in the measurement of digitalization; on the other hand, the impact of digitalization on urban greening development varies by region. Subsequent research may improve the measurement of digitalization development level, conducting micro-analysis of the specific mechanisms with the advantage of data richness in specific urban cases. Moreover, although this research has analyzed the influencing mechanism of digitalization on urban greening development, the empirical part is insufficient. In the follow-up research, it is necessary to conduct more in-depth exploration into the theoretical mechanism and the specific effect of digitalization on urban greening.
The original contributions presented in the study are included in the article/supplementary material, further inquiries can be directed to the corresponding authors.
LM and YH: conceptualization, formal analysis, and writing – original draft. WX and SH: funding acquisition, resources, and supervision. WY and SH: investigation, data curation. LM and YZ: methodology. LM, WY and YZ: project administration, software, and visualization. SH and YH: validation and writing – review and editing. All authors contributed to the article and approved the submitted version.
This work was supported by Xi’an Social Science Planning Fund Project (No. 22JX152) “Research on Operation Efficiency Improvement Path of Agricultural Products Digital Supply Chain in Xi’an.”
The authors declare that the research was conducted in the absence of any commercial or financial relationships that could be construed as a potential conflict of interest.
All claims expressed in this article are solely those of the authors and do not necessarily represent those of their affiliated organizations, or those of the publisher, the editors and the reviewers. Any product that may be evaluated in this article, or claim that may be made by its manufacturer, is not guaranteed or endorsed by the publisher.
1. ^ www.resdc.cn
Abid, N., Ceci, F., and Ikram, M. (2021). Green growth and sustainable development: dynamic linkage between technological innovation, ISO 14001, and environmental challenges. Environ. Sci. Pollut. Res. Int. 29, 25428–25447. doi: 10.1007/s11356-021-17518-y
Agovino, M., Crociata, A., and Sacco, P. L. (2019). Proximity effects in obesity rates in the US: a spatial Markov chains approach. Soc. Sci. Med. 220, 301–311. doi: 10.1016/j.socscimed.2018.11.013
Ahmadova, G., Delgado-Márquez, B. L., Pedauga, L. E., and Leyva-de la Hiz, D. I. (2022). Too good to be true: the inverted U-shaped relationship between home-country digitalization and environmental performance. Ecol. Econ. 196:107393. doi: 10.1016/j.ecolecon.2022.107393
Chen, Y., Su, X., Zhou, Q., and Shi, V. (2022). Spatial differentiation and influencing factors of the green development of cities along the Yellow River Basin. Discret. Dyn. Nat. Soc. 2022, 1–20. doi: 10.1155/2022/9185108
Chen, D., Wang, L., and Chen, A. (2020). Digital and strategic management theory -- retrospect, challenge and prospect. Manage. World 36, 220–236. doi: 10.19744/j.cnki.11-1235/f.2020.0080
Chun, L., and Xuetong, T. (2021). Spatial-temporal pattern of inclusive finance and its influencing factors in China's counties. Econ. Geogr. 41, 126–135. doi: 10.15957/j.cnki.jjdl.2021.06.014
Cui, H., Liu, X., and Zhao, Q. (2020). Which factors can stimulate China’s green ransformation process? From provincial aspect. Pol. J. Environ. Stud. 30, 47–60. doi: 10.15244/pjoes/120766
Cui, J., Wang, W., Chen, Z., Ren, G., and Gao, X. (2022). How digitalization and financial development impact eco-efficiency? Evidence from China. Environ. Sci. Pollut. Res. doi: 10.1007/s11356-022-23175-6 [E-pub ahead of print].
Dong, F., Li, Y., Qin, C., and Sun, J. (2021). How industrial convergence affects regional green development efficiency: a spatial conditional process analysis. J. Environ. Manag. 300:113738. doi: 10.1016/j.jenvman.2021.113738
Fan, H., and Wu, T. (2021). Whether digitalization can promote economic growth and high quality development -- empirical evidence from China’s provincial panel data. J. Manag. 34, 36–53. doi: 10.19808/j.cnki.41-1408/F.2021.0021
Fang, G., Wang, Q., and Tian, L. (2020). Green development of Yangtze River Delta in China under population-resources-environment-development-satisfaction perspective. Sci. Total Environ. 727:138710. doi: 10.1016/j.scitotenv.2020.138710
Fernandes, A. M., Mattoo, A., Nguyen, H., and Schiffbauer, M. (2019). The internet and Chinese exports in the pre-ali baba era. J. Dev. Econ. 138, 57–76. doi: 10.1016/j.jdeveco.2018.11.003
Fuyou, G., Lianjun, T., Qiu, F., and Yiming, L. (2021). Spatial and temporal differentiation characteristics of green development in the ecological economic corridor of the Yellow River Basin and identification of influencing factors. J. Geogr. 76, 726–739.
Guo, F., Wang, J., Wang, F., Kong, T., Zhang, X., and Cheng, Z. (2020). Measuring China's digital inclusive financial development: index compilation and spatial characteristics. Economics 19, 1401–1418. doi: 10.13821/j.cnki.ceq.2020.03.12
Habibi, F., and Zabardast, M. A. (2020). Digitalization, education and economic growth: a comparative analysis of Middle East and OECD countries. Technol. Soc. 63:101370. doi: 10.1016/j.techsoc.2020.101370
Hao, X., Li, Y., Ren, S., Wu, H., and Hao, Y. (2023). The role of digitalization on green economic growth: does industrial structure optimization and green innovation matter? J. Environ. Manag. 325:116504. doi: 10.1016/j.jenvman.2022.116504
Hao, Y., and Liu, Y.-M. (2016). The influential factors of urban PM2.5 concentrations in China: a spatial econometric analysis. J. Clean. Prod. 112, 1443–1453. doi: 10.1016/j.jclepro.2015.05.005
Hu, S., Zeng, G., Cao, X., Yuan, H., and Chen, B. (2021). Does technological innovation promote green development? A case study of the Yangtze River Economic Belt in China. Int. J. Environ. Res. Public Health 18:6111. doi: 10.3390/ijerph18116111
Huang, W., Shuai, B., Sun, Y., Wang, Y., and Antwi, E. (2018). Using entropy-TOPSIS method to evaluate urban rail transit system operation performance: the China case. Transp. Res. A Policy Pract. 111, 292–303. doi: 10.1016/j.tra.2018.03.025
Jia, L., Hu, X., Zhao, Z., Zhou, T., Liu, W., He, B., et al. (2022). The impact of digitization on green innovation performance: evidence based on panel data of 228 prefectural-level cities in China. Complexity 2022, 1–13. doi: 10.1155/2022/9442902
Jin, P., Mangla, S. K., and Song, M. (2022). The power of innovation diffusion: how patent transfer affects urban innovation quality. J. Bus. Res. 145, 414–425. doi: 10.1016/j.jbusres.2022.03.025
Jin, P., Peng, C., and Song, M. (2019). Macroeconomic uncertainty, high-level innovation, and urban green development performance in China. China Econ. Rev. 55, 1–18. doi: 10.1016/j.chieco.2019.02.008
Jovanovic, M., Dlacic, J., and Okanovic, M. (2018). Digitalization and society's sustainable development - measures and implications. Zb Rad Ekon Fak Rije 36, 905–928. doi: 10.18045/zbefri.2018.2.905
Ke, J., Jahanger, A., Yang, B., Usman, M., and Ren, F. (2022). Digitalization, financial development, trade, and carbon emissions; implication of pollution haven hypothesis during globalization mode. Front. Environ. Sci. 10:873880. doi: 10.3389/fenvs.2022.873880
Kohli, R., and Melville, N. P. (2018). Digital innovation: A review and synthesis. Inf. Syst. J. 29, 200–223. doi: 10.1111/isj.12193
Le Gallo, J. (2016). Space-time analysis of GDP disparities among European regions: a Markov chains approach. Int. Reg. Sci. Rev. 27, 138–163. doi: 10.1177/0160017603262402
Lee, C. C., He, Z. W., and Wen, H. W. (2022). The impact of digitalization on green economic efficiency: empirical evidence from city-level panel data in China. Energy Environ. :0958305X2211242. doi: 10.1177/0958305X221124225
Li, X. F. (2021). TOPSIS model with entropy weight for eco geological environmental carrying capacity assessment. Microprocess. Microsyst. 82:8. doi: 10.1016/j.micpro.2020.103805
Li, J. L., Chen, L. T., Chen, Y., and He, J. W. (2022). Digital economy, technological innovation, and green economic efficiency-empirical evidence from 277 cities in China. Manag. Decis. Econ. 43, 616–629. doi: 10.1002/mde.3406
Li, C., Qiao, L., and Babar, M. (2022). Rapid prediction algorithm for economic development trend of tourism using Markov chain. Mob. Inf. Syst. 2022, 1–8. doi: 10.1155/2022/8726206
Lin, M., Huang, C., and Xu, Z. (2019). TOPSIS method based on correlation coefficient and entropy measure for linguistic Pythagorean fuzzy sets and its application to multiple attribute decision making. Complexity 2019, 1–16. doi: 10.1155/2019/6967390
Liu, X., Zhang, W., Ge, S., and Yang, P. (2021). Is digitalization conducive to narrowing the development gap between cities—— empirical study based on 283 cities. Sci. Manag. Sci. Technol. 42, 102–113.
Loiseau, E., Saikku, L., Antikainen, R., Droste, N., Hansjuergens, B., Pitkanen, K., et al. (2016). Green economy and related concepts: an overview. J. Clean. Prod. 139, 361–371. doi: 10.1016/j.jclepro.2016.08.024
Ma, L., Hong, Y., and Chen, X. (2022a). Can green economy and ecological welfare achieve synergistic development? The perspective of the "two mountains" theory. Int. J. Environ. Res. Public Health 19:6460. doi: 10.3390/ijerph19116460
Ma, L., Hong, Y., Chen, X., and Quan, X. (2022b). Can green innovation and new urbanization be synergistic development? Empirical evidence from Yangtze River Delta City Group in China. Sustainability 14:5765. doi: 10.3390/su14105765
Pace, R. K., and Barry, R. (1997). Sparse spatial autoregressions. Stat. Probability Lett. 33, 291–297. doi: 10.1016/S0167-7152(96)00140-X
Pang, R., Zhang, S., and Wang, Q. (2021). Can digitalization improve environmental governance performance—— Empirical evidence from provincial panel data. J. Xi'an Jiaotong Univ. 41, 1–10. doi: 10.15896/j.xjtuskxb.202105001
Qi, Y., and Cai, C. (2020). Research on the multiple effects and mechanism of digitalization on the performance of manufacturing enterprises. Learn. Explor. 300:108–119.
Ritter, T., and Pedersen, C. L. (2020). Digitization capability and the digitalization of business models in business-to-business firms: past, present, and future. Ind. Mark. Manag. 86, 180–190. doi: 10.1016/j.indmarman.2019.11.019
Tan, F., Yang, L., Lu, Z., and Niu, Z. (2022). Impact of urban innovation on urban green development in China's Yangtze River Economic Belt: perspectives of scale and network. Environ. Sci. Pollut. Res. Int. 29, 73878–73895. doi: 10.1007/s11356-022-21042-y
Tobler, W. R. (1970). A computer movie simulating urban growth in the Detroit region. Econ. Geogr. 46, 234–240. doi: 10.2307/143141
Vu, K. M., and Asongu, S. (2020). Backwardness advantage and economic growth in the information age: a cross-country empirical study. Technol. Forecast. Soc. Chang. 159:120197. doi: 10.1016/j.techfore.2020.120197
Wang, Z., Cui, C., and Peng, S. (2019). How do urbanization and consumption patterns affect carbon emissions in China? A decomposition analysis. J. Clean. Prod. 211, 1201–1208. doi: 10.1016/j.jclepro.2018.11.272
Wang, Y., Hu, H., Dai, W., and Burns, K. (2021). Evaluation of industrial green development and industrial green competitiveness: evidence from Chinese urban agglomerations. Ecol. Indic. 124:107371. doi: 10.1016/j.ecolind.2021.107371
Wang, K.-H., Umar, M., Akram, R., and Caglar, E. (2021). Is technological innovation making world "Greener"? An evidence from changing growth story of China. Technol. Forecast. Soc. Chang. 165:120516. doi: 10.1016/j.techfore.2020.120516
Wang, J., and Xu, Y. (2022). How does digitalization affect haze pollution? The mediating role of energy consumption. Int. J. Environ. Res. Public Health 19:11204. doi: 10.3390/ijerph191811204
Xu, Y., Dong, B., and Chen, Z. (2021). Can foreign trade and technological innovation affect green development: evidence from countries along the belt and road. Econ. Chang. Restruct. 55, 1063–1090. doi: 10.1007/s10644-021-09337-5
Yang, W., Chen, Q., Guo, Q., and Huang, X. (2022). Towards sustainable development: how digitalization, technological innovation, and green economic development interact with each other. Int. J. Environ. Res. Public Health 19:12273. doi: 10.3390/ijerph191912273
Yang, Z., Gao, W., Han, Q., Qi, L., Cui, Y., and Chen, Y. (2022). Digitalization and carbon emissions: how does digital city construction affect china's carbon emission reduction? Sustain. Cities Soc. 87:104201. doi: 10.1016/j.scs.2022.104201
Yang, Y., Wang, H., Wang, C., and Yang, B. (2022). Model-based temporal evolution and spatial equilibrium analysis of green development in China's Yangtze River Economic Belt from 2009 to 2018. Ecol. Indic. :109071:141. doi: 10.1016/j.ecolind.2022.109071
Yi, X., Jue, W., and Huan, H. (2021). Does economic development bring more livability? Evidence from Jiangsu Province, China. J. Cleaner Prod. 293:10. doi: 10.1016/j.jclepro.2021.126187
Zhao, X., Ma, X., Shang, Y., Yang, Z., and Shahzad, U. (2022). Green economic growth and its inherent driving factors in Chinese cities: based on the Metafrontier-global-SBM super-efficiency DEA model. Gondwana Res. 106, 315–328. doi: 10.1016/j.gr.2022.01.013
Zhao, J., Shi, D., and Deng, Z. (2019). Research on the connotation of high-quality development. Econ. Manag. Res. 40, 15–31. doi: 10.13502/j.cnki.issn1000-7636.2019.11.002
Zhao, C., and Wang, B. (2022). How does new-type urbanization affect air pollution? Empirical evidence based on spatial spillover effect and spatial Durbin model. Environ. Int. 165:107304. doi: 10.1016/j.envint.2022.107304
Zhao, T., Zhang, Z., and Liang, S. (2020). Digital economy, entrepreneurial activity and high-quality development: empirical evidence from Chinese cities. Manage. World 36, 65–76. doi: 10.19744/j.cnki.11-1235/f.2020.0154
Zhong, S., Li, J., and Zhao, R. (2021). Does environmental information disclosure promote sulfur dioxide (SO2) remove? New evidence from 113 cities in China. J. Clean. Prod. 299:126906. doi: 10.1016/j.jclepro.2021.126906
Zhu, X., He, M., and Li, H. (2021). Environmental regulation, governance transformation and the green development of Chinese iron and steel enterprises. J. Clean. Prod. 328:129557. doi: 10.1016/j.jclepro.2021.129557
Zhuo, C., Xie, Y., Mao, Y., Chen, P., and Li, Y. (2022). Can cross-regional environmental protection promote urban green development: zero-sum game or win-win choice? Energy Econ. 106:105803. doi: 10.1016/j.eneco.2021.105803
Keywords: urban digitalization, urban greening development, spatial spillover effect, Entropy-TOPSIS model, spatial Durbin model, China
Citation: Ma L, Xu W, He S, Hong Y, Yang W and Zhao Y (2023) Does digitalization make urban development greener? A case from 276 cities in China. Front. Ecol. Evol. 11:1074827. doi: 10.3389/fevo.2023.1074827
Edited by:
Xiaowei Chuai, Nanjing University, ChinaReviewed by:
Yunjie Wei, Institute of Systems Science, Academy of Mathematics and Systems Science (CAS), ChinaCopyright © 2023 Ma, Xu, He, Hong, Yang and Zhao. This is an open-access article distributed under the terms of the Creative Commons Attribution License (CC BY). The use, distribution or reproduction in other forums is permitted, provided the original author(s) and the copyright owner(s) are credited and that the original publication in this journal is cited, in accordance with accepted academic practice. No use, distribution or reproduction is permitted which does not comply with these terms.
*Correspondence: Yuanxiao Hong, aHl4MDIxQHpqbnUuZWR1LmNu; Shouchao He, aHNjQHd6dXQuZWR1LmNu
Disclaimer: All claims expressed in this article are solely those of the authors and do not necessarily represent those of their affiliated organizations, or those of the publisher, the editors and the reviewers. Any product that may be evaluated in this article or claim that may be made by its manufacturer is not guaranteed or endorsed by the publisher.
Research integrity at Frontiers
Learn more about the work of our research integrity team to safeguard the quality of each article we publish.