 Hannah K. Levenson
 David R. Tarpy
94% of researchers rate our articles as excellent or good
Learn more about the work of our research integrity team to safeguard the quality of each article we publish.
Find out more
ORIGINAL RESEARCH article
Front. Ecol. Evol., 23 February 2023
Sec. Population, Community, and Ecosystem Dynamics
Volume 11 - 2023 | https://doi.org/10.3389/fevo.2023.1060834
This article is part of the Research TopicInsect Pollinators in the Anthropocene: How Multiple Environmental Stressors Are Shaping Pollinator HealthView all 11 articles
Pollinators are important both ecologically and economically. Nonetheless, documented pollinator population decline threatens ecosystem functioning and human well-being. In response, conservation methods such as augmented pollinator habitat are becoming popular tools to combat pollinator losses. While previous research has shown added habitat can benefit bee communities, there are still aspects of the habitat implementation that require further research, particularly how this will impact bee communities in real-world settings beyond researcher-led efforts. In our study, we use a 2016 initiative mandating the planting of pollinator habitat on research stations across North Carolina, United States to act as an outdoor laboratory to investigate this exact question. From 2016 to 2018, we found significant increases in bee abundance and diversity. However, these increases depended on the quality of habitat, with areas of higher flower cover and diversity supporting larger, more diverse bee communities. Although the habitats positively supported bee communities, we found that resources within the habitats were lower later in the sampling season, highlighting the need of developing seed mixes that include late season resources. Weedy plants were documented to establish within the habitats, demonstrating the need for regular upkeep and maintenance of pollinator habitat in order to appropriately support bee communities. It is likely that planting pollinator habitat will not be a one-size-fits-all conservation solution, as bee species can respond differently to some habitat characteristics. Future long-term studies on pollinators will be important as natural fluctuations in bee populations may limit findings and many knowledge gaps on native bees still persist.
Extreme losses of global biodiversity and animal biomass are receiving increasing attention (Dirzo et al., 2014; Ceballos et al., 2015). Insects have been the subject of several studies on this topic (e.g., Wagner, 2020) with staggering losses documented across the globe (Fox et al., 2014; Hallmann et al., 2017; Lister and Garcia, 2018). These losses will result in serious consequences to human well-being, as insects are integral parts of food-webs and provide critical ecosystem services such as decomposition, nutrient cycling, pest control, and pollination services (Losey and Vaughan, 2006; Dirzo et al., 2014; Noriega et al., 2018; Dainese et al., 2019; Goulson, 2019). The ecosystem service that has arguably received the most attention—in research, the public sphere, and politically (Wilson et al., 2017)—is pollination, and thus pollinators have gained prominence in empirical research and conservation biology [reviewed by Vasiliev and Greenwood (2020) and Silva et al., (2020)]. As pollinators are critical in both natural areas (Ollerton et al., 2011) and agricultural systems, there have been growing efforts to support pollinator populations to limit further population and diversity losses.
A large focus for pollinator conservation efforts has been to protect and augment foraging habitat. Previous research from across the globe has shown that increased habitat—whether in natural areas, hedgerows, or planted flower plots—can support pollinator populations (Morandin and Kremen, 2013; Blaauw and Isaacs, 2014; Williams et al., 2015; Widhiono and Sudiana, 2017; Buhk et al., 2018). However, much remains to be understood about implementing such habitat. It has been shown that the benefits to pollinators from habitat implementation can change depending on the specific context (Kremen et al., 2018), scale (Scheper et al., 2015; Wood et al., 2015), and insect group of interest (Antonio Sanchez et al., 2019). Moreover, different plants can affect results (Warzecha et al., 2018; Mallinger et al., 2019) and even pollinator health (Giacomini et al., 2018), leading to efforts to develop seed-mix recommendations through empirical research. Of further curiosity is how researcher-led habitat implementation may differ when compared to real-world scenarios. As has been noted in citizen science projects, participant effort can differ from person-to-person, over time, and in response to external factors (Lewandowski and Oberhauser, 2017; Lynch-O’brien et al., 2021). While some areas of the world, particularly Europe, have government organized and endorsed programs (Rotchés-Ribalta et al., 2021) that may result in more uniform and sustained efforts of habitat implementation, the United States does not have such programs on a large-scale. It is critical that we investigate all aspects surrounding this conservation method further to ensure its effectiveness, limit any unintended consequences, and prevent wasted time and resources during implementation.
In 2016, the North Carolina Department of Agriculture & Consumer Services (NCDA&CS) mandated that all NCDA&CS and NC State University Experimental Agricultural Research Stations plant pollinator habitat as part of a program titled “Protecting NC Pollinators.” To our knowledge, this is the first state-wide government-led program of its kind in the United States. As part of the initiative, each research station allocated one or more areas for pollinator habitat and have continuously maintained it since. We used this ‘outdoor laboratory’ to investigate how adding pollinator habitat into the agroecosystem affects the pollinator community in a real-world setting beyond researcher-led efforts. Previously at the same habitats, we documented the effect of added habitat on soybean yield (Levenson et al., 2022) and investigated interspecific pathogen occurrence among various bee species within the habitat (Levenson and Tarpy, 2022a). Here we explore how different aspects of the habitat affected pollinator community composition through two main research questions: 1. How does the pollinator community as a whole respond to newly established habitat? and 2. How do environmental factors affect different aspects of the pollinator community?
All research stations (hereafter referred to as “stations”) are at least 4.02 kilometers apart, with an average distance of 57.8 km (SD ± 36.2 km) (Table 1). These stations are distributed across three geographic regions of the state: coastal, piedmont, and mountains (Supplementary Table S1). While all stations planted the pollinator habitats (hereafter referred to as “habitat”) in fall 2015 or early spring 2016, the size and within-station location of the habitat varied across sites as each station was independently responsible for habitat establishment and maintenance. The habitat was seeded using commercially available seed mixes from American Meadows1—including the southeast seed mixes, zinnias, cosmos, sunflowers, and buckwheat—and was reseeded every 1–2 years (Supplementary Tables S2, S3). Although the habitat was actively maintained by the stations, many weed species appeared in the habitat throughout the duration of the study (Supplementary Table S3). While many stations planted multiple habitat plots throughout the property, we only sampled at one per station. The sampling location at each station remained the same throughout the duration of the study with the exception of one station that moved the sampling location in 2017 due to a major rainstorm event (new sampling plot was 225 meters away). The sampled habitats were between 0.1 and 1 acres (Supplementary Table S1).

Table 1. Reports station name, NCDA number assignment, coordinates of the sampling habitat location, and whether hand net sampling occurred at a given station.
Sampling occurred at 16 stations across 3 years (2016–2018) utilizing two sampling methods: bee bowls and hand netting. At all 16 stations, three bee bowls per side (one painted blue, one yellow, and one white) were placed 5-meters apart along the perimeter of the habitat; bee bowl color order within each side was randomized. Following the protocol from Droege (2008), these samplings occurred once a month for 4 months [hereafter referred to as ‘season’ and categorized into spring, early summer, late summer, and fall] from 9 am to 3 pm during peak bloom at the habitat (roughly May – September) on days when temperatures were above 15°C. At the end of the sampling day, the contents of all bowls were combined into one falcon tube filled with 75% isopropyl alcohol and stored at 4° C until further processing.
At 12 stations, additional samples were collected using hand netting as close as possible to the same day as each bee bowl sample (Table 1). During these netting samplings, 2–3 people collected along haphazard transects (Hayes et al., 2019) throughout the habitat for 1 h. The time of day the sampling occurred shifted for each event in order to avoid any temporal bias. Each specimen collected was placed into an individual 1.7 mL centrifuge tube, transported back to the lab on ice, and then stored at −20°C until further processing. At each netting sampling event, a measure of flower cover and flower diversity was taken. As described in Levenson and Tarpy (2022a), ‘cover’ measured the percentage of the habitat in bloom at the time of sampling and was scored as low (0–30%), medium (31–50%), or high (50% or higher); ‘diversity’ measured the number of different plant species in bloom at the time of sampling and was scored as low (100–80% of the habitat in bloom with one flower species), medium (79–60%), or high (59% or less) (Figure 1 and Supplementary Table S1).
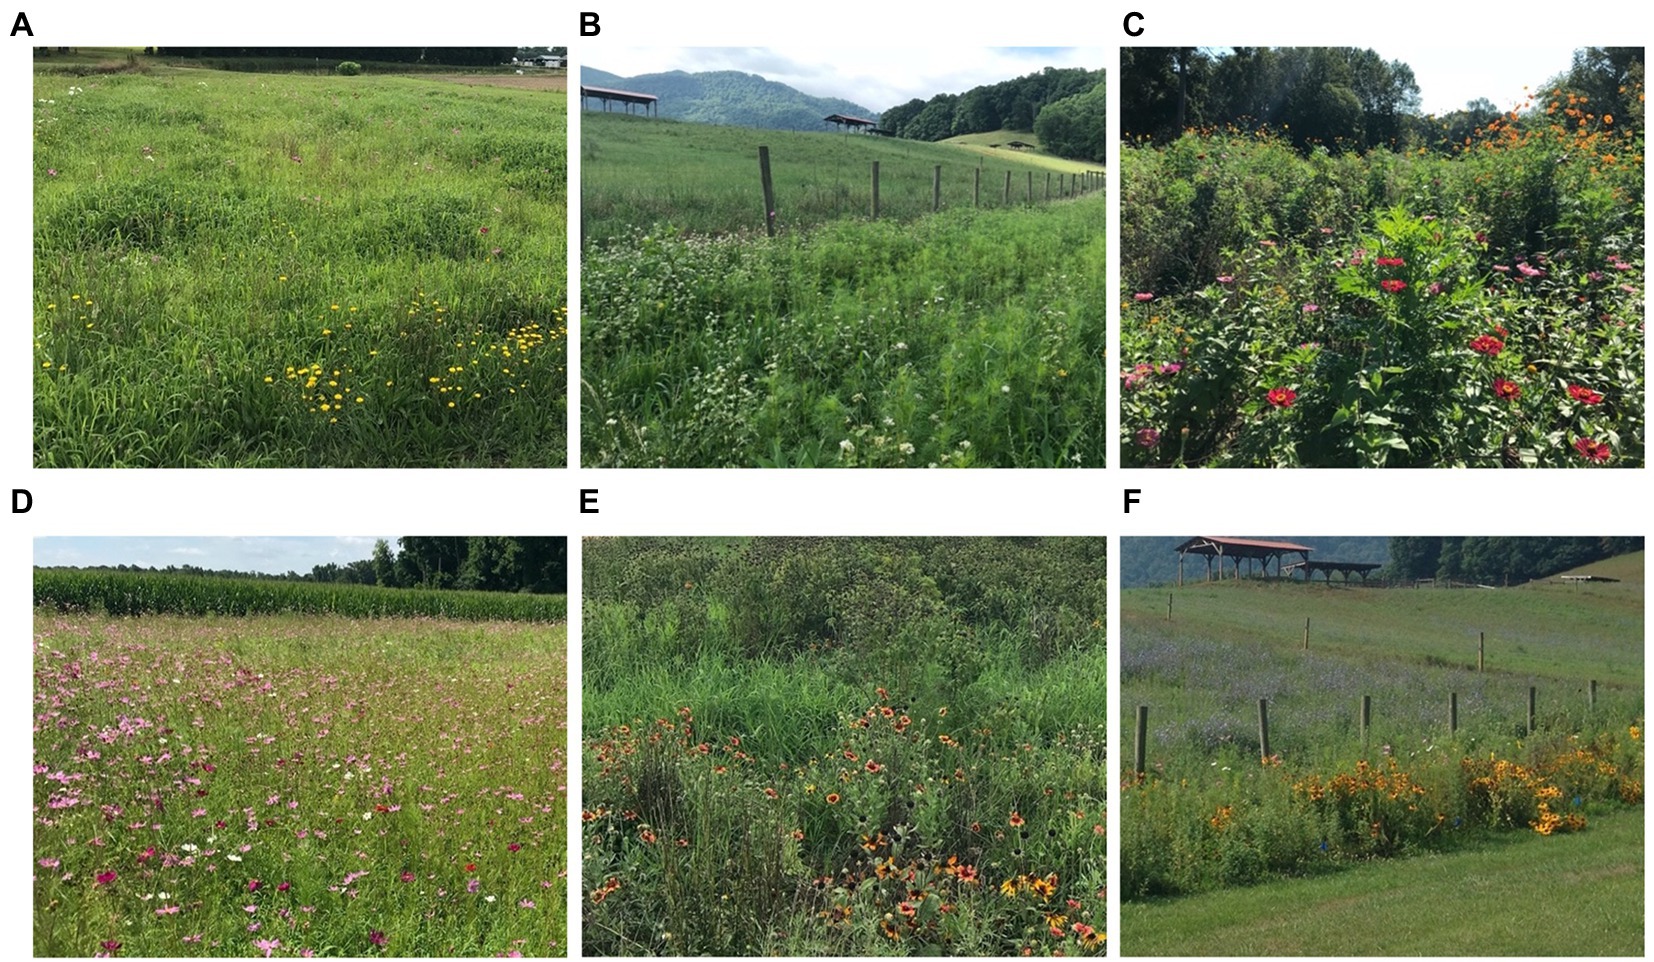
Figure 1. Examples of various levels of plot cover (A–C) and plot diversity (D–F). Picture A (Central Crops 2018) represents a low flower cover, Picture B (Mountain 2018) represents medium flower cover, and Picture C (Peanut Belt 2018) represents high flower cover. Picture D (Border Belt 2018) represents low flower diversity, Picture E (Caswell 2018) represents medium flower diversity, and Picture F (Mountain 2016) represents high flower diversity.
Samples were identified using Discover Life (Ascher and Pickering, 2016) and Levenson and Youngsteadt (2019), keeping samples on ice throughout the identification process to allow for subsequent analysis in associated research projects. We identified samples to the lowest level of identification possible, with most specimens identified to species except for specimens in the genera Andrena and Lasioglossum. All samples are stored in the Tarpy Laboratory at North Carolina State University.
To answer research question two – How do environmental factors affect different aspects of the pollinator community? – we categorized each genus by size (small, medium, large), nesting material (ground, cavity, wood/stem), and pollinator type (generalist, specialist, parasitic) (Supplementary Table S4). Information to make these categorizations was drawn from Mitchell (1960), Michener (2007), Gibbs (2011), Ascher and Pickering (2016), Levenson and Youngsteadt (2019), and Fowler and Droege (2020). While these categorizations could differ between some species within each genus, categories were selected to represent most–if not all–species within a given genus.
As bee bowl sampling yielded much smaller and less diverse sample sizes of the bee communities, we did not use these data during analysis and only report our findings from this sampling method below descriptively. Instead, we used our hand netting dataset only for analysis. All analyses were conducted in RStudio (version 4.1.3, R Core Team 2022).
We ran models using the lme4 package with the glmer function (Bates et al., 2015) followed by a post-hoc Tukey’s analysis using the multcomp package (Hothorn et al., 2008). We conducted χ2 contingency analyses in base R. To evaluate bee abundance response to the planted habitat, we used a generalized linear mixed model with a negative binomial distribution and included season, year, flower cover, flower diversity, the acreage of the sampled habitat, the number of habitat plots planted per station, and the number of managed honey bee hives present as predictor variables (Supplementary Table S1); as well as region as a random effect. To evaluate genus richness response to the planted habitat, we used the same model as described above but with a Poisson distribution. These models were selected using AIC criterion. During the model selection process, we explored using genus richness versus species richness as a response variable. Outputs and conclusions did not change between the two variables; thus, we conducted all analyses using genus richness to preserve replication and sample size. To test for changes in the habitat itself over the course of the study, we conducted χ2 contingency analyses comparing flower cover and diversity across the sampling season and sampling years.
We used fourth corner analysis (Dray and Legendre, 2008; Grab, 2018) to compare specific bee traits, habitat characteristics, and environmental factors of the study using the mvabund (Wang et al., 2012) and lattice (Sarkar, 2008) packages. To best fit the data, we used the negative binomial family, where appropriate, and ran 1,000 bootstrap replications. Information used during this analysis is reported in Table 1 and Supplementary Tables S1, S4, S5. Again, data was analyzed at the genus level. Variables that were not found to significantly impact the pollinator community under 2.4.1 were removed for this analysis.
In total, we collected 16,038 bees: 11,896 from hand netting and 4,142 from bee bowl sampling (Supplementary Table S5). We found 38 different genera across the entire state of North Carolina (with at least one new genus found each year of sampling) and 128 different species (Figure 2). However, the actual number of species is likely higher as not all specimens were identified down to species. Three genera–Halictus (30%), Lasioglossum (22%), and Bombus (17%)–together accounted for 69% of all collected samples; Apis mellifera only accounted for about 4% of the collected samples. A few species were rare within our study, only being documented at one location or even one sampling event (e.g., Nomia nortoni was only found at Border Belt, Melitoma taurea at one time point at Mountain, one individual of Augochloropsis metallica at one time point at Mountain Horticulture, and one individual of Perdita bradleyi at one time point at Sandhills; Figure 2).
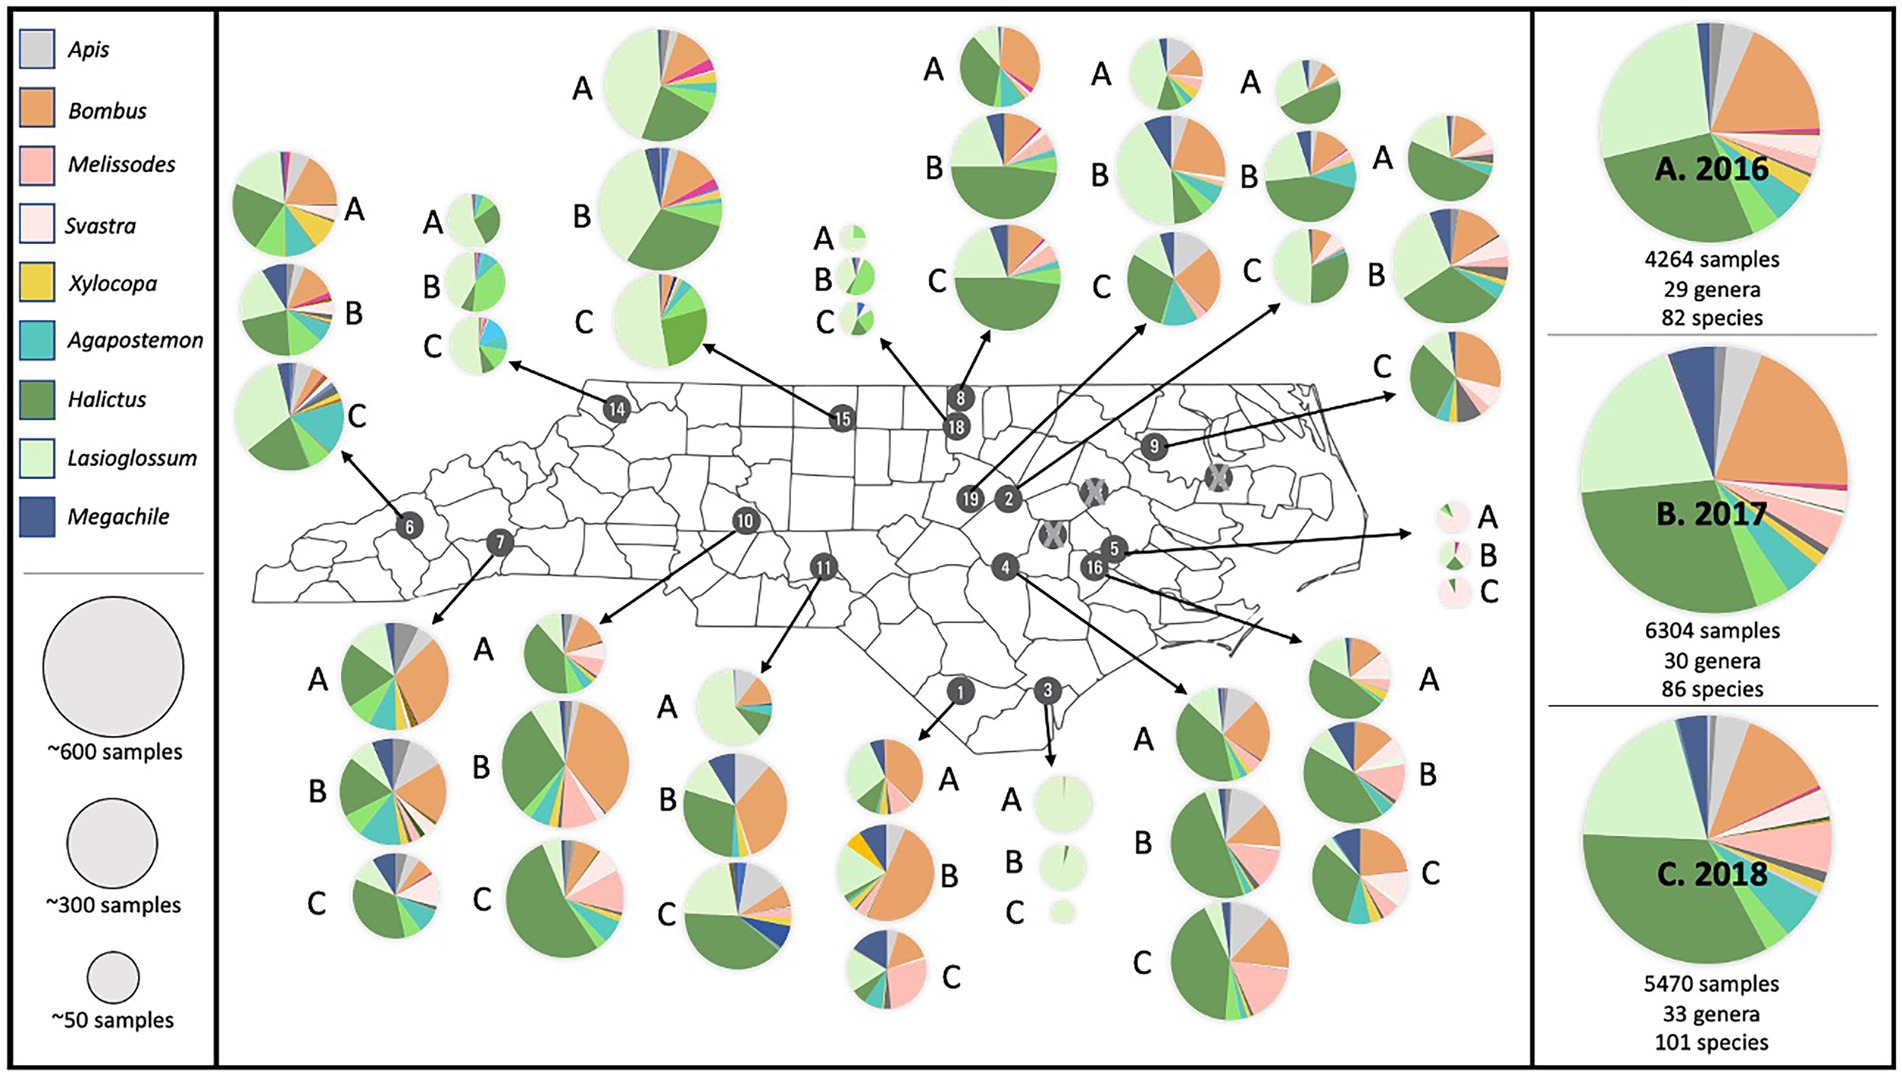
Figure 2. Map of the bee abundance and genus richness results for each station across all 3 years. Pie charts represent relative abundance collected at each station and display the most commonly occurring genera across each year. The entire dataset for each year is shown along the right-hand side. The top three genera–Halictus (30%), Lasioglossum (22%), and Bombus (17%)–accounted for 69% of all collected samples.
We found that bee abundance increased over time (Table 2), with the most bees collected in 2018 (Z (127) = 4.58, p < 0.001; Tukey = b) as compared to the reference year of 2016. Most bees were collected in the early summer (Z (127) = 2.10, p < 0.05; Tukey = a) compared to all other sampling time points with spring as the reference season. Flower cover of the habitat significantly influenced bee abundance, with the fewest bees found at low flower cover (Z (127) = −5.71, p < 0.001; Tukey = a) with high flower cover as the reference level. Flower diversity showed a similar trend but was not significant. The sampling habitat acreage, number of habitat plots planted per station, and the number of honey bee colonies stocked per station had no influence on bee abundance (all p > 0.08).
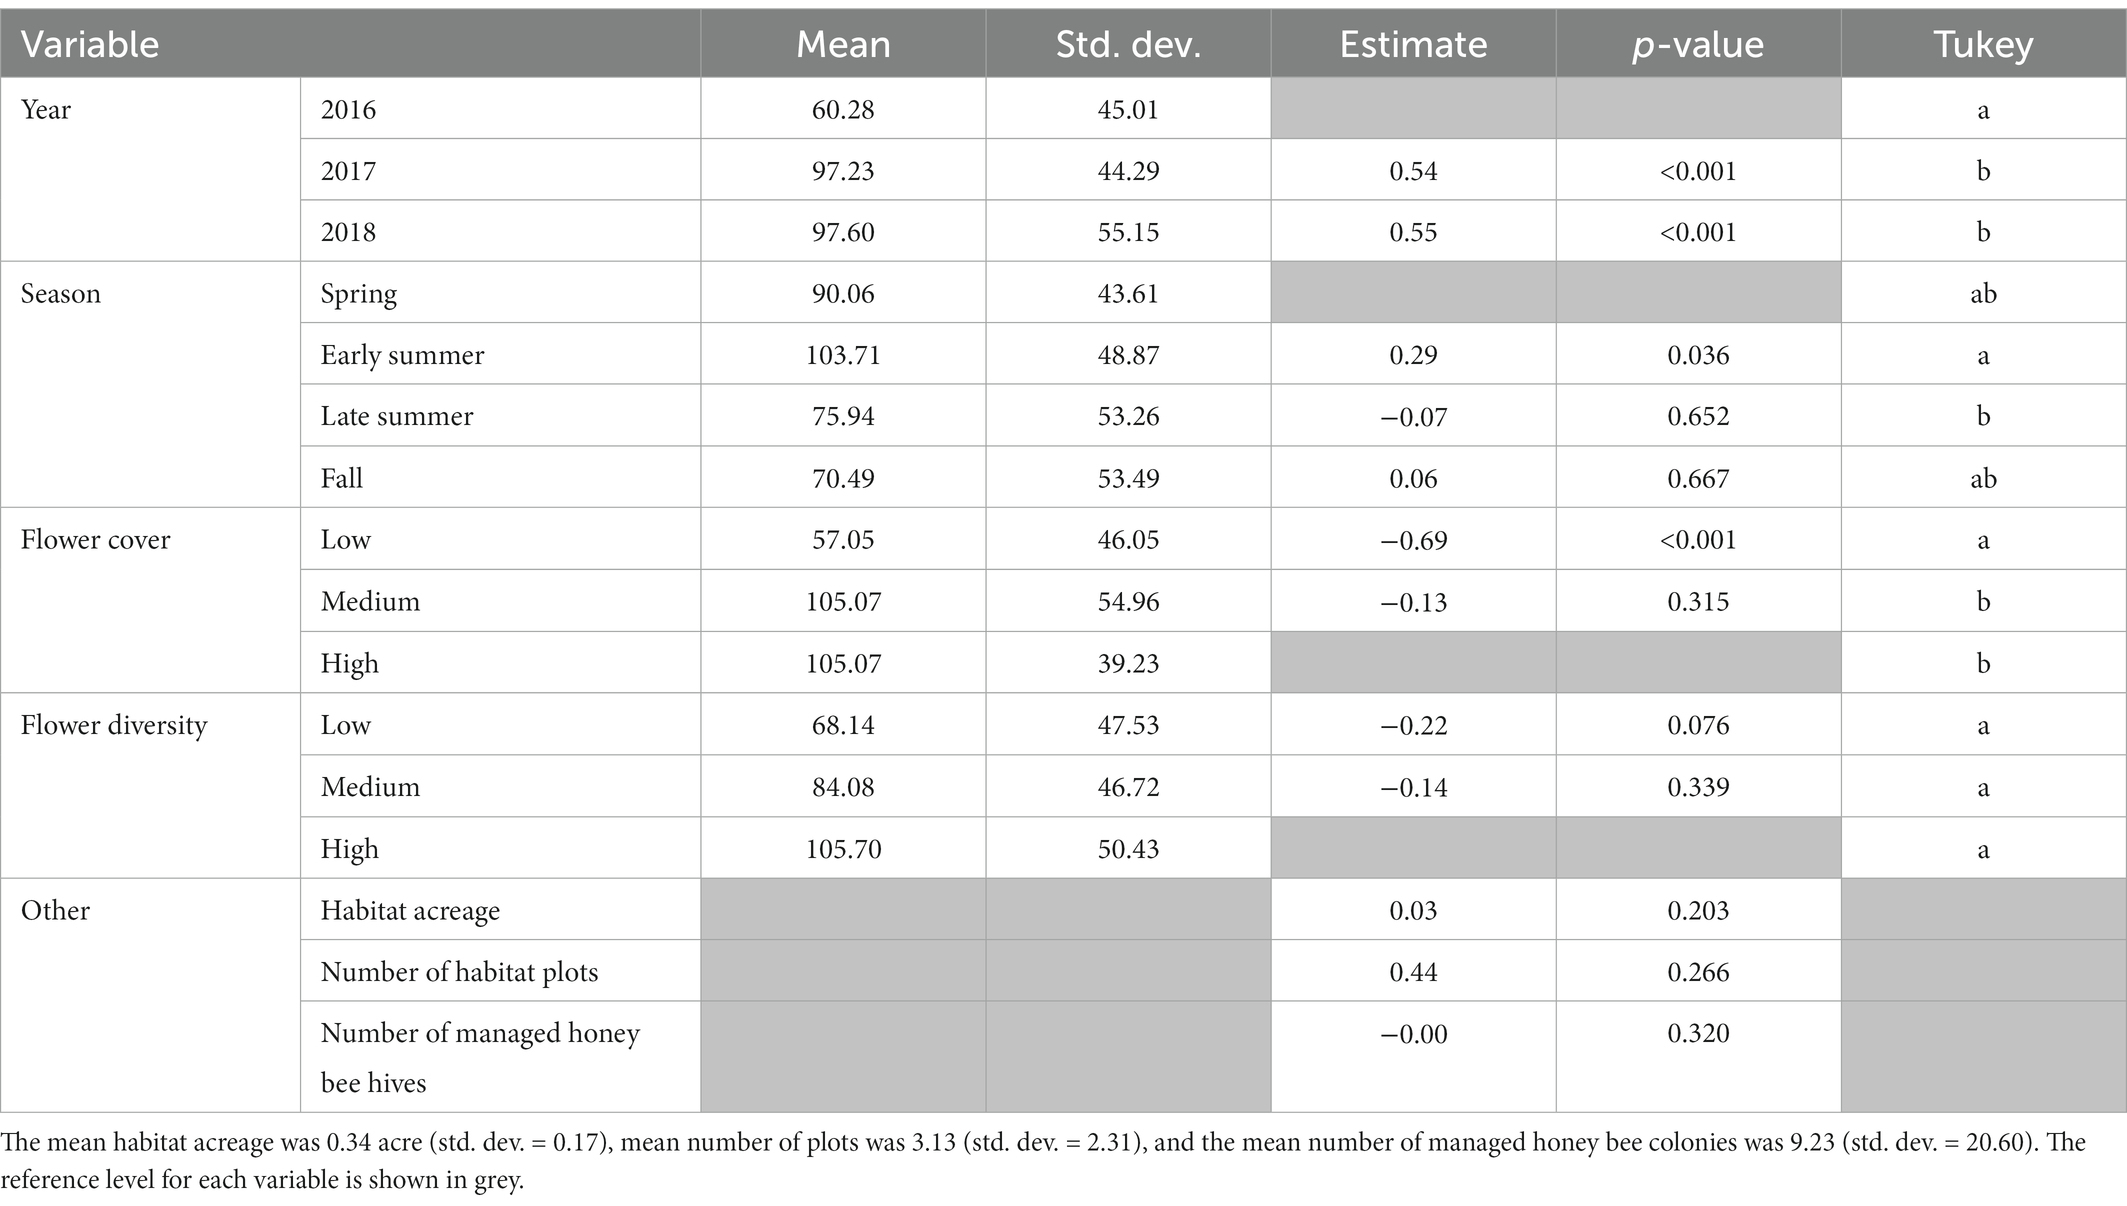
Table 2. Output from generalized linear mixed model and Tukey’s post-hoc analysis with abundance as the response with a negative binomial distribution.
Bee genus richness also increased over time (Table 3); however, it was highest in 2017 (Z (128) = 3.00, p < 0.005; Tukey = b), then 2018 (Z (128) = 2.75, p < 0.05; Tukey = b), and lowest in 2016 (Tukey = a). Genus richness decreased across the sampling season with the lowest richness found in the fall (Z (128) = −2.00, p < 0.05; Tukey = a) as compared to the reference season of spring. Flower cover and flower diversity both significantly influenced genus richness, with the lowest richness found at low flower cover (Z (128) = −2.89, p < 0.005; Tukey = a) and low flower diversity (Z (128) = −2.08, p < 0.05; Tukey = a); high flower cover was the reference level for both variables. Habitat acreage, number of habitat plots planted per station, and the number of honey bee colonies stocked per station had no influence on bee genus richness (all p > 0.22).
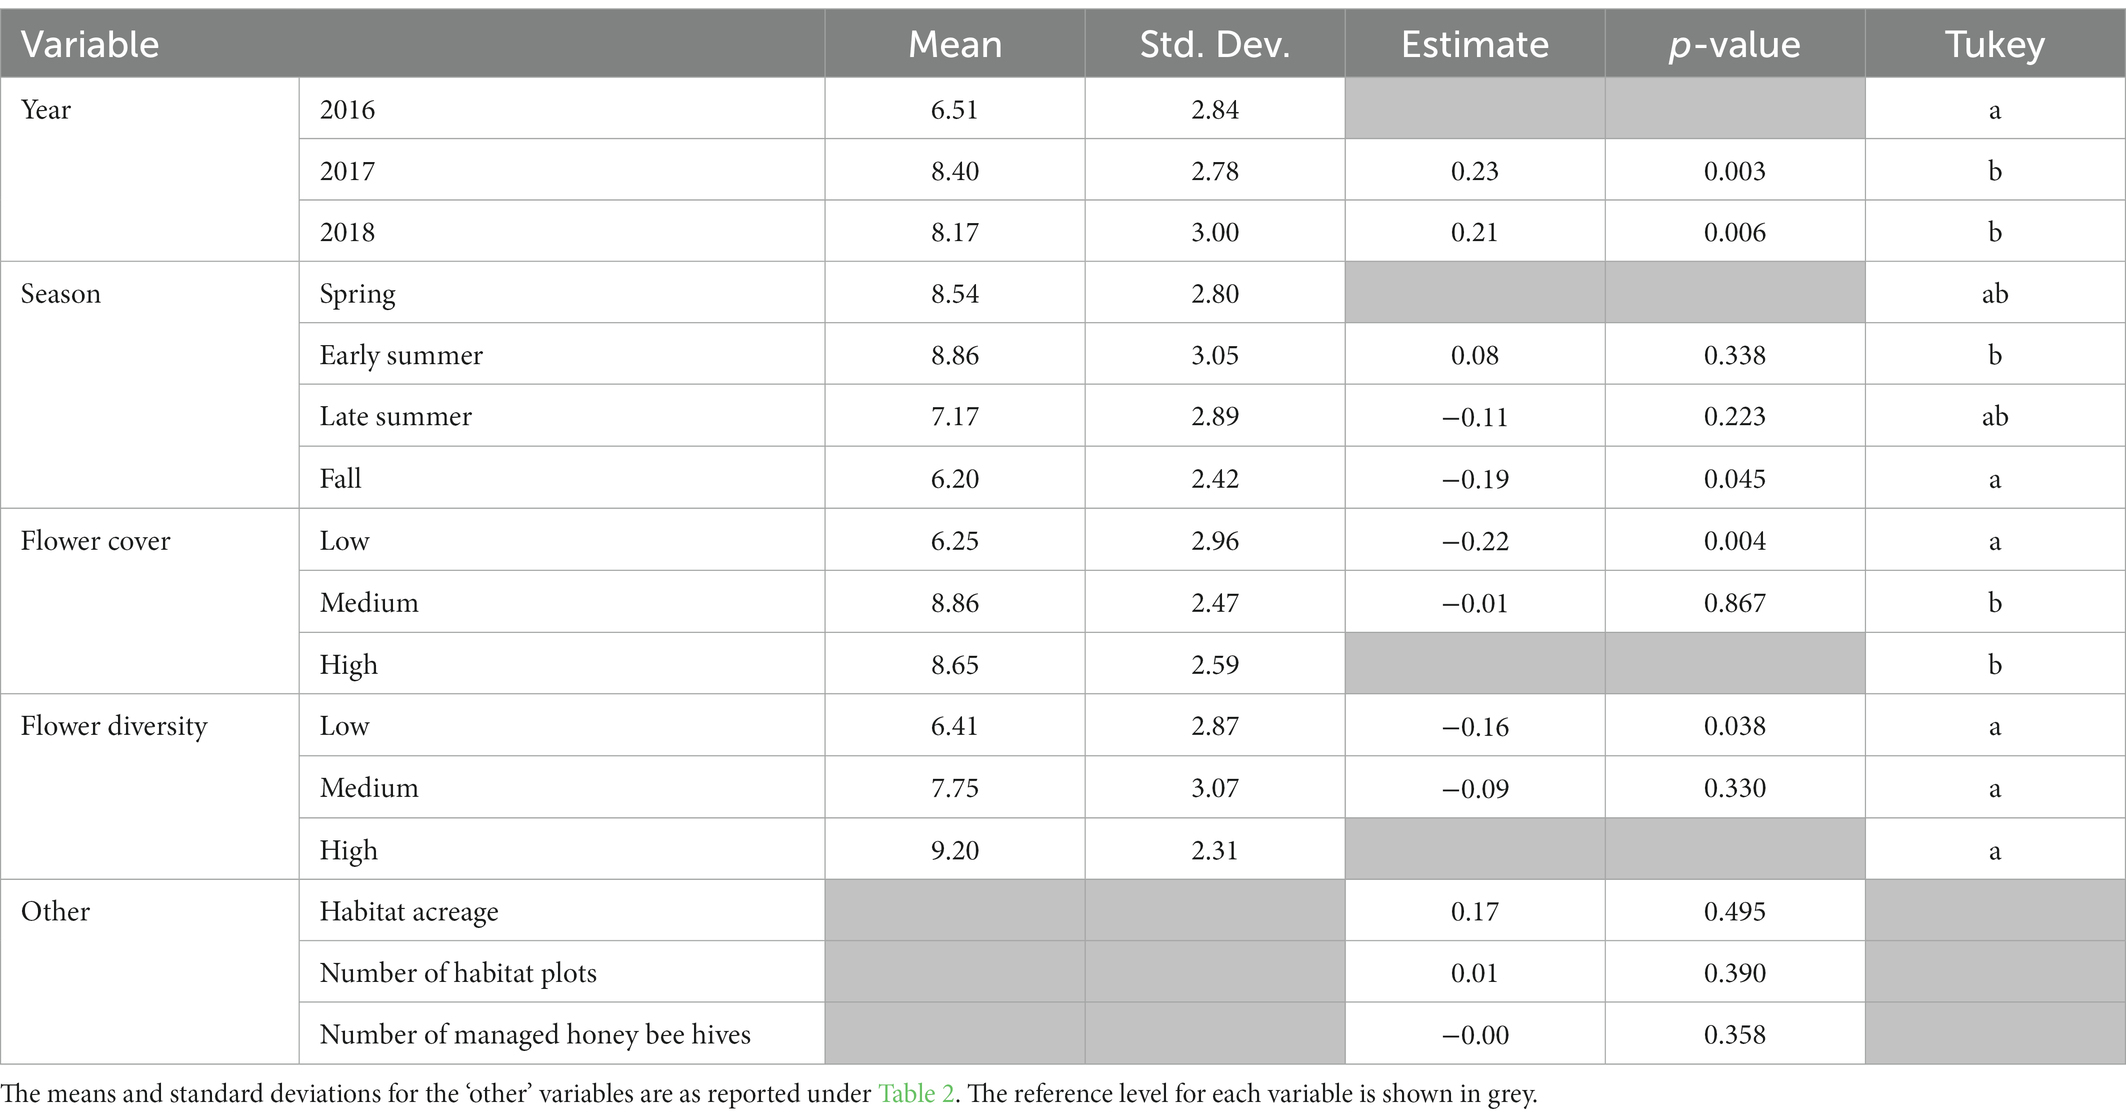
Table 3. Output from generalized linear mixed model and Tukey’s post-hoc analysis with genus richness as the response with a Poisson distribution.
Both flower cover and flower diversity within the habitat was found to significantly change across the sampling season [χ2 (6) = 15.2, p < 0.05] and [χ2 (6) = 13.3, p < 0.05], respectively) with both measures decreasing across the sampling season. Neither flower cover nor diversity significantly changed across years of the study [χ2 (4) = 1.02, p = 0.91 and χ2 (4) = 2.39, p = 0.67, respectively].
Much of the variation in bee community functional traits was influenced by variables beyond the planted habitat. Most of the variation in the bee community and its trait categories changed across the state when comparing stations (Figure 2) and regions (Figure 3), respectively. Bee community functional traits also changed across the sampling season with more ground nesting and parasitic bees, but less small bees, detected in early summer. While there were some changes in traits across years of the study, these effects were minimal.
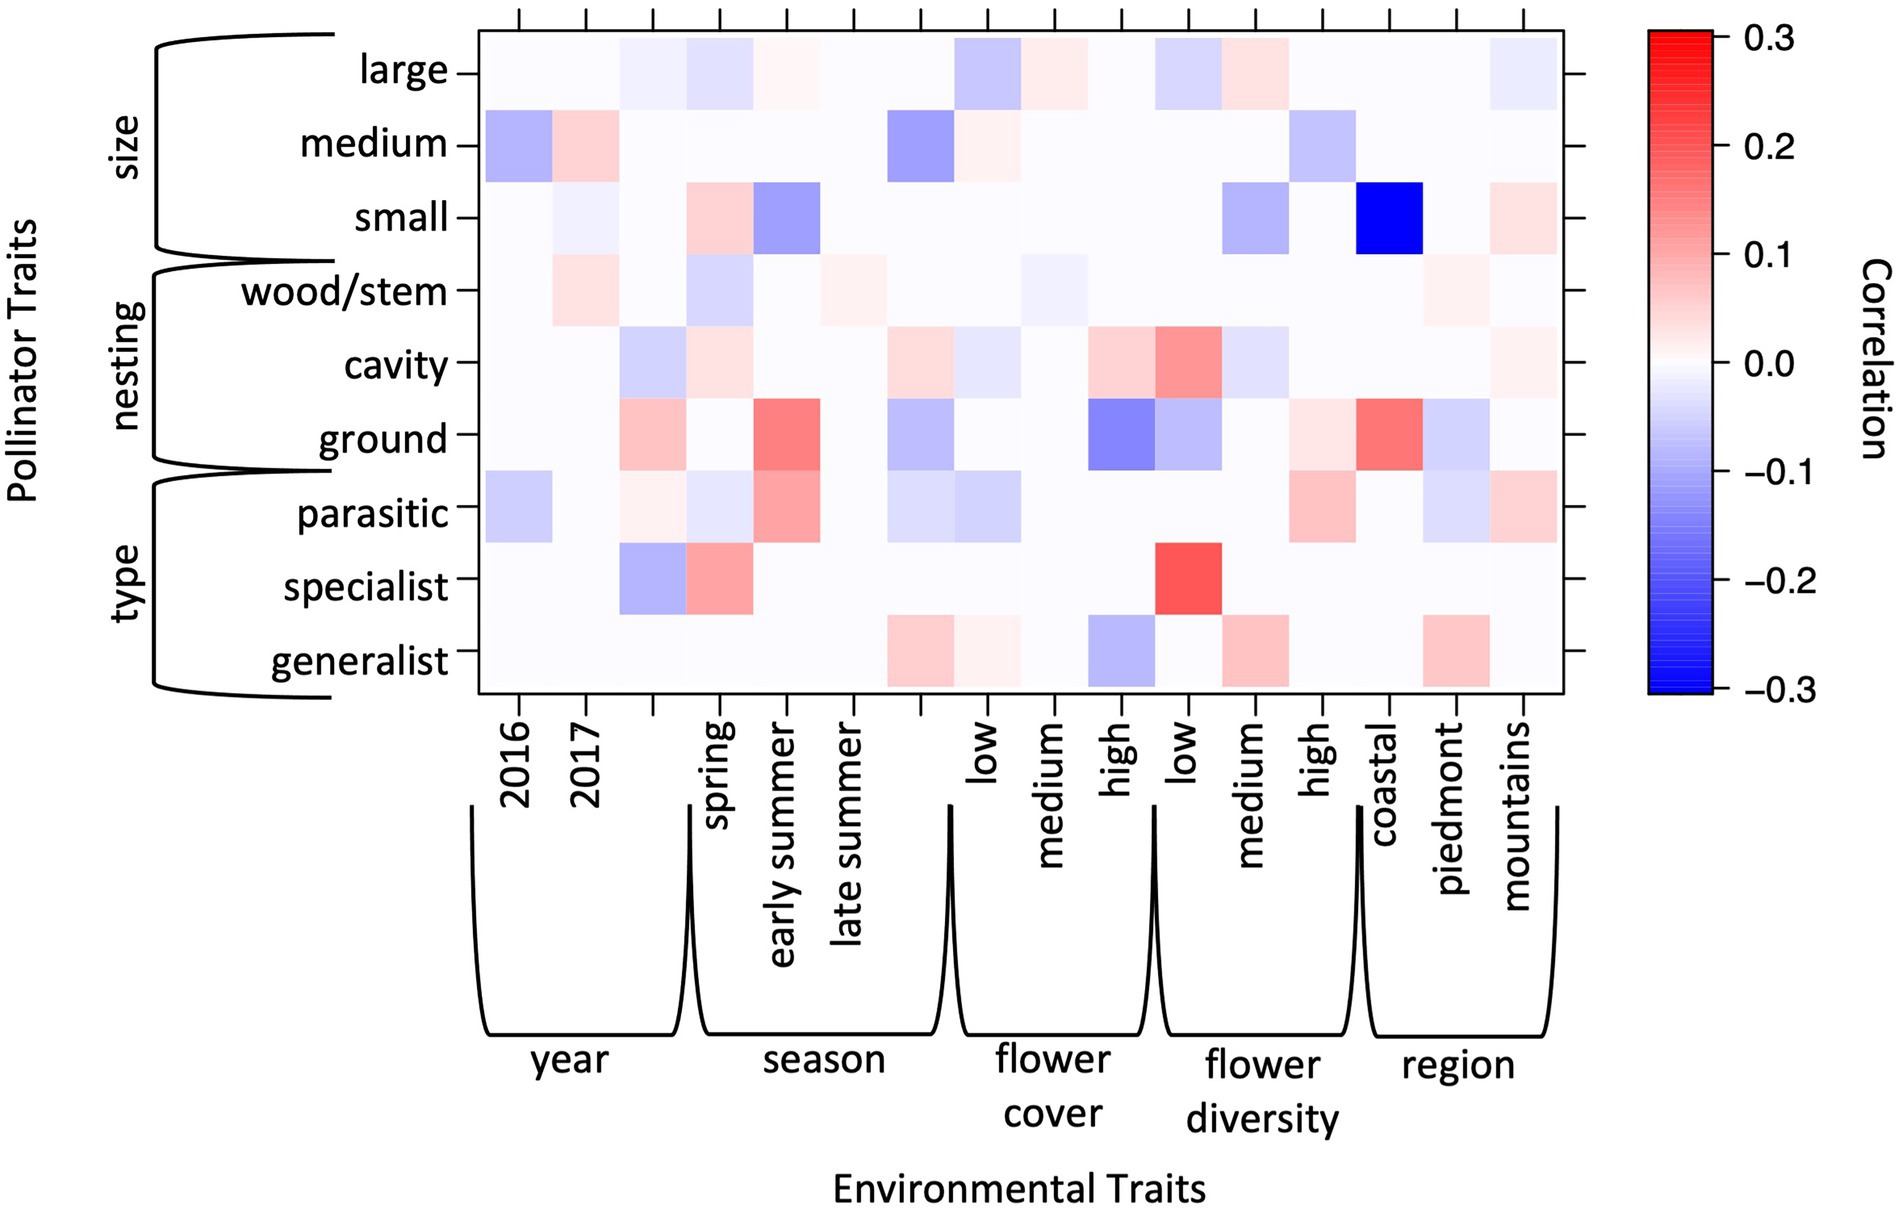
Figure 3. Output from fourth corner analysis showing correlations between habitat characteristics and bee functional traits. Positive correlations are shown in red negative correlations are shown in blue. Larger numbers show stronger correlations.
Characteristics of the planted habitat effected a small number of bee community functional traits. Fewer ground nesting bees were detected when flower cover was high. At low flower diversity, more cavity nesters and specialist pollinators were detected.
Overall, the planting of pollinator habitats on these agricultural research stations positively supported the bee communities over time; we saw a significant increase in abundance and genus richness within the habitat over the course of our study. While the small acreage of the habitats may limit our ability to detect signals that could be extrapolated to global impacts of pollinator habitat, our study confirms the more localized effects of small habitat plots within finite landscapes and that pollinator communities are positively affected by their establishment. While the habitat supported bee communities over time, we found the quality of the habitat was critical to their success. Habitat with higher flower cover supported higher bee abundance and richness, as has also been documented in previous research (summarized in Kowalska et al., 2022). Similarly, higher flower diversity supported a higher genus richness. It is encouraging that even small acreages of habitat (1 acre or less) can positively support local bee communities, suggesting that any amount of habitat restoration is better than none and thus efforts should be made to support bee communities wherever and however possible, especially in agroecosystems.
We found that flower cover and flower diversity at the habitat significantly changed across the sampling season, with both of these measures generally decreasing over time, findings which are mirrored in Morandin and Kremen (2013). Since late-season resources are extremely important for bee populations (Couvillon et al., 2014; Park and Nieh, 2017), adding more plant species that flower later in the year to seed mixes used in pollinator habitat establishment would be particularly beneficial; especially considering late-season is precisely the time of year when we documented the fewest resources. While we did not detect a significant change in these habitat measurements over the years of our study, we documented many plant species that likely naturally established within the habitat and were not a part of the seed mixes used by the NCDA&CS (Supplementary Table S3). While some of these flowering plants may also play a key role in supporting bee communities, many are considered weedy or invasive. It is known that fast-growing, high-propagating plant species establish during times of disturbance (González-Rivero et al., 2016), such as establishing pollinator habitat (Piqueray et al., 2019; Kowalska et al., 2022). This is of concern when establishing pollinator habitat, as these plants may outcompete other flowering species that are desired to have establish within planted pollinator habitat. In our study, several research station managers had difficulties with grasses and other weeds from soil seed banks overtaking the habitat. If left unmanaged, this could aid in the spread of unwanted plants or eventually no longer support bee communities, depending on how the plant community within the habitat shifts overtime. This underscores the need to continuously maintain planted pollinator habitats to ensure bee communities are sufficiently supported with quality resources (see also Kennedy et al., 2013) and that unwanted plant species are not spread.
We found that much of the variation in bee communities, as measured by functional traits, was from environmental factors beyond the habitat (e.g., location and time of year). However, we did document that flower cover and flower diversity had an impact on some community measures. This suggests that planting pollinator habitat will not be a ‘one-size-fits-all’ solution for all bee species, even though bee communities as a whole were supported in our study. Since analyses in this study were conducted using specimen identifications at the genus level, it will be important for future work to look at specimen identifications at the species level. As reported in Levenson (2021), there is evidence that different species will respond differently to habitat characteristics. Specifically, it was noted that managed Apis mellifera responded oppositely to flower diversity compared to the overall wild bee community, potentially due to differences in their foraging behavior. Thus, if a specific bee species is the focus of a particular conservation effort, we suggest that planted habitat should be tailored to better support the functional traits of said species.
Future research would benefit from continued long-term studies on bee communities, particularly studies conducted over a longer period of time than our 3-year study. While we were not testing for global increased abundance over time, there is some evidence of fluctuations across years, something that is expected to naturally occur in communities (Franzen and Nilsson, 2013). As such, longer-term monitoring in the future will reveal the true trajectory of these communities despite natural fluctuations. Continuous monitoring of bee populations should be a priority, as changes in the landscapes can have immediate impacts on bees (as shown here). Additionally, there were several species within this dataset that were only documented at one station or during one sampling event. Without wide-spread, long-term monitoring we will not be aware of which bees are present in an area, let alone which populations are being threatened. As our agricultural system becomes more reliant on pollinators (Aizen et al., 2009) but pressures on their populations intensify (Goulson et al., 2015; Koh et al., 2016), resources toward conserving bee populations will only become more important. Although, North Carolina was the first state in the US to implement a government-led program such as this, our findings should serve as encouragement for future government initiatives across the country to restore habitat in agricultural systems and to support monitoring programs of such habitat. Findings from this study should be used to better design and implement habitat in future plantings so as to best support pollinator populations.
The datasets presented in this study can be found in the article, Supplementary materials, and in online repositories via the Dryad Digital Repository https://doi.org/10.5061/dryad.w6m905qsq (Levenson and Tarpy, 2023).
HL and DT equally contributed to experimental design. HL was responsible for sample collection, data processing, analysis, the initial write up, and figure creation, with DT supporting these efforts. DT was responsible for acquiring funding. All authors contributed to the article and approved the submitted version.
This work was supported by funding from the North Carolina Department of Agriculture & Consumer Services, the North Carolina Beekeepers Association, and North Carolina State University.
Content of this manuscript previously appeared online in Levenson, 2021 and Levenson and Tarpy, 2022b. Thank you to the NCDA&CS and NCSU research stations for establishing and maintaining the pollinator habitat as well as assisting in the collection of bee bowl samples. Thank you to our colleagues and members of the Tarpy Lab “lunch bunch” for assistance in sample collection and/or sample processing, with special thanks to Claire Collins, Erin McDermott Terry, James Goethe, and Lauren Rusert. We also respectfully acknowledge that our university and areas used during this study stand on unceded lands with past and present ties to indigenous peoples (see https://native-land.ca/). We acknowledge this fact and honor these people as part of our work to rectify injustices and exclusions past and present.
The authors declare that the research was conducted in the absence of any commercial or financial relationships that could be construed as a potential conflict of interest.
All claims expressed in this article are solely those of the authors and do not necessarily represent those of their affiliated organizations, or those of the publisher, the editors and the reviewers. Any product that may be evaluated in this article, or claim that may be made by its manufacturer, is not guaranteed or endorsed by the publisher.
The Supplementary material for this article can be found online at: https://www.frontiersin.org/articles/10.3389/fevo.2023.1060834/full#supplementary-material
Aizen, M. A., Garibaldi, L. A., Cunningham, S. A., and Klein, A. M. (2009). How much does agriculture depend on pollinators? Lessons from long-term trends in crop production. Ann. Bot. 103, 1579–1588. doi: 10.1093/aob/mcp076
Antonio Sanchez, J., Carrasco, A., La Spina, M., Pérez-Marcos, M., and Javier Ortiz-Sánchez, F. (2019). How bees respond differently to field margins of shrubby and herbaceous plants in intensive agricultural crops of the Mediterranean area. Insects 11:26. doi: 10.3390/insects11010026
Ascher, J. S., and Pickering, J. (2016). Discover Life Bee identification guides. Available at: https://www.discoverlife.org/mp/20q (Accessed December 20, 2021).
Bates, D., Mächler, M., Bolker, B., and Walker, S. (2015). Fitting linear mixed-effects models using lme4. J. Stat. Softw. 6, 1–48. doi: 10.18637/jss.v067.i0
Blaauw, B. R., and Isaacs, R. (2014). Flower plantings increase wild bee abundance and the pollination services provided to a pollination-dependent crop. J. Appl. Ecol. 51, 890–898. doi: 10.1111/1365-2664.12257
Buhk, C., Oppermann, R., Schanowski, A., Bleil, R., Lüdemann, J., and Maus, C. (2018). Flower strip networks offer promising long term effects on pollinator species richness in intensively cultivated agricultural areas. BMC Ecol. 18:55. doi: 10.1186/s12898-018-0210-z
Ceballos, G., Ehrlich, P. R., Barnosky, A. D., García, A., Pringle, R. M., and Palmer, T. M. (2015). Accelerated modern human-induced species losses: entering the sixth mass extinction. Sci. Adv. 1:e1400253. doi: 10.1126/sciadv.1400253
Couvillon, M. J., Schurch, R., and Ratnieks, F. L. W. (2014). Waggle dance distances as integrative indicators of seasonal foraging challenges. PLoS ONE 9:e93945. doi: 10.1371/journal.pone.0093495
Dainese, M., Martin, E. A., Aizen, M. A., Albrecht, M., Bartomeus, I., Bommarco, R., et al. (2019). A global synthesis reveals biodiversity-mediated benefits for crop production. Sci. Adv. 5:eaax0121. doi: 10.1126/sciadv.aax0121
Dirzo, R., Young, H. S., Galetti, M., Ceballos, G., Isaac, N. J. B., and Collen, B. (2014). Defaunation in the Anthropocene. Science 345, 401–406. doi: 10.1126/science.1251817
Dray, S., and Legendre, P. (2008). Testing the species traits environment relationships: the fourth-corner problem revisited. Ecology 89, 3400–3412. doi: 10.1890/08-0349.1
Droege, S. (2008). The Very Handy Manual: How to Catch and Identify Bees and Manage a Collection. Available at: https://www.usgs.gov/media/files/how-catch-and-identify-bees-and-manage-a-collection
Fowler, J., and Droege, S. (2020). Pollen Specialist Bees of the Eastern United States. Available at: https://jarrodfowler.com/specialist_bees.html (Accessed December 20, 2021).
Fox, R., Oliver, T. H., Harrower, C., Parsons, M. S., Thomas, C. D., and Roy, D. B. (2014). Long-term changes to the frequency of occurrence of British moths are consistent with opposing and synergistic effects of climate and land-use changes. J. Appl. Ecol. 51, 949–957. doi: 10.1111/1365-2664.12256
Franzen, M., and Nilsson, S. G. (2013). High population variability and source-sink dynamics in a solitary bee species. Ecology 94, 1400–1408. doi: 10.1890/11-2260.1
Giacomini, J. J., Leslie, J., Tarpy, D. R., Palmer-Young, E. C., Irwin, R. E., and Adler, L. S. (2018). Medicinal value of sunflower pollen against bee pathogens. Sci. Rep. 8, 14394–14310. doi: 10.1038/s41598-018-32681-y
Gibbs, J. (2011). Revision of the metallic Lasioglossum (Dialictus) of eastern North America (hymenoptera: Halictidae: Halictini). Zootaxa 3073, 1–216. doi: 10.11646/zootaxa.3073.1.1
González-Rivero, M., Bozec, Y.-M., Chollett, I., Ferrari, R., Schönberg, C. H. L., Peter, J. M., et al. (2016). Asymmetric competition prevents the outbreak of an opportunistic species after coral reef degradation. Oecologia 181, 161–173. doi: 10.1007/s00442-015-3541-x
Goulson, D. (2019). The insect apocalypse, and why it matters. Curr. Biol. 29, R967–R971. doi: 10.1016/j.cub.2019.06.069
Goulson, D., Nicholls, E., Botías, C., and Rotheray, E. L. (2015). Bee declines driven by combined stress from parasites, pesticides, and lack of flowers. Science 347:347. doi: 10.1126/science.1255957
Grab, H. (2018). Fourth Corner and RQL Analysis. Available at: https://heather-grab.github.io/Entom-4940/rql.html (Accessed January 3, 2023).
Hallmann, C. A., Sorg, M., Jongejans, E., Siepel, H., Hofland, N., Schwan, H., et al. (2017). More than 75 percent decline over 27 years in total flying insect biomass in protected areas. PLoS One 12:e0185809. doi: 10.1371/journal.pone.0185809
Hayes, S. E., Tuiwawa, M., Stevens, M. I., and Schwarz, M. P. (2019). A recipe for weed disaster in islands: a super-generalist native pollinator aided by a ‘Parlourmaid’ plant welcome new arrivals in Fiji. Biol. Invasions 21, 1643–1655. doi: 10.1007/s10530-019-01923-z
Hothorn, T., Bretz, F., and Westfall, P. (2008). Simultaneous inference in general parametric models. Biom. J. 50, 346–363. doi: 10.1002/bimj.200810425
Kennedy, C. M., Lonsdorf, E., Neel, M. C., Williams, N. M., Ricketts, T. H., et al. (2013). A global quantitative synthesis of local and landscape effects on wild bee pollinators in agroecosystems. Ecol. Lett. 16, 584–599. doi: 10.1111/ele.12082
Koh, I., Lonsdorf, E. V., Williams, N. M., Brittain, C., Isaacs, R., Gibbs, J., et al. (2016). Modeling the status, trends, and impacts of wild bee abundance in the United States. PNAS 113, 140–145. doi: 10.1073/pnas.1517685113
Kowalska, J., Antkowiak, M., and Sienkiewicz, P. (2022). Flower strips and their ecological multifunctionality in agricultural fields. Agriculture 12:1470. doi: 10.3390/agriculture12091470
Kremen, C., M’Gonigle, L. K., and Ponisio, L. C. (2018). Pollinator community assembly tracks changes in floral resources as restored hedgerows mature in agricultural landscapes. Front. Ecol. Evol. 6:170. doi: 10.3389/fevo.2018.00170
Levenson, H. K. (2021). Temporal and Spatial Dynamics of Pollinator Communities Across North Carolina in Response to Conservation Efforts in the Agroecosystem. [dissertation]. [Raleigh (NC)]: North Carolina State University.
Levenson, H. K., Sharp, A. E., and Tarpy, D. R. (2022). Evaluating the impact of increased pollinator habitat on bee visitation and yield metrics in soybean crops. Agric. Ecosyst. Environ. 331:107901. doi: 10.1016/j.agee.2022.107901
Levenson, H. K., and Tarpy, D. R. (2022a). Effects of planted pollinator habitat on pathogen prevalence and interspecific detection between bee species. Sci. Rep. 12:7806. doi: 10.1038/s41598-022-11734-3
Levenson, H. K., and Tarpy, D. R. (2022b). Pollinator community response to planted pollinator habitat in agroecosystems over time. Authorea [Preprint]. doi: 10.22541/au.164191433.37143936/v1
Levenson, H., and Tarpy, D. (2023). Dataset for: Planted pollinator habitat in agroecosystems: How does the pollinator community respond? Dryad, Dataset. Available at: https://doi.org/10.5061/dryad.w6m905qsq
Levenson, H., and Youngsteadt, E. (2019). The bees of North Carolina: an identification guide. NC State Extension 7, 155–170. doi: 10.1017/S0017383500014595
Lewandowski, E. J., and Oberhauser, K. S. (2017). Butterfly citizen scientists in the United States increase their engagement in conservation. Biol. Conserv. 208, 106–112. doi: 10.1016/j.biocon.2015.07.029
Lister, B. C., and Garcia, A. (2018). Climate-driven declines in arthropod abundance restructure a rainforest food web. Proc. Natl. Acad. Sci. U. S. A. 115, E10397–E10406. doi: 10.1073/pnas.1722477115
Losey, J. E., and Vaughan, M. (2006). The economic value of ecological services provided by insects. Bioscience 56:311. doi: 10.1641/0006-3568(2006)56[311:tevoes]2.0.co;2
Lynch-O’brien, L. I., Babchuk, W. A., Dauer, J. M., Heng-Moss, T., Golick, D., Phillips, T., et al. (2021). Transference of citizen science program impacts: a theory grounded in public participation in scientific research. Diversity 13:339. doi: 10.3390/d13080339
Mallinger, R. E., Franco, J. G., Prischmann-Voldseth, D. A., and Prasifka, J. R. (2019). Annual cover crops for managed and wild bees: optimal plant mixtures depend on pollinator enhancement goals. Agric. Ecosyst. Environ. 273, 107–116. doi: 10.1016/j.agee.2018.12.006
Mitchell, T. B. (1960). Bees of the Eastern United States. Raleigh, NC: North Carolina Agricultural Experiment Station.
Morandin, L. A., and Kremen, C. (2013). Hedgerow restoration promotes pollinator populations and exports native bees to adjacent fields. Ecol. Appl. 23, 829–839. doi: 10.1890/12-1051.1
Noriega, J. A., Hortal, J., Azcárate, F. M., Berg, M. P., Bonada, N., Briones, M. J. I., et al. (2018). Research trends in ecosystem services provided by insects. Basic Appl. Ecol. 26, 8–23. doi: 10.1016/j.baae.2017.09.006
Ollerton, J., Winfree, R., and Tarrant, S. (2011). How many flowering plants are pollinated by animals? Oikos 120, 321–326. doi: 10.1111/j.1600-0706.2010.18644.x
Park, B., and Nieh, J. C. (2017). Seasonal trends in honey bee pollen forgaing revealed through DNA barcoding of bee-collected pollen. Insect. Soc. 64, 425–437.
Piqueray, J., Gilliaux, V., Decruyenaere, V., Cornelis, J. T., Uyttenbroeck, R., and Mahy, G. (2019). Management of Grassland-like Wildflower Strips Sown on nutrient-rich arable soils: the role of grass density and mowing regime. Environ. Manag. 63, 647–657. doi: 10.1007/s00267-019-01153-y
Rotchés-Ribalta, R., Ruas, S., Ahmed, K. D., Gormally, M., Moran, J., Stout, J., et al. (2021). Assessment of semi-natural habitats and landscape features on Irish farmland: new insights to inform EU common agricultural policy implementation. Ambio 50, 346–359. doi: 10.1007/s13280-020-01344-6
Sarkar, D. (2008). Lattice: Multivariate Data Visualization with R. Berlin: Springer Science+Business Media.
Scheper, J., Bommarco, R., Holzschuh, A., Potts, S. G., Riedinger, V., Roberts, S. P. M., et al. (2015). Local and landscape-level floral resources explain effects of wildflower strips on wild bees across four European countries. J. Appl. Ecol. 52, 1165–1175. doi: 10.1111/1365-2664.12479
Silva, L. S., Tomaz, M., De Oliveira, P., Tabarelli, M., Lopes, A. V., Cruz-neto, O., et al. (2020). Plant – pollinator interactions in urban ecosystems worldwide: a comprehensive review including research funding and policy actions. Ambio 50, 884–900. doi: 10.1007/s13280-020-01410-z
Vasiliev, D., and Greenwood, S. (2020). Pollinator biodiversity and crop pollination in temperate ecosystems, implications for national pollinator conservation strategies: mini review. Sci. Total Environ. 744:140880. doi: 10.1016/j.scitotenv.2020.140880
Wagner, D. L. (2020). Insect declines in the Anthropocene. Annu. Rev. Entomol. 65, 457–480. doi: 10.1146/annurev-ento-011019-025151
Wang, Y., Naumann, U., Wright, S. T., and Warton, D. I. (2012). Mvabund-an R package for model-based analysis of multivariate abundance data. Methods Ecol. Evol. 3, 471–474. doi: 10.1111/j.2041-210X.2012.00190.x
Warzecha, D., Diekötter, T., Wolters, V., and Jauker, F. (2018). Attractiveness of wildflower mixtures for wild bees and hoverflies depends on some key plant species. Insect. Conserv. Divers 11, 32–41. doi: 10.1111/icad.12264
Widhiono, I., and Sudiana, E. (2017). Preliminary test of Agri-environmental scheme implementation in farmland in northern slope of mount Slamet. Agrivita 39, 66–73. doi: 10.17503/agrivita.v39i1.871
Williams, N. M., Ward, K. L., Pope, N., Isaacs, R., Wilson, J., May, E. A., et al. (2015). Native wildflower plantings support wild bee abundance and diversity in agricultural landscapes across the United States. Ecol. Appl. 25, 2119–2131. doi: 10.1890/14-1748.1
Wilson, J. S., Forister, M. L., and Carril, O. M. (2017). Interest exceeds understanding in public support of bee conservation. Front. Ecol. Environ. 15, 460–466. doi: 10.1002/fee.1531
Keywords: wild bees, pollinators, pollinator habitat, flower strips, agroecosystems, pollinator conservation
Citation: Levenson HK and Tarpy DR (2023) Planted pollinator habitat in agroecosystems: How does the pollinator community respond? Front. Ecol. Evol. 11:1060834. doi: 10.3389/fevo.2023.1060834
Edited by:
Lars Straub, University of Bern, SwitzerlandReviewed by:
Dan Cariveau, University of Minnesota Twin Cities, United StatesCopyright © 2023 Levenson and Tarpy. This is an open-access article distributed under the terms of the Creative Commons Attribution License (CC BY). The use, distribution or reproduction in other forums is permitted, provided the original author(s) and the copyright owner(s) are credited and that the original publication in this journal is cited, in accordance with accepted academic practice. No use, distribution or reproduction is permitted which does not comply with these terms.
*Correspondence: Hannah K. Levenson, ✉ aGtsZXZlbnNAbmNzdS5lZHU=
Disclaimer: All claims expressed in this article are solely those of the authors and do not necessarily represent those of their affiliated organizations, or those of the publisher, the editors and the reviewers. Any product that may be evaluated in this article or claim that may be made by its manufacturer is not guaranteed or endorsed by the publisher.
Research integrity at Frontiers
Learn more about the work of our research integrity team to safeguard the quality of each article we publish.