 Meng Du
 Yifan Zhang1
 Hai Dong
 Xiangjun Zhou
- 1Department of Finance, Shandong Technology and Business University, Yantai, Shandong, China
- 2School of Land Science and Technology, China University of Geosciences (Beijing), Beijing, China
- 3School of Investment and Construction Management, Dongbei University of Finance and Economics, Dalian, China
- 4School of Business, Wenzhou University, Wenzhou, China
Introduction: Energy conservation and emission reduction, as a major policy of China for a long time, has been put on the key strategic position. Based on the panel data of 30 provinces, cities and districts in China from 2006 to 2019.
Methods: This paper uses fixed effect model and spatial Durbin model to explore the effect and mechanism of artificial intelligence (AI) on regional carbon emission intensity (CEI).
Results: The results show that: (1) there is a significant inverted U-shaped between AI and CEI, that is, with the deepening of the development of AI, CEI first increases and then decreases. (2) There is a significant spatial correlation between the development of AI and CEI in China. (3) AI has a significant spatial spillover effect on CEI of adjacent regions, and it shows an inverted U-shaped track-from promoting to restraining.
Discussion: The conclusion provides policy implications for the formulation of AI development strategy and so on during the specific period.
1. Introduction
In view of the world energy statistical yearbook 2021, from 2011 to 2020, Chinese total carbon-emission has increased by nearly 1 billion tons, which is one of the few in the world. This also means that China’s emission reduction situation is extremely severe under the situation of global warming and continuous large-scale greenhouse gas emissions. This is not only related to the current social and economic development, but also closely related to the survival of future generations (Liu et al., 2022). In 2020, President Xi promised to achieve carbon peaking and carbon neutralization by 2030 and 2060, respectively, at the UN General Assembly (Zhang et al., 2020). Since then, carbon reduction and emission reduction has been listed as a priority and become one of the core policies to promote China’s high-quality development (Xu et al., 2021).
At the same time, with the wide application and continuous innovation of big data, Internet of things, and large machine production, AI has become a direct response to the great changes of internal endowments and external environment in China’s high-quality development stage by virtue of its technology effect, scale effect, and network effect (Jia et al., 2021). According to the data released by International Federation of Robotics (IFR), it can be seen that the application scale of robots is on the rise, with an installed capacity of 140,000 units in 2019, ranking the first in the world. With the strong support of the state, it has penetrated into all walks of life. With the continuous improvement of the contribution of AI to the national economy, the rapid development of AI has been widely and continuously concerned by the academic community, especially the environmental improvement effect of the development of AI. Those effects can be divided into the following three views. The first is Acemoglu and Restrepo (2018), who believed that relying on the extensive application of AI, the industry production and carbon-emission reduction technology can be integrated with each other, and then change the production and consumption mode, so as to improve energy utilization efficiency. Meanwhile, the use of in-depth learning network and sensor equipment of AI for effective monitoring of carbon-emission can also optimize the carbon reduction decisions of government and enterprises, making the environmental improvement effect of AI more prominent (Batty, 2018; Henderson et al., 2020). The second is that the rise, maturity and wide application of AI will inevitably bring about changes in energy use types and utilization methods, leading to a large increase in power demand and a significant increase in CEI (Salahuddin and Alam, 2015). The third is that the development of AI has a complex and uncertain impact on Carbon-emission due to the degree of technological progress, regional development differences, depth of mechanization, and environmental policies (Bhujabal et al., 2021; Guo et al., 2021). In short, different from the policy level and the vigorous development of practice level, there is still no unified scientific cognition on whether the development of AI can reduce CEI (Milojevic-Dupont and Creutzig, 2021; Lu et al., 2022).
This study systematically investigates the effect and mechanism of the development of AI on CEI. The literature related to this study is how the development of digital technology affects carbon-emission. This kind of literature focuses more on the impact of informatization and digitization on carbon-emission through industrial change under the effect of technological progress. Some studies found that the Internet industry leads to the rapid growth of power consumption, which will enhance the total and intensity of carbon-emission (Hamdi et al., 2014). Other studies have proved that the information technology can reduce greenhouse gas emissions (de Bézenac et al., 2019; Haseeb et al., 2019), especially in the long term, increasing Internet penetration (Shobande, 2021) have significant effects on reducing CEI.
To sum up, it can be found that the existing studies have carried out detailed exploration, intensity, and AI development, but there are still some deficiencies. First of all, most of the existing studies focus on qualitative research, lack of empirical research support of AI on carbon reduction effect, and there is no scientific cognition of the impact of AI development on CEI (Yang, 2021). Secondly, the existing research on the spatial correlation of AI on carbon reduction effect is lack of detailed mechanism discussion and empirical proof. Finally, China is a vast country with unbalanced development among regions and large differences in industrial structure, which will bring regional heterogeneity to the application of artificial intelligence and regional carbon reduction and emission reduction (Li et al., 2019; Liu and Chen, 2021).
Based on this, the main contributions of this paper are as follows:
1. The inhibitory effect of artificial intelligence on regional carbon emission intensity is studied.
2. The regional differences of the impact of artificial intelligence development on carbon emission intensity are discussed.
3. The spatial spillover effect of artificial intelligence development on regional carbon emissions is clarified.
Therefore, based on the long panel data of 30 provinces, municipalities, and regions in China, this paper establishes a theoretical analysis framework for artificial intelligence and regional carbon emission intensity, explores the influence and mechanism of artificial intelligence on regional carbon emission intensity, enriches relevant studies, and provides theoretical inspiration for the development of artificial intelligence and the implementation and promotion of emission reduction policies in China.
2. Theoretical analysis and research hypothesis
The development of AI has entered the stage of technology explosion and large-scale application along with the breakthrough of basic technologies such as big data algorithm. Under this trend, the modes and means also present diversified changes. This paper analyzes the influence mechanism of AI on CEI from two aspects of direct mechanism and spatial effect transmission path, and puts forward corresponding research hypotheses (Lee and Lee, 2014).
Artificial intelligence has been in the process of dynamic evolution from low to high, so there will be dynamic differences in the impact on CEI (Yu et al., 2020). In the initial period, the wide application of AI and the large-scale construction of big data network center will aggravate the regional power consumption and energy consumption. With the popularization of machine learning system, AI language processing system will produce a lot of carbon-emission. Although it promotes the improvement of energy utilization efficiency, but it also intensifies more energy consumption, thus offsetting the effect of carbon-emission reduction and even increasing the CEI (Strubell et al., 2019). Meanwhile, the progress of AI technology will also promote the development of communication technology and related industries, as well as the development of Internet industry increases the demand for energy consumption, which leads to the growth of regional carbon-emission (Amiri et al., 2021). In the mature development stage, first of all, the rapid development of AI has led to the vigorous development of e-commerce industry and Internet industry, where a large number of intelligent machines replace programmed labor. As an environment-friendly industry, they can squeeze the development space of high energy consumption through crowding out effect. So that can accelerate the transformation and sustainable development of regional structure. Secondly, the technological progress brought about by the breakthrough development of AI can be developed and explored through intelligent devices to replace alternative energy sources, so as to reduce the use of traditional carbon-emission energy and achieve the goal of reducing CEI. Finally, the progress of AI can be used for fine management. Through the informal environmental regulation generated by the amount of pollution search data in the network platform, the environmental quality of the city can be improved. Moreover, the digital media communication can maximize the guidance of the public to form green environmental protection concept. It also provides new solutions for solving environmental governance problems such as dynamic supervision of environmental pollution and cross regional environmental management, avoids the negative impact of AI in the early stage of large-scale application (Xu et al., 2019; Pan et al., 2020). Based on this, the following assumptions are proposed:
H1: the impact of AI development on CEI is inverted U-shaped.
The economic activities of different regions in China show more and more strong correlation, and many scholars have confirmed that AI technology has obvious positive spatial agglomeration effect (Xu et al., 2022). Therefore, AI may also have spatial spillover effect. In the initial stage, due to the differences of natural endowment and social development among different regions in China, the allocation and utilization efficiency of industrial resources in different regions are uneven, which provides space for the release of polarization effect. Under the guidance of market-oriented profit, the scarcity and profit-making characteristics of economic resources will automatically concentrate from backward regions to high marginal yield regions. At the same time, the application of intelligent large machines and the continuous innovation of digital technology have broken the traditional regional restrictions. They can spread through the channels of factor flow and economic cooperation with neighboring regions, and have scale effects on economic growth. They not only drive a new generation of information industry, but also can drive the growth of related industries through the industry spillover effect. In the mature development stage, the application scenarios of AI are becoming more and more abundant. Each production department will produce strong low-carbon technology spillover effect through intelligent upgrading and transformation. In this process, a large number of highly polluting industries were replaced by service industries, and the industrial structure was gradually advanced. The structure dominated by fossil energy has also been greatly improved (Al-Ghandoor, 2010). Through the demonstration effect and industrial correlation effect, the regional carbon-emission and intensity were reduced. Based on this, this paper proposes hypothesis 2:
H2: the spatial spillover effect of AI on regional carbon-emission has an inverted U-shaped trajectory.
3. Research design
3.1. Model design
3.1.1. Panel benchmark model
In order to verify hypothesis 1, that is, the effect and mechanism of AI on CEI, this paper constructs the following panel benchmark model:
In the Formula (1), is the CEI, is the development level of AI, is the square term of AI, represents the region, represents the year, represents a series of control variables, means individual effect, means time effect, as a random disturbance term, this paper focuses on the coefficients and of the development level on AI, which is the core explanatory variable.
3.1.2. Spatial Durbin model
Spatial metrology models mainly include spatial autoregressive model, spatial error model, spatial autocorrelation model and spatial Dubin model. The spatial Dubin model attributes the generation of spatial effects to explained variables and explanatory variables, and includes the spatial lag term of explanatory variables, which helps to reduce the bias caused by missing variables in the empirical analysis. Therefore, in order to further explore the spatial spillover effect of artificial intelligence development on regional carbon emission intensity, the following model is constructed in this study based on the practice of Yu and Su (2022):
In Formula (2), ρ is the spatial lag coefficient, represents the spatial lag variable of AI, represents the spatial weight matrix. Formula (2) contains both the explained variables and the spatial terms of the explanatory variables. The spatial Durbin model can improve the robustness of the estimation results and be more comprehensive. At the same time, this paper uses geographic distance matrix and economic geography matrix to represent the spatial weight matrix, wherein the geographic distance matrix ( ) is constructed by calculating the distance ( ) between the city and the city according to the longitude and latitude of the city, the specific Formula (3) is as follows:
The economic geography matrix can better reflect the spatial relationship of adjacent areas from two aspects of geographical distance and economic distance. Referring to the practice of Lin et al. (2005), this paper uses the difference of real GDP per capita between cities to measure the economic distance between regions. The economic distance measures the closeness of economic ties between cities, and introduces it into the spatial weight matrix to construct the economic geography matrix , is the economic distance matrix, and the calculation Formula (4) is as follows:
is the average of per capita real GDP for city in the sample period.
3.2. Variable selection
3.2.1. Explanatory variable: AI
There are many measurement methods of AI, and the common methods are to use AI patents, investment amount of related industries and multi-index comprehensive method to measure, but these methods have some limitations and cannot truly reflect the actual application of AI. Therefore, this paper follows the practice widely used in academic circles (Cheng et al., 2019; Acemoglu and Restrepo, 2020), and indirectly reflects the practical application of AI by measuring the installation density of robot. The original data are from the national industry level robot stock data provided by IFR. Because the industry classification standard adopted by IFR is different from that in China, the practice of Yan et al. (2020) is used to unify the industry classification, and the development level of AI at the provincial level is calculated by the following Formula (5):
In Formula (5), represents the number of employees in industry j of region i during period t, represents the number of employees in area i during period t, represents the stock of industrial robots in the period t of industry j, and is the number of employees in j industry in China.
3.2.2. Explained variables: CEI
Based on the practice of Liu et al. (2022), this paper uses the carbon-emission coefficient method to calculate the CEI, which is expressed as per 10,000 yuan of carbon-emission, the specific calculation method is as follows:
In Formula (6), is the total carbon-emission of area i, is the carbon-emission coefficient of the j energy, and is the consumption of the j energy in area i. Six energy sources including coal, oil, natural gas, coke, gasoline, and diesel are selected to calculate carbon-emission. The emission factors refer to the greenhouse gas emission list provided by IPCC.
3.2.3. Control variables
In order to reduce the impact of missing variables, based on the existing literature, the level of economic development, industrial structure, and the level of opening up are set as control variables.① GDP: take the logarithm of regional GDP to measure. ② UNE: expressed by registered urban unemployment rate; ③ Indust: measured by the proportion of industrial added value in GDP. ④ Open: expressed by the proportion of total import and export to GDP; ⑤ urb: expressed by the ratio of urban population to regional total population; and ⑥ es: expressed by energy consumption elasticity coefficient.
The research data are the panel data of 30 provinces, cities, and districts in China from 2006 to 2019. The original data are from China’s provincial statistical yearbook, China’s energy statistical yearbook, and IFR. The details of the main variables are as shown in Table 1.
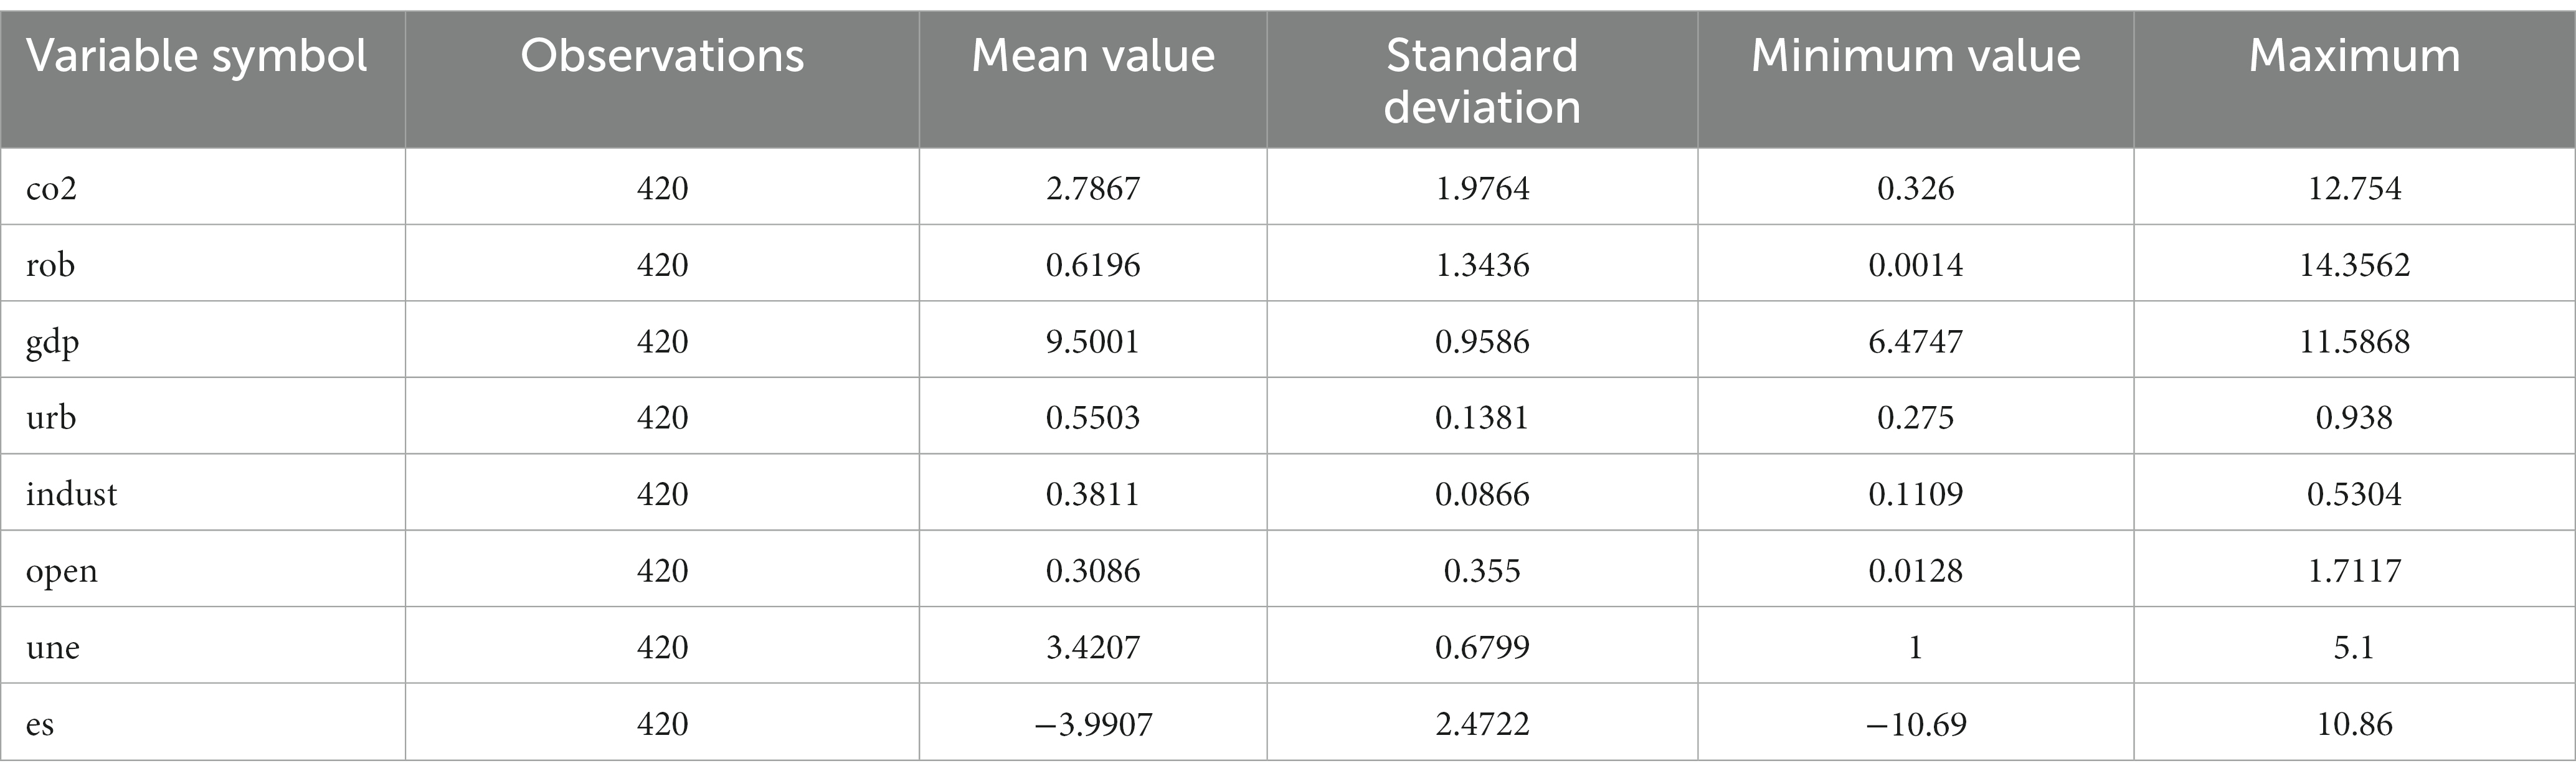
Table 1. Descriptive statistics of variables.
4. Empirical analysis
4.1. Regression analysis benchmark
Table 2 shows the benchmark regression results of the CEI affected by the development of AI. Through the Hausmann test, the benchmark regression adopts the spatiotemporal double fixed model. Column (1) is the regression result of only adding AI; column (2) is the regression result of economic development level, urbanization level, and industrial structure; column (3) is the regression result of comprehensive consideration of AI, industrial structure, economic development level, urbanization level, regional unemployment rate, level of opening to the outside world, and energy structure. The purpose of adding control variables step by step is to observe whether the regression coefficient of AI changes. According to the regression results in column (1) of Table 2, when only considering the influence of AI on CEI, the first and second estimation coefficients are 0.0519 and − 0.0252 respectively, which are significant at 1 and 5% statistical levels. From column (2) and (3), after adding some and all control variables successively, the estimation coefficients of the first and second terms of AI are still positive and negative, and both pass the 5% confidence level test. It can be seen that there is an inverted U-shaped relationship between AI and CEI, that is, the CEI first increases and then decreases with the improvement of AI development level, and hypothesis 1 is proved. In addition, in the control variables, the improvement of opening-up level and economic development level can provide sufficient space for the optimal utilization of AI technology, and promote the reduction of CEI. However, the improvement of energy structure and the adjustment of industrial structure have increased the CEI at this stage, which shows that the current production and living are divorced from the traditional fossil energy, and the demand for electric power is greatly increased.
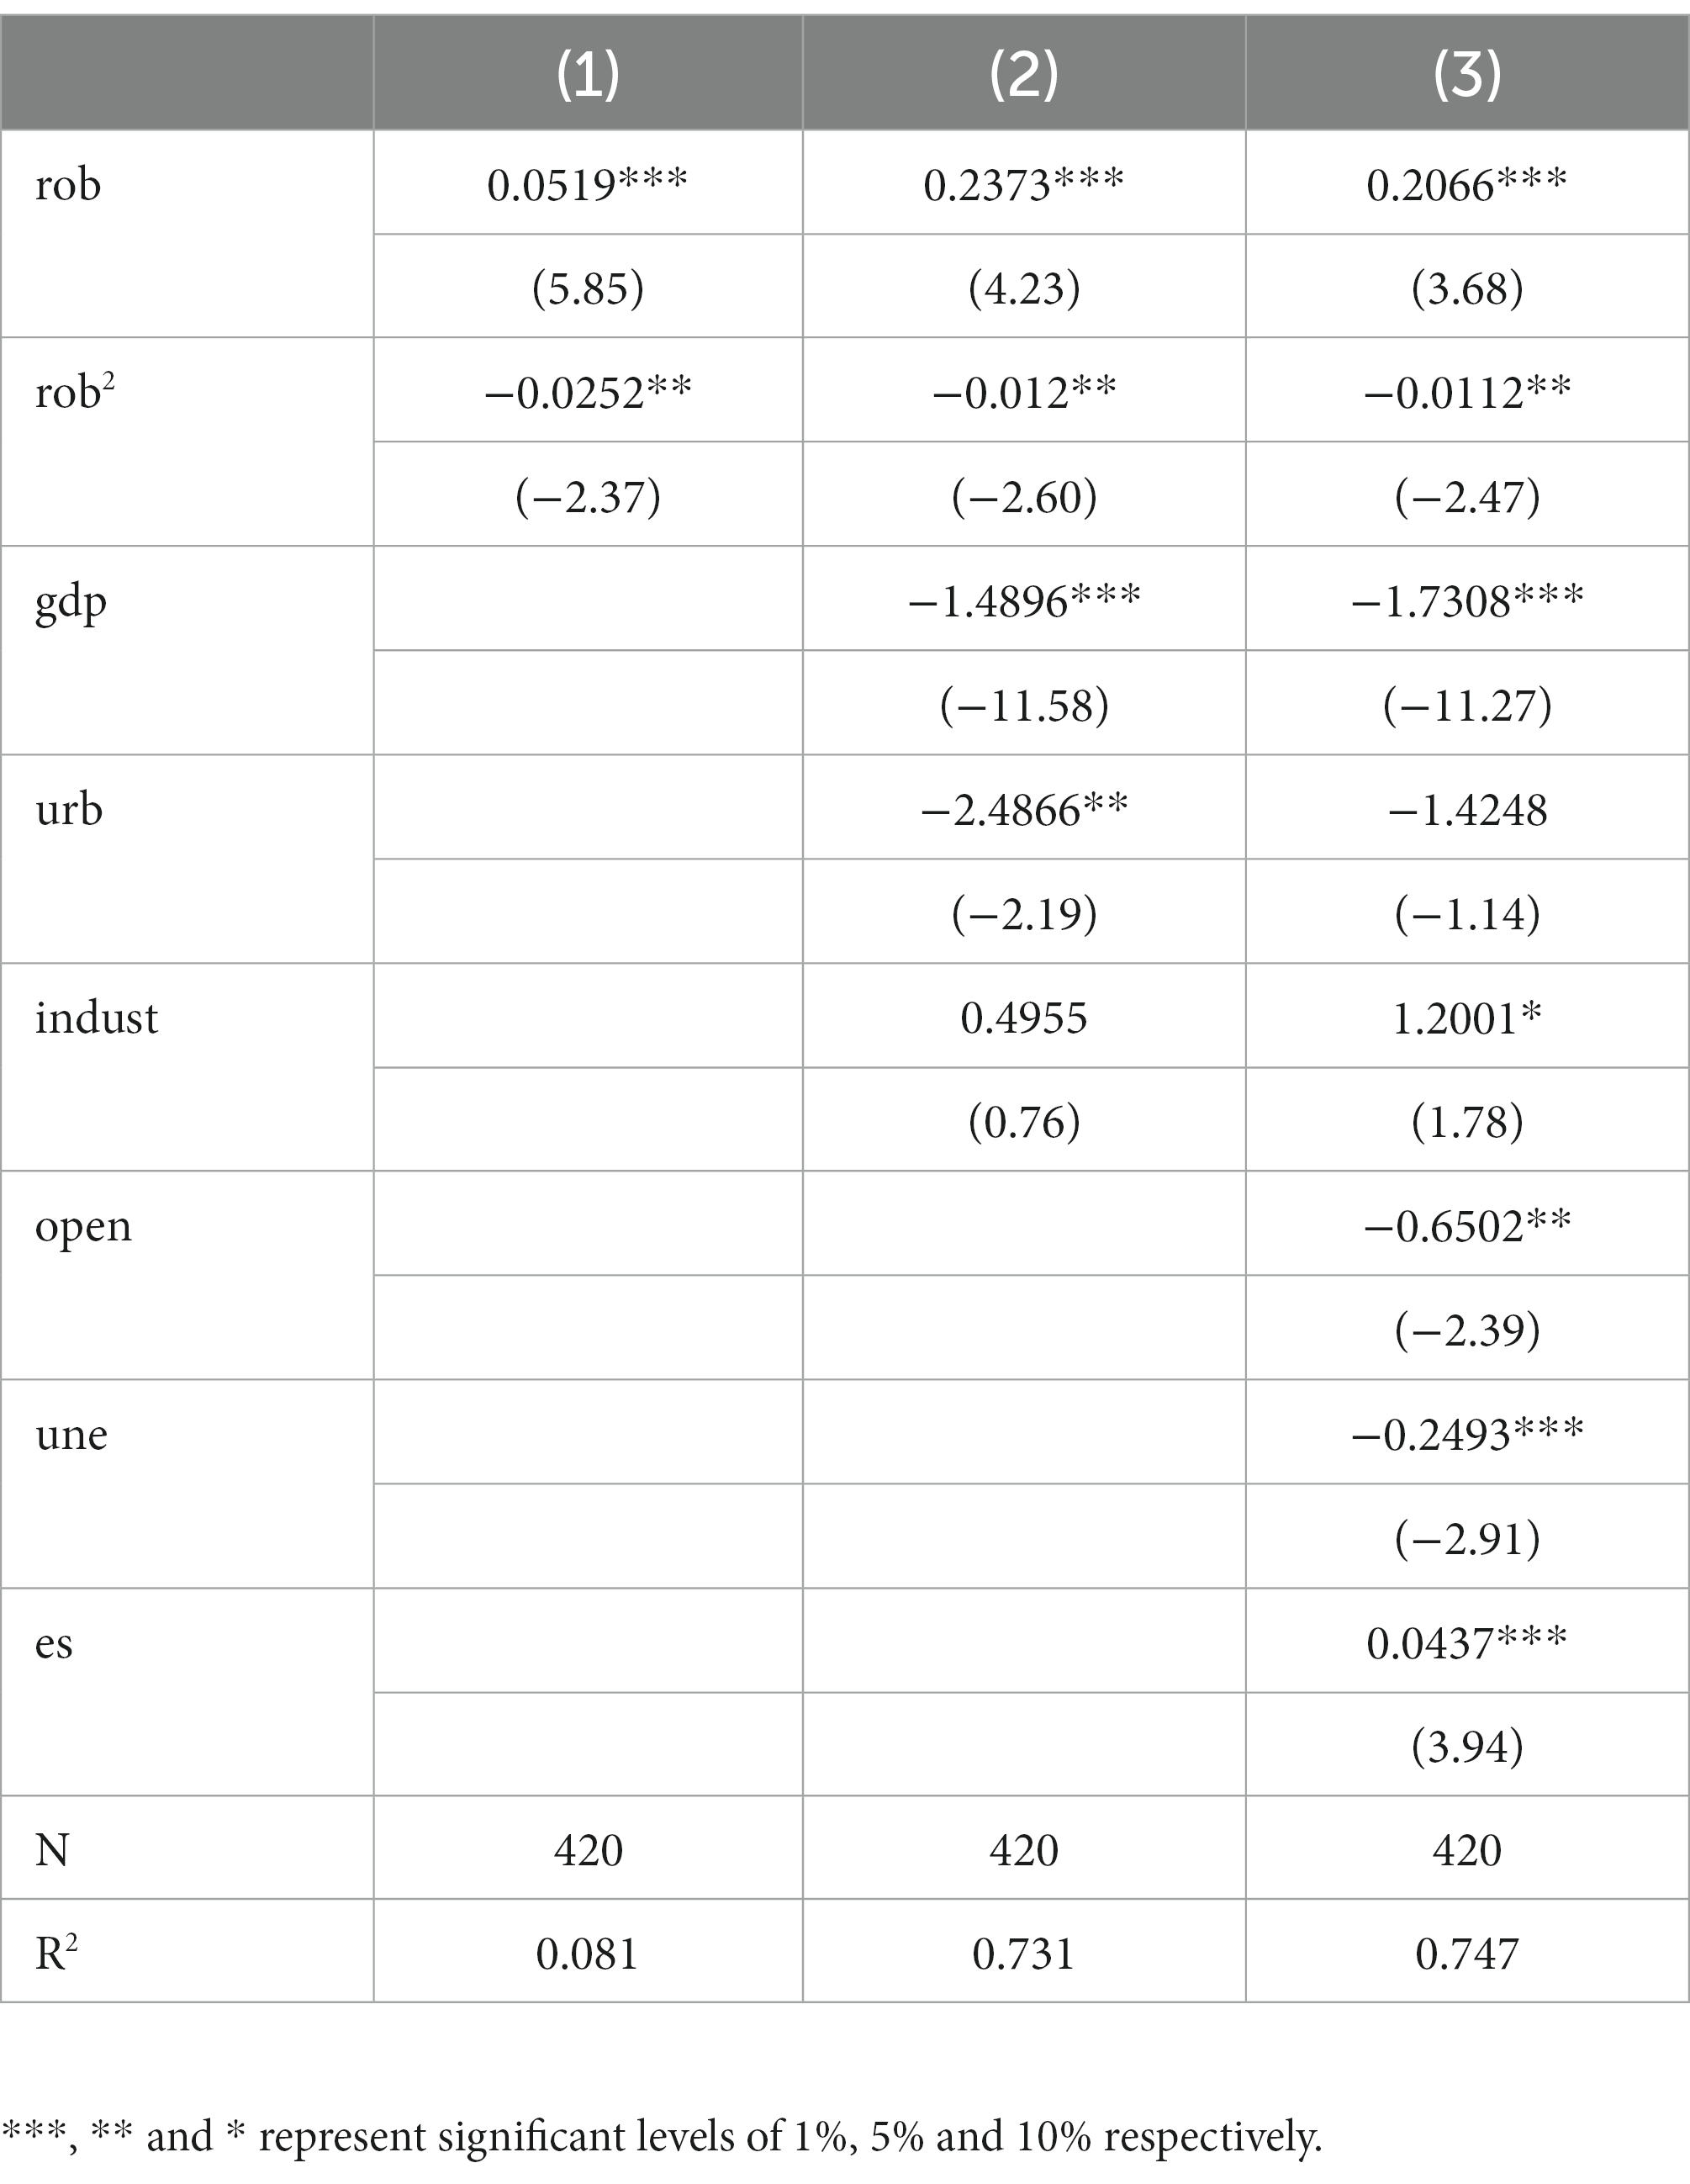
Table 2. Benchmark regression results.
4.2. Spatial regression analysis
4.2.1. Spatial autocorrelation analysis
Before the spatial analysis, the global Moran’I index is selected to measure the spatial autocorrelation between the development of AI and regional carbon-emission. As can be seen the Table 3, there has been a significant positive correlation between AI and CEI in the geographical distance matrix. Therefore, it is necessary to further explore the relationship between the two.
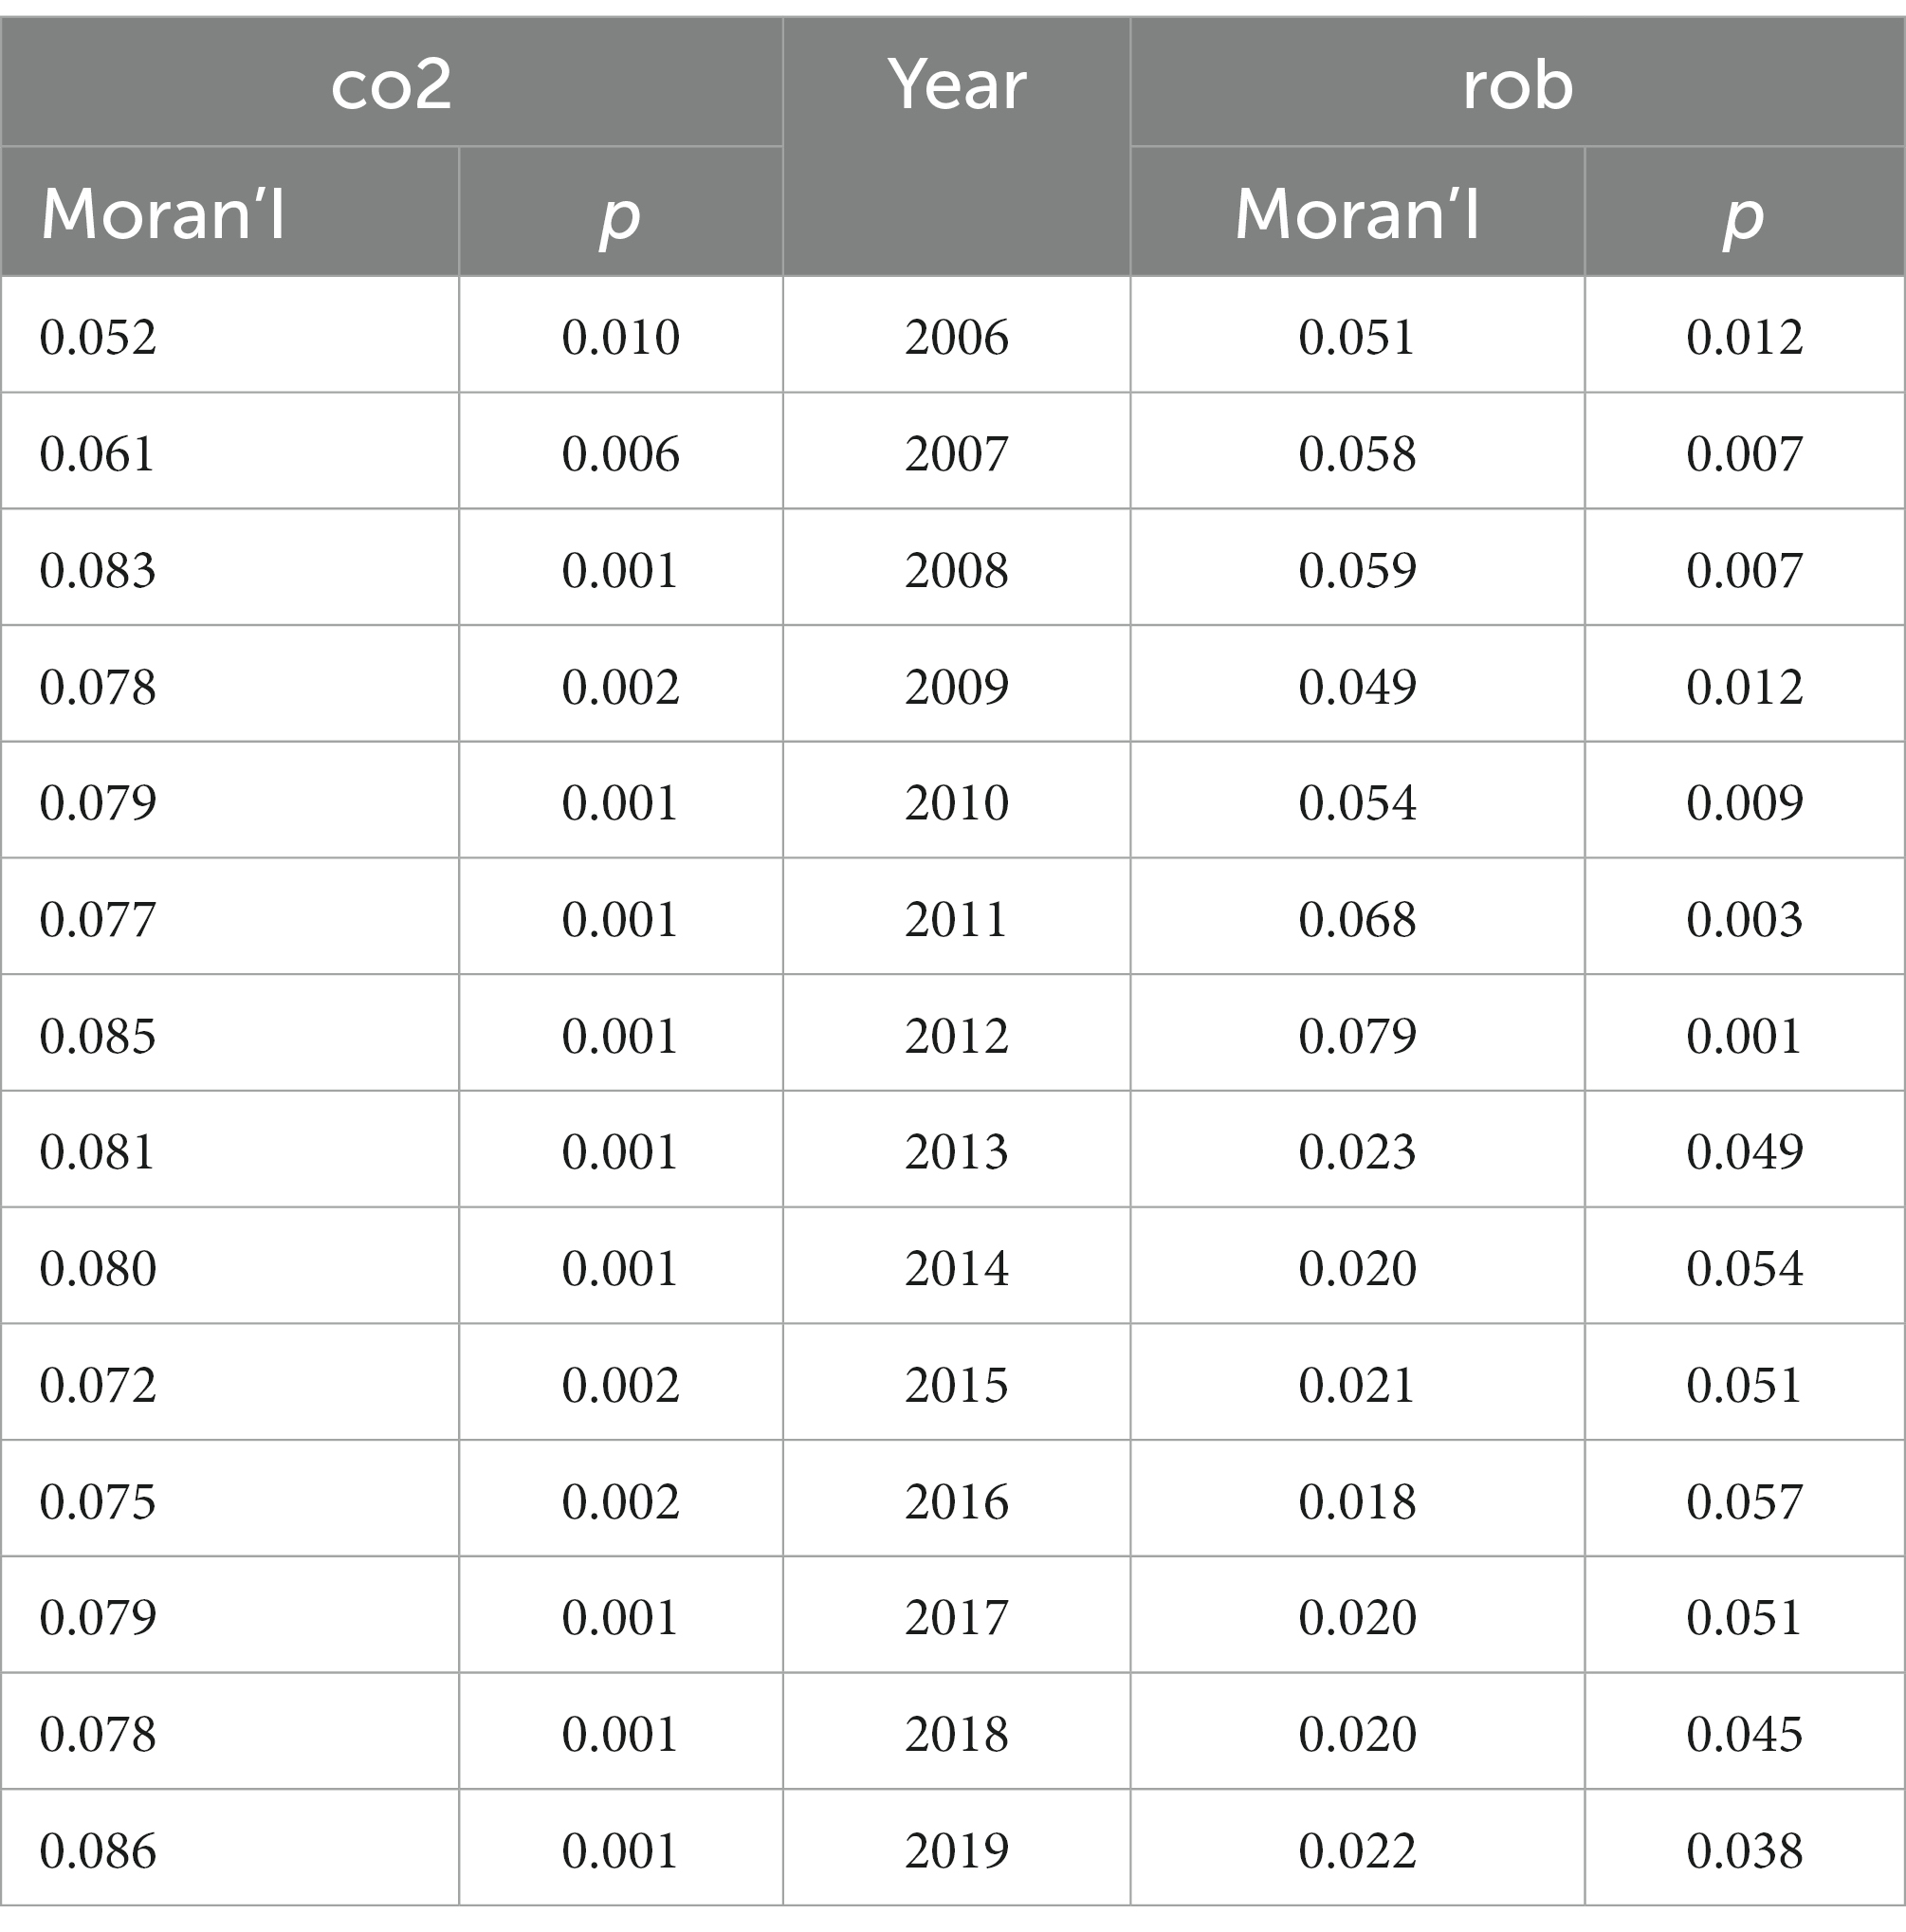
Table 3. Moran index.
4.2.2. Spatial econometric regression
In order to determine the specific form of the spatial metrology model, LM test, LR test, and Hausman test were carried out successively in this paper, and the results showed that the explained variable co passed the LM test. The LR test was continued, and the null hypothesis was significantly rejected, indicating that the spatial error model and the spatial lag model could be used only to investigate the spatial spillover effect of regional carbon emission intensity, so the spatial Dubin model was chosen. At the same time, in order to determine the specific form of the spatial Dubin model, the Hausman test is carried out, showing that the spatial and temporal dual fixed space Dubin model under fixed effects should be selected. In order to verify hypothesis 2, this paper conducts spatial Durbin regression on regional carbon-emission, and the regression results are shown in Table 4. As can be seen from Table 4, the estimated coefficients of both the primary term and the secondary term of artificial intelligence pass the significance test of 5% regardless of whether it is based on the geographical distance matrix or the economic geographical distance matrix, indicating that the development of artificial intelligence will significantly affect regional CEI on the basis of considering the spatial correlation [see column (1) of Table 4] or the economic geographic distance matrix [see column (2) of Table 4]. The coefficient of the primary term is positive, and the coefficient of the secondary term is negative, indicating that there is a significant inverted U-shaped relationship between the two, that is, with the deepening of the development of artificial intelligence, the spatial spillover effect of regional CEI presents a feature of first rising and then declining. There may be the main reasons for this phenomenon, in the early, has been heavily promoted by the development of artificial intelligence the expansion of related industries, so as to make the regional carbon emissions intensity ascend, technological progress although produce certain economic benefits, but has paid a huge price, so as to make the development of regional carbon emissions intensity of artificial intelligence in terms of space to promote the role; With the continuous deepening and skilled application of artificial intelligence technology, the diffusion effect and demonstration effect become prominent, and the environmental cost between different regions is minimized or even improved by the benefits brought by AI technology. Thus, the development of AI inhibits the spillover of CEI in the region. In general, China’s developed cities have entered the downward period of regional CEI caused by AI development, but most cities are still in the first half of the inverted “U” shaped curve and the AI development level is also low. Therefore, China’s AI development level should be further deepened.
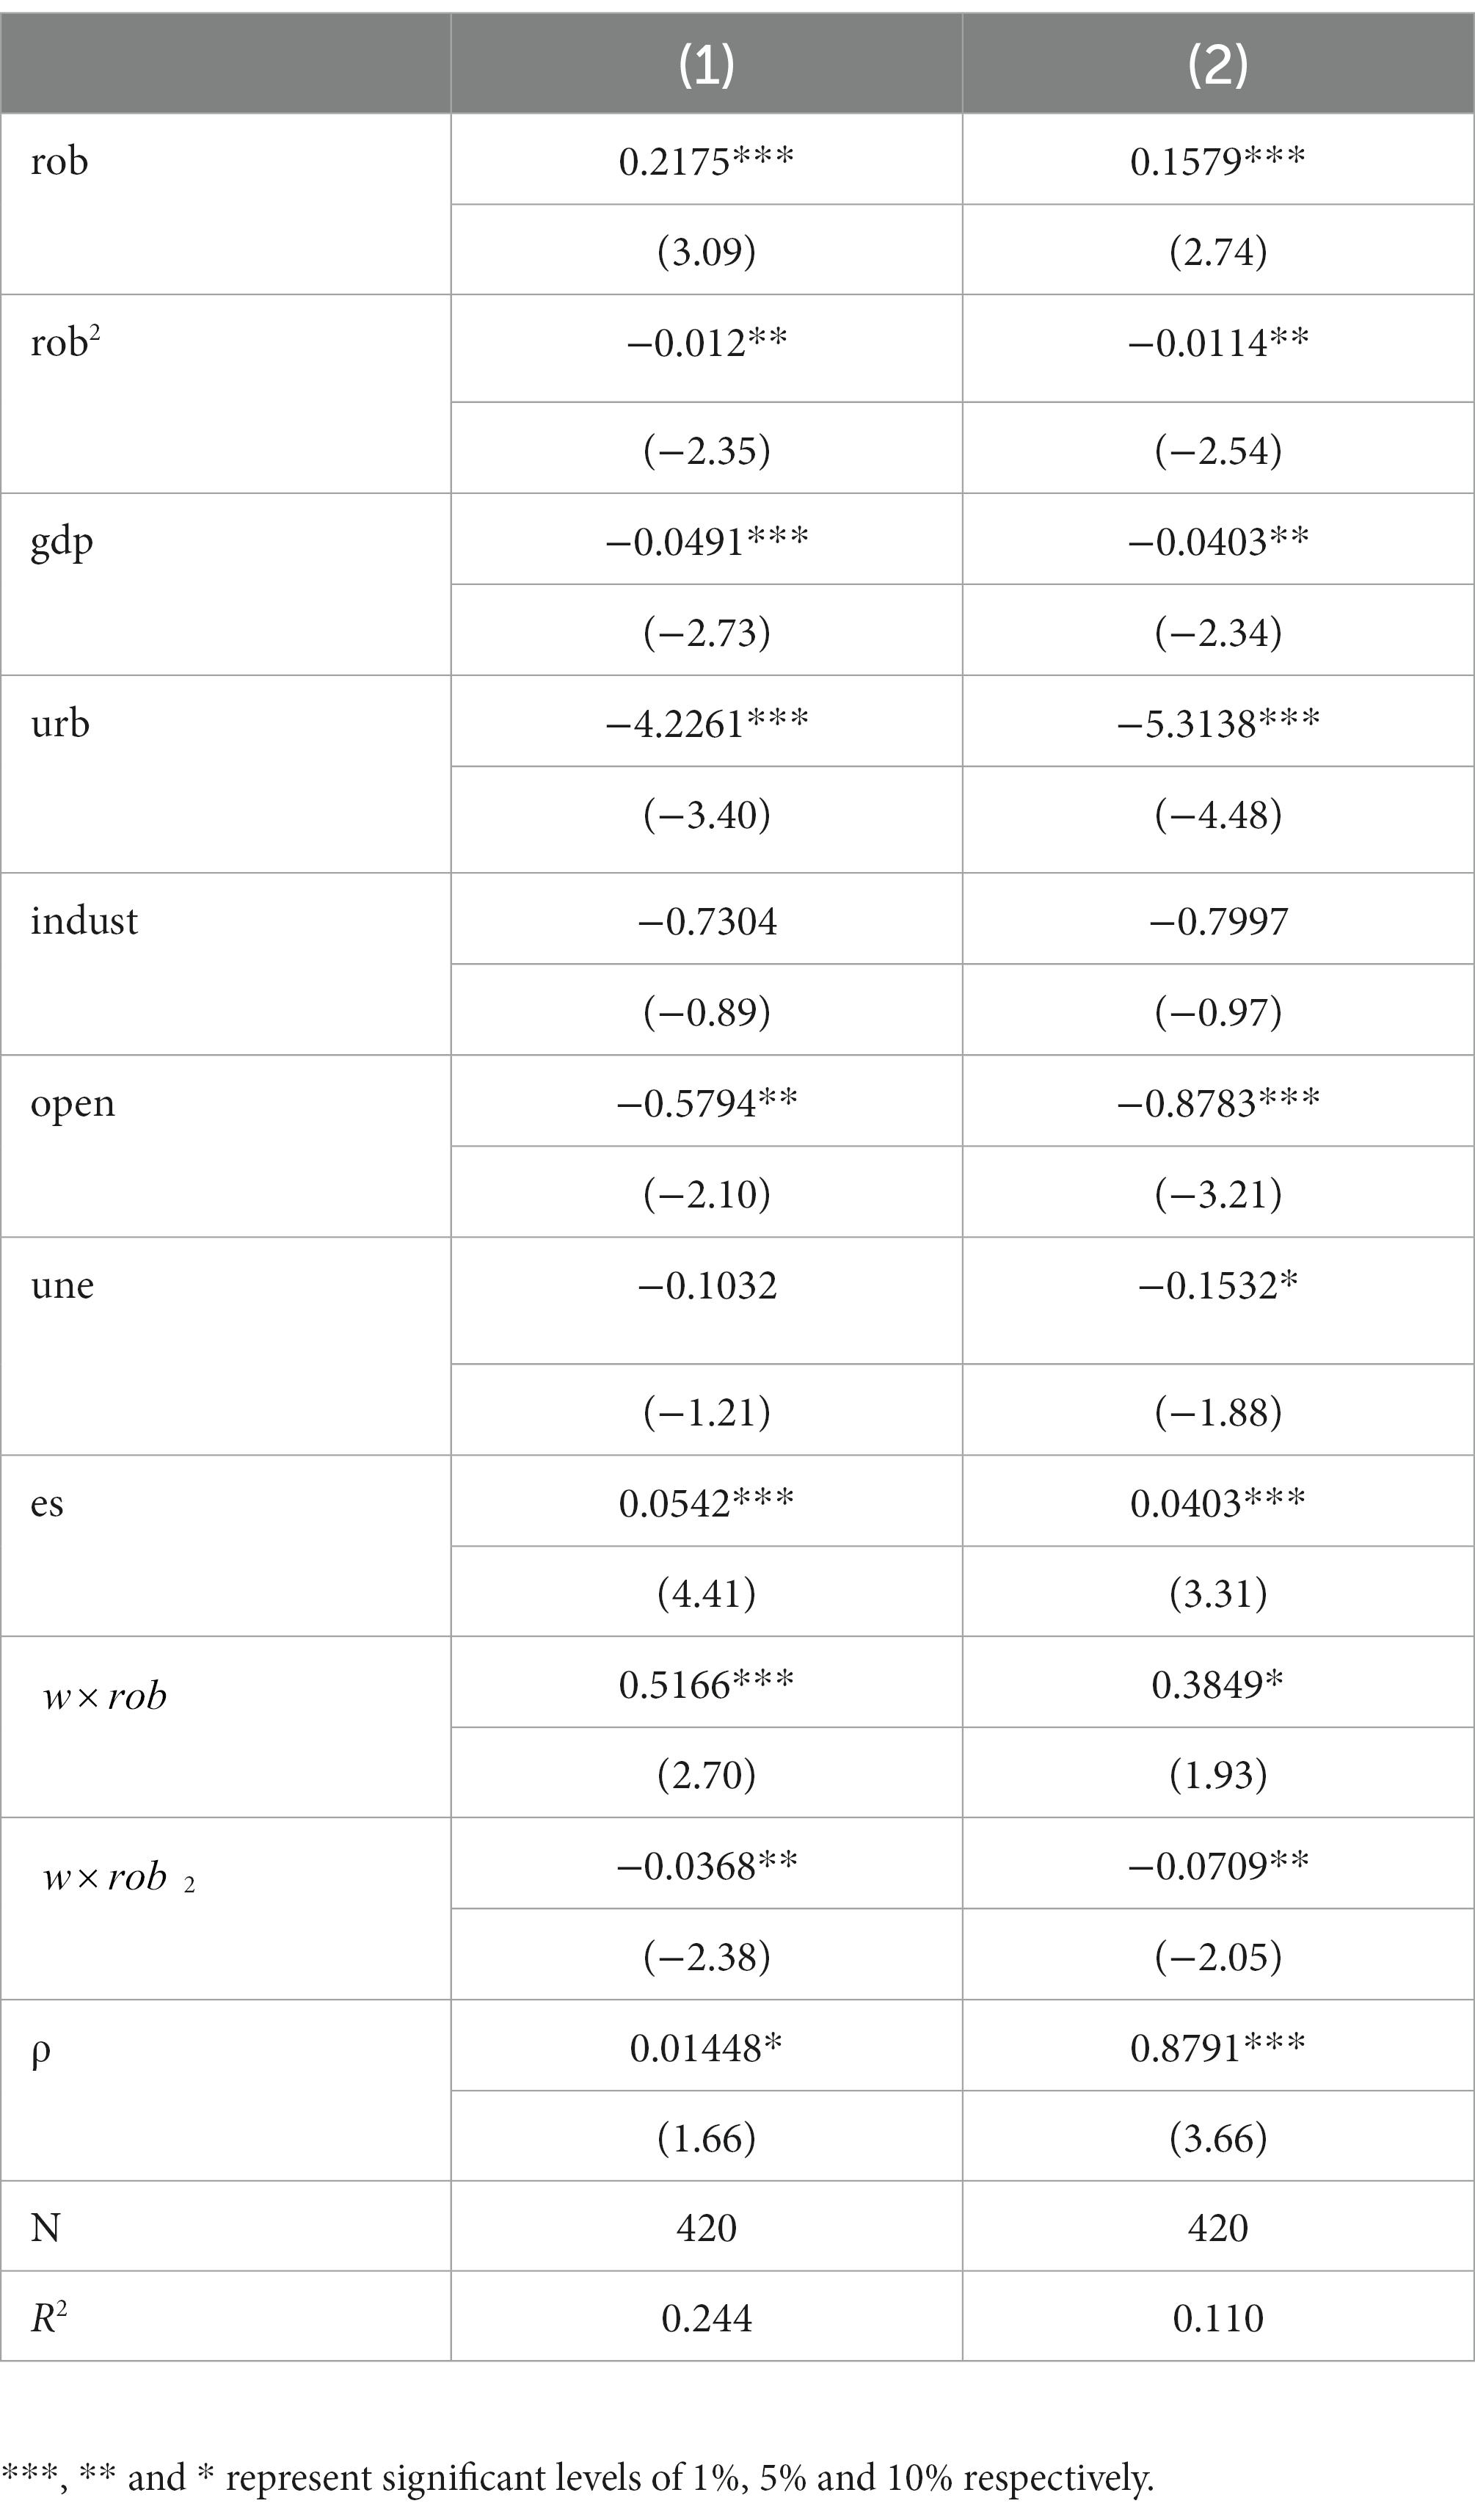
Table 4. Regression of spatial Durbin model.
4.3. Robustness test
4.3.1. Marginal effect test
Considering the sustainability of the development of AI, this paper makes a benchmark regression on the development level of AI after two periods of lag (Yang and Lu, 2023). The results are shown in columns (1) to (2) of Table 5. There is no significant difference in absolute value and significance between lag regression result and benchmark regression result, which indicates that the conclusion of benchmark regression is robust and reliable.
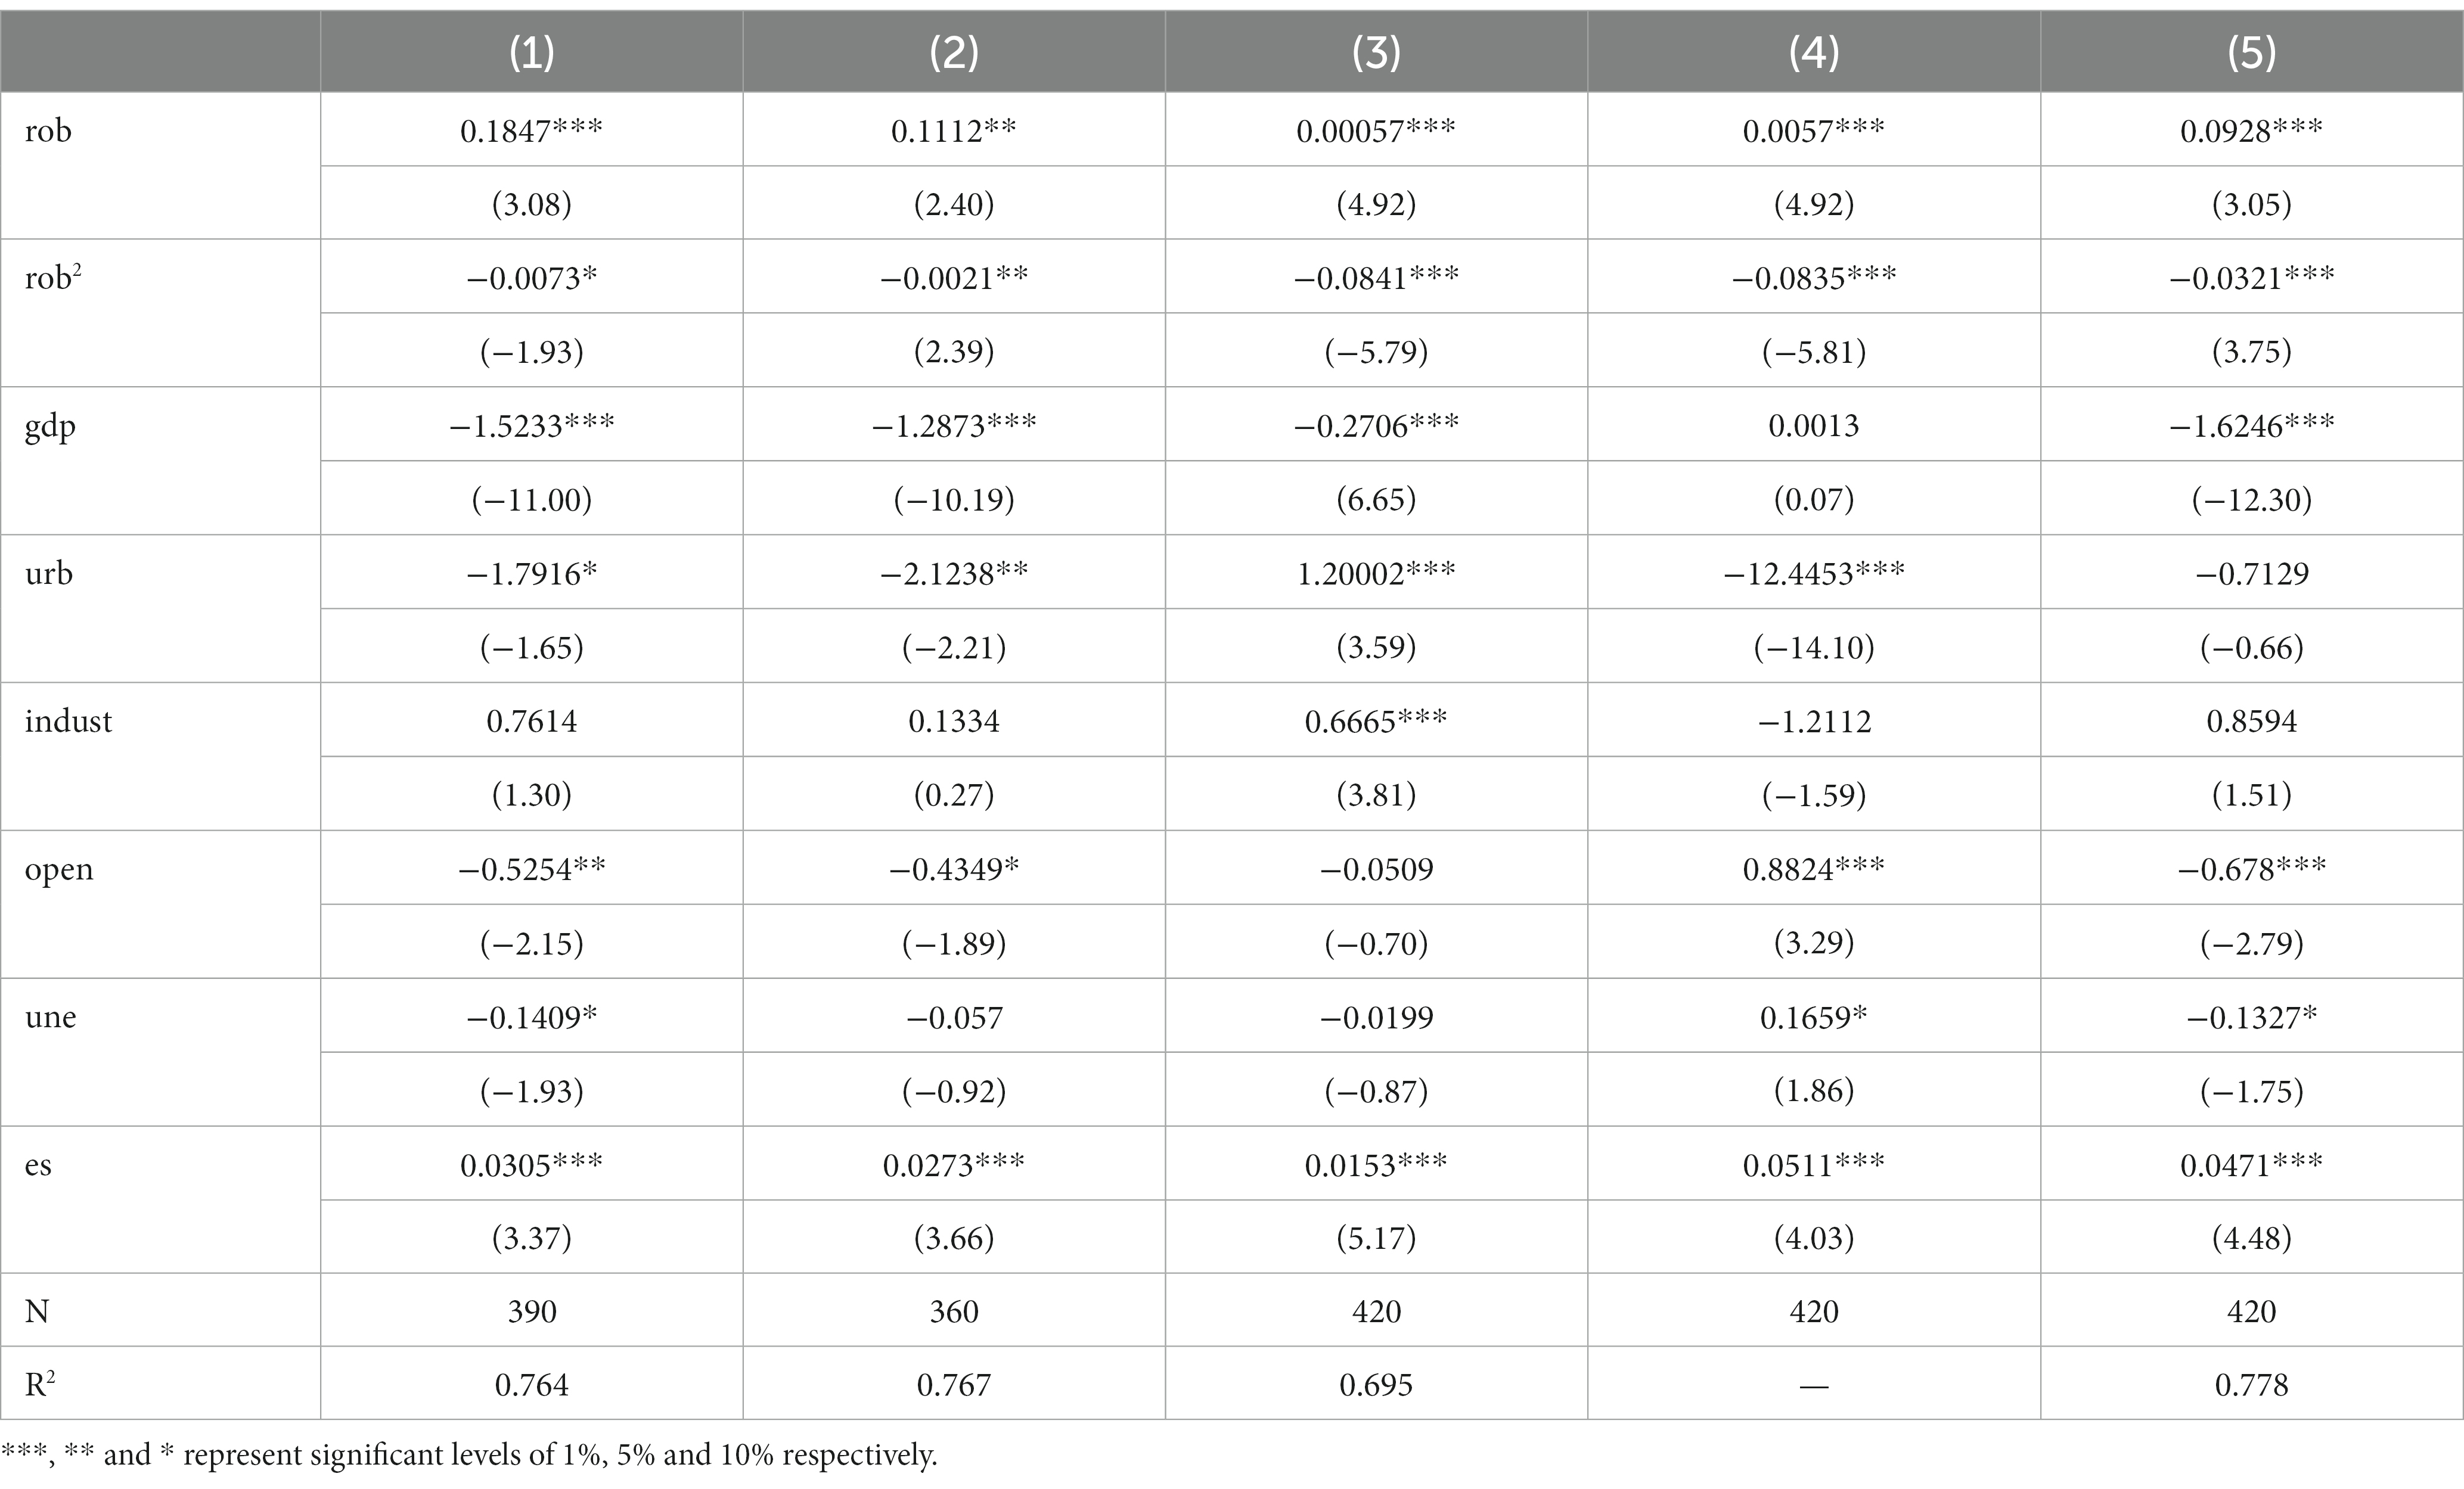
Table 5. Results of robustness test.
4.3.2. Replace the explained variable
In order to avoid the deviation of the regression results caused by the measurement method of CEI mentioned above, and ensure the reliability of the benchmark regression results, the CEI is expressed by logarithm of the total carbon-emission of each province by referring to the practice of Xue et al. (2022). According to column (3) of Table 5, the estimated coefficient of AI changes from positive to negative at the level of 1% when the explained variables are replaced, which indicates that the impact of the development of AI on CEI has changed from promoting to restraining.
4.3.3. Replace regression method
In order to prevent the measurement error of regression methods, random effect maximum likelihood estimation (MLE) is used for re-regression. From the regression results, the estimation coefficient of AI and its quadratic term is still from positive to negative, and it is significant at the level of 1%. Compared with the benchmark regression result, only the size of the coefficient is slightly different.
4.3.4. Tail shrinking treatment
In order to eliminate the influence of extreme values, all variables were subjected to 1% tailing and then fixed effect regression was performed again. The positive and negative sign of AI (0.0938) and its quadratic term (−0.0321) did not change and was still significant at 1% level.
4.3.5. Endogeneity
In the benchmark regression, variables affecting regional carbon emission intensity have been added to the model as much as possible, but omitted variables may still be unavoidable, resulting in endogeneity problems. Severe endogeneity will lead to biased and inconsistent estimated coefficients, so it is necessary to deal with the endogeneity problem that may exist in the benchmark regression results. Considering that the development of AI is sustainable, the application level of artificial intelligence in the previous period will have an impact on the current period, but will not have an impact on the disturbance term, so the lag phase of AI is taken as an instrumental variable in this paper. The specific methods of endogeneity test are as follows: first, instrumental variables are added to carry out two-stage least squares (2SLS) regression; The results of the Hausman test rejected the null hypothesis of “all explanatory variables are endogenous” at the significance level of 1%, indicating that the core explanatory variable artificial intelligence has endogeneity and meets the prerequisite of using the least squares method (2SLS). Third, the validity of instrumental variables is tested. The results show that the null hypothesis of “weak instrumental variables” is strongly rejected. According to the endogeneity test results in column (6) of Table 5, which takes the lag of one stage of artificial intelligence as an instrumental variable, the sign and significance level of the estimated coefficients between the regression results of the instrumental variable and the benchmark regression results have not changed, indicating that the benchmark regression results have strong robustness.
4.4. Heterogeneity analysis
China has the problem of unbalanced regional development during a long time. Although all regions attach great importance to the development of digital technology, there are still great differences in the development level of AI among different regions due to factors such as factor endowment, location factors and development foundation, which will cause regional heterogeneity of the impact of AI on regional carbon-emission. According to Table 6, this differential effect does exist, that is, in the eastern region, AI promotes and then suppresses the CEI, followed by the western region, but has no obvious effect in the central region. This situation can be considered from the following aspects: first, as the most developed region of China’s economy, various emerging technologies and products originate and spread here, with strong inclusiveness, high level of regional openness, government services and supervision, far ahead of the development and application of AI. Therefore, AI has the most significant effect on carbon reduction in eastern China. Second, in recent years, although the central region has a high latecomer potential, policy support and continuous transformation and upgrading of industrial structure have laid a solid foundation in the central region, the digital elements siphon seriously among the central regions, and a large number of manufacturing industries are still dominant, and the CEI is still large. Third, the western region is remote and sparsely populated. For many years, affected by geographical factors, industrial upgrading has not achieved significant results. However, AI has a great penetration in the region by virtue of its digital network foundation, and has a greater role in promoting the regional industrial upgrading, which makes the carbon-emission reduction of human intelligence achieve certain results.
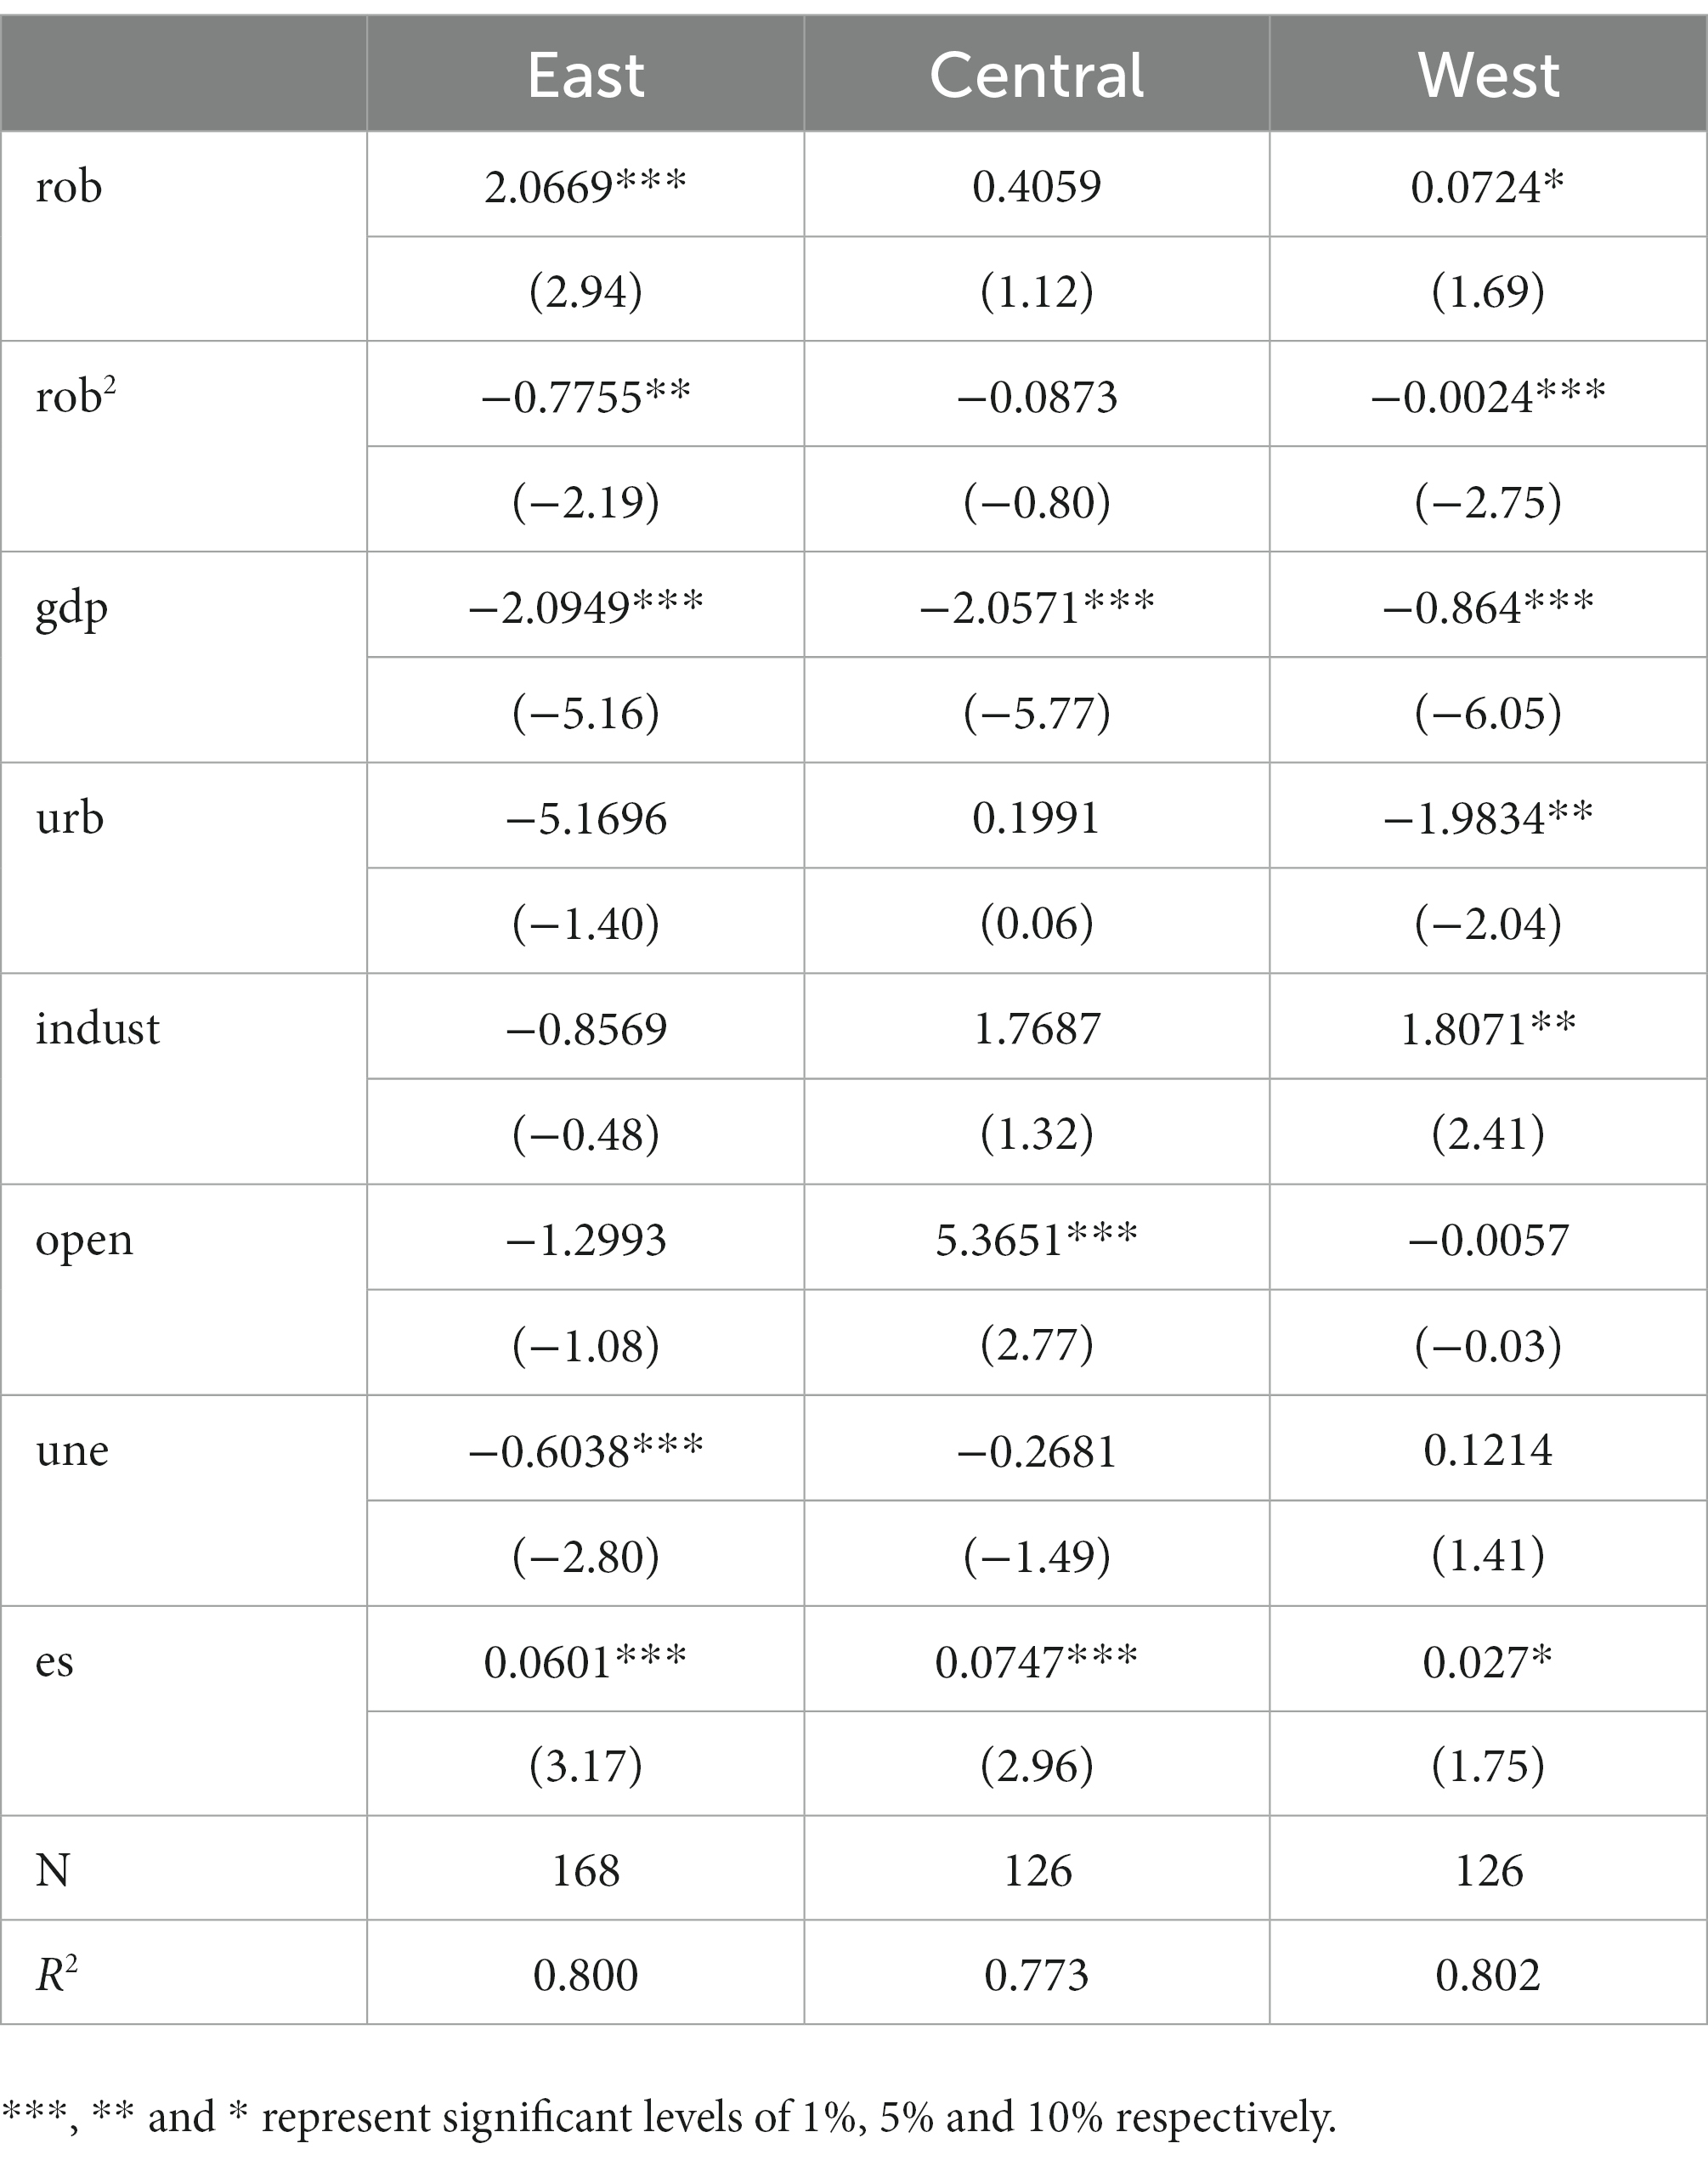
Table 6. Heterogeneity analysis.
5. Conclusion and countermeasures
5.1. Conclusion
Under the background of AI and carbon-emission in China, based on the benchmark of the impact and the panel data from 2006 to 2019, this paper analyzes the effect and mechanism of AI on CEI. Dynamic and marginal effect analysis, substitution variable, and regression method were used to test the robustness. The results show that: (1) there is a significant inverted U-shaped between AI and CEI, that is, with the deepening of the development of AI, CEI first increases and then decreases. (2) There is a significant spatial correlation between the development of AI and CEI in China. (3) AI has a significant spatial spillover effect on CEI of adjacent regions, and it shows an inverted U-shaped track—from promoting to restraining. (4) There are significant regional differences in the impact of AI on CEI. This series of studies helps the government to formulate more targeted AI development policies in sub-regions and periods, and effectively promote the implementation of low-carbon emission reduction strategies. And studying the spatial spillover effect of AI on carbon emission intensity can help localities pay attention to the coordination of related policies and promote coordinated and sustainable regional development.
5.2. Policy implications
So far, the development of AI has penetrated into all aspects of social life. Intelligence in the field of economic life and industrial mechanization have become the main development direction in the future, and the new technology has played a significant role in energy utilization. Based on the empirical research results, this paper draws the following theoretical implications:
1. Strengthen the foundation of AI and improve the emission reduction effect of AI. Promote a new generation for information infrastructure, accelerate the realization of higher-quality interconnection. Provide solid information technology infrastructure support for the development of AI, release and enlarge the dividend of the machine age in a broader range, and combine with the governance mode to realize the coverage penetration of intelligent equipment and communication platform. So that can promote efficiency change and reduce the consumption of manufacturing resources (Zhang and Zhou, 2019).
2. Give full play to the carbon reduction effect of AI in China. In the early stage of the development of AI, the popularization is not only difficult to inhibit carbon-emission, but also may cause the intensity of carbon-emission to increase. Therefore, on the one hand, it is necessary to strengthen the research and development of key technologies of AI, especially in the field of green and low-carbon R&D, to promote the deep integration of AI and green low-carbon industry (Wang et al., 2021). On the other hand, we should improve the energy consumption assessment system of new infrastructure such as AI and digital center, carry out the evaluation and construction of green data center, strengthen the research and development of key technologies of zero-carbon data center, and optimize the energy efficiency scheme of low-carbon data center.
3. Break the space barrier, pay attention to the spillover effect of AI development. We should give full play to the structural optimization effect, technological innovation, and resource allocation of AI on social production and life, seize the positive spatial correlation, and reduce CEI.
4. We should face up to the differences in regional development and implement heterogeneous governance strategies (Zhuang, 2021). In the central region, we should accelerate the transformation of energy consumption structure. For the eastern region, AI should be used to carry out low-carbon, digital and intelligent transformation of modern industrial chain to improve the level of green industrial development. After crossing the turning point of carbon-emission reduction, the low-carbon technology should be combined with regional development. In the western region, it is necessary to maximize the use of AI to modernize traditional industries.
5.3. Deficiencies and prospects
This paper has the following shortcomings: ① Due to the lack of micro-enterprise level for AI application data, it is not able to comprehensively and multi-perspective study the impact of AI development on CEI; ② Due to the limitation of data availability and utilization, this paper only uses the data of provincial level in China for empirical analysis, and the research conclusion may have some limitations; ③ The influence of population aging, government behavior, and other variables on AI and carbon-emission behavior is not comprehensively considered. Therefore, in the future, both micro and international aspects should be taken into account to explore the carbon-emission reduction effect, and refine the combined research of energy structure and industrial structure.
Data availability statement
The original contributions presented in the study are included in the article/supplementary material, further inquiries can be directed to the corresponding author.
Ethics statement
The studies were reviewed and approved by School of Investment and Construction Management, Dongbei University of Finance and Economics, School of Land Science and Technology, China University of Geosciences, and School of Business, Wenzhou University. The participants provided their written informed consent to participate in this study.
Author contributions
HD is responsible for the design of article research methods and writing. MD is responsible for article data analysis. XZ is responsible for data collation. YZ is responsible for completion of revision of the paper. All authors contributed to the article and approved the submitted version.
Funding
This work was supported by the projects of Liaoning Provincial Education Department Basic Research Project of China (Grant no. LJKR0574).
Acknowledgments
The authors thank the reviewers whose comments and suggestions helped improve this manuscript.
Conflict of interest
The authors declare that the research was conducted in the absence of any commercial or financial relationships that could be construed as a potential conflict of interest.
Publisher’s note
All claims expressed in this article are solely those of the authors and do not necessarily represent those of their affiliated organizations, or those of the publisher, the editors and the reviewers. Any product that may be evaluated in this article, or claim that may be made by its manufacturer, is not guaranteed or endorsed by the publisher.
References
Acemoglu, D., and Restrepo, P. (2018). The race between man and machine: implications of technology for growth, factor shares, and employment [J]. Am. Econ. Rev. 108, 1488–1542. doi: 10.1257/aer.20160696
Acemoglu, D., and Restrepo, P. (2020). Robots and jobs: evidence from U. S labor market. J. Polit. Econ. 128, 2188–2244. doi: 10.1086/705716
Al-Ghandoor, A. (2010). Decomposition analysis of electricity use in the Jordanian industrial sector. Int. J. Sustain. Energy 29, 233–244. doi: 10.1080/14786461003782724
Amiri, S. S., Mottahedi, S., Lee, E. R., and Simi, H. (2021). Peeking inside the black-box: explainable machine learning applied to household transportation energy consumption. Comput. Environ. Urban. Syst. 88:101647. doi: 10.1016/j.compenvurbsys.2021.101647
Batty, M. (2018). Artificial intelligence and smart cities. Environ. Plan. B Urban Analy. City Sci. 43, 3–6. doi: 10.1177/0265813515619858
Bhujabal, P., Sethi, N., and Padhan, P. C. (2021). ICT, foreign direct investment and environmental pollution in major Asia Pacific countries. Environ. Sci. Pollut. Res. 5, 1–12. doi: 10.1007/s11356-021-13619-w
Cheng, H., Jia, R. L., Li, D., and Li, H. (2019). The rise of robots in China. J. Econ. Perspect. 33, 71–88. doi: 10.1257/jep.33.2.71
de Bézenac, E., Pajot, A., and Gallinari, P. (2019). Deep learning for physical processes: incorporating prior scientific knowledge. J. Stat. Mech. Theory Exp. 2019:124009. doi: 10.1088/1742-5468/ab3195
Guo, F., Wang, C., and Zhang, S. (2021). Cluster analysis of the trend of urban carbon peaking in China. Chin. Environ. Manag. 73, 40–48. doi: 10.16868/j.cnki.1674-6252.2021.01.040
Hamdi, H., Sbia, R., and Shahbaz, M. (2014). The nexus between electricity consumption and economic growth in Bahrain. Econ. Model. 38, 227–237. doi: 10.1016/j.econmod.2013.12.012
Haseeb, A., Xia, E., Saud, S., Ahmad, A., and Khurshid, H. (2019). Does information and communication technologies improve environmental quality in the era of globalization? An empirical analysis. Environ. Sci. Pollut. Res. 26, 8594–8608. doi: 10.1007/s11356-019-04296-x
Henderson, P, Hu, J, Romoff, J, Brunskill, E, Jurafsky, D, and Pineau, J Towards the systematic reporting of the energy and carbon footprints of machine learning. Working Paper. (2020).
Jia, R., Shao, S., and Yang, L. (2021). High-speed rail and CO2 emissions in urban China: a spatial difference-in-differences approach. Energy Econ. 99:105271. doi: 10.1016/j.eneco.2021.105271
Lee, S., and Lee, B. (2014). The influence of urban form on GHG emissions in the US household sector. Energy Policy 68, 534–549. doi: 10.1016/j.enpol.2014.01.024
Li, J., Huang, X., Sun, S., and Chuai, X. (2019). Spatial and temporal coupling analysis of CO2 emissions from urban land and energy consumption in the Yangtze River Delta. Geogr. Res. 38, 2188–2201. doi: 10.16868/j.cnki.1674-6252.2019.06.038
Lin, G., Long, Z., and Wu, M. (2005). Empirical analysis of regional economic convergence: 1978-2002. Economics S1, 67–82.
Liu, R., and Chen, H. (2021). Study on urban spatial expansion and growth boundary of Hangzhou based on ANN-CA. Resour. Environ. Yangtze Basin 30, 1298–1307. doi: 10.11870/cjlyzyyhj202106002
Liu, P., Zhang, L., and Dong, H. (2022). Spatial and temporal evolution of carbon emission intensity in Beijing-Tianjin-Hebei and its neighboring "2+26" cities and its influencing factors. Environment 44, 772–776+810. doi: 10.15985/j.cnki.1001-3865.2022.06.014
Lu, T., Zhu, Z., and Liu, C. (2022). Artificial intelligence, the transformation of population structure and the change of labor income share. J. Guangdong Univ. Fin. Econ. 37, 4–17.
Milojevic-Dupont, N., and Creutzig, F. (2021). Machine learning for geographically differentiated climate change mitigation in urban areas. Sustain. Cities Soc. 64:102526. doi: 10.1016/j.scs.2020.102526
Pan, H., Page, J., Zhang, L., Cong, C., Ferreira, C., Jonsson, E., et al. (2020). Understanding interactions between urban development policies and GHG emissions: a case study in Stockholm region. Ambio 49, 1313–1327. doi: 10.1007/s13280-019-01290-y
Salahuddin, M., and Alam, K. (2015). Internet usage, electricity consumption and economic growth in Australia: a time series evidence. Telematics Inform. 32, 862–878. doi: 10.1016/j.tele.2015.04.011
Shobande, O. A. (2021). Decomposing the persistent and transitory effect of information and communication technology on environmental impacts assessment in Africa: evidence from Mundlak specification. Sustain. For. 13:4683. doi: 10.3390/su13094683
Strubell, E, Ganesh, A, and Mccallum, A. “Energy and policy considerations for deep learning in NLP.” in 57th Annual Meeting of the Association for Computation al Linguistics. (2019).
Wang, S., Lianhong, L., and Qiu, Z. (2021). Path of low-cost carbon peaking and carbon neutrality in China based on multi-objective model. Res. Environ. Sci. 34, 2044–2055. doi: 10.13198/j.issn.1001-6929.2021.06.18
Xu, B., Chen, Y., and Shen, X. (2019). Clean energy development, CO2 emission reduction and regional economic growth. Econ. Res. J. 54, 188–202.
Xu, W., Zhou, J., and Liu, C. (2022). Spatial effects of digital economy on urban carbon emissions. Geogr. Res. 41, 111–129. doi: 10.11821/dlyj020210459
Xu, Z., Zuo, S., and Ding, S. (2021). Carbon peaking and carbon neutrality enabling high-quality development: internal logic and implementation path. De Economist 11, 62–71. doi: 10.16158/j.cnki.51-1312/f.2021.11.008
Xue, F., Liu, J., and Fu, Y. (2022). Impact of artificial intelligence technology on carbon emission. Sci. Technol. Progress Countermeas. 39, 1–9. doi: 10.6049/kjjbdc.202203149
Yang, T. (2021). Urban planning and design decision under the background of multi-source data: urban system model and application of artificial intelligence technology. Int. Urban Plan. 36, 1–6. doi: 10.19830/j.uPI.2021.034
Yang, R., and Lu, Y. (2023). Research on the impact of artificial intelligence on the high-quality development of manufacturing industry. East China Econ. Manag. 37, 65–76. doi: 10.19629/j.cnki.34-1014/f.221017003
Yu, X., Chen, N., and Li, M. (2020). Study on carbon emission characteristics and emission reduction paths of low-carbon pilot cities in China. China Popul. Resour. Environ. 30, 1–9. doi: 10.12062/cpre.20200436
Yu, B., and Su, Y. (2022). How does land finance affect land use efficiency? Dynamic spatial Dubin model test from the perspective of scale and technology. Geogr. Res. 41, 527–545. doi: 10.11821/dlyj020210006
Zhang, Y. X., Luo, H. L., and Wang, C. (2020). Analysis of international trend of carbon neutrality action. Adv. Clim. Chang. Res. 17, 88–97. doi: 10.12006/j.issn.1673-1719.2020.241
Zhang, W., and Zhou, F. (2019). Analysis of environmental governance reform and countermeasures in the context of artificial intelligence. Sociol. Sci. 1, 23–30. doi: 10.13644/j.cnki.cn31-1112.2019.07.003
Keywords: AI, carbon-emission, spatial spillover effect, spatial Durbin model, energy conservation
Citation: Du M, Zhang Y, Dong H and Zhou X (2023) Heterogeneous impact of artificial intelligence on carbon emission intensity: Empirical test based on provincial panel data in China. Front. Ecol. Evol. 11:1058505. doi: 10.3389/fevo.2023.1058505
Edited by:
Rita Yi Man Li, Hong Kong Shue Yan University, Hong Kong SAR, ChinaReviewed by:
Yulan Lv, Shandong University of Finance and Economics, ChinaXin Zhao, Anhui University of Finance and Economics, China
Copyright © 2023 Du, Zhang, Dong and Zhou. This is an open-access article distributed under the terms of the Creative Commons Attribution License (CC BY). The use, distribution or reproduction in other forums is permitted, provided the original author(s) and the copyright owner(s) are credited and that the original publication in this journal is cited, in accordance with accepted academic practice. No use, distribution or reproduction is permitted which does not comply with these terms.
*Correspondence: Xiangjun Zhou, REJVbml2ZXJzaXR5RmluRWNvQG91dGxvb2suY29t