 Zoë Lindo
 Thomas Bolger
 Tancredi Caruso
- 1Department of Biology, The University of Western Ontario, London, ON, Canada
- 2School of Biology and Environmental Science, University College Dublin, Dublin, Ireland
- 3Earth Institute, University College Dublin, Dublin, Ireland
Ecologists are increasingly recognizing the importance of stochastic processes in generating spatial and temporal variation in biological communities. This variation is very high in soil, which hosts not <¼ of all biodiversity on Earth and is central to how terrestrial ecosystems respond to perturbations. Measurement errors, demographic stochasticity (individual variability in traits such as birth and death rates), and environmental stochasticity (fluctuations in environmental properties) are the three main sources of stochasticity in ecology. Here, we synthesize how these three sources of stochasticity are quantified and incorporated in the study of soil biodiversity, highlighting current limits, possible solutions, and future research needs. We stress the relevance of all these factors to our future understanding of terrestrial ecosystems via plant-soil and soil-climate interactions and feedbacks. In soil, measurement errors are due to the small size, high abundance, and broad distributions of soil organisms, which limit sampling in space and especially over time. We argue that positive autocorrelation is a main characteristic of soil environmental properties, which may have important consequences on the response of soil biota to perturbations. At a local scale, large populations of soil organisms also imply a minor role of demographic stochasticity. Despite demographic stochasticity being a less significant source of variability than environmental stochasticity, we show that demographic stochasticity can be sizeable, but that within soil systems, stochasticity of environmental conditions must be accounted for. Explicit consideration of stochastic processes in soil biodiversity research is essential to our future understanding of the processes that control soil biodiversity. In classical ecology, stochasticity implies probabilistic predictions in terms of population growth, extinction, species coexistence, and community diversity. In soil, stochasticity implies very variable responses to climate change and the soil-climate feedback. Future studies will have to identify the major sources of environmental stochasticity with a particular focus on the interaction between multiple global change factors.
1. Introduction
Individuals, populations, and ecological communities display very large variability over space and time. Since a fully deterministic description of all the factors that control this variability is not feasible, ecologists have developed a large number of models that explicitly incorporate stochastic processes in modeling this variability (May, 1973; Caswell, 2000; Lande et al., 2003; Vellend, 2010). Shoemaker et al. (2020) have recently clarified many of the misconceptions and confusions on stochastic processes in ecology, highlighting the importance of an integrative framework to make the study of ecological communities more robust and predictive. In fact, a major misconception is that stochastic approaches imply uncertainty and unpredictability while, instead, they simply imply that predictions are probabilistic, and that there are different sources of variance that contribute to the outcome of an ecological process. Stochastic ecological processes can thus be quantified in terms of probability distributions and expectations (Lande et al., 2003). In other words, models that incorporate stochastic processes make “the unpredictable” predictable, if we accept that most predictions in ecology will be of a probabilistic nature. There is a misconception that a stochastic process implies total ignorance of a process, which is rarely the case. In most cases, there is information available to us that allows for predictions while calculating some degree of uncertainty around the mean. More generally, modeling a process using a stochastic approach does not mean that the process is intrinsically random and has no deterministic causes. Rather that the complexity of the factors that determine the trajectory of the measured variables is so high that a probability description of the possible trajectories is tractable while a deterministic one is not (Karlin and Taylor, 1975).
Soil is one of the most variable and diverse components in terrestrial ecosystem and hosts not <¼ of all biodiversity on earth (Bardgett and Van der Putten, 2014; FAO, 2020). The variability of soil biodiversity over space and time is enormous and observed from very small (a few mm) to global scales (e.g., Ettema and Wardle, 2002; Bardgett et al., 2005; Delgado-Baquerizo et al., 2018; Phillips et al., 2019; White et al., 2020; Caruso and Bardgett, 2021). Many studies have clarified the roles of the abiotic and biotic factors that control the distribution of soil organisms from global (Delgado-Baquerizo et al., 2018; Phillips et al., 2019; Van Den Hoogen et al., 2019) to intermediate and local scales (Lindo and Winchester, 2009; Caruso et al., 2019). But the abiotic and biotic factors that control soil organism distribution, and the ecosystem functions that these organisms mediate, vary over space and time, and stochastic processes offer the quantitative framework to link fluctuations in abiotic and biotic factors to variation in population and communities (Lande et al., 2003). This is particularly important for soil communities, that are central to ecosystem functioning, especially biogeochemical cycles (Bardgett and Wardle, 2010; Crowther et al., 2019), which are connected via plants and the atmosphere to global climate change dynamics (Bardgett et al., 2008), and are subjected to a complex interaction of multiple global change factors (e.g., warming, changes in soil moisture, nitrogen deposition) (Rillig et al., 2019; Bardgett and Caruso, 2020). Interactions with multiple factors imply important temporal and spatial fluctuations in populations, biomass, microbial and faunal traits, and biological rates, including energy fluxes. Given that a fully deterministic description of all these interactions is not feasible, we argue that stochastic approaches offer a solution to conceptualize and model this complexity. We thus offer a synthesis and perspective on how stochastic processes have been considered in past soil biodiversity research, highlighting some important aspects of the state-the-of-the-art, current limitations in terms of data availability, and solutions that will boost, in our view, a deeper understanding of the response of terrestrial ecosystems to environmental variation and perturbation regimes.
2. Sources of stochasticity in soil biodiversity
Over the last 15 years, the factors and processes that structure soil biodiversity have been studied intensively and over multiple spatial scales. For example there have been some general literature reviews and synthesis papers on different biodiversity theory and methods as applied to soil biota (e.g., Vályi et al., 2016; Thakur et al., 2020; White et al., 2020), large scale studies investigating the factors that control the distribution of soil organisms (e.g., Delgado-Baquerizo et al., 2018; Crowther et al., 2019; Phillips et al., 2019; Tedersoo et al., 2022), and studies that have tested the predictions of competing community assembly models (e.g., Lekberg et al., 2007, 2011; Lindo and Winchester, 2009; Dumbrell et al., 2010; Caruso et al., 2011, 2012). Much of this work was meta-analyzed by Guerra et al. (2020). In many of these studies, and also as recently summarized in Vályi et al. (2016), Thakur et al. (2020), and White et al. (2020), there is a relatively large proportion of the variance in the data that cannot be attributed to the factors analyzed. There is typically variance observed in the abundance of organisms, but also in relative species abundance and species composition, as well as in ecosystem functions (for example, total soil respiration). Much of this variance is typically spatial because most studies have focused on the spatial dimension, and time series of soil biota are rare. Caruso et al. (2020) recently reviewed the literature for soil animals and highlighted the rarity of time series for soil biota. For example, in the BioTIME database (Dornelas et al., 2018) the only time series for soil organisms are the two we recently submitted.
Depending on the specific context of the different research, various authors have offered multiple explanations on the sources underlying this “unexplained” variance, but in general there are three main sources in ecology (Figure 1): measurement errors, environmental, and demographic stochasticity (Shoemaker et al., 2020). The term “unexplained” is thus not really appropriate in our view, because the sources of variances are known, but what it is not known are their relative contributions.
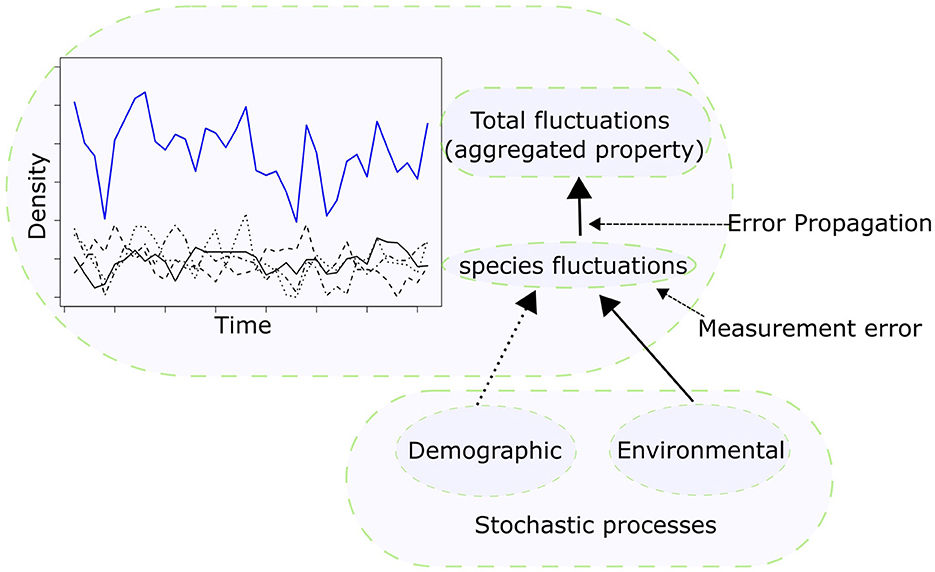
Figure 1. Stochastic processes affect population fluctuations (black lines of different types), and so species intraspecific and interspecific interaction and eventually fluctuations in any properties emerging from these interactions (for example, the simple total density as the sum of individual species density, blue solid line). The two key types of stochastic processes are demographic stochasticity and environmental stochasticity. A third source of variance is measurement errors, which propagates when variable measured with uncertainty (species fluctuation) are combined into an aggregated properties (for example, total sum of species densities).
2.1. Measurement errors
The process of measurement in science is best modeled using probability distributions, given that measurements are subjected to a myriad of sources of error that together affect the accuracy and precision of measurements (Taylor, 1997). In this sense, measurement errors can be measured and accounted for (e.g., through instrument calibration, detection limits), such that, in principle we should always be able to quantify them. In ecology, at a theoretical level, measurement errors are perhaps the least interesting source of stochastic variation, but in soil research this type of error represents an important source of variance for two reasons: firstly, soil biota are very small sized and patchily distributed from local to broad scales (Ettema and Wardle, 2002), meaning the sampling regime should be very intense at multiple scales in order to provide precise estimates of ecological variables such as population density and biomass; secondly, basically all taxonomic groups in soil are sampled destructively, meaning that repeated measurements on the “same object” are not possible, and that measurements at one particular spatial scale must be based on either a composite sample from multiple samples or technical replicates later pooled or averaged to represent the community at the chosen spatial scale (Caruso and Bardgett, 2021). While this is well-known in the practice of soil ecology, we propose that there are also other sources of measurement errors that are underestimated in soil biodiversity research, and that soil ecologists and ecologists in general, rarely apply the rules of error propagation in their estimates of measurement errors. In ecology this topic has been considered explicitly only in a few works mostly related to the estimate of the biomass of plants (Deutschman et al., 1999; Lo, 2005; Molto et al., 2013).
We propose that there are two major areas where error propagation can become an important approach to estimating the contribution of measurement error to the total variance observed in soil ecological systems. One is the estimate of population biomass, which is usually based on compounding information on body size with information on population density (Turnbull et al., 2014). The other is the related estimate of energy fluxes (e.g., Potapov et al., 2016) that is based on the allometric scaling of metabolism with body size and temperature. This latter case is particularly important, given that an energetic description of soil food webs potentially allows the estimation of matter fluxes and so, for example, rates of CO2 emissions (Moore and de Ruiter, 2012). In energetic food webs estimated through allometric metabolic scaling (Barnes et al., 2018), the total metabolic loss of a trophic species is the sum of the losses of each individual within that species population. The metabolic loss I of one individual of biomass M is typically estimated with an equation of the type: I∝Mb. There is a measurement error σM in M, which is often due to estimating individual biomass M by body size, with uncertainty both in length measurements and the parameters that link body size to body dry or wet weight. But, even more fundamentally, there is also uncertainty in the scaling exponent b. The exact value of the scaling exponent, and the implication of this value, have been a subject to heated discussion in the more general debate on the metabolic scaling theory of ecology (Enquist et al., 2003; Brown et al., 2004; Makarieva et al., 2006, 2008; Glazier, 2010). Regardless of the different theories and predictions on the exact value of the scaling exponent, experimentally there is a well-known systematic variation in the scaling exponent, which varies between taxa and phylogenetic lineages (Ehnes et al., 2011). For example, Ehnes et al. (2011) estimated (mean ± SE) b as 0.68 (± 0.4) for oribatid mites and 0.69 (± 0.09) for mesostigmatid mites. Our point is that the experimental error σb around b as well as the error σM around M are both needed to assess the measurement error of I, which is a combination of the two errors.
This can be demonstrated through an equation of the type I∝Mb to estimate I, given uncertainty σb and σM in b and M, respectively. From error propagation theory (Taylor, 1997), the uncertainty in I would then be under the assumption that there is no correlation in the error structure of M and b. If there was some non-negligible correlation between the two measurements, one more term should be added to the error of I, with the general effect of further increasing measurement uncertainty. Even more, usually the general equation used to estimate I is where k is the Boltzman constant, T is temperature, E activation energy, and i0 is a taxon-specific constant. The latter two parameters (E and i0) are estimated experimentally with some errors, which should also be incorporated in the estimate of σI. Given that the Ij of each individual j is estimated with an error σI, and that the total metabolism of a trophic species is the sum of all individual metabolisms, that is Itot =j, the error of Itot will be obtained by propagating the errors from the sum of all Ij. That would simply be σtot = ∑σI assuming no correlation between the measurements of the metabolic loss of each individual (a correlation would further increase the combined error for the total).
These estimates of individual biomass based on allometric scaling become compound errors with calculations into population level biomass, which are then used in calculations of flux in food web models. The estimate of the energy fluxes between two trophic species finally requires the knowledge of other coefficients, which express the efficiency of energetic transfers between trophic levels. Arguably, these coefficients are known with some errors and the errors should thus propagate to the estimate of the energy flux together with the error of the metabolic loss. All these errors are rarely, if ever, taken into account, and are (implicitly) assumed to be negligible (Barnes et al., 2014, 2018; Potapov et al., 2019, 2021), or are not taken into account (Gauzens et al., 2019). Similar issues apply to conversions from abundance to biomass data, assignment of species into trophic groups (see Buchkowski and Lindo, 2021), extrapolation of density data across scales, and in general any conversion based on measurements and coefficients that, being based on experimental measurements, are necessarily known with a degree of uncertainty intrinsic to the measurement process. We thus recommend that future soil biodiversity studies explicitly consider the issue of error propagation in the quantification of error measurements, as this is important to estimate lower and upper bounds for key ecosystem level quantities such as respiration and fluxes of C and N.
2.2. Demographic stochasticity
Individuals within a species differ in vital rates, especially survival and fecundity, that together determine individual fitness (Caswell, 2000; Lande et al., 2003). In very small populations (typically <100), this variability in vital rates is the source of demographic stochasticity, and can be measured by following cohorts of individuals, their survival and reproduction output (Lande et al., 2003). This is relatively straightforward, while time consuming, for vertebrates such as birds (Engen and Sæther, 1998; Sæther et al., 2000; Engen et al., 2001, 2003) but much more challenging for soil organisms, apart from laboratory studies on soil animals (Siepel, 1994; Søvik and Leinaas, 2003; Stamou, 2012). Despite the fact that direct measurements of demographic stochasticity are difficult to obtain for soil biota, there is theoretical ground to expect demographic stochasticity plays a minor role in structuring soil biodiversity. For example, following Lande et al. (2003), in simple, unstructured density independent stochastic models, the total variance of the finite rate of population growth λ equals , where is environmental variance (defined in the next section), is demographic variance, and N is total population size. Density independence is appropriate because demographic stochasticity applies to small populations, which are arguably far away from their carrying capacity. In large populations, population size and demographic stochasticity plays a much smaller role than environmental stochasticity. A critical population size can be defined, above which demographic stochasticity can be ignored. In birds, this critical population size can range from a few tens to various hundreds of individuals (Lande et al., 2003). Clearly, the issue is that we do not know the magnitude of environmental and demographic variance in soil organisms. However, it is textbook knowledge that the density per square meter of most soil organisms is typically well above 100 or 1,000 units for animals and up to 1 billion bacterial cells and 200 m of fungal hyphae per gram of soil microbes (Coleman et al., 2004).
It is thus unlikely that demographic stochasticity plays any role at all for most species at scales larger than 1 m2 (see also Section 3). At scales smaller than 1 m2, however, various soil animal species, such as Collembola and mites, can have population sizes of a few tens of individuals, making demographic variance a likely source of stochasticity. If we assume a small population size at this scale, and thus a density independent model following Lande (1998), and the formulation in Lande et al. (2003), we can also formulate an unstable stochastic equilibrium for population size that establishes a critical threshold below which the probability of extinction approaches unity. This critical equilibrium value can be calculated as . For example, if and , and the average λ = 1.03, the critical population size would be 25 individuals. This is a likely scenario at some spatial scales (1–100 m) for some groups of soil fauna given existing estimates of population size and finite rates of increases (e.g., Caruso et al., 2020). However, at this scale interactions between individuals in soil become very likely, as also shown by highly aggregated distribution of soil fauna and microbes at small scales (Ettema and Wardle, 2002). The implication is that other biological mechanisms will potentially contribute to population fluctuations, especially Allee effects, which makes again pure demographic stochasticity unlikely to be a large and only source of fluctuations in soil biota.
These considerations are very relevant to the large body of literature that has investigated the relative roles of stochastic and deterministic determinants of soil biodiversity. A recent synthesis has been offered by Thakur et al. (2020), who found about 100 papers explicitly testing community ecology assembly theory in soil communities, and concluded that theory such as the neutral theory, which has demographic stochasticity as the core process, are generally not well-supported suggesting niche-based explanations underly community composition, and the high levels of unexplained variance are likely due to other stochastic processes described here (see next section). This conclusion is consistent with the general consideration that for most soil species, large population sizes over relatively broad scale (>100 m) imply a small role of demographic stochasticity. It is, however, important to remark that in many of the papers reviewed in Thakur et al. (2020) there is, in our opinion, very often confusion between the assumption of neutrality in certain models and the role of stochastic processes. As made clear by Adler (2007), demographic stochasticity is just a demographic process that may be at play both in neutral and niche community dynamics (see also the simple niche stochastic model example by Tilman, 2004). This means that the rejection of a neutral model does not imply that community fluctuations are not affected by demographic stochasticity, but only that the assumption of neutrality is not sufficient to explain the tested community patterns (Vellend, 2010).
2.3. Environmental stochasticity
Besides individual-level variability in vital rates such as birth and survival rate, the average expression of rates in the population also depends on the environment, which fluctuates. Sometimes conditions are favorable, sometimes they are not. After removing structural, periodic fluctuations due to, for example, the day and night cycle, or the seasonal cycle, or trends due, for example, to global warming, many environmental fluctuations are best modeled as probability distributions (Figures 2, 3), that is, stochastic fluctuations. The implication is that the vital rates, too, will fluctuate stochastically. A simple density independent model for this type of stochastic fluctuations is where the population size N grows geometrically from time 0 to time t according to the finite rate of increase λ, but at each time step the value of λ changes, because the environment changes (Botsford et al., 2019). This implies fluctuations in the rate of growth and so population size over time. It will also imply fluctuations in interspecific interactions, and all the ecosystem processes that depends on these interactions (Figure 1).
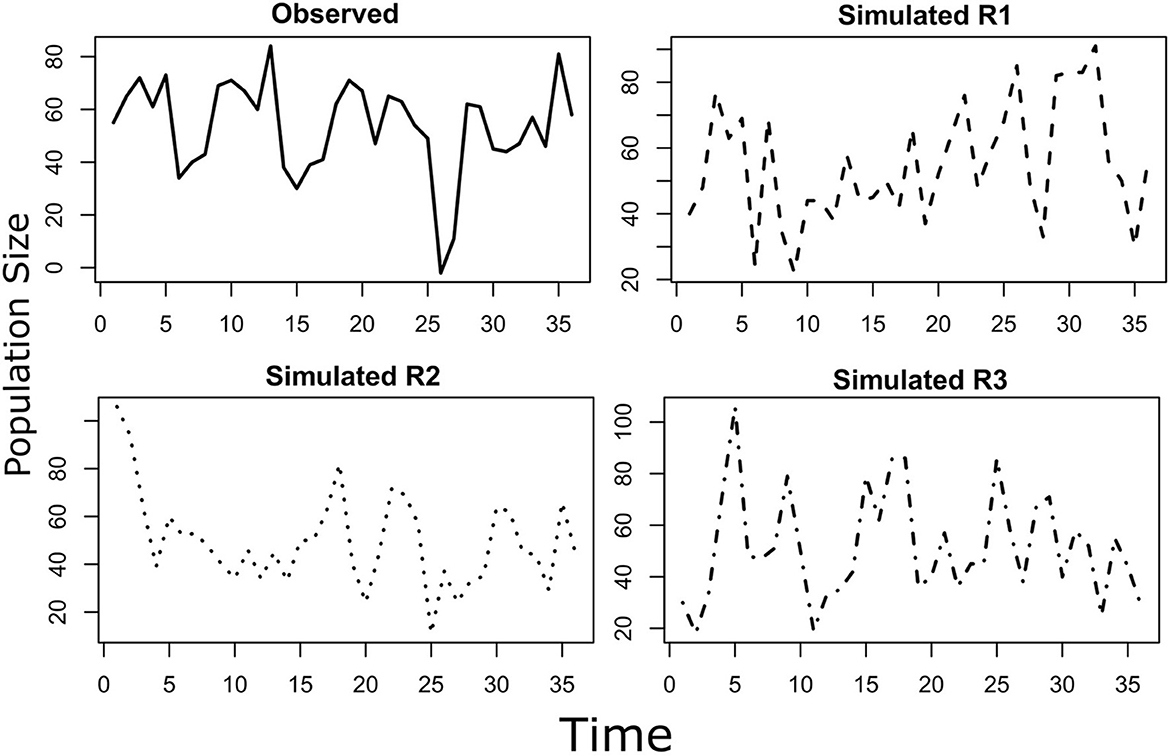
Figure 2. The “observed” population stochastically fluctuate around an equilibrium. The fluctuation follows a normal distribution with autocorrelation parameter “phi”. The parameter phi and the mean and variance of the observed population can be estimated from a sample of the population. The estimate of the mean, variance and autocorrelation parameter can be used to draw a desired number of “simulated” populations. In this example, three simulated populations (Simulated R1, R2, and R3) are shown together with the originally observed population. The three simulated population and the observed one represents four realizations of the same stochastic process, with the probability distribution of the process been estimated from the observed population. This time series displays positive autocorrelation, that is “red” noise.
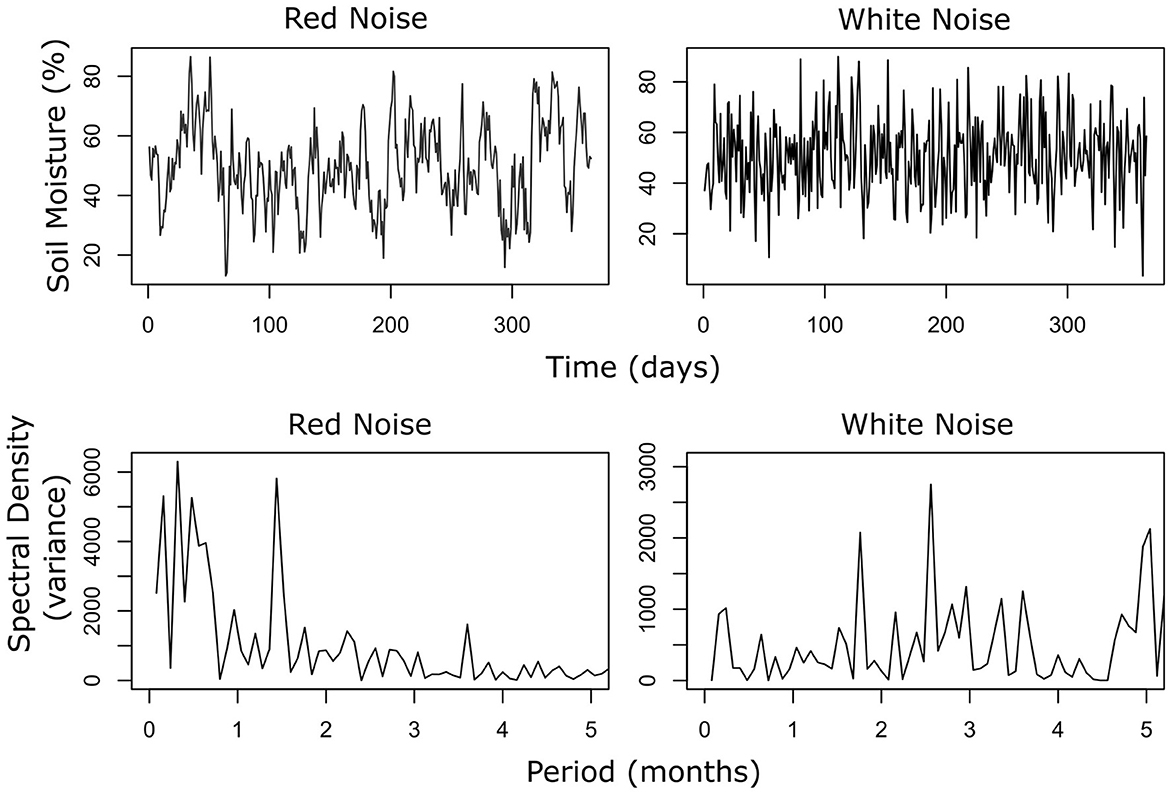
Figure 3. A Fourier transformation decomposes the overall pattern of the time series to reveal the underlying frequencies present in the original function. As such, the Fourier transformation can be used to provide information on seemingly stochastic processes. Environmental variables typically display “red” noise or positive autocorrelation over time. In this figure, a time series of soil moisture with red and white noise (no autocorrelation) are simulated. A Fourier transformation of the two timeseries (top panels, red and white noise) demonstrates that in the spectrum of the red noise most of the variance is displayed over short time scales, with a negative correlation between variance and periods. The spectrum of the white noise is flat, with all periods displaying similar variance.
The first population level implication of environmental stochasticity is that the long-term growth rate of the population will be smaller than the expected average growth rate, and the higher the environmental variance the smaller the rate will be (Caswell, 2000; Lande et al., 2003). This also applies to populations structured by age and stages (Caswell, 2000; Tuljapurkar, 2013), which is the case with many soil animals (Walter and Proctor, 1999). However, while this is generally true for so called “white noise”, which is fluctuations without temporal autocorrelation (Figure 3), many time series of environmental variables display autocorrelation in their random component (Figures 3, 4). This is the so called “color” of noise, which has been shown to have different types and sometimes contrasting effects on the long-term rate of population growth (Ripa and Lundberg, 1996; Ruokolainen et al., 2009)—we argue this is particularly important in soil properties such as soil moisture. For example, in the time series we show in Figure 4, soil moisture and temperature, but especially soil moisture, clearly show fluctuations due to the day-night cycle and pulses of rain. After removing these fluctuations, the remaining random noise is positively autocorrelated, with highest variance displayed over short period of times. This is relatively easy to interpret: if soil becomes dry, it will stay so for a certain time until it rewets. As well as the rewetted soil may be subjected to another bout of drought but with loss of moisture that will take a certain time, meaning that the closer in time any two soil moisture measurements are, the more similar the measurements are likely to be (i.e., red noise). The implication is that both wet and dry conditions may persist longer than under purely white noise, and certain population models imply that red noise may reduce the risk of extinction (Ripa and Lundberg, 1996).
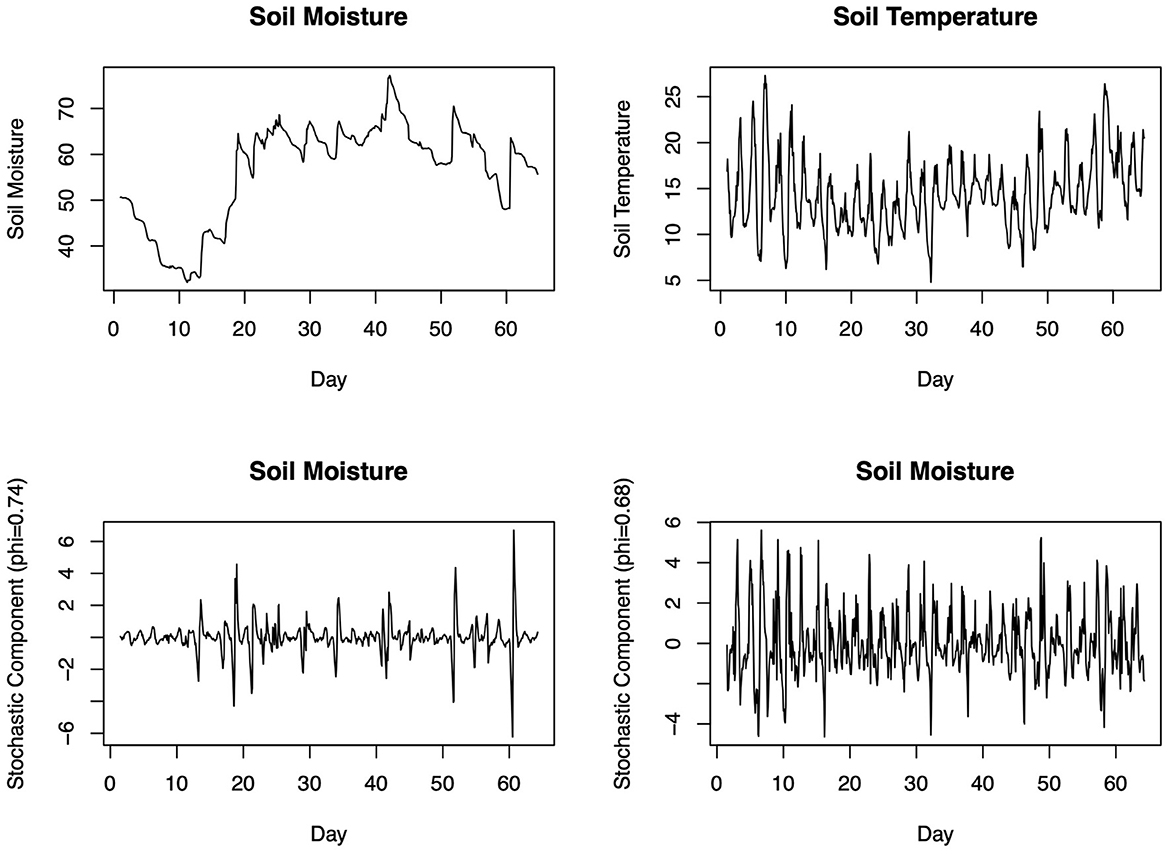
Figure 4. Two real world time series of soil moisture and temperature. In the time domain (top panels) both variables, but especially soil moisture, displays clear positive autocorrelation (over short time scales values tend to be similar). After detrending linear and periodic trends and isolating the stochastic component, the calculation of the autocorrelation coefficient phi confirms the presence of positive autocorrelation (i.e., red noise). With these parameters, one can now draw a desired number of stochastic trajectories, which can inform the modeling of population, community, and ecosystem level (e.g., energy fluxes and soil respiration) processes.
Regardless of the particular population model, however, an important tool to describe the structure of environmental stochasticity in time series analysis is the Fourier transformation (Bloomfield, 2004; Bush et al., 2017). The Fourier transform of a time series moves data from the time domain (x-axis) to the frequency domain (new x-axis); in the original time series, the y-axis is simply the measured variable (Figure 3), and in the Fourier transform the y-axis becomes variance (Figure 3). In practice, the Fourier transform allows detection of the frequencies or, conversely, time period mostly expressed in the data (i.e., that shows more variance). If all the frequencies are equally expressed, the pattern (or spectrum) of the Fourier transform is flat (white noise), and there is no relationship between frequency and variance. If low frequencies show more variance than high frequency there will be a negative correlation between frequency and variance (i.e., there will be positive autocorrelation in the time domain referred to as red noise). Fourier analysis of soil time series can thus quantify the autocorrelation structure of environmental stochasticity in soil, thereby elucidating the effect of this stochasticity on soil biota population and communities. This analysis is straightforward for abiotic variables especially for data collected from data loggers that allow the collection of time series of desired length and resolution (see example in Figure 4).
Unfortunately, the same is not possible for soil biota (Caruso and Bardgett, 2021). Yet, future modeling studies (see example in Figure 2) still benefit from incorporating forms of environmental stochasticity, that reflect the random structure observed in soil abiotic environments. For example, energetic food webs incorporate temperature as a key parameter via the fundamental metabolic scaling equation . There are now soil food web models parameterized on field data (Potapov et al., 2021; Pettit et al., 2023) using the energetic approach (Moore and de Ruiter, 2012). Thus, in silico soil food web models (i.e., computer model estimations) can explore the effect of environmental stochasticity on energy fluxes using information on the stochastic structure that can be revealed by a Fourier analysis of soil temperature time series (Figure 4). These models could also simulate the impact of perturbation regimes, that changes the temporal structure of fluctuations in environmental variables.
3. Community level estimate of stochasticity
One major limitation in the study of stochastic fluctuations in soil biodiversity is the lack of time series (Bardgett and Caruso, 2020; Caruso and Bardgett, 2021). However, many ecological processes that happen over time potentially leave their signature in the spatial distribution of organisms, and there are some models that may allow estimate of environmental and stochastic variance from combined spatial and temporal time series (Lande et al., 2003; Botsford et al., 2019). We offer an example here, based on a publicly available time series of soil oribatid mites (https://doi.org/10.5061/dryad.tmpg4f4vt), which was the subject of previous work of ours (Caruso et al., 2020). The dataset consists of several 9-year time series replicated over multiple sampling locations. We fitted the model by Engen et al. (2002) to this dataset, and we provide an R script (see Data Availability Statement) that displays all the key step of the model fitting procedure. The key output of the model is a partitioning of the total community variance in terms of environmental variance, and a term that is the sum of demographic variation and overdispersion (which is relative to the underlying Poisson distribution assumed by the model). The environmental variance is further decomposed into two sources: general environmental variance, which is a forcing component that applies to all species, and species-specific environmental variance. The model takes the relative abundance of species, location and sampling time as input. It is fitted in stages: first, a bivariate Poisson distribution is fitted to the combined species relative abundance of all pairs of possible samples. Second, the variance and correlation parameters of each fit are combined with the spatial and temporal distance between each pair of samples. Third, an estimate is obtained for the parameters that control the dependency of the correlation parameter on the spatial and temporal distance between any two samples.
These parameters contain the main output, that is the estimate of environmental and demographic variance. Note however, as outlined in the previous section, because measurement errors are generally not well-incorporated into models and analyses, estimates of environmental and demographic stochasticity are likely overestimated. This model is based on the following main stochastic model, where the logarithm X of the abundance of any species i in the community has the following forms: . Where the subscript i indicates a certain species, D, S, and E are Brownian motions and, respectively, represents demographic (D), species specific (S) environmental, and general environmental (E) effects. The sigma coefficient of each of this term (D, S, and E) is the variance we aim to estimate in order to quantify the relative importance of environmental (e+E) vs. demographic (d) stochasticity. The model is not neutral with respect to intrinsic growth rate r and the species level stochastic effect D and E, and it includes interactions between species A(X) as well as density dependence controlled by parameter m. With these simple assumptions, a crude but field-based estimate of environmental and demographic stochasticity is possible from the type of community data sets available to soil ecologists. Our calculations (see R script, Sup. Info.) show that for an old conifer forest (>100 yrs), the total variance observed in the temporal and spatial fluctuation of oribatid species could be partitioned as 85% environmental variance (σe+σE) and 15% demographic variance + overdispersion (that is σd+o). However, the method does not allow separation of demographic variance from overdispersion (the deviation in the relationship between mean and variance of the underlying Poisson distribution of the model), which is likely due to spatial aggregation observed at small scales (Engen et al., 2002). Regardless, the results empirically confirm the theoretical expectation for the main source of stochastic variation as environmental, but also non-neutral. Following, the 85% of total environmental variance can be partitioned into interspecific differences in the response to the general environmental variance (82% of the 85%, or 70% of the total) and local, species-specific response (18% of the 85%, or 15% of the total). The variance values were . Assuming no overdispersion we would have and , which we use to estimate an average critical population density of 12 individuals (using ).
Most oribatid mite species in forest soils have densities above 50 individual m−2. Using the formula for the critical equilibrium value Nc with a long-term stochastic rate λ = 1.6, and (see Caruso et al., 2020), Nc is <1, suggesting the risk of extinction is negligible. Although crude, the example shows that relatively short time series (9 years) with some spatial replication and community level data allows an estimate of environmental and demographic stochasticity in soil communities. The time scale of the time series might be tuned to the biological groups under consideration. For example, for bacteria a time series could occur over a single season. In the northern hemisphere at temperate latitudes, bacterial communities could be sequenced molecularly at 10 intervals from May to August (the growing season) in multiple locations with relatively affordability.
4. Emerging concepts and way forward
Stochasticity can be fully embraced in the study of the factors that control the structure and functions of soil biodiversity and aboveground-belowground linkages. Through modeling stochastic processes, we can better predict and identify populations, communities or ecosystems that are vulnerable to stochasticity in terms of fluctuations that can make soil biological activities uncertain and unstable (Bardgett and Caruso, 2020). This is important because instability in soil biological activities cause uncertainty and instability in fluxes that link aboveground and belowground components, and functions such as nutrient cycling. To obtain this goal, we need to improve data in terms of a quantification of measurement errors based on the theory of error propagation, and produce more time series of different soil biota across multiple locations. Experimental time series are the main tool to elucidate potential divergent (i.e., alternative stable state) soil-climate feedbacks through examining the resistance and resilience of soil biodiversity and function (Bardgett and Caruso, 2020). However, experimental tests and empirical data of this are lacking. In terms of new data and models, we need a quantification of the relative roles of different sources of stochasticity and explicit incorporation of stochastic autocorrelation structure into soil models (at population, community, and ecosystem levels). Improved experimental designs, theory and practical methods are already available to quantify and propagate measurement errors (for example see Caruso and Rillig, 2022). It is just a matter of applying them more extensively and critically, acknowledging errors at the various levels at which they occur (e.g., in energetic soil food webs). Time series remain challenging to obtain but there is an increasing number of contributions toward a temporal description of soil biota (e.g., Barreto et al., 2021), and especially for microbial groups the collection of time series within a single year or season is both feasible and informative of short terms dynamics.
We demonstrate that even a modest time series replicated over space allows a crude but reliable quantification of demographic and environmental stochasticity in soil communities and the quantification of the joint spatial and temporal autocorrelation observed both in biota and the environment, while a Fourier analysis of the stochastic components of time series can reveal the type of autocorrelation that characterizes stochastic fluctuations both in biota and the environment. We believe this approach will be very useful in future manipulative experiments, such as global change experiments that manipulate the intensity, frequency, and type of multiple perturbations (Rillig et al., 2019), which generate complex fluctuations.
Data availability statement
Publicly available datasets were analyzed in this study. This data can be found here: https://doi.org/10.6084/m9.figshare.22654375.v1.
Author contributions
TC, TB, and ZL all developed the ideas in this manuscript. TC coded and ran models and wrote the first version of the manuscript with ZL. All authors contributed to drafts and the final version of the manuscript with approval for publication.
Funding
Funding was provided by European Commission to TC (Structure and Ecological Niche in the Soil Environment; EC FP7-631399-SENSE) and by the Natural Sciences and Engineering Research Council of Canada (NSERC) Discovery Grants program to ZL (#418241-2012 and #05901-2019).
Conflict of interest
The authors declare that the research was conducted in the absence of any commercial or financial relationships that could be construed as a potential conflict of interest.
Publisher's note
All claims expressed in this article are solely those of the authors and do not necessarily represent those of their affiliated organizations, or those of the publisher, the editors and the reviewers. Any product that may be evaluated in this article, or claim that may be made by its manufacturer, is not guaranteed or endorsed by the publisher.
References
Adler, P. B. (2007). A niche for neutrality. Ecol. Lett. 10, 95–104. doi: 10.1111/j.1461-0248.2006.00996.x
Bardgett, R. D., Bowman, W. D., Kaufmann, R., and Schmidt, S. K. (2005). A temporal approach to linking aboveground and belowground ecology. Trends Ecol. Evol. 20, 634–641. doi: 10.1016/j.tree.2005.08.005
Bardgett, R. D., and Caruso, T. (2020). Soil microbial community responses to climate extremes: resistance, resilience and transitions to alternative states. Philos. Trans. R. Soc. B Biol. Sci. 375, 20190112. doi: 10.1098/rstb.2019.0112
Bardgett, R. D., Freeman, C., and Ostle, N. J. (2008). Microbial contributions to climate change through carbon cycle feedbacks. ISME J. 2, 805–814. doi: 10.1038/ismej.2008.58
Bardgett, R. D., and Van der Putten, W. H. (2014). Belowground biodiversity and ecosystem functioning. Nature 515, 505–511. doi: 10.1038/nature13855
Bardgett, R. D., and Wardle, D. A. (2010). Aboveground-Belowground Linkages: Biotic Interactions, Ecosystem Processes, and Global Change. San Diego, CA: Oxford University Press.
Barnes, A. D., Jochum, M., Lefcheck, J. S., Eisenhauer, N., Scherber, C., O'Connor, M. I., et al. (2018). Energy flux: the link between multitrophic biodiversity and ecosystem functioning. Trends Ecol. Evol. 33, 186–197. doi: 10.1016/j.tree.2017.12.007
Barnes, A. D., Jochum, M., Mumme, S., Haneda, N. F., Farajallah, A., Widarto, T. H., et al. (2014). Consequences of tropical land use for multitrophic biodiversity and ecosystem functioning. Nat. Commun. 5, 1–7. doi: 10.1038/ncomms6351
Barreto, C., Branfireun, B. A., McLaughlin, J., and Lindo, Z. (2021). Responses of oribatid mites to warming in boreal peatlands depend on fen type. Pedobiol. J. Soil Ecol. 89, 150772. doi: 10.1016/j.pedobi.2021.150772
Bloomfield, P. (2004). Fourier Analysis of Time Series: An Introduction. New York, NY: John Wiley and Sons.
Botsford, L. W., White, J. W., and Hastings, A. (2019). Population Dynamics for Conservation. Oxford: Oxford University Press. doi: 10.1093/oso/9780198758365.001.0001
Brown, J. H., Gillooly, J. F., Allen, A. P., Savage, V. M., and West, G. B. (2004). Toward a metabolic theory of ecology. Ecology 85, 1771–1789. doi: 10.1890/03-9000
Buchkowski, R., and Lindo, Z. (2021). Stoichiometric and structural uncertainty in soil food web models. Func. Ecol. 35, 288–300. doi: 10.1111/1365-2435.13706
Bush, E. R., Abernethy, K. A., Jeffery, K., Tutin, C., White, L., Dimoto, E., et al. (2017). Fourier analysis to detect phenological cycles using long-term tropical field data and simulations. Methods Ecol. Evol. 8, 530–540. doi: 10.1111/2041-210X.12704
Caruso, T., and Bardgett, R. D. (2021). Variance, locality and structure: three experimental challenges in the study of the response of soil microbial communities to multiple perturbations. Pedobiologia 87–88, 150741. doi: 10.1016/j.pedobi.2021.150741
Caruso, T., Hempel, S., Powell, J. R., Barto, K., and Rillig, M. C. (2012). Compositional divergence and convergence in arbuscular mycorrhizal fungal communities. Ecology 93, 1115–1124. doi: 10.1890/11-1030.1
Caruso, T., Melecis, V., Kagainis, U., and Bolger, T. (2020). Population asynchrony alone does not explain stability in species-rich soil animal assemblages: the stabilizing role of forest age on oribatid mite communities. J. Anim. Ecol. 89, 1520–1531. doi: 10.1111/1365-2656.13203
Caruso, T., and Rillig, M. C. (2022). A general stochastic model shows that plant-soil feedbacks can buffer plant species from extinction risks in unpredictable environments. Plant Soil. doi: 10.1007/s11104-022-05698-6
Caruso, T., Schaefer, I., Monson, F., and Keith, A. M. (2019). Oribatid mites show how climate and latitudinal gradients in organic matter can drive large-scale biodiversity patterns of soil communities. J. Biogeogr. 46, 611–620. doi: 10.1111/jbi.13501
Caruso, T., Taormina, M., and Migliorini, M. (2011). Relative role of deterministic and stochastic determinants of soil animal community: a spatially explicit analysis of oribatid mites. J. Anim. Ecol. 81, 214–221. doi: 10.1111/j.1365-2656.2011.01886.x
Coleman, D. C., Crossley, D. A., and Hendrix, P. F. (2004). Fundamentals of Soil Ecology. San Diego, CA: Elsevier Academic Press.
Crowther, T. W., Van den Hoogen, J., Wan, J., Mayes, M. A., Keiser, A., Mo, L., et al. (2019). The global soil community and its influence on biogeochemistry. Science 365, eaav0550. doi: 10.1126/science.aav0550
Delgado-Baquerizo, M., Oliverio, A. M., Brewer, T. E., Benavent-González, A., Eldridge, D. J., Bardgett, R. D., et al. (2018). A global atlas of the dominant bacteria found in soil. Science 359, 320–325. doi: 10.1126/science.aap9516
Deutschman, D. H., Levin, S. A., and Pacala, S. W. (1999). Error propagation in a forest succession model: the role of fine-scale heterogeneity in light. Ecology 80, 1927–1943. doi: 10.2307/176669
Dornelas, M., Antao, L. H., Moyes, F., Bates, A. E., Magurran, A. E., Adam, D., et al. (2018). BioTIME: a database of biodiversity time series for the Anthropocene. Glob. Ecol. Biogeogr. 27, 760–786. doi: 10.1111/geb.12729
Dumbrell, A. J., Nelson, M., Helgason, T., Dytham, C., and Fitter, A. H. (2010). Relative roles of niche and neutral processes in structuring a soil microbial community. ISME J. 4, 337–345. doi: 10.1038/ismej.2009.122
Ehnes, R. B., Rall, B. C., and Brose, U. (2011). Phylogenetic grouping, curvature and metabolic scaling in terrestrial invertebrates. Ecol. Lett. 14, 993–1000. doi: 10.1111/j.1461-0248.2011.01660.x
Engen, S., Lande, R., and Sæther, B.-E. (2003). Demographic stochasticity and Allee effects in populations with two sexes. Ecology 84, 2378–2386. doi: 10.1890/02-0123
Engen, S., Lande, R., Walla, T., and DeVries, P. J. (2002). Analyzing spatial structure of communities using the two-dimensional Poisson lognormal species abundance model. Am. Nat. 160, 60–73. doi: 10.1086/340612
Engen, S., Sæther, B., and Møller, A. P. (2001). Stochastic population dynamics and time to extinction of a declining population of barn swallows. J. Anim. Ecol. 70, 789–797. doi: 10.1046/j.0021-8790.2001.00543.x
Engen, S., and Sæther, B.-E. (1998). Stochastic population models: some concepts, definitions and results. Oikos 83, 345–352. doi: 10.2307/3546848
Enquist, B. J., Economo, E. P., Huxman, T. E., Allen, A. P., Ignace, D. D., and Gillooly, J. F. (2003). Scaling metabolism from organisms to ecosystems. Nature 423, 639–642. doi: 10.1038/nature01671
Ettema, C. H., and Wardle, D. A. (2002). Spatial soil ecology. Trends Ecol. Evol. 17, 177–183. doi: 10.1016/S.0169-5347(02)02496-5
FAO ITPS, GSBI, SCBD, and EC. (2020). State of Knowledge of Soil Biodiversity - Status, Challenges and Potentialities: Report 2020. FAO.
Gauzens, B., Barnes, A., Giling, D. P., Hines, J., Jochum, M., Lefcheck, J. S., et al. (2019). fluxweb: an R package to easily estimate energy fluxes in food webs. Methods Ecol. Evol. 10, 270–279. doi: 10.1111/2041-210X.13109
Glazier, D. S. (2010). A unifying explanation for diverse metabolic scaling in animals and plants. Biol. Rev. 85, 111–138. doi: 10.1111/j.1469-185X.2009.00095.x
Guerra, C. A., Heintz-Buschart, A., Sikorski, J., et al. (2020). Blind spots in global soil biodiversity and ecosystem function research. Nat. Commun. 11, 3870. doi: 10.1038/s41467-020-17688-2
Karlin, S., and Taylor, H. M. (1975). A First Course in Stochastic Processes. San Diego, CA: Academic Press.
Lande, R. (1998). Demographic stochasticity and Allee effect on a scale with isotropic noise. Oikos 83, 353–358. doi: 10.2307/3546849
Lande, R., Engen, S., and Saether, B.-E. (2003). Stochastic Population Dynamics in Ecology and Conservation. Oxford: Oxford University Press. doi: 10.1093/acprof:oso/9780198525257.001.0001
Lekberg, Y., Koide, R. T., Rohr, J. R., Aldrich-Wolfe, L., and Morton, J. B. (2007). Role of niche restrictions and dispersal in the composition of arbuscular mycorrhizal fungal communities. J. Ecol. 95, 95–105. doi: 10.1111/j.1365-2745.2006.01193.x
Lekberg, Y., Schnoor, T., Kjøller, R., Gibbons, S. M., Hansen, L. H., Al-Soud, W. A., et al. (2011). 454-sequencing reveals stochastic local reassembly and high disturbance tolerance within arbuscular mycorrhizal fungal communities. J. Ecol. 100, 151–160. doi: 10.1111/j.1365-2745.2011.01894.x
Lindo, Z., and Winchester, N. (2009). Spatial and environmental factors contributing to patterns in arboreal and terrestrial oribatid mite diversity across spatial scales. Oecologia 160, 817–825. doi: 10.1007/s00442-009-1348-3
Lo, E. (2005). Gaussian error propagation applied to ecological data: post-ice-storm-downed woody biomass. Ecol. Monogr. 75, 451–466. doi: 10.1890/05-0030
Makarieva, A., Gorshkov, V., Li, B., and Chown, S. (2006). Size-and temperature-independence of minimum life-supporting metabolic rates. Func. Ecol. 20, 83–96. doi: 10.1111/j.1365-2435.2006.01070.x
Makarieva, A. M., Gorshkov, V. G., Li, B.-L., Chown, S. L., Reich, P. B., and Gavrilov, V. M. (2008). Mean mass-specific metabolic rates are strikingly similar across life's major domains: evidence for life's metabolic optimum. Proc. Natl. Acad. Sci. U.S.A. 105, 16994–16999. doi: 10.1073/pnas.0802148105
May, R. M. (1973). Stability and Complexity in Model Ecosystems. Princeton, NJ: Princeton University Press. doi: 10.2307/1935352
Molto, Q., Rossi, V., and Blanc, L. (2013). Error propagation in biomass estimation in tropical forests. Methods Ecol. Evol. 4, 175–183. doi: 10.1111/j.2041-210x.2012.00266.x
Moore, J. C., and de Ruiter, P. C. (2012). Energetic Food Webs: An Analysis of Real and Model Ecosystems. Oxford: Oxford University Press. doi: 10.1093/acprof:oso/9780198566182.001.0001
Pettit, T., Faulkner, K. J., Buchkowski, R. W., Kamath, D., and Lindo, Z. (2023). Changes in peatland soil fauna biomass alter food web structure and function under warming and hydrological changes. Eur. J. Soil Bio. Spec. Issue Soil Food Webs.
Phillips, H. R., Guerra, C. A., Bartz, M. L., Briones, M. J., Brown, G., Crowther, T. W., et al. (2019). Global distribution of earthworm diversity. Science 366, 480–485. doi: 10.1126/science.aax4851
Potapov, A. A., Semenina, E. E., Korotkevich, A. Y., Kuznetsova, N. A., and Tiunov, A. V. (2016). Connecting taxonomy and ecology: trophic niches of collembolans as related to taxonomic identity and life forms. Soil Biol. Biochem. 101, 20–31. doi: 10.1016/j.soilbio.2016.07.002
Potapov, A. M., Klarner, B., Sandmann, D., Widyastuti, R., and Scheu, S. (2019). Linking size spectrum, energy flux and trophic multifunctionality in soil food webs of tropical land-use systems. J. Anim. Ecol. 88, 1845–1859. doi: 10.1111/1365-2656.13027
Potapov, A. M., Rozanova, O. L., Semenina, E. E., Leonov, V. D., Belyakova, O. I., Bogatyreva, V., et al. (2021). Size compartmentalization of energy channeling in terrestrial belowground food webs. Ecology 102, e03421. doi: 10.1002/ecy.3421
Rillig, M. C., Ryo, M., Lehmann, A., Aguilar-Trigueros, C. A., Buchert, S., Wulf, A., et al. (2019). The role of multiple global change factors in driving soil functions and microbial biodiversity. Science 366, 886–890. doi: 10.1126/science.aay2832
Ripa, J., and Lundberg, P. (1996). Noise colour and the risk of population extinctions. Proc. R. Soc. Lond. Ser. B Biol. Sci. 263, 1751–1753. doi: 10.1098/rspb.1996.0256
Ruokolainen, L., Lindén, A., Kaitala, V., and Fowler, M. S. (2009). Ecological and evolutionary dynamics under coloured environmental variation. Trends Ecol. Evol. 24, 555–563. doi: 10.1016/j.tree.2009.04.009
Sæther, B.-E., Tufto, J., Engen, S., Jerstad, K., Røstad, O. W., and Skåtan, J. (2000). Population dynamical consequences of climate change for a small temperate songbird. Science 287, 854–856. doi: 10.1126/science.287.5454.854
Shoemaker, L. G., Sullivan, L. L., Donohue, I., Cabral, J. S., Williams, R. J., Mayfield, M. M., et al. (2020). Integrating the underlying structure of stochasticity into community ecology. Ecology 101, e02922. doi: 10.1002/ecy.2922
Siepel, H. (1994). Life-history tactics of soil microarthropods. Biol. Ferti. Soils 18, 263–278. doi: 10.1007/BF00570628
Søvik, G., and Leinaas, H. P. (2003). Adult survival and reproduction in an arctic mite, Ameronothrus lineatus (Acari, Oribatida): effects of temperature and winter cold. Can. J. Zool. 81, 1579–1588. doi: 10.1139/z03-113
Stamou, G. P. (2012). Arthropods of Mediterranean-Type Ecosystems. Berlin: Springer Science and Business Media.
Taylor, J. (1997). Introduction to Error Analysis, the Study of Uncertainties in Physical Measurements. Sausalito: University Science Books.
Tedersoo, L., Mikryukov, V., Zizka, A., Bahram, M., Hagh-Doust, N., Anslan, S., et al. (2022). Global patterns in endemicity and vulnerability of soil fungi. Glob. Change Biol. 28, 6696–6710. doi: 10.1111/gcb.16398
Thakur, M. P., Phillips, H. R. P., Brose, U., De Vries, F. T., Lavelle, P., Loreau, M., et al. (2020). Towards an integrative understanding of soil biodiversity. Biol. Rev. 95, 350–364. doi: 10.1111/brv.12567
Tilman, D. (2004). Niche tradeoffs, neutrality, and community structure: a stochastic theory of resource competition, invasion, and community assembly. Proc. Natl. Acad. Sci. U.S.A. 101, 10854–10861. doi: 10.1073/pnas.0403458101
Turnbull, M. S., George, P. B., and Lindo, Z. (2014). Weighing in: size spectra as a standard tool in soil community analyses. Soil Biol. Biochem. 68, 366–372. doi: 10.1016/j.soilbio.2013.10.019
Vályi, K., Mardhiah, U., Rillig, M. C., and Hempel, S. (2016). Community assembly and coexistence in communities of arbuscular mycorrhizal fungi. ISME J. 10, 2341–2351. doi: 10.1038/ismej.2016.46
Van Den Hoogen, J., Geisen, S., Routh, D., Ferris, H., Traunspurger, W., Wardle, D. A., et al. (2019). Soil nematode abundance and functional group composition at a global scale. Nature 572, 194–198. doi: 10.1038/s41586-019-1418-6
Vellend, M. (2010). Conceptual synthesis in community ecology. Q. Rev. Biol. 85, 183–206. doi: 10.1086/652373
Walter, D. E., and Proctor, H. C. (1999). Mites: Ecology, Evolution, and Behaviour. Wallingford: CABI Publishing. doi: 10.1079/9780851993751.0000
Keywords: stochasticity, soil biodiversity, terrestrial ecology, global change, time serial data
Citation: Lindo Z, Bolger T and Caruso T (2023) Stochastic processes in the structure and functioning of soil biodiversity. Front. Ecol. Evol. 11:1055336. doi: 10.3389/fevo.2023.1055336
Received: 27 September 2022; Accepted: 10 April 2023;
Published: 09 May 2023.
Edited by:
Mehdi Cherif, INRA Centre Bordeaux-Aquitaine, FranceReviewed by:
Massimo Migliorini, University of Siena, ItalyCésar Marín, Santo Tomás University, Chile
Elizabeth M. Bach, The Nature Conservancy, United States
Copyright © 2023 Lindo, Bolger and Caruso. This is an open-access article distributed under the terms of the Creative Commons Attribution License (CC BY). The use, distribution or reproduction in other forums is permitted, provided the original author(s) and the copyright owner(s) are credited and that the original publication in this journal is cited, in accordance with accepted academic practice. No use, distribution or reproduction is permitted which does not comply with these terms.
*Correspondence: Zoë Lindo, emxpbmRvQHV3by5jYQ==