
95% of researchers rate our articles as excellent or good
Learn more about the work of our research integrity team to safeguard the quality of each article we publish.
Find out more
ORIGINAL RESEARCH article
Front. Ecol. Evol. , 23 February 2023
Sec. Ecophysiology
Volume 11 - 2023 | https://doi.org/10.3389/fevo.2023.1050582
This article is part of the Research Topic New Frontiers in the Application of Stable Isotopes to Ecological and Ecophysiological Research View all 16 articles
 Matthew D. Ramirez1*
 Larisa Avens2
 Anne B. Meylan3,4
 Donna J. Shaver5Angela R. Stahl1Peter A. Meylan4,6
 Jamie M. Clark2,7
 Lyndsey N. Howell8
 Brian A. Stacy9Wendy G. Teas10
 Kelton W. McMahon1
Foraging habitat selection and diet quality are key factors that influence individual fitness and meta-population dynamics through effects on demographic rates. There is growing evidence that sea turtles exhibit regional differences in somatic growth linked to alternative dispersal patterns during the oceanic life stage. Yet, the role of habitat quality and diet in shaping somatic growth rates is poorly understood. Here, we evaluate whether diet variation is linked to regional growth variation in hawksbill sea turtles (Eretmochelys imbricata), which grow significantly slower in Texas, United States versus Florida, United States, through novel integrations of skeletal growth, gastrointestinal content (GI), and bulk tissue and amino acid (AA)-specific stable nitrogen (δ15N) and carbon (δ13C) isotope analyses. We also used AA δ15N ΣV values (heterotrophic bacterial re-synthesis index) and δ13C essential AA (δ13CEAA) fingerprinting to test assumptions about the energy sources fueling hawksbill food webs regionally. GI content analyses, framed within a global synthesis of hawksbill dietary plasticity, revealed that relatively fast-growing hawksbills stranded in Florida conformed with assumptions of extensive spongivory for this species. In contrast, relatively slow-growing hawksbills stranded in Texas consumed considerable amounts of non-sponge invertebrate prey and appear to forage higher in the food web as indicated by isotopic niche metrics and higher AA δ15N-based trophic position estimates internally indexed to baseline nitrogen isotope variation. However, regional differences in estimated trophic position may also be driven by unique isotope dynamics of sponge food webs. AA δ15N ΣV values and δ13CEAA fingerprinting indicated minimal bacterial re-synthesis of organic matter (ΣV < 2) and that eukaryotic microalgae were the primary energy source supporting hawksbill food webs. These findings run contrary to assumptions that hawksbill diets predominantly comprise high microbial abundance sponges expected to primarily derive energy from bacterial symbionts. Our findings suggest alternative foraging patterns could underlie regional variation in hawksbill growth rates, as divergence from typical sponge prey might correspond with increased energy expenditure and reduced foraging success or diet quality. As a result, differential dispersal patterns may infer substantial individual and population fitness costs and represent a previously unrecognized challenge to the persistence and recovery of this critically endangered species.
The distribution and abundance of food resources are key factors determining habitat quality and shaping animal populations through effects on demographic rates (Dias, 1996; Sutherland, 1997). As a result, within spatially heterogenous environments, mobile species are theoretically expected to distribute themselves in relation to preferred food resources so as to maximize individual fitness (Fretwell and Lucas, 1969). However, many organisms occupy suboptimal habitats for a variety of reasons that vary spatiotemporally, including a lack of complete knowledge of resource distribution, threat level (e.g., predator abundance, excessive human activity), inability to select (e.g., passive dispersers) or unwillingness to emigrate to (e.g., high site fidelity) high-quality habitats, or perceptual errors that decouple settlement cues from patterns of habitat quality (e.g., ecological traps; Swearer et al., 2021). As a result, many organisms occupy suboptimal habitats where demographic rates are reduced from theoretical maxima. Within widely distributed species, such as sea turtles, this may result in the partitioning of individuals into subpopulations with divergent demographic trajectories (Heinrichs et al., 2016), where regional population persistence requires demographic surpluses in high-quality habitats to outweigh deficits accumulated in low-quality habitats (Dias, 1996). Dispersal and foraging habitat selection are thus important processes shaping individual fitness and meta-population dynamics.
Recent research suggests that hawksbill sea turtles (Eretmochelys imbricata) have divergent demographic trajectories linked to differential oceanic stage dispersal patterns that can result in transport to suboptimal habitats with insufficient food resources for growth (Avens et al., 2021). Like most cheloniid sea turtles, the hawksbill sea turtle has a complex life cycle that begins with a dispersive-oceanic stage characterized by epipelagic foraging and ends with recruitment to coastal habitats and benthic foraging (Meylan et al., 2011). This life cycle likely includes several shifts between benthic developmental foraging habitats before final settlement in adult foraging sites. Importantly, ocean currents are believed to be a primary source of variation in the composition of benthic developmental foraging aggregations via passive dispersal (Bowen et al., 2007; Blumenthal et al., 2009). The quantity and quality of food resources in these early stages will determine somatic growth rates and thereby influence predation risk (Scharf et al., 2000; Salmon and Scholl, 2014), making prey distribution and abundance primary drivers of habitat quality for sea turtles during the juvenile life stage. Notably, juvenile hawksbills stranded in Texas were recently found to grow markedly slower than hawksbills stranded in Florida (Avens et al., 2021). Complementary bulk tissue stable nitrogen isotope (δ15N) analyses revealed that turtles stranded in Texas having substantially higher bone δ15N values than turtles stranded in Florida (Avens et al., 2021), suggesting this regional variation in growth may be linked to differences in diet. However, mechanistic drivers of this somatic growth variation have yet to be identified.
Characterizing variation in hawksbill diet is critical to evaluating drivers of divergent demographic trajectories within United States waters. However, few data have been published in the literature despite United States hawksbill diets being known to Sea Turtle Stranding and Salvage Network personnel as early as 1981 (Supplementary Table S1). Globally, neritic stage hawksbills were once described as indiscriminate feeders (Carr and Stancyk, 1975), but subsequent studies revealed a high importance of sponges in hawksbill diets globally (e.g., Meylan, 1988; Carrión-Cortez et al., 2013; Von Brandis et al., 2014; see Supplementary material for detailed review). In Florida, digestive tract contents of four stranded pelagic-sized hawksbills suggested linkage to the surface-pelagic drift community; buccal samples from two subadults encountered on coral reefs consisted of sponge (Meylan, 1984; Meylan and Redlow, 2006). Additionally, Wood et al. (2017) found sponges were the only prey consumed during 141 min of video behavioral observations taken on coral reefs. Yet several other prey items, particularly tunicates, corallimorpharians, zoanthids, and algae have also been identified as important additional food sources (Mayor et al., 1997; León and Bjorndal, 2002; Bell, 2013; Carrión-Cortez et al., 2013), demonstrating potential for dietary plasticity for this species. In contrast to Florida hawksbills, the diets of hawksbills in Texas waters have yet to be characterized, despite oceanic and small neritic juveniles having been documented there since at least 1972 (Amos, 1989). United States waters, particularly Texas and Florida, provide important developmental habitats for this critically endangered species (Meylan and Redlow, 2006; Wood et al., 2013; Gorham et al., 2014), creating the need to better understand their trophic dynamics in this region, particularly in relation to demographic variation (Avens et al., 2021).
Gastrointestinal (GI) content studies have traditionally been the primary tools used to characterize sea turtle trophic ecology globally (Bjorndal, 1997). However, applications of other methods have grown in the last two decades (reviewed by Jones and Seminoff, 2013), including stable isotope analysis, which provides valuable metrics of foraging niche breadth (Newsome et al., 2007). More recently, compound-specific stable isotope analysis of amino acids (CSIA-AA) has significantly advanced the study of energy flow within food webs by unlocking unique metabolic information contained within individual amino acids to reveal how organisms acquire, modify, and allocate resources (McMahon and Newsome, 2019). For example, because the δ15N values of certain classes of amino acids do (‘trophic’ amino acids) or do not (‘source’ amino acids) change appreciably with trophic transfer (McClelland and Montoya, 2002), amino acid δ15N values can be used to estimate consumer trophic positions (TP) that are internally indexed to those nitrogen isotope baselines (Chikaraishi et al., 2009). This is particularly useful to the study of hawksbill dietary plasticity, and that of other widely distributed species, because it allows for the assessment of whether geographic variation in consumer bulk tissue δ15N values reflects variation in trophic ecology, foraging across habitats with isotopically distinct baselines, or both (e.g., Matthews and Ferguson, 2014; Lorrain et al., 2015). Specifically, higher trophic positions for hawksbills in Texas relative to Florida would suggest they have altered foraging patterns that may be influencing their growth rates.
Stable carbon isotope analysis of essential amino acids (δ13CEAA) has emerged as a powerful technique for understanding carbon flow through food webs. This is because: (1) different primary producers have unique multivariate differences in their δ13CEAA values (i.e., δ13CEAA‘fingerprints’) owed to the diversity of biochemical pathways they use to synthesize amino acids (Larsen et al., 2013), and (2) δ13CEAA values pass through the food web relatively unaltered because most animals have lost the ability to synthesize essential amino acids de novo and must obtain them directly from their diet (McMahon et al., 2010). As a result, δ13CEAA fingerprinting greatly improves the identification of taxon-specific production sources, for example between bacteria and eukaryotic microalgae supporting focal food webs (e.g., Arthur et al., 2014; McMahon et al., 2016). This is particularly relevant for reconstructing foraging patterns of consumers that prey on sponges, which exhibit a wide breadth of feeding strategies. In contrast to classical assumptions that sponges are principally heterotrophic filter feeders on eukaryotic microalgae, there is growing recognition that many sponges can obtain a high proportion of their energy via routing of microbially-processed dissolved organic matter to sponge tissues (de Goeij et al., 2008; Rix et al., 2020). High microbial abundance (HMA) sponges, whose holobionts are among the most microbially diverse environments on Earth (Hentschel et al., 2006), can derive up to ~60% of their heterotrophic diet from their bacterial symbionts (Rix et al., 2020). In contrast, low microbial abundance (LMA) sponges, which contain 2–4 orders of magnitude fewer microbes (Hentschel et al., 2006), obtain <1% of their diet from their bacterial symbionts (Rix et al., 2020; Hudspith et al., 2021). Given that eukaryotic microalgae and macroalgae are the main sources of particulate and dissolved organic matter in marine environments (Volkham and Tanoue, 2002) and have δ13CEAA fingerprints distinct from bacteria (Larsen et al., 2013), δ13CEAA fingerprinting provides a potential tool for differentiating consumption of HMA vs. LMA sponges. For example, recent CSIA-AA analyses of HMA sponges observed a significant contribution of bacterially derived carbon and nitrogen (Macartney et al., 2020; Shih et al., 2020). This process provides a quantifiable metric of diet in sponge predators, which appear to display selectivity for palatable, chemically undefended sponges that are also typically classified as HMA sponges (Pawlik et al., 2018). A complementary approach quantifying variance in trophic amino acid δ15N values relative to expected primary producer patterns, a metric termed ΣV (McCarthy et al., 2007), also serves as a valuable proxy of bacterial re-synthesis to assess the degree to which bacterial production supports consumer food webs.
Here, we integrate GI content, bulk tissue stable isotope analysis, and amino acid δ15N and δ13C analyses to evaluate whether trophic plasticity is linked to regional growth variation in neritic stage hawksbill sea turtles. First, we collated quantitative and qualitative GI content data from stranded hawksbills, including novel analyses of turtles stranded in Texas, as well as Sea Turtle Stranding and Salvage Network records to assess whether diet composition varied regionally. We then performed complementary bulk tissue δ15N and δ13C and amino acid-specific δ15N analyses of stranded hawksbill bone tissue to determine whether trophic niches and trophic positions differed between neritic stage turtles stranded in Florida vs. Texas. Lastly, we used δ13CEAA fingerprinting and ΣV values to evaluate the contribution of bacterially derived energy to hawksbill food webs as a metric of sponge foraging dynamics. We hypothesize that the regional variation in bulk δ15N values observed by Avens et al. (2021) reflects regional differences in trophic dynamics that are associated with divergent demographic rates for hawksbills inhabiting United States waters. We hypothesize that Florida-stranded turtles follow the typical pattern of primary sponge consumption and that their food webs are principally supported by bacterially derived energy as would be expected for HMA sponge consumers. In contrast, we hypothesize the relatively high δ15N values observed by Avens et al. (2021) for hawksbills in Texas reflect expanded trophic niches with turtles foraging at higher trophic levels in a food web supported by pelagic production sources (e.g., eukaryotic microalgae) rather than bacterially supported sponges. Consumption of atypical diets may be caused by reduced foraging success or prey availability, which in turn may influence turtle condition and somatic growth. Collectively, this work explores how trophic plasticity linked to differential dispersal patterns may influence sea turtle demographic rates.
Hawksbill front flippers and GI tracts were opportunistically collected through the United States Sea Turtle Stranding and Salvage Network from turtles that died along the coasts of Florida (FL; 1981–2018) and Texas (TX; 1983–2008; Supplementary Figure S1). Stranding date, location, and sex (male, female, unknown) were recorded, as well as either straightline (SCL) or curved (CCL) carapace length (nuchal notch to pygal notch, SCLn-n, CCLn-n, or nuchal notch to posterior tip, SCLn-t, CCLn-t). All body size measurements were converted to SCLn-t (hereafter SCL) following Bjorndal et al. (2016); Supplementary Table S1. Samples were either stored frozen (flippers, GI tracts) or preserved in ethanol (GI contents) until further processing. Although humeri and GI tracts were analyzed across the full spectrum of stranded turtles (i.e., post-hatchling to adult), analyses herein focus primarily on the neritic life stage.
All humeri sampled herein (n = 71 stranded turtles) were previously analyzed in Avens et al. (2021) following standard skeletochronology methods (Avens and Snover, 2013). Briefly, this included excising humeri from flippers; decalcifying, thin-sectioning, and staining bone cross-sections; and identifying and measuring the lines of arrested growth (LAGs; i.e., annual growth layers). The visible LAGs in the histologically processed skeletochronology sections were used to guide growth increment-specific sampling for stable isotope analyses.
For turtles that retained the first-year growth mark, or “annulus,” age at death was determined directly from LAG counts, adjusted to the nearest 0.25 year based on stranding date relative to mean population hatch date (September). For turtles whose annulus was not visible, the number of LAGs lost to bone resorption were estimated using correction factors developed based on the relationship between LAG number and diameter from known age individuals (Parham and Zug, 1997). Estimated number of LAGs lost to resorption were then added to the visible number of LAGs to estimate age at death. Final age estimates were used to back-assign age estimates to all visible LAGs within each humerus sample.
To estimate somatic growth rates, we first estimated SCL for each visible LAG using an allometric equation that integrates the humerus section diameter (HSD): SCL relationship for processed humeri with the body proportional hypothesis back-calculation technique that accounts for individual variability in the HSD and SCL relationship (Francis, 1990). Annual somatic growth rates were then calculated by taking the difference between SCL estimates of successive LAGs. Growth rates were binned into 10 cm SCL size classes to facilitate comparison with the published literature.
We characterized hawksbill diet composition using two primary data sources: (1) examination of dead, stranded turtle GI contents (FL: n = 36, TX: n = 56), and (2) necropsy reports containing GI content observations (FL: n = 18, TX: n = 6). These data were compiled from multiple independent research endeavors over multiple decades that used varied sampling criteria (e.g., stomach only, partial GI tract, etc). As a result, we used a variety of qualitative and quantitative metrics to evaluate GI content data herein, each of which has its advantages and disadvantages (Esteban et al., 2020).
All GI contents were first visually examined to provide basic summaries of major dietary components. These data were used to estimate the percent frequency of occurrence of prey items for 10 general prey groups: sponge, annelid, cnidarian, crustacean, fish, mollusc, tunicate, other animal matter, plant/algae, and debris (natural and anthropogenic). We acknowledge percent frequency of occurrence provides an imperfect view of diet composition that can overemphasize infrequently consumed prey taxa. However, we necessarily include this consistent metric because this is still a standard metric reported in GI content studies and more detailed diet composition data were not collected for most Florida-stranded turtles nor recorded in necropsy reports. In contrast, for most Texas hawksbill GI tracts (n = 52 of 62), prey items were also identified to the lowest possible taxonomic level, dried, and weighed to estimate the percent dry weight of individual prey items.
Hawksbills were divided into life stages based on their GI contents, with those whose contents were primarily pelagic (e.g., Sargassum, floating species) or benthic (e.g., sponge, other benthic invertebrates, macroalgae/seagrass) prey assigned to the oceanic and neritic life stage, respectively. If GI contents contained both pelagic and benthic prey turtles were classified as intermediate. Turtles with minimal or ambiguous GI contents (e.g., small fish and crabs) were classified as unknown. For both qualitative and quantitative analyses, GI content data were evaluated relative to both SCL and mass (kg), which was estimated using the power function regression provided by Diez and van Dam (2002) instead of being measured to reduce error associated with frozen, damaged stranded animals. Metadata for stranded turtles sampled for GI contents, including diet descriptions, are presented in Supplementary Table S1.
To evaluate United States hawksbill diets within a broader context, we also performed a comprehensive literature review of global hawksbill diet composition data. We specifically targeted studies that reported diet composition as either percent dry or wet weight, collected via gastric lavage or stranded turtle GI content analysis only. Using standard search methods (e.g., Scopus, Google Scholar) in combination with a review of the International Sea Turtle Symposium conference proceedings, we identified nine studies that met criteria for inclusion in this data synthesis, including seven from the Caribbean, one from the eastern Pacific Ocean, and one from the western Indian Ocean. Four additional studies that reported percent weight data were excluded from comparisons because quantitative data could not be extracted from the manuscript, GI content weights were unusually low, or only fecal matter was analyzed (see Supplementary material). Data collated from these nine studies were used to calculate a weighted mean percent weight of prey taxa consumed by hawksbills across studies. This necessarily included integration of both wet and dry wet data. To evaluate patterns of sponge consumption, whenever possible, sponge taxa were subsequently classified as HMA or LMA sponges based on best available information from the literature.
We used a computer-guided micromill (ESI New Wave Research) to collect ~1.6 mg of bone dust from 11 Texas -stranded hawksbills (n = 20 growth layers) and 14 Florida-stranded hawksbills (n = 47 growth layers). Only humerus growth layers reflective of the neritic life stage were sampled (e.g., ≥ 1.75 years; Avens et al., 2021). Between one and seven growth layers were sampled from individual turtles (mean ± SD = 2.7 ± 1.8). Bone dust was analyzed for bulk δ15N and δ13C values via continuous-flow isotope-ratio mass spectrometry at Oregon State University, Corvallis, OR, United States. Analytical precision was 0.09‰ for δ15N and 0.07‰ for δ13C values. Following Ramirez et al. (2020), we corrected bulk δ13C values for the Suess effect by standardizing all data to the year 2016 using a linear correction of −0.025 ‰ per year. Bulk δ13C values were not corrected to account for carbonate-derived carbon due to the lack of a hawksbill-specific correction factor and because we did not use the bulk δ13C data to estimate diet composition. Bulk δ13C values were also not corrected for lipid content because tissue C:N ratios (%C divided by %N) were below 3.5, characteristic of unaltered protein with low lipid content (Post et al., 2007). Bulk SIA data presented herein were previously analyzed in Avens et al. (2021).
For a subset of 17 turtles (FL: n = 11, TX: n = 6), we analyzed turtle bone collagen tissue via CSIA-AA. We used a computer-guided micromill to isolate an approximately 5 mm x 2 mm x 1 mm section of bone, taken from the growth layer deposited in the final growth year of life to reflect most recent foraging to stranding, which was then decalcified in 0.5 N HCl at room temperature for 20–24 h. Isolated bone collagen was rinsed three times with Milli-Q water, air dried for 48–72 h, and then analyzed via CSIA-AA at the University of Rhode Island, Narragansett, Rhode Island, United States, following protocols modified from Brault et al. (2019) (see Supplementary material).
We analyzed the δ15N and δ13C values of 12 amino acids: alanine (Ala), glycine (Gly), threonine (Thr), serine (Ser), valine (Val), leucine (Leu), isoleucine (Ile), proline (Pro), aspartic acid (Asp), glutamic acid (Glu), phenylalanine (Phe), and lysine (Lys). Acid hydrolysis converts glutamine (Gln) and asparagine (Asn) into Glu and Asp, respectively, resulting in the measurement of combined Gln + Glu (hereafter referred to as Glx) and Asn + Asp (hereafter referred to as Asx). Hydroxyproline (Hpro) likely co-eluted with Pro given its high abundance in collagen, however, there are no isotopic difference between these amino acids because Hpro is a post-translationally modified variant of Pro (O’Connell and Collins, 2018). For δ15N analyses, we assigned Glx, Asx, Ala, Leu, Ile, Pro, and Val as trophic amino acids, and Phe and Lys as source amino acids. Gly, Ser, and Thr were kept as separate groups due to a lack of consensus on their classification (McMahon and McCarthy, 2016). For δ13C analyses, we assigned Thr, Val, Leu, Ile, Phe, and Lys as essential amino acids (δ13CEAA) and all other amino acids as non-essential amino acids (δ13CNEAA).
We used generalized additive models to evaluate regional variation in somatic growth rates for neritic stage turtles (i.e., ages >2). First, we implemented a set of simplified generalized additive models to characterize region-specific growth patterns that included only the outermost, ‘terminal’ growth rate for each turtle. We then implemented a second set of generalized additive mixed models that included the full growth dataset (i.e., each turtles’ full growth history). Generalized additive (mixed) models included either SCL or age as a fixed effect, an identity link, a quasi-likelihood error function, and turtle-specific random effects (mixed models only) and were implemented using the “mgcv” and “nlme” packages (Wood, 2006; Pinheiro et al., 2017). SCL and age exhibit high concurvity in sea turtles and were thus necessarily separated into different models.
Bulk δ15N and δ13C data were used in combination with the R package ‘SIBER’ (Stable Isotope Bayesian Ellipses in R; Jackson et al., 2011) to compare isotopic niche widths of hawksbills that stranded in south Florida (sFL: Florida Keys to Biscayne Bay, FL), west Florida (wFL: Fort Myers to Tampa, FL), and Texas (TX: Aransas Bay to US/Mexico border). For the stable isotope analyses, data for turtles from south Florida and west Florida were evaluated separately to examine the potential effects of foraging habitat availability on diet composition—Florida’s coral reefs are primarily concentrated in the Florida Keys and along the southeastern coastline but hawksbills also occur in western Florida up to Tampa Bay (Meylan and Redlow, 2006). The SIBER technique uses the univariate bulk δ13C and δ15N data to calculate bivariate ellipses, termed Standard Ellipse Areas, for each group, which account for c. 40% of those data and are corrected for sample sizes, serve as proxies for the isotopic niche of each group of turtles. Bayesian Standard Ellipse Areas were used to estimate uncertainty in region-specific isotopic niches.
Hawksbill trophic positions (TP) were calculated in multiple ways (see Supplementary material). First, we calculated region-specific TPbulk using bulk tissue isotope values intergated into a Bayesian isotope mixing model using the R package “tRophicPosition” (Quezada-Romegialli et al., 2018). Here, we estimated population-level TPbulk using both particulate organic matter and seagrass as δ15Nbaseline. We calculated TPbulk using both general consumer diet-collagen trophic discrimination factor value of 3.2 ± 1.0 ‰ (Schoeninger and DeNiro, 1984) as well as a green sea turtle-specific trophic discrimination factor of 5.1 ± 1.1 ‰ (Turner Tomaszewicz et al., 2017). We also calculated TP using the TPCSIA equation, both using the classic pairing of Glx and Phe δ15N values (e.g., Chikaraishi et al., 2009) as well as the weighted mean δ15N values of multiple trophic (Ala, Val, Leu, Ile, Pro, and Glx) and source (Phe, Lys) amino acids (Nielsen et al., 2015). In both instances, amino acid-specific β values were derived from Ramirez et al. (2021) (Glx–Phe = 3.3 ± 1.8 ‰; Avg TrAA–Avg SrAA = 2.7 ± 3.0 ‰). Amino acid-specific trophic discrimination factor values were derived from Lemons et al. (2020) (Glx–Phe = 4.0 ± 0.5 ‰; Avg TrAA–Avg SrAA = 4.8 ± 0.7 ‰). Errors were propagated using the “propagate” package in R (Spiess, 2018) using the aforementioned β and trophic discrimination factor value uncertainties and the error estimates resulting from triplicate sample injections for each amino acid for each hawksbill sea turtle.
Following Larsen et al. (2013), we used an amino acid δ13C fingerprinting approach to identify the primary production sources fueling hawksbill food webs. We used published δ13CEAA data for Thr, Val, Leu, Ile, and Phe from the three most likely primary producers supporting hawksbill food webs, prokaryotic bacteria, macroalgae, and eukaryotic microalgae (Larsen et al., 2013; McMahon et al., 2016; Stahl, 2021). We also used Caribbean HMA sponge δ13CEAA data from Macartney et al. (2020) for comparison with the hawksbill data. Although the sponge taxa sampled in Macartney et al. (2020) are not known to be consumed by hawksbills, they are included for reference because they are the only sponge δ13CEAA data reported in the literature. We explicitly assume their δ13CEAA patterns reflect a typical HMA sponge, although further study is needed. Hawksbill, sponge, and primary producer δ13CEAA data were normalized to their individual means to facilitate comparison of δ13CEAA patterns among groups (e.g., Larsen et al., 2015; Stahl, 2021). We then performed a linear discriminant analysis on the normalized δ13CEAA values to separate primary producer groups and used leave-one-out cross-validation to predict group membership for hawksbill sea turtles and sponges (Larsen et al., 2013).
Lastly, we calculated ΣV values (McCarthy et al., 2007), a proxy of bacterial re-synthesis and translocation of bacterial amino acids, to further assess whether energy sources fueling hawksbill food webs were derived from bacterial or eukaryotic sources. ΣV was calculated as the average deviation in the δ15N values of the trophic amino acids Ala, Asx, Glx, Ile, Leu, and Pro (Eq. 3):
Where X of each trophic amino acid = [δ15NAA – AVG δ15NAA (Ala, Asx, Glx, Ile, Leu, and Pro)] and n = the total number of δ15NAA used in the calculation. ΣV values <1 reflect algal sources whereas ΣV values ≥2 indicate predominantly bacterial re-synthesis of organic matter (McCarthy et al., 2007). All statistical tests were carried out using the statistical software program R version 4.1.1 (R Core Team, 2021).
As observed by Avens et al. (2021), somatic growth rates were markedly lower for neritic stage hawksbills stranded in Texas relative to hawksbills stranded in Florida across all size classes (Table 1). Growth responses were similar between generalized additive models that included only the final, “terminal” growth rate for each individual and mixed models that included full multi-year growth records across all sampled turtle (Figure 1; Table 2). Growth responses were generally similar between models that included SCL or age as a fixed effect, showing the typical pattern of declining growth rate with increasing SCL and age (Figure 1; Supplementary Figure S2).
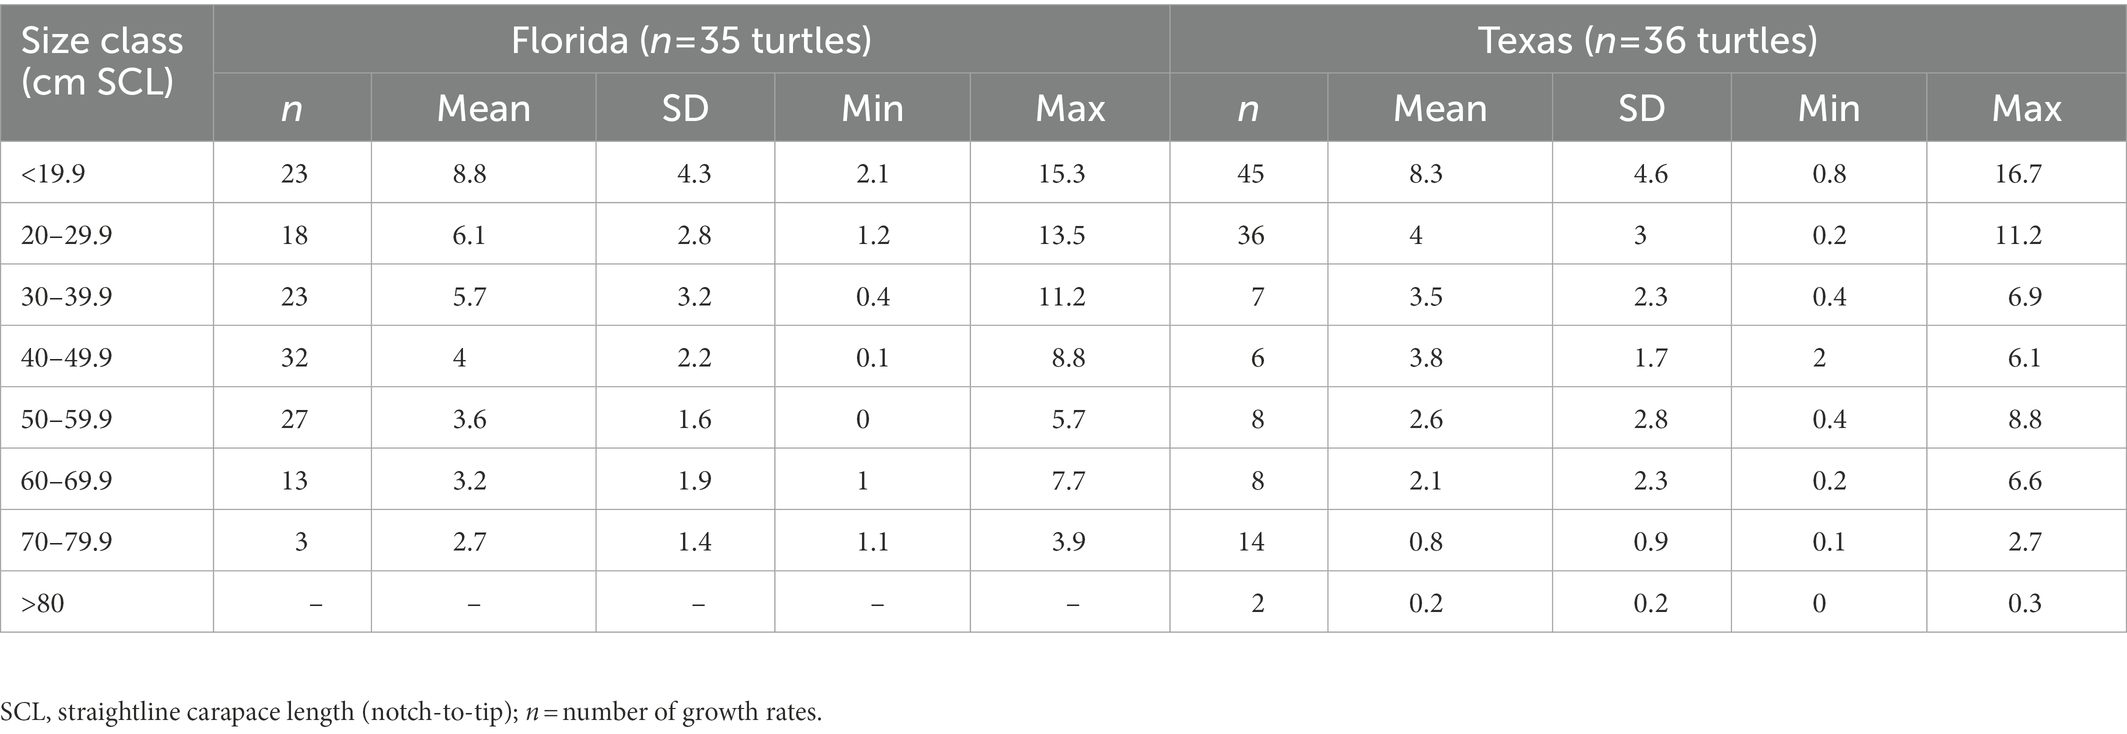
Table 1. Size class-specific somatic growth rates for hawksbill sea turtles stranded in Texas and Florida.
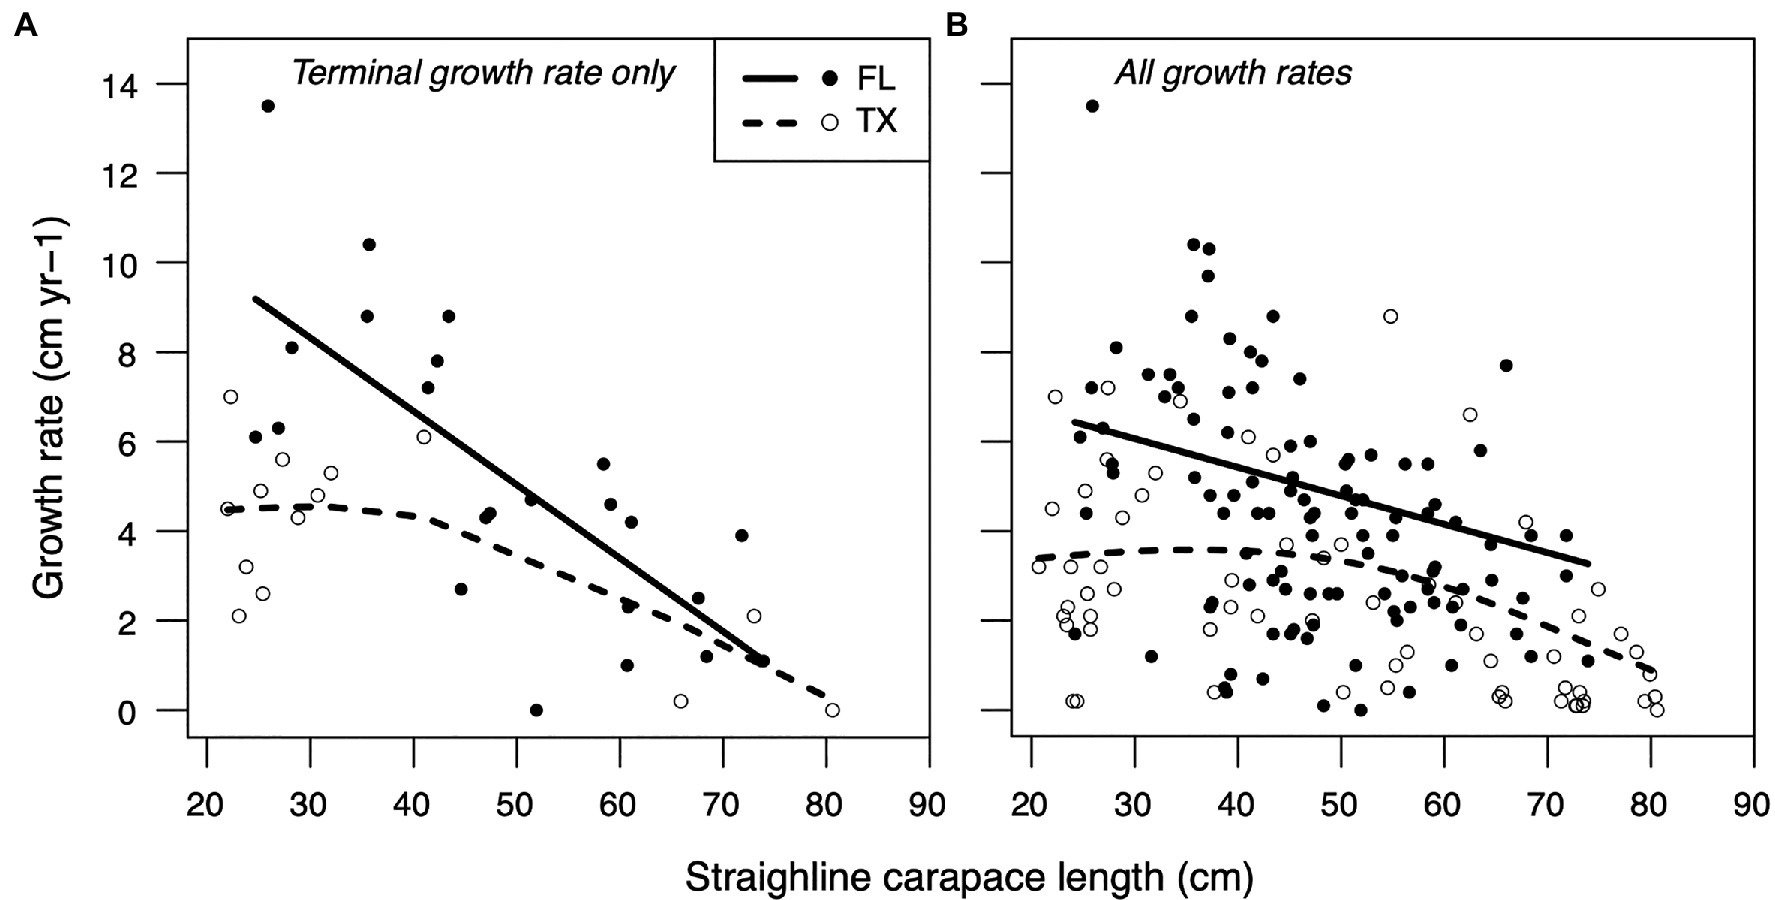
Figure 1. Generalized additive (mixed) model smoothing spline fits characterizing relationships between neritic stage growth rates (ages >2 yr) and straightline carapace length for hawksbills stranded in Florida (FL; solid lines, closed points) and Texas (TX; dashed lines, open points). Region-specific models were implemented using (A) only the final ‘terminal’ growth rate for each turtle or (B) the full growth dataset that included multi-year growth records for each turtle.
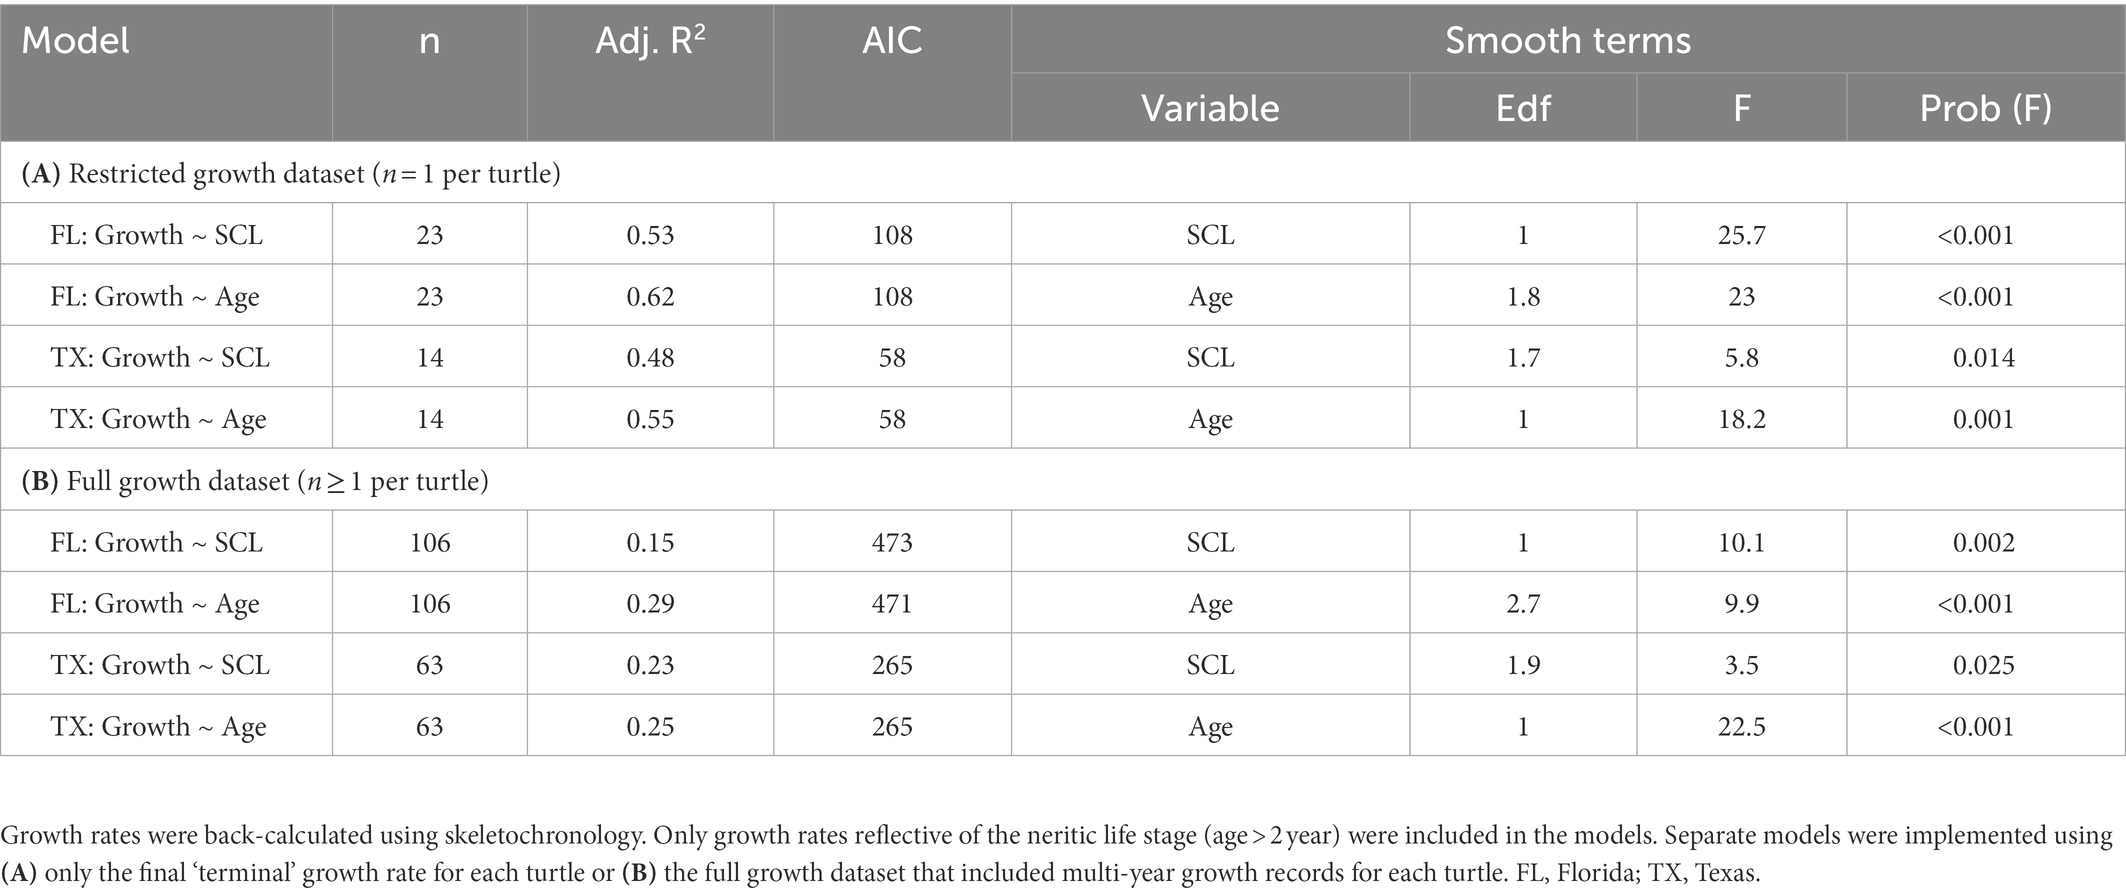
Table 2. Summary of statistical output for generalized additive (mixed) models used to evaluate the influence of straightline carapace length (SCL, notch-to-tip) and age on region-specific growth rates for hawksbill sea turtles.
GI content data were examined from 116 stranded hawksbills that ranged in size from 5.2 to 82.5 cm SCL (mean ± SD: 22.6 ± 17.4 cm; Supplementary Table S3; Supplementary Figure 3). Florida hawksbills for which GI contents were examined ranged from 7.0 to 82.5 cm SCL at stranding, whereas Texas hawksbills ranged from 5.2 to 36.8 cm SCL at stranding. Of the 116 stranded turtles with GI contents, 53 had an unknown cause of death due to lack of evaluation or lack of external abnormalities, 43 experienced sudden death (e.g., trauma, cold-stunning, possible forced submergence), 17 likely died because of health-related issues (e.g., underweight, infections, accumulated epibiota), and 3 had evidence of both trauma and health issues.
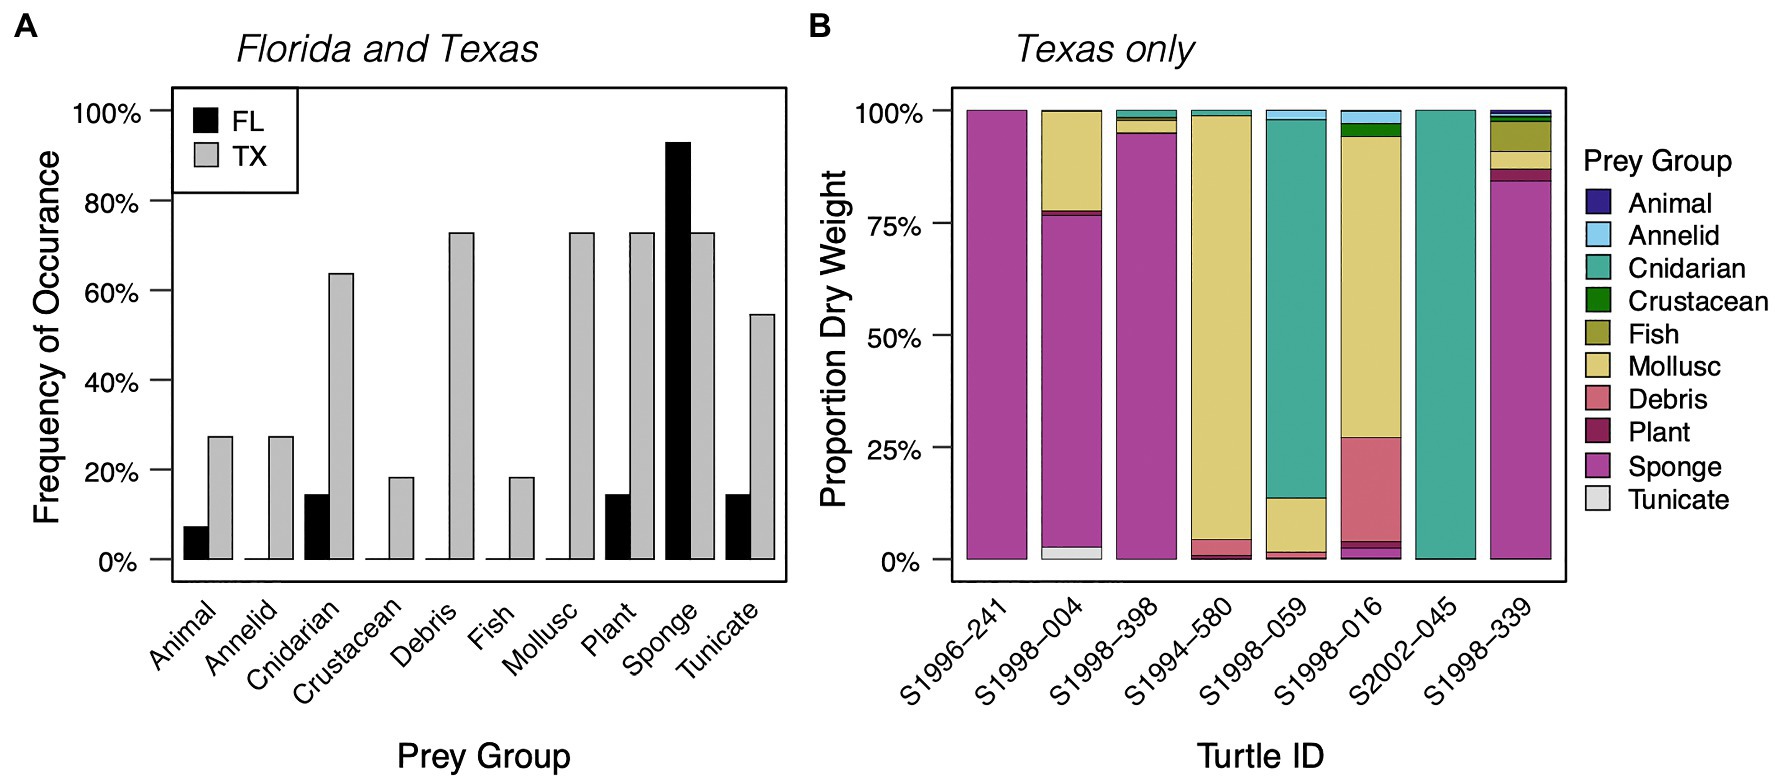
Figure 2. (A) Frequency of occurrence of prey items in diets of small neritic stage hawksbills (< 40 cm SCL) stranded along the coasts of Florida (FL, n = 14, 27.6 ± 5.6 cm SCL) and Texas (TX, n = 11, 27.0 ± 6.4 cm SCL). (B) Percent dry weight of prey items for 8 neritic stage hawksbills (12.8–36.8 cm SCL) stranded in Texas only. Neritic stage was assessed based on presence of benthic resources in GI contents.
Based on GI contents, we classified 39 turtles to the neritic life stage (FL: n = 28, TX: n = 11), 57 turtles to the oceanic life stage (FL: n = 24, TX: n = 33), 9 turtles as in-between oceanic and neritic life stages (i.e., intermediate; FL: n = 1, TX: n = 8), and 11 turtles whose diet could not be assigned to either life stages as unknown (Supplementary Figure S4). GI content results for turtles classified as oceanic, intermediate, and unknown are reported in the Supplementary material. Plastic was observed in the GI contents of 49% of all turtles examined in this study (57/116, FL: 24/54, TX: 33/62), including 75% (43/57) of oceanic stage turtles and 15% (6/39) of all neritic stage turtles.
For neritic stage hawksbills, sponges were the dominant prey observed in GI contents of turtles stranded in Florida (27 of 28 turtles; up to 4 L volume), whereas a mix of sponge and non-sponge prey were observed in Texas-stranded turtle GI contents (Figure 2A; Supplementary Tables S1, S2). Sponge diet was taxonomically classified for five of the 28 Florida-stranded turtles and primarily included the HMA sponges Geodia sp., Chondrilla nucula, and Chondrosia sp. and the LMA sponge Placospongia sp., which are among the most commonly observed sponge prey for hawksbills in the Caribbean (Meylan, 1988; Supplementary Table S5). Also recorded among FL-stranded turtle diets were hydroids (mostly attached to sponges) and benthic tunicates (2/28 individuals); the GI tract of one 27.7 cm SCL hawksbill contained ~1 L of the sessile, solitary tunicate Molgula sp., and little else other than a blade of Thalassia sp. seagrass.
Sponges were also frequently observed in the GI contents of neritic stage hawksbills stranded in Texas (8/11 individuals). However, for turtles where percent dry weight data were collected (n = 8), cnidarians (e.g., sea pens and anemones) contributed the greatest proportion of dietary dry weight (44.0%) followed by sponges (30.3%), molluscs (19.4%), and debris (3.6%; Supplementary Table S3). Based on percent dry weight, sponges comprised the dominant prey item for only four of eight Texas-stranded turtles (Figure 2B). The other sampled turtles had GI contents dominated by unidentified molluscs (n = 2) or cnidarians (sea pens, unidentified anemone; n = 2; Figure 2B). The three Texas-stranded turtles where GI contents were only qualitatively evaluated had diets dominated by the tunicate cf. Styela plicata (n = 2) or a Hypnea sp (n = 1), with lesser amounts of sponge and a variety of other prey items (see Supplementary Table S1). Texas hawksbill GI content dry weights were 1.25 to 29.14 g (mean ± SD: 9.45 ± 9.62 g). Importantly, only one of the 11 Texas-stranded and three of the 28 Florida-stranded neritic stage hawksbills died of apparent health-related issues (Supplementary Table S1), with the vast majority experiencing sudden or unknown causes of death. No Texas-stranded turtles >40 cm SCL were examined for this study, which strand infrequently in Texas. With the exception of two male hawksbills that stranded in Florida (82.0 and 82.5 cm SCL) all of the benthic-stage hawksbills represented in this diet analysis were likely immature based on size and data recorded on the necropsy reports.
Our literature review of hawksbill diet studies (n = 10, including Texas data herein) yielded 231 neritic stage turtles with GI contents evaluated as percent dry or wet weight. Methodologies included examination of GI contents of dead turtles and esophageal lavage and gastric lavage of living, captured turtles with study-specific sample sizes ranging from 5 to 54 turtles. For these turtles, the weighted mean percent mass of sponges observed in the GI contents was 61.8% (0.4–95.7% for individual studies) followed by cnidarians (27.4%, 0.0–94.0%), algae/plant (7.3%, 0.0–84.4%), and tunicates (1.6%, 0.0–32.5%; Table 3; Supplementary Table S4). Within individual studies, molluscs, arthropods, other animals, and debris (natural and anthropogenic) have generally constituted <5% of dietary weight. Across eight studies that classified sponge prey taxonomically, HMA and LMA sponges averaged 44.8% (0.4–67.4%) and 11.3% (0.2–30%) of total dietary weight, respectively (Table 3; Supplementary Table S4). 6.5% (0.00–76.1%) of sponge dietary weight could not be classified as HMA/LMA because the sponge prey were not taxonomically classified in the diet or they were classified but lacked HMA/LMA designations in literature. Twenty-seven sponge genera representing 11 sponge orders were observed in hawksbill GI contents across studies, with the genera Chondrilla and Geodia the most frequently observed and generally the greatest percent weight within individual studies (Supplementary Table S4). Note that although we have included results from studies using various methodologies in Supplementary Table S4, we urge caution in interpretation as to the equivalence of results. Esteban et al. (2020) noted small sample size and potential selective retention of larger items by esophageal papillae in the lavage method and reported on nontrivial differences in results using different methodologies at the same study site for green sea turtles (Chelonia mydas). In Supplementary Table S4, we note the pattern of greater predominance in sponges in studies involving examination of GI contents of dead turtles as compared to either gastric or esophageal lavage.
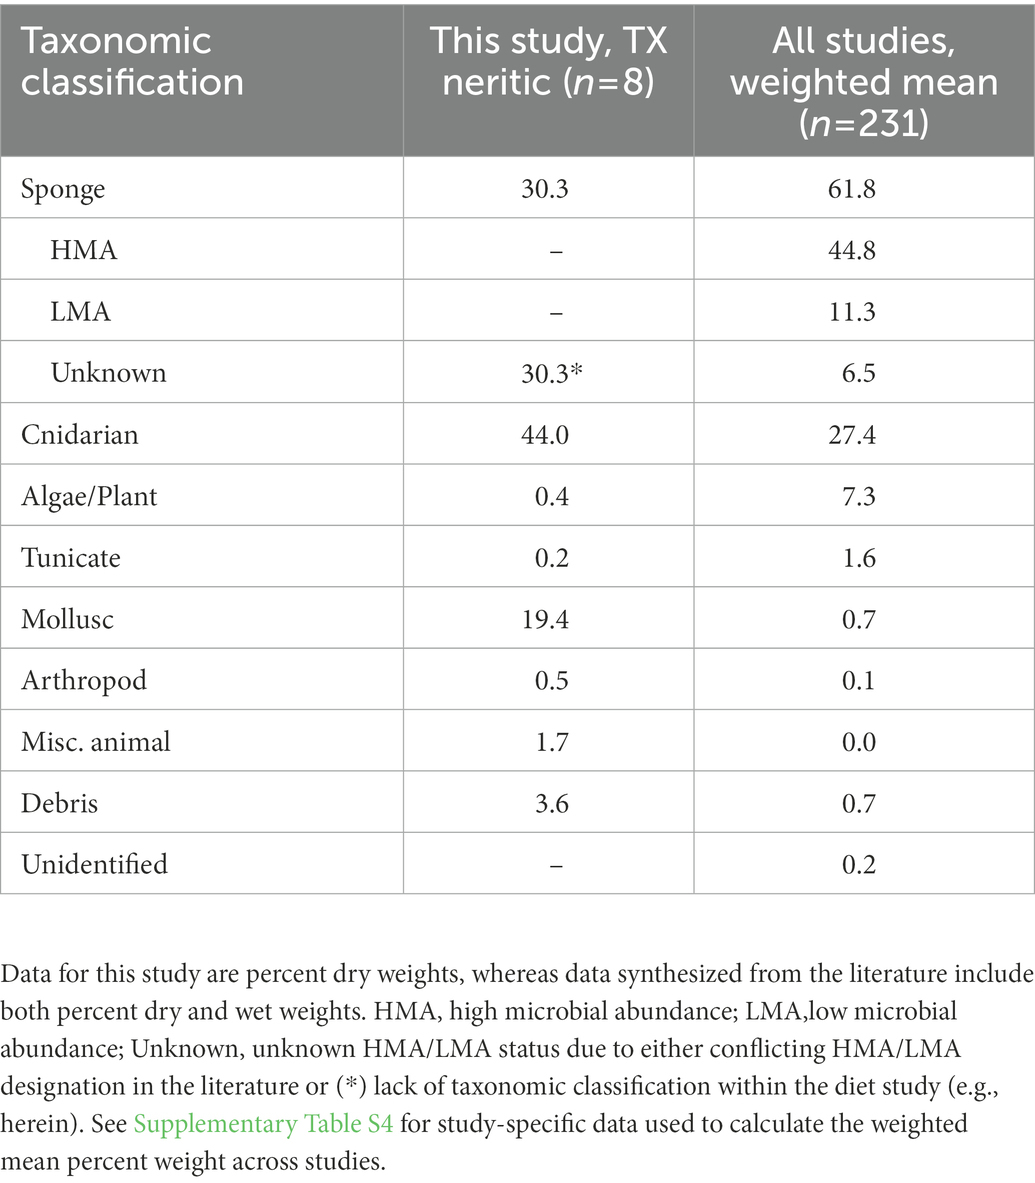
Table 3. Mean percent weight of all prey taxa recorded in hawksbill sea turtle gastrointestinal contents in this study and globally (n = 10 including this study).
Humeri sampled for stable isotopes were collected from 25 stranded hawksbill sea turtles (Supplementary Figure S1), which ranged in size from 24.0 to 68.1 cm SCL (mean ± SD: 40.1 ± 12.2 cm). Region-specific isotopic niche widths varied among turtles that stranded in south Florida (n = 34), west Florida (n = 13), and Texas (n = 20; Figure 3). Median Bayesian Standard Ellipse Area values (and 95% credible intervals) were largest for turtles in west Florida (8.4 ‰2, 4.3–13.9 ‰2) followed by south Florida (4.6 ‰2, 3.2–6.4 ‰2) then Texas turtles (2.7 ‰2, 1.6–4.1 ‰2). Hawksbills stranded in Texas had significantly higher δ15N values relative to hawksbills stranded in Florida for all amino acids except Threonine, where they were lower (Supplementary Figure S5). Amino acid δ13C values were generally similar among stranding regions (Supplementary Figure S5).
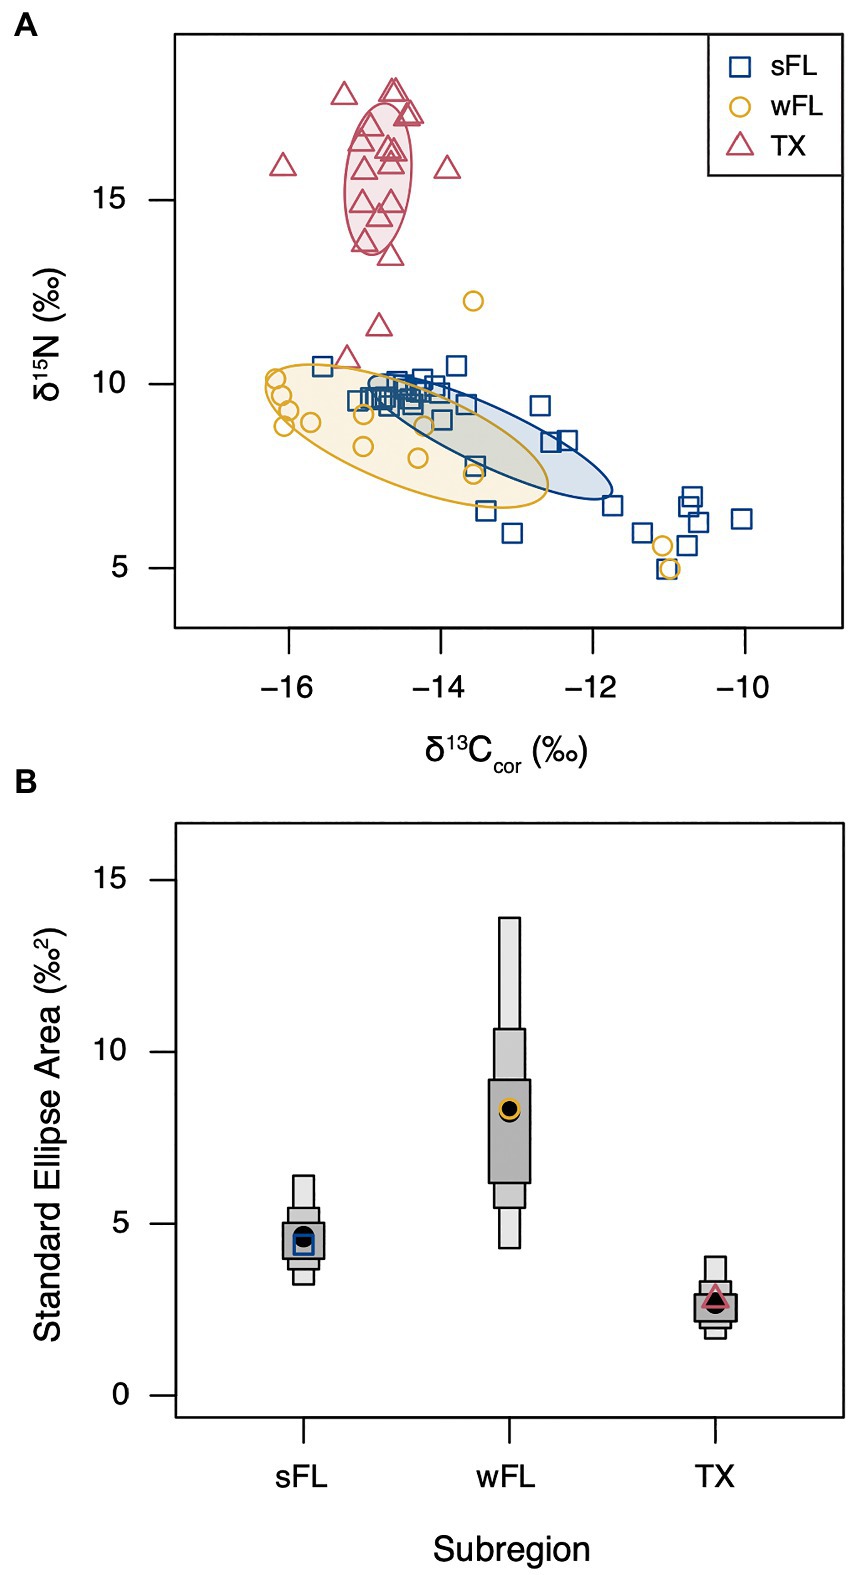
Figure 3. (A) Stable carbon (δ13Ccor) and nitrogen (δ15N) isotope values for neritic stage hawksbill sea turtle humerus bone growth layers by stranding region. Solid lines and shaded areas represent Standard Ellipse Areas corrected for sample size (SEAc). δ13Ccor values were corrected for the Suess Effect. (B) Bayesian Standard Ellipse Areas (SEA-B), where filled black circles represent the median SEA-B value, grey boxes represent the 50, 75, and 95% credible intervals, and open colored shapes represent the mean SEAc values from panel A. south Florida (sFL, blue, n = 34, 17.4–64.8 cm SCL): stranding location from Florida Keys to Biscayne Bay, FL; west Florida (wFL, gold, n = 13, 28.2–58.4 cm SCL): stranding locations from Fort Myers to Tampa, FL; Texas (TX, red, n = 20, 21.8–41.0 cm SCL): stranding locations from Aransas Bay to Mexico border.
We observed strong regional variability in TP estimates derived through both bulk stable isotope analysis and CSIA-AA (Figure 4; Supplementary Table S6). Median posterior TPbulk estimates were higher for Texas-stranded turtles (2.7–4.1) relative to turtles stranded in west Florida (2.3–3.1) and south Florida (2.0–3.0; Supplementary Table S6) and those patterns held for TPCSIA estimates as well (TX: 3.1–3.4, wFL: 2.0–2.6, sFL: 1.7–2.4; Supplementary Table S6). Pairwise comparisons of posterior distributions showed that there was generally a > 95% probability that Texas-stranded hawksbills had TPbulk estimates greater than south Florida- and west Florida-stranded hawksbills (Supplementary Table S7). There was also a 66 to 91% probability that west Florida hawksbills had TPbulk estimates greater than or equal to south Florida hawksbills (Supplementary Table S7). Texas hawksbills were estimated to forage 0.5 to 1.5 TPs higher than south Florida hawksbills, whereas west Florida hawksbills were estimated to forage 0.1 to 0.4 TPs higher than south Florida hawksbills (Figure 4; Supplementary Table S6).
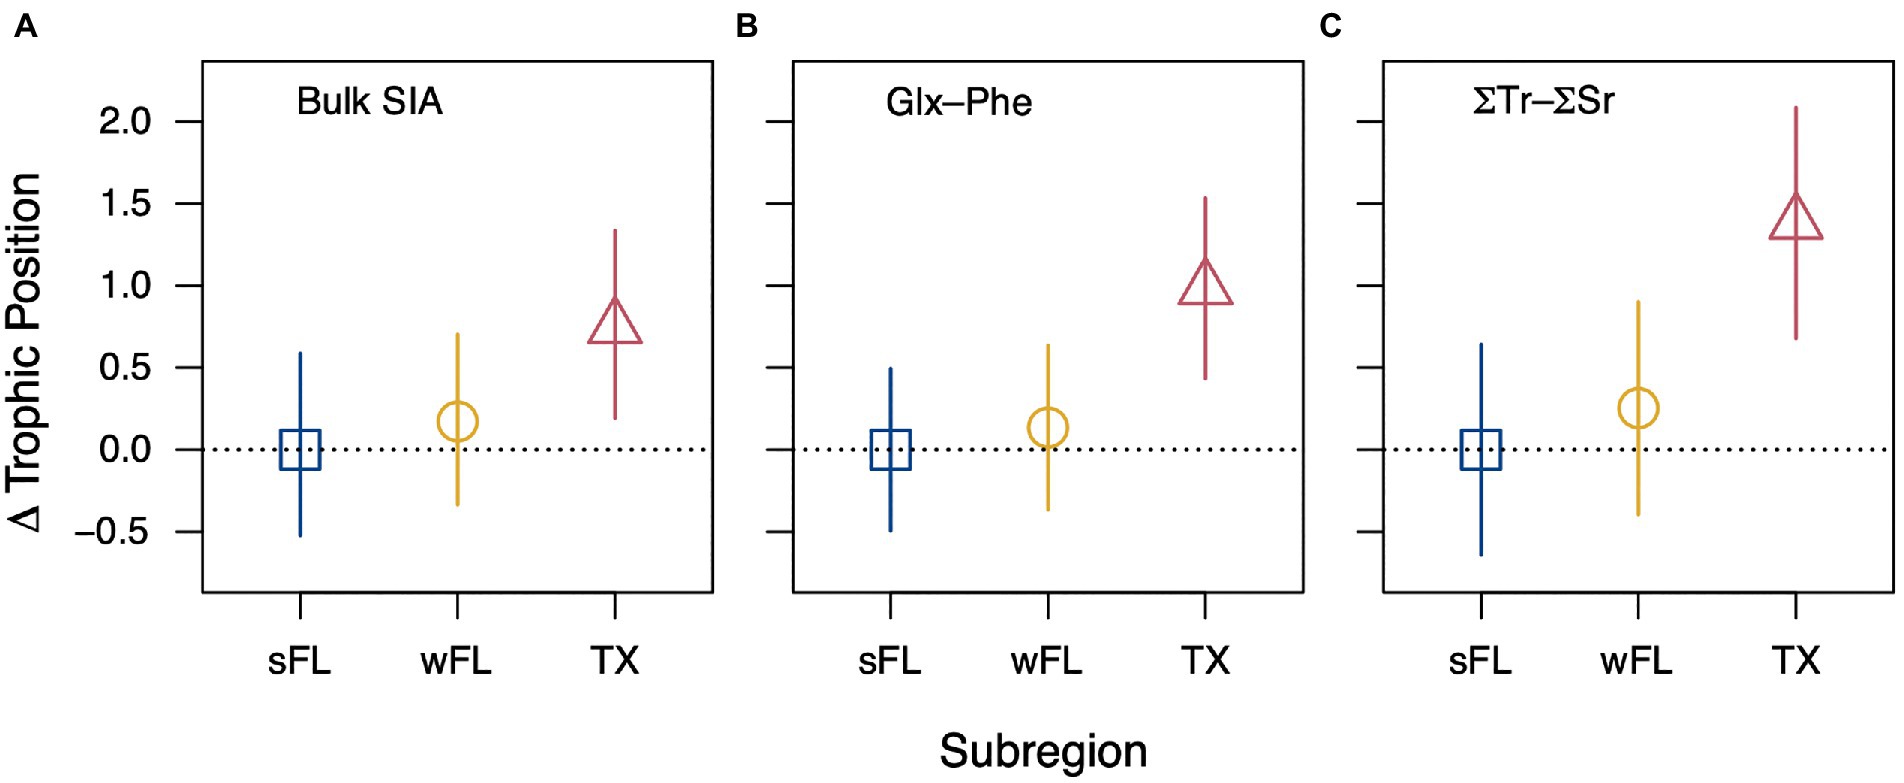
Figure 4. Relative difference in neritic stage hawksbill sea turtle trophic position estimates among stranding regions (within panels) calculated using three different trophic position equations (between panels). (A) Difference in median posterior trophic position estimates among regions with 95% credible intervals generated through Bayesian analysis of bulk δ15N data (south Florida, sFL: n = 34, 17.4–64.8 cm SCL; west Florida, wFL: n = 13, 28.2–58.4 cm SCL; Texas, TX: n = 20, 21.8–41.0 cm SCL). (B,C) Difference in CSIA-AA derived trophic position estimates among regions using (B) Glx and Phe only or (C) the weighted mean of multiple trophic (Ala, Val, Leu, Ile, Pro, and Glx) and source (Phe, Lys) amino acids (sFL: n = 6, 24.7–54.1 cm SCL; wFL: n = 5, 35.6–58.4 cm SCL; TX: n = 6, 25.2–41.0 cm SCL). Amino acid-specific trophic discrimination factors and β values were taken from Lemons et al. (2020) and Ramirez et al. (2021), respectively.
The linear discriminant analysis used to assess the likely carbon sources supporting hawksbill food webs had reclassification success rates of 100, 88, and 89% for prokaryotic bacteria, macroalgae, and eukaryotic microalgae, respectively. The first linear discriminant (LD1) explained 88% of the overall variation between groups (Supplementary Table S8), with the essential amino acids Ile, Leu, and Val most important for separating the three primary producer groups. The linear discriminant analysis classified all of the hawksbill turtles with eukaryotic microalgae, with >62% probability for all turtles and > 90% probability for 14 of 17 (82%) turtles (Figure 5; Supplementary Table S9). All HMA sponge data from Macartney et al. (2020) were classified with prokaryotic bacteria (Figure 5; Supplementary Table S9).
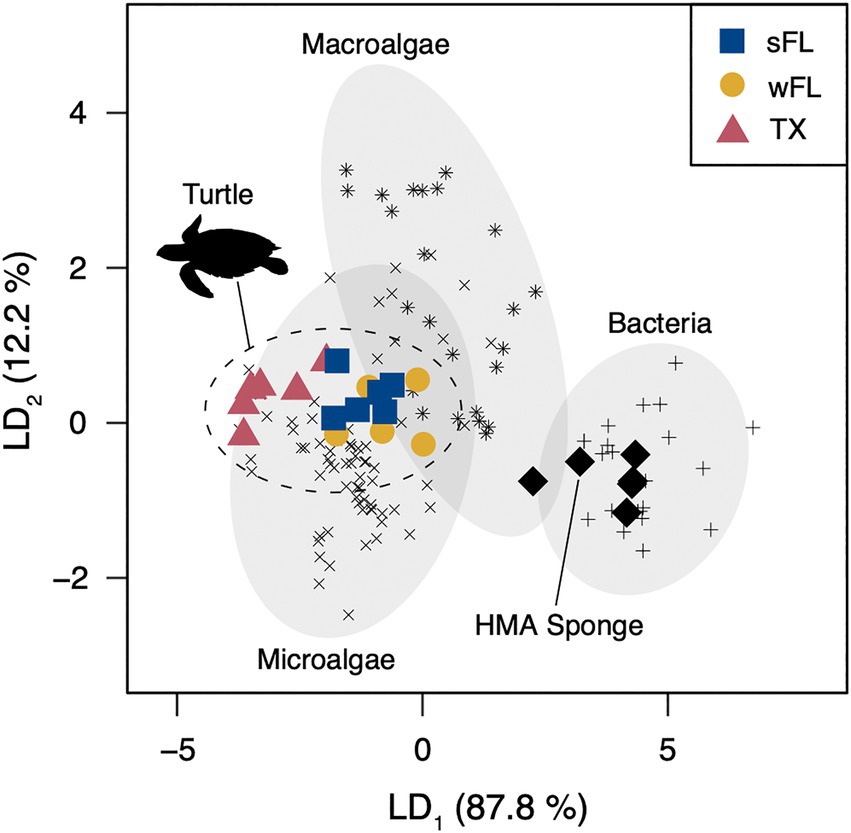
Figure 5. Linear discriminant analysis of the normalized δ13CEAA values (Thr, Val, Leu, Ile, and Phe) for stranded hawksbill sea turtles (sFL = south Florida, n = 6; wFL = west Florida, n = 5; TX = Texas, n = 6), Caribbean HMA sponges (n = 6), and three source end members: prokaryotic bacteria (plus symbol, n = 20), macroalgae (asterisk symbol, n = 24), and eukaryotic microalgae (cross symbol, n = 71). Dashed lines represent 95% confidence ellipses around each source group. Sponge data taken from Macartney et al. (2020). Source end member data taken from Larsen et al. (2013), McMahon et al. (2016), and Stahl (2021).
ΣV values ranged between 1.1 and 2.0 for hawksbill turtles (Supplementary Table S9). Mean ΣV was the lowest for south Florida-stranded turtles (1.3, range = 1.1–1.6) and highest for west Florida-stranded turtles (1.7, range 1.5–1.9). Texas-stranded turtle ΣV values were the most variable of the three groups (1.2–2.0).
Through integration of traditional gastrointestinal content analysis and advanced molecular isotope techniques, we show hawksbill sea turtles have regionally distinct diets that likely contribute to observed regional differences in somatic growth rates. Hawksbills in Texas foraged at higher trophic levels on varied invertebrate prey, whereas hawksbills in Florida had a sponge-dominated diet. Hawksbills in both regions foraged within eukaryotic-microalgal dominated food webs, which contrasts with expectations that hawksbills in Florida consume primarily microbially supported HMA sponges. Collectively, these results provide important context for understanding regional growth variation in hawksbills and suggest that divergence from typical sponge prey may be associated with increased energy expenditure, reduced foraging success, or nutritional stress. These results indicate that western North Atlantic hawksbills have multiple initial ontogenetic and demographic trajectories that are linked to differential dispersal patterns and associated prey fields.
Our analyses represent the first insights into hawksbill foraging ecology in Texas waters where this critically endangered species exhibits significantly reduced growth rates compared to hawksbills in Florida and the Caribbean. Prior to the current synthesis, the only GI content data recorded for hawksbills in Texas comprised marine debris content for a single stranded turtle (Plotkin and Amos, 1988). Though a limited sample size (n = 11), our neritic stage hawksbill data for turtles stranded in Texas clearly demonstrate much larger contributions of non-sponge invertebrate prey relative to turtles in Florida, both based on percent frequency of occurrence and percent dry weight and after restricting percent frequency of occurrence comparisons to similarly sized neritic stage turtles (< 40 cm SCL; Figure 2A). This observation of higher dietary diversity for Texas-stranded hawksbills is further supported by our isotopic analyses of different stranded turtles that suggest Texas hawksbills forage 0.5 to 1.5 TPs higher in the food web than Florida conspecifics. Our Texas hawksbill δ13CEAA fingerprints, which overlap eukaryotic microalgae, also align with expectations of foraging in diverse food webs supported by pelagic production sources. Importantly, our stable isotope data reflect multiple years of prey consumption and energy assimilation following the oceanic-to-neritic habitat shift and are thus buffered from temporal biases associated with GI content analysis. Although other studies have reported significant hawksbill dietary plasticity (e.g., León and Bjorndal, 2002; Rincon-Diaz et al., 2011), Texas-stranded hawksbill diets may be uniquely diverse, including significant contributions of sponges, molluscs, cnidarians, crustaceans, and possibly shrimp and fish presumably consumed as fisheries discards. The consumption of this broader range of energy sources would be expected to yield increased mean foraging trophic level relative to a sponge-dominated diet, as observed herein. Importantly, our observation of regional differences in dietary breadth among similarly sized neritic stage juveniles <40 cm SCL suggests that Texas hawksbill dietary plasticity may not be due to general patterns of post-pelagic turtles foraging on more diverse prey before shifting to spongivory, which has been proposed to explain consumption of non-sponge prey in this species (Bjorndal, 1997; van Dam and Diez, 1997; Bjorndal and Bolten, 2010). This pattern of regional diet plasticity follows recent findings for Kemp’s ridley sea turtles (Lepidochelys kempii) that also appear to forager at higher trophic levels in Texas than elsewhere in the Gulf of Mexico and United States Atlantic Coast (Ramirez et al., 2020). Expanded study of sea turtle diets and habitat use in Texas coastal waters are needed, including additional direct comparisons of GI contents and tissue stable isotope values, to further characterize the causes and consequences of this dietary plasticity.
Primary sponge consumption for hawksbills in Florida observed herein extends our limited understanding of hawksbill trophic ecology in United States tropical waters. To date, only three studies have detailed hawksbill foraging aggregations and behaviors in the U.S., all conducted within south Florida and suggestive of high importance of sponges to hawksbill diets. In-water studies of hawksbills at an offshore reef tract in Palm Beach County observed long-term residency and high site fidelity within coral reef hard-bottom habitats (Wood et al., 2013), where turtles targeted primarily sponges for consumption (Meylan, 1984; Wood et al., 2017). Within the Florida Keys, hawksbills primarily associated with rock rubble jetty structures extensively colonized with sponges and hard and soft corals (Gorham et al., 2014). In our study, we observed sponges in the GI contents of >80% of neritic stage hawksbills stranded in Florida, with infrequent observations of other prey items. As primary consumers, sponges would be expected to have TPs of ~2, yielding a TP of ~3 for their consumers. Our median TPbulk estimates of 2.6 to 3.1 based on a trophic discrimination factor of 3.2 ‰ for hawksbills in Florida most closely align with this assumption. The lone hawksbill sampled for both GI contents and stable isotopes in our study, a turtle stranded near St. Petersburg, FL, had GI contents packed with ~4 liters of sponges (Chondrosia sp. and Geodia sp.) and TPbulk estimates of ~3.5. Mean TPCSIA estimates for Florida (1.7–2.6) were surprisingly low for a secondary consumer. In a recent application of CSIA-AA to a deep-sea food web, Hanz et al. (2022) observed TPCSIA estimates of 2–2.5 for LMA sponges and 1.3 for HMA sponges, akin to a primary producer (TP = 1). These results, combined with those herein, demonstrate that it may be uniquely challenging to estimate TPCSIA for sponge predators and calculate exact TPCSIA differences between hawksbills in Florida and Texas because the isotope dynamics of sponges are not well understood. Specifically, it appears there may be an invisible stable nitrogen isotope trophic transfer for HMA sponge predators, as seen with heterotrophic protists (Gutiérrez-Rodríguez et al., 2014), which warrants further investigation to refine application of these techniques in sponge food webs.
While our study supports previous work highlighting the importance of sponges to the diet of hawksbill sea turtles in Florida, our δ13CEAA fingerprinting analyses suggest that Florida hawksbill foraging patterns may be more complex than previously assumed. GI content studies, including Florida GI content data herein, demonstrate that hawksbills have clear preferences for a narrow range of sponges from the orders Chondrillida and Tetractinellida, particularly HMA sponges of the genera Chondrilla and Geodia (Meylan, 1988; Von Brandis et al., 2014; Pawlik et al., 2018; Supplementary Table S5). HMA sponges host dense communities of microbial symbionts that can contribute up to ~60% of their heterotrophic diet (Rix et al., 2020). As a result, HMA sponges, and by proxy their consumers, would be expected to have δ13CEAA fingerprints similar to prokaryotic bacteria (Macartney et al., 2020; Figure 5). In contrast, LMA sponges, which derive 99% of their energy through filter feeding, should have δ13CEAA fingerprints similar to eukaryotic microalgae or macroalgae (Rix et al., 2020; Hudspith et al., 2021). Our linear discriminant analysis suggested that eukaryotic microalgae were the primary carbon source at the base of Florida hawksbill food webs. This conclusion is further supported by our observation of ΣV values <2 for hawksbills, particularly those from south Florida (1.1–1.6), which indicates minimal bacterial re-synthesis of organic matter. For comparison, the HMA sponge M. grandis exhibited an ΣV value of 3.0 (Shih et al., 2020), which fits expectations of significant contributions of primarily microbially derived energy.
Our finding that microalgae are the primary production source at the base of Florida hawksbill food webs does not agree well with observed taxonomic patterns of spongivory in hawksbill sea turtles or other consumers. Specifically, our results suggest that (1) hawksbills in Florida derive a greater proportion of energy from LMA sponges or other invertebrate prey than previously thought and/or (2) current understanding of sponge nutritional ecology and isotope dynamics is incomplete. Interestingly, our synthesis of GI content studies revealed that, on average globally, hawksbill diet composition comprises ~11% LMA sponges and ~ 38% non-sponge prey, with the remainder being HMA sponges. As a result, on average, ~ 49% of hawksbill diets may consist of prey from food chains where eukaryotic algae would likely be the primary basal energy source. From a mass balance perspective, a scenario where diets comprise 50% HMA sponges (60/40 bacterial/algal δ13CEAA fingerprint) and 50% LMA sponge or other invertebrate (100% algal δ13CEAA fingerprint) would yield consumer δ13CEAA fingerprints heavily skewed toward algae, as observed herein for Florida hawksbills. Our results may thus indicate that over annual time scales, Florida hawksbills assimilate energy from non-trivial amounts of LMA sponges and other invertebrates—either through active or passive consumption—that facilitates transfer of substantial algal-derived energy to their tissues. Alternatively, it is possible that HMA sponges consumed by Florida hawksbills derive less energy from their bacterial symbiont than has been suggested for HMA sponges studied to date. In the first study of sponge amino acid isotope dynamics, Shih et al. (2020) demonstrated that HMA sponges may derive amino acids primarily from direct transfer from microbial symbionts to sponge host tissue, similar to patterns observed in scleractinian corals and their endosymbionts (Rädecker et al., 2015). However, scientists have only recently begun quantifying microbial symbiont contribution to heterotrophy in sponges (Rix et al., 2020; Hudspith et al., 2021), exclusively in species not consumed by hawksbills. HMA/LMA status has also not been directly assessed at the species level for the vast majority of sponges known to be consumed by hawksbills, requiring HMA/LMA designations herein to be primarily based on genus level classification. Additionally, like corals (e.g., Fox et al., 2019; Wall et al., 2021), it is possible that mechanisms of sponge energy acquisition (microbial transfer vs. heterotrophic feeding) vary under different environmental conditions. There is thus a pressing need to further study the trophic and isotope dynamics of sponge species commonly consumed by predators so that we can better characterize energy flow and food web dynamics in these systems and predict system responses to environmental change.
Regionally variable diets of hawksbill sea turtles within United States coastal waters aligns with a growing body of evidence that their foraging behaviors are more complex than classically considered and that gross habitat type may influence hawksbill dietary choices (e.g., León and Bjorndal, 2002; Bell, 2013). For example, sponge consumption is high on coral reefs and other hard bottom habitats, which are generally considered one of the primary foraging habitats for hawksbills in tropical waters globally because they are favorable to sponge growth (e.g., Limpus, 1992; Diez and van Dam, 2002; Houghton et al., 2003; Meylan and Redlow, 2006). Within Florida’s coastal waters, hawksbill occurrence aligns closely with the extent of the Florida Reef Tract and other hard-bottom communities in the southeastern Gulf of Mexico, Florida Keys, and along the southeastern coast of Florida, particularly in association with sponges or sponge gardens (Meylan and Redlow, 2006; Wood et al., 2013; Gorham et al., 2014). However, around the world hawksbills also forage in other hard bottom habitats where sponges can be found, although at lower abundances, such as seagrass beds and even mangrove-fringed estuaries (in the Eastern Pacific; Bjorndal and Bolten, 2010; Gaos et al., 2012). In the Eastern Pacific, where hawksbills associate with rocky reefs, mangrove estuaries, and fjord-like embayments, tunicates and algae/plants comprise a non-trivial component of hawksbill diet in addition to sponges (Carrión-Cortez et al., 2013; Martínez-Estévez et al., 2022). Much like the Eastern Pacific, Texas coastal waters generally lack coral reefs with the exception of those occurring >100 km from the Texas coastline in the Flower Garden Banks National Marine Sanctuary (Schmahl et al., 2008). Instead, Texas coastal waters are broadly characterized by open soft bottom bays, seagrass beds, oyster reefs, hypersaline lagoons, and mangrove estuaries, each of which support prey assemblages distinct from coral reefs (and each other) and likely explain the relatively broad Texas-stranded turtle diets observed herein. Hawksbills in Texas have also been observed along rock jetties and shipping channels (D. Shaver, pers. comm.), habitats that promote omnivory in otherwise herbivorous green sea turtles (Howell and Shaver, 2021).
Beyond gross habitat type, temperature may also contribute to regional hawksbill diet variation in United States waters. A rich body of research has shown that abiotic factors can disproportionately influence organismal behavior at cool range edges reviewed in Paquette and Hargreaves (2021). For example, at higher latitudes, animal matter features prominently in the diets of herbivorous green turtles (Esteban et al., 2020), suggesting that temperature may be an important driver of trophic plasticity in sea turtles towards higher trophic levels, as observed for the Texas hawksbills in this study. Texas coastal waters experience much stronger seasonal shifts in temperature (16–30°C) than south Florida (22–30°C). As the most tropical of the seven sea turtle species, hawksbills are maladapted to cooler environmental conditions and may be unable to forage consistently during winter periods in Texas, which may impact growth and survival rates. Herein, eight of the 11 neritic stage turtles from Texas stranded in boreal winter months (December to March). However, sponges were the dominant prey taxa for two of these turtles as well as 11 neritic stage turtles stranded during the winter near Tampa, Florida, which also experiences seasonal temperature fluctuations. As a result, the extent to which temperature influences hawksbill diets relative to habitat type warrants further investigation.
Hawksbill dietary plasticity may also be driven by interactions between prey availability and selectivity. Even within coral reef habitats, hawksbills display complex dietary preferences. In a number of cases, hawksbills have been observed consuming prey at rates disproportionate to their abundance in the environment, including both specific sponge species (e.g., Spirastrella coccinea, Myriastra kalitetilla: León and Bjorndal, 2002; Melophlus ruber; Berube et al., 2012) as well as non-sponge prey such as the corallimorph Ricordea florida (León and Bjorndal, 2002; Rincon-Diaz et al., 2011), zoanthids (Mayor et al., 1997), and algae (Bell, 2013). Additionally, video behavioral observations show hawksbills spend considerable time investigating and biting—but not chewing—individual prey items (Dunbar et al., 2008; Wood et al., 2017), which suggests prey selectivity. However, in other cases, local abundance is thought to explain relatively high consumption rates of certain sponge (e.g., Chondrilla nucula: León and Bjorndal, 2002) and non-sponge (e.g., algae Lobophora variegata: Rincon-Diaz et al., 2011; zoanthids: Mayor et al., 1997) prey. Herein, the diets of individual neritic stage turtles stranded in Texas tended to be dominated by single prey types (Figure 2B). The extent to which these patterns reflect selective, opportunistic, or desperation feeding warrants further investigation as inferences herein are necessarily limited due to small samples sizes and biases of GI content analysis to recently consumed prey. However, the general agreement of the GI content and stable isotope data, the latter which reflect annual foraging, suggest these diverse diets are more likely reflective of foraging habitat than individual stranding condition. Furthermore, for sponge-eating hawksbills, the presence/absence of chemical defenses likely plays a key role in sponge selectivity given the overrepresentation of palatable, chemically undefended sponge taxa in hawksbill diets (Pawlik et al., 2018). However, palatability as a driver of sponge prey selectivity has yet to be directly evaluated and warrants further investigation, particularly with respect to potetnial LMA sponge consumption by hawksbills in Florida.
Ultimately, hawksbill trophic plasticity in United States waters is likely driven primarily by gross habitat type, which dictates the breadth of resources available to individual turtles. Coastal Texas’s turbid, temperate waters and lack of tropical coral reefs and hard bottom habitats likely restrict the extent of suitable habitat needed for hawksbill prey sponges to thrive. As a result, there may be insufficient sponge density in Texas waters to support exclusive sponge consumption by hawksbills over annual time scales, necessitating consumption of a broad range of prey to meet metabolic demands. Expanded study of hawksbill foraging patterns and prey fields in Florida and Texas are needed, including longitudinal studies of individual foraging patterns through in-situ sampling or sequential isotopic analyses of accretionary tissues (Vander Zanden et al., 2010; sensu Turner Tomaszewicz et al., 2016), to further refine drivers of dietary plasticity and their demographic consequences.
Our multi-metric study of hawksbill dietary plasticity offers unique insight into the relationship between resource use and demography, suggesting that dietary plasticity in hawksbill turtles may contribute to regional somatic growth variation and thus come with substantial individual and population fitness costs both in the Wider Caribbean Region and globally. Notably, the relatively slow growth rates for small (30–40 cm: 3.5 cm yr−1) and large (50–70 cm: 2.1–2.6 cm yr−1; Table 1) neritic stage hawksbills stranded in Texas are similar to those reported for hawksbills from other regions where consumption of non-sponge prey is common, including the Eastern Pacific (30–40 cm: 3.1–3.6 cm yr−1, 40–50 cm: 1.3–3.2 cm yr−1; Llamas et al., 2017), Great Barrier Reef (50–70 cm: 1.9–2.5 cm yr−1; Bell and Pike, 2012), and Northern Territory, Australia (50–60 cm: 2.4 cm yr−1; Limpus, 1992; Whiting and Guinea, 1998). This is in stark contrast with hawksbill growth rates in Florida and the Caribbean that can average 5–9 cm yr−1 for small neritic juveniles (30–40 cm) and 3–6 cm yr−1 for large neritic juveniles (50–70 cm; reviewed in Avens et al., 2021). However, in the Bahamas, hawksbills inhabiting what are considered suboptimal seagrass habitats have similar growth rates to hawksbills in Florida and other Caribbean locations (Bjorndal and Bolten, 2010), illustrating that perceived habitat quality alone may be insufficient in explaining demographic variation. Somatic growth patterns are influenced by complex interactions between genetic and environmental (physical and biological) factors resulting in variable manifestation of phenotypic traits such as prey preferences, timing of ontogenetic diet shifts, and metabolism (e.g., Yamahira and Conover, 2002; Bourret et al., 2016). Consumption of diets atypical for a given life stage can result in imbalance of macronutrients, element ratios, and essential micro-nutrients that in turn affect physiological processes determining the extent of energy resources devoted to maintenance and somatic growth (e.g., Lukas et al., 2011; Canosa and Bertucci, 2020). For example, if hawksbills forage on non-sponge prey because of low foraging success or low sponge availability, this may increase foraging time and energy expenditure and lead to nutritional imbalances that impact growth rates. Variability in individual and population performance in suboptimal habitats and at range limits may ultimately lead to diverse population outcomes and represent a new challenge to the persistence and recovery of this critically endangered species. Our work will hopefully stimulate new lines of research into hawksbill foraging behavior in relation to prey availability, habitat features, and demography to further constrain the mechanistic drivers of divergent hawksbill population dynamics. For example, expanded CSIA-AA sampling to all hawksbill turtle bone growth layers coupled with growth increment-specific hormone analyses (Fleming et al., 2018) would greatly expand understanding of links between foraging trophic level, nutritional stress, and somatic growth.
Ultimately, Texas coastal waters may represent a sink habitat for some hawksbills belonging to certain populations in the western North Atlantic Ocean, which may have important implications for regional population dynamics. Juvenile hawksbills captured or stranded in United States waters disproportionately originate from rookeries on the Yucatán Peninsula (TX: 85–93%, FL: 56–75%; Bowen et al., 2007; Blumenthal et al., 2009; Wood et al., 2013; Gorham et al., 2014), which hosts multiple, genetically distinct rookeries (Labastida-Estrada et al., 2019). Connectivity of these Mexican rookeries to foraging grounds in Texas and Florida, combined with its limited genetic connectivity with other rookeries in the Caribbean (Blumenthal et al., 2009), make their conservation uniquely important to species persistence and recovery in the greater west Atlantic (Meylan, 1999). This is especially true as an unknown fraction of juveniles from these rookeries disperse to suboptimal habitats in Texas (Bowen et al., 2007) where somatic growth rates are reduced, which may have negative effects on population fitness through reduced survival rates, reproductive rates, or delayed maturity (Avens et al., 2021). This may ultimately be an example of a marine ecological trap (Swearer et al., 2021), with some hawksbills mistakenly preferring habitats where their fitness is reduced. However, unlike green sea turtles in Bermuda, which may be temporarily trapped within degrading habitats due to life history constraints (Meylan et al., 2022), hawksbills in Texas are presumably capable of migrating along the coastline to more suitable foraging habitat in Mexico or Florida, which may explain why few hawksbills >40 cm SCL are observed in Texas coastal waters (Amos, 1989; Shaver, 1998; Meylan and Redlow, 2006). Further assessment of whether the absence of these larger hawksbills reflects reduced survival or emigration, as well as study of sea turtle settlement cues, would greatly advance our understanding of fitness-related consequences of this regional growth variability. The regionally specific dietary plasticity results from our study, coupled with future work to quantify the proportion of hawksbills that disperse from the Yucatán rookery to different foraging grounds, would greatly improve modeling efforts to predict differential population trajectories in the region within a meta-population theory framework (Grimm et al., 2003).
The original contributions presented in the study are publicly available. This data can be found here: https://doi.org/10.5061/dryad.xgxd254kt.
Ethical review and approval was not required for the animal study because study was conducted on dead, stranded animals, which does not require IACUC approval. Research was authorized by USFWS ESA permit number TE-676379-5 issued to the National Marine Fisheries Service’s Southeast Fisheries Science Center.
MR, LA, AM, and KM conceived the study. MR, LA, and JC collected and analyzed the growth data. MR, AM, DS, PM, WT, LH, and BS collected and analyzed the GI content data. MR, AS, and KM collected and analyzed the stable isotope data. MR, AM, and KM led the writing of the manuscript. All authors contributed to manuscript revision and gave final approval for publication.
MR was supported by the NSF Postdoctoral Research Fellowship in Biology under grant number 1907144. Funding for the CSIA-AA portion of this work was provided through URI Foundation support to KM.
We are grateful to members of the National Sea Turtle Stranding and Salvage Network who collected the samples and necropsy data that made this study possible, especially participants in Florida and Texas, in particular to A. F. Amos, A. Foley, P. Plotkin, B. Schroeder, and J. Walker. In addition, we are grateful to S. Pomponi and J. Rudloe for their assistance with identification of forage items recovered during necropsy. We also thank L. R. Goshe assistance with skeletochronological analyses. Research was authorized by USFWS ESA permit number TE-676379-5 issued to the National Marine Fisheries Service’s Southeast Fisheries Science Center.
The authors declare that the research was conducted in the absence of any commercial or financial relationships that could be construed as a potential conflict of interest.
All claims expressed in this article are solely those of the authors and do not necessarily represent those of their affiliated organizations, or those of the publisher, the editors and the reviewers. Any product that may be evaluated in this article, or claim that may be made by its manufacturer, is not guaranteed or endorsed by the publisher.
The Supplementary material for this article can be found online at: https://www.frontiersin.org/articles/10.3389/fevo.2023.1050582/full#supplementary-material
Amos, A. F. (1989). “The occurrence of hawksbills Eretmochelys imbricata along the Texas coast ” in Proceedings of the Ninth Annual Workshop on Sea Turtle Conservation and Biology, eds. S. A. Eckert, K. L. Eckert, and T. H. Richardson. NOAA Technical Memorandum NMFS-SWFSC-54, 9–11.
Arthur, K. E., Kelez, S., Larsen, T., Choy, C. A., and Popp, B. N. (2014). Tracing the biosynthetic source of essential amino acids in marine turtles using δ13C fingerprints. Ecology 95, 1285–1293. doi: 10.1890/13-0263.1
Avens, L., Ramirez, M., Goshe, L., Clark, J., Meylan, A., Teas, W., et al. (2021). Hawksbill Sea turtle life-stage durations, somatic growth patterns, and age at maturation. Endang. Species Res. 45, 127–145. doi: 10.3354/esr01123
Avens, L., and Snover, M. L. (2013). “Age and age estimation in sea turtles,” in The biology of sea turtles. eds. J. Wyneken, K. J. Lohmann, and J. A. Musick (Boca Raton, FL: CRC Press), 97–134.
Bell, I. (2013). Algivory in hawksbill turtles: Eretmochelys imbricata food selection within a foraging area on the northern great barrier reef. Mar. Ecol. 34, 43–55. doi: 10.1111/j.1439-0485.2012.00522.x
Bell, I., and Pike, D. (2012). Somatic growth rates of hawksbill turtles Eretmochelys imbricata in a northern great barrier reef foraging area. Mar. Ecol. Prog. Ser. 446, 275–283. doi: 10.3354/meps09481
Berube, M. D., Dunbar, S. G., Rützler, K., and Hayes, W. K. (2012). Home range and foraging ecology of juvenile hawksbill sea turtles (Eretmochelys imbricata) on inshore reefs of Honduras. Chelonian Conserv. Biol. 11, 33–43. doi: 10.2744/CCB-0898.1
Bjorndal, K. A. (1997). “Foraging ecology and nutrition of sea turtles,” in The biology of sea turtles. eds. P. L. Lutz and J. A. Musick (Boca Raton, FL: CRC Press), 199–231.
Bjorndal, K. A., and Bolten, A. B. (2010). Hawksbill Sea turtles in seagrass pastures: success in a peripheral habitat. Mar. Biol. 157, 135–145. doi: 10.1007/s00227-009-1304-0
Bjorndal, K. A., Chaloupka, M., Saba, V. S., Diez, C. E., van Dam, R. P., Krueger, B. H., et al. (2016). Somatic growth dynamics of West Atlantic hawksbill sea turtles: a spatio-temporal perspective. Ecosphere 7:e01279. doi: 10.1002/ecs2.1279
Blumenthal, J. M., Abreu-Grobois, F. A., Austin, T. J., Broderick, A. C., Bruford, M. W., Coyne, M. S., et al. (2009). Turtle groups or turtle soup: dispersal patterns of hawksbill turtles in the Caribbean. Mol. Ecol. 18, 4841–4853. doi: 10.1111/j.1365-294X.2009.04403.x
Bourret, S. L., Caudill, C. C., and Keefer, M. L. (2016). Diversity of juvenile Chinook salmon life history pathways. Rev. Fish. Biol. Fish. 26, 375–403. doi: 10.1007/s11160-016-9432-3
Bowen, B. W., Grant, W. S., Hillis-Starr, Z., Shaver, D. J., Bjorndal, K. A., Bolten, A. B., et al. (2007). Mixed-stock analysis reveals the migrations of juvenile hawksbill turtles (Eretmochelys imbricata) in the Caribbean Sea. Mol. Ecol. 16, 49–60. doi: 10.1111/j.1365-294X.2006.03096.x
Brault, E., Koch, P., Costa, D., McCarthy, M., Hückstädt, L., Goetz, K., et al. (2019). Trophic position and foraging ecology of Ross, Weddell, and crabeater seals revealed by compound-specific isotope analysis. Mar. Ecol. Prog. Ser. 611, 1–18. doi: 10.3354/meps12856
Canosa, L. F., and Bertucci, J. I. (2020). Nutrient regulation of somatic growth in teleost fish. The interaction between somatic growth, feeding and metabolism. Mol. Cell. Endocrinol. 518:111029. doi: 10.1016/j.mce.2020.111029
Carr, A., and Stancyk, S. (1975). Observations on the ecology and survival outlook of the hawksbill turtle. Biol. Conserv. 8, 161–172. doi: 10.1016/0006-3207(75)90060-9
Carrión-Cortez, J., Canales-Cerro, C., Arauz, R., and Riosmena-Rodríguez, R. (2013). Habitat use and diet of juvenile eastern Pacific hawksbill turtles (Eretmochelys imbricata) in the North Pacific coast of Costa Rica. Chelonian Conserv. Biol. 12, 235–245. doi: 10.2744/CCB-1024.1
Chikaraishi, Y., Ogawa, N. O., Kashiyama, Y., Takano, Y., Suga, H., Tomitani, A., et al. (2009). Determination of aquatic food-web structure based on compound-specific nitrogen isotopic composition of amino acids. Limnol. Oceanogr. Methods 7, 740–750. doi: 10.4319/lom.2009.7.740
de Goeij, J. M., Moodley, L., Houtekamer, M., Carballeira, N. M., and van Duyl, F. C. (2008). Tracing 13C-enriched dissolved and particulate organic carbon in the bacteria-containing coral reef sponge Halisarca caerulea: evidence for DOM-feeding. Limnol. Oceanogr. 53, 1376–1386. doi: 10.4319/lo.2008.53.4.1376
Dias, P. C. (1996). Sources and sinks in population biology. Trends Ecol. Evol. 11, 326–330. doi: 10.1016/0169-5347(96)10037-9
Diez, C., and van Dam, R. (2002). Habitat effect on hawksbill turtle growth rates on feeding grounds at Mona and Monito Islands, Puerto Rico. Mar. Ecol. Prog. Ser. 234, 301–309. doi: 10.3354/meps234301
Dunbar, S. G., Salinas, L., and Stevenson, L. (2008). In-water observations of recently released juvenile hawksbills (Eretmochelys imbricata). Mar. Turt. Newsl. 121, 5–9.
Esteban, N., Mortimer, J. A., Stokes, H. J., Laloë, J.-O., Unsworth, R. K. F., and Hays, G. C. (2020). A global review of green turtle diet: sea surface temperature as a potential driver of omnivory levels. Mar. Biol. 167:183. doi: 10.1007/s00227-020-03786-8
Fleming, A. H., Kellar, N. M., Allen, C. D., and Kurle, C. M. (2018). The utility of combining stable isotope and hormone analyses for marine megafauna research. Front. Mar. Sci. 5:338. doi: 10.3389/fmars.2018.00338
Fox, M. D., Elliott Smith, E. A., Smith, J. E., and Newsome, S. D. (2019). Trophic plasticity in a common reef-building coral: insights from δ13C analysis of essential amino acids. Funct. Ecol. 33, 2203–2214. doi: 10.1111/1365-2435.13441
Francis, R. (1990). Back-calculation of fish length: a critical review. J. Fish Biol. 36, 883–902. doi: 10.1111/j.1095-8649.1990.tb05636.x
Fretwell, S. D., and Lucas, H. L. (1969). On territorial behavior and other factors influencing habitat distribution in birds. Acta Biotheor. 19, 16–36. doi: 10.1007/BF01601953
Gaos, A. R., Lewison, R. L., Yañez, I. L., Wallace, B. P., Liles, M. J., Nichols, W. J., et al. (2012). Shifting the life-history paradigm: discovery of novel habitat use by hawksbill turtles. Biol. Lett. 8, 54–56. doi: 10.1098/rsbl.2011.0603
Gorham, J. C., Clark, D. R., Bresette, M. J., Bagley, D. A., Keske, C. L., Traxler, S. L., et al. (2014). Characterization of a subtropical hawksbill sea turtle (Eretmochelys imbricata) assemblage utilizing shallow water natural and artificial habitats in the Florida keys. PLoS One 9:e114171. doi: 10.1371/journal.pone.0114171
Grimm, V., Reise, K., and Strasser, M. (2003). Marine meta-populations: a useful concept? Helgol. Mar. Res. 56, 222–228. doi: 10.1007/s10152-002-0121-3
Gutiérrez-Rodríguez, A., Décima, M., Popp, B. N., and Landry, M. R. (2014). Isotopic invisibility of protozoan trophic steps in marine food webs. Limnol. Oceanogr. 59, 1590–1598. doi: 10.4319/lo.2014.59.5.1590
Hanz, U., Riekenberg, P., de Kluijver, A., van der Meer, M., Middelburg, J. J., de Goeij, J. M., et al. (2022). The important role of sponges in carbon and nitrogen cycling in a deep-sea biological hotspot. Funct. Ecol. 36, 2188–2199. doi: 10.1111/1365-2435.14117
Heinrichs, J. A., Lawler, J. J., and Schumaker, N. H. (2016). Intrinsic and extrinsic drivers of source–sink dynamics. Ecol. Evol. 6, 892–904. doi: 10.1002/ece3.2029
Hentschel, U., Usher, K. M., and Taylor, M. W. (2006). Marine sponges as microbial fermenters: marine sponges as microbial fermenters. FEMS Microbiol. Ecol. 55, 167–177. doi: 10.1111/j.1574-6941.2005.00046.x
Houghton, J. D. R., Callow, M. J., and Hays, G. C. (2003). Habitat utilization by juvenile hawksbill turtles (Eretmochelys imbricata, Linnaeus, 1766) around a shallow water coral reef. J. Nat. Hist. 37, 1269–1280. doi: 10.1080/00222930110104276
Howell, L. N., and Shaver, D. J. (2021). Foraging habits of green sea turtles (Chelonia mydas) in the northwestern Gulf of Mexico. Front. Mar. Sci. 8:658368. doi: 10.3389/fmars.2021.658368
Hudspith, M., van der Sprong, J., Rix, L., Víg, D., Schoorl, J., and de Goeij, J. (2021). Quantifying sponge host and microbial symbiont contribution to dissolved organic matter uptake through cell separation. Mar. Ecol. Prog. Ser. 670, 1–13. doi: 10.3354/meps13789
Jackson, A. L., Inger, R., Parnell, A. C., and Bearhop, S. (2011). Comparing isotopic niche widths among and within communities: SIBER – stable isotope Bayesian ellipses in R. J. Anim. Ecol. 80, 595–602. doi: 10.1111/j.1365-2656.2011.01806.x
Jones, T. T., and Seminoff, J. A. (2013). “Feeding biology: advances from field-based observations, physiological studies, and molecular techniques,” in The biology of sea turtles. eds. J. Wyneken, K. J. Lohmann, and J. A. Musick (Boca Raton, FL: CRC Press), 211–247.
Labastida-Estrada, E., Machkour-M’Rabet, S., Díaz-Jaimes, P., Cedeño-Vázquez, J. R., and Hénaut, Y. (2019). Genetic structure, origin, and connectivity between nesting and foraging areas of hawksbill turtles of the Yucatan peninsula: a study for conservation and management. Aquat. Conserv. 29, 211–222. doi: 10.1002/aqc.2999
Larsen, T., Bach, L. T., Salvatteci, R., Wang, Y. V., Andersen, N., Ventura, M., et al. (2015). Assessing the potential of amino acid 13C patterns as a carbon source tracer in marine sediments: effects of algal growth conditions and sedimentary diagenesis. Biogeosciences 12, 4979–4992. doi: 10.5194/bg-12-4979-2015
Larsen, T., Ventura, M., Andersen, N., O’Brien, D. M., Piatkowski, U., and McCarthy, M. D. (2013). Tracing carbon sources through aquatic and terrestrial food webs using amino acid stable isotope fingerprinting. PLoS One 8:e73441. doi: 10.1371/journal.pone.0073441
Lemons, G. E., Lewison, R. L., Seminoff, J. A., Coppenrath, C. M., and Popp, B. N. (2020). Nitrogen isotope fractionation of amino acids from a controlled study on the green turtle (Chelonia mydas): expanding beyond Glx/Phe for trophic position. Mar. Biol. 167:149. doi: 10.1007/s00227-020-03745-3
León, Y. M., and Bjorndal, K. A. (2002). Selective feeding in the hawksbill turtle, an important predator in coral reef ecosystems. Mar. Ecol. Prog. Ser. 245, 249–258. doi: 10.3354/meps245249
Limpus, C. J. (1992). The hawksbill turtle, Eretmochelys imbricata, in Queensland: population structure within a southern great barrier reef feeding ground. Wildl. Res. 19, 489–506. doi: 10.1071/WR9920489
Llamas, I., Flores, E., Abrego, M., Seminoff, J., Hart, C., Pena, B., et al. (2017). Distribution, size range and growth rates of hawksbill turtles at a major foraging ground in the eastern Pacific Ocean. lajar 45, 597–605. doi: 10.3856/vol45-issue3-fulltext-9
Lorrain, A., Graham, B. S., Popp, B. N., Allain, V., Olson, R. J., Hunt, B. P. V., et al. (2015). Nitrogen isotopic baselines and implications for estimating foraging habitat and trophic position of yellowfin tuna in the Indian and Pacific oceans. Deep-Sea Res. II Top. Stud. Oceanogr. 113, 188–198. doi: 10.1016/j.dsr2.2014.02.003
Lukas, M., Sperfeld, E., and Wacker, A. (2011). Growth rate hypothesis does not apply across co-limiting conditions: cholesterol limitation affects phosphorus homoeostasis of an aquatic herbivore: Co-limitation affects consumer’s stoichiometry. Funct. Ecol. 25, 1206–1214. doi: 10.1111/j.1365-2435.2011.01876.x
Macartney, K. J., Slattery, M., and Lesser, M. P. (2020). Trophic ecology of Caribbean sponges in the mesophotic zone. Limnol. Oceanogr. 66, 1113–1124. doi: 10.1002/lno.11668
Martínez-Estévez, L., Steller, D. L., Zilliacus, K. M., Cuevas Amador, J. P., Amador, F. C., Szuta, D., et al. (2022). Foraging ecology of critically endangered eastern Pacific hawksbill sea turtles (Eretmochelys imbricata) in the Gulf of California, Mexico. Mar. Environ. Res. 174:105532. doi: 10.1016/j.marenvres.2021.105532
Matthews, C. J. D., and Ferguson, S. H. (2014). Spatial segregation and similar trophic-level diet among eastern Canadian Arctic/north-West Atlantic killer whales inferred from bulk and compound specific isotopic analysis. J. Mar. Biol. Ass. 94, 1343–1355. doi: 10.1017/S0025315413001379
Mayor, P. A., Phillips, B., and Hillis-Starr, Z.-M. (1997). Results of the stomach content analysis on the juvenile hawksbill turtles of Buck Island reef National Monument, USVI in Proceedings of the Seventeenth Annual Symposium on Sea Turtle Biology and Conservation, eds. S. P. Epperly and J. Braun, NOAA Technical Memorandum NMFS -SEFSC-415, 244–247.
McCarthy, M. D., Benner, R., Lee, C., and Fogel, M. L. (2007). Amino acid nitrogen isotopic fractionation patterns as indicators of heterotrophy in plankton, particulate, and dissolved organic matter. Geochim. Cosmochim. Acta 71, 4727–4744. doi: 10.1016/j.gca.2007.06.061
McClelland, J. W., and Montoya, J. P. (2002). Trophic relationships and the nitrogen isotopic composition of amino acids in plankton. Ecology 83, 2173–2180. doi: 10.1890/0012-9658(2002)083[2173:TRATNI]2.0.CO;2
McMahon, K. W., Fogel, M. L., Elsdon, T. S., and Thorrold, S. R. (2010). Carbon isotope fractionation of amino acids in fish muscle reflects biosynthesis and isotopic routing from dietary protein. J. Anim. Ecol. 79, 1132–1141. doi: 10.1111/j.1365-2656.2010.01722.x
McMahon, K. W., and McCarthy, M. D. (2016). Embracing variability in amino acid δ15N fractionation: mechanisms, implications, and applications for trophic ecology. Ecosphere 7:e01511. doi: 10.1002/ecs2.1511
McMahon, K. W., and Newsome, S. D. (2019). “Amino acid isotope analysis: a new frontier in studies of animal migration and foraging ecology,” in Tracking animal migration with stable isotopes. eds. K. A. Hobson and L. I. Wassenaar (London, UK: Academic Press), 173–190. doi: 10.1016/B978-0-12-814723-8.00007-6
McMahon, K. W., Thorrold, S. R., Houghton, L. A., and Berumen, M. L. (2016). Tracing carbon flow through coral reef food webs using a compound-specific stable isotope approach. Oecologia 180, 809–821. doi: 10.1007/s00442-015-3475-3
Meylan, A. B. (1984). Feeding ecology of the hawksbill turtle (Eretmochelys imbricata): Spongivory as a feeding niche in the coral reef community. University of Florida, 128.
Meylan, A. (1988). Spongivory in hawksbill turtles: a diet of glass. Science 239, 393–395. doi: 10.1126/science.239.4838.393
Meylan, A. B. (1999). Status of the hawksbill turtle (Eretmochelys imbricata) in the Caribbean region. Chelonian Conserv. Biol. 3:8.
Meylan, P. A., Hardy, R. F., Gray, J. A., and Meylan, A. B. (2022). A half-century of demographic changes in a green turtle (Chelonia mydas) foraging aggregation during an era of seagrass decline. Mar. Biol. 169:74. doi: 10.1007/s00227-022-04056-5
Meylan, P. A., Meylan, A. B., and Gray, J. A. (2011). The ecology and migrations of sea turtles 8. Tests of the developmental habitat hypothesis. Bull. Am. Mus. Nat. Hist. 357, 1–70. doi: 10.1206/357.1
Meylan, A., and Redlow, A. (2006). Eretmochelys imbricata - hawksbill turtle. Chelonian Res. Monogr. 3, 105–127.
Newsome, S. D., Martinez del Rio, C., Bearhop, S., and Phillips, D. L. (2007). A niche for isotopic ecology. Front. Ecol. Environ. 5, 429–436. doi: 10.1890/060150.1
Nielsen, J. M., Popp, B. N., and Winder, M. (2015). Meta-analysis of amino acid stable nitrogen isotope ratios for estimating trophic position in marine organisms. Oecologia 178, 631–642. doi: 10.1007/s00442-015-3305-7
O’Connell, T. C., and Collins, M. J. (2018). Comment on ecological niche of Neanderthals from spy cave revealed by nitrogen isotopes of individual amino acids in collagen. J. Hum. Evol. 117, 53–55. doi: 10.1016/j.jhevol.2017.05.006
Paquette, A., and Hargreaves, A. L. (2021). Biotic interactions are more often important at species’ warm versus cool range edges. Ecol. Lett. 24, 2427–2438. doi: 10.1111/ele.13864
Parham, J. F., and Zug, G. R. (1997). Age and growth of loggerhead sea turtles (Caretta caretta) of coastal Georgia: an assessment of skeletochronological age-estimates. Bull. Mar. Sci. 61, 287–304.
Pawlik, J. R., Loh, T.-L., and McMurray, S. E. (2018). A review of bottom-up vs. top-down control of sponges on Caribbean fore-reefs: what’s old, what’s new, and future directions. PeerJ 6:e4343. doi: 10.7717/peerj.4343
Pinheiro, J., Bates, D., DebRoy, S., and Sarkar, D., R Core Team (2017). Nlme: linear and nonlinera mixed effects models. R Package 3, 1–131.
Plotkin, P. T., and Amos, A. F. (1988). Entanglement and ingestion of marine debris by sea turtles stranded along the South Texas coast in Proceedings of the eighth annual workshop on sea turtle conservation and biology, ed. B. A. Schroeder, NOAA Technical Memorandum NMFS -SEFSC-214, 79–82.
Post, D. M., Layman, C. A., Arrington, D. A., Takimoto, G., Quattrochi, J., and Montaña, C. G. (2007). Getting to the fat of the matter: models, methods and assumptions for dealing with lipids in stable isotope analyses. Oecologia 152, 179–189. doi: 10.1007/s00442-006-0630-x
Quezada-Romegialli, C., Jackson, A. L., Hayden, B., Kahilainen, K. K., Lopes, C., and Harrod, C. (2018). Trophic position, an R package for the Bayesian estimation of trophic position from consumer stable isotope ratios. Methods Ecol. Evol. 9, 1592–1599. doi: 10.1111/2041-210X.13009
R Core Team (2021). R: A language and environment for statistical computing. R Foundation for Statistical Computing, Vienna, Austria.
Rädecker, N., Pogoreutz, C., Voolstra, C. R., Wiedenmann, J., and Wild, C. (2015). Nitrogen cycling in corals: the key to understanding holobiont functioning? Trends Microbiol. 23, 490–497. doi: 10.1016/j.tim.2015.03.008
Ramirez, M. D., Avens, L., Goshe, L. R., Snover, M. L., Cook, M., and Heppell, S. S. (2020). Regional variation in Kemp’s ridley sea turtle diet composition and its potential relationship with somatic growth. Front. Mar. Sci. 7:253. doi: 10.3389/fmars.2020.00253
Ramirez, M. D., Besser, A. C., Newsome, S. D., and McMahon, K. W. (2021). Meta-analysis of primary producer amino acid δ15N values and their influence on trophic position estimation. Methods Ecol. Evol. 12, 1750–1767. doi: 10.1111/2041-210X.13678
Rincon-Diaz, M. P., Diez, C. E., Van Dam, R. P., and Sabat, A. M. (2011). Foraging selectivity of the hawksbill sea turtle (Eretmochelys imbricata) in the Culebra archipelago, Puerto Rico. J. Herpetol. 45, 277–282. doi: 10.1670/10-120.1
Rix, L., Ribes, M., Coma, R., Jahn, M. T., de Goeij, J. M., van Oevelen, D., et al. (2020). Heterotrophy in the earliest gut: a single-cell view of heterotrophic carbon and nitrogen assimilation in sponge-microbe symbioses. ISME J. 14, 2554–2567. doi: 10.1038/s41396-020-0706-3
Salmon, M., and Scholl, J. (2014). Allometric growth in juvenile marine turtles: possible role as an antipredator adaptation. Zoology 117, 131–138. doi: 10.1016/j.zool.2013.11.004
Scharf, F., Juanes, F., and Rountree, R. (2000). Predator size-prey size relationships of marine fish predators: interspecific variation and effects of ontogeny and body size on trophic-niche breadth. Mar. Ecol. Prog. Ser. 208, 229–248. doi: 10.3354/meps208229
Schmahl, G. P., Hickerson, E. L., and Precht, W. F. (2008). “Biology and ecology of coral reefs and coral communities in the flower garden banks region, northwestern Gulf of Mexico” in Coral reefs of the United States. eds. B. M. Riegl and R. E. Dodge (Dordrecht: Springer Netherlands), 221–261. doi: 10.1007/978-1-4020-6847-8_6
Schoeninger, M. J., and DeNiro, M. J. (1984). Nitrogen and carbon isotopic composition of bone collagen from marine and terrestrial animals. Geochim. Cosmochim. Acta 48, 625–639. doi: 10.1016/0016-7037(84)90091-7
Shaver, D. J. (1998). “Sea turtle strandings along the Texas coast, 1980-1994,” in Characteristics and causes of Texas marine strandings. ed. R. Zimmerman NOAA Technical Memorandum NMFS 143, 57–72.
Shih, J. L., Selph, K. E., Wall, C. B., Wallsgrove, N. J., Lesser, M. P., and Popp, B. N. (2020). Trophic ecology of the tropical Pacific sponge Mycale grandis inferred from amino acid compound-specific isotopic analyses. Microb. Ecol. 79, 495–510. doi: 10.1007/s00248-019-01410-x
Spiess, A.-N. (2018). Propagate: propagation of uncertainty. R Package 1.0–6. Available at: https://CRAN.R-project.org/package=propagate.
Stahl, A. (2021). Identifying novel isotopic tracers of marine primary producers to study food web carbon cycles. University of Rhode Island. 94. Available at: https://digitalcommons.uri.edu/theses/1936/.
Sutherland, W. J. (1997). From individual behaviour to population ecology. Oxford: Oxford University Press Available at: https://www.journals.uchicago.edu/doi/10.1086/419724 (Accessed July 26, 2022).
Swearer, S. E., Morris, R. L., Barrett, L. T., Sievers, M., Dempster, T., and Hale, R. (2021). An overview of ecological traps in marine ecosystems. Front. Ecol. Environ. 19, 234–242. doi: 10.1002/fee.2322
Turner Tomaszewicz, C. N., Seminoff, J. A., Avens, L., and Kurle, C. M. (2016). Methods for sampling sequential annual bone growth layers for stable isotope analysis. Methods Ecol. Evol. 7, 556–564. doi: 10.1111/2041-210X.12522
Turner Tomaszewicz, C. N., Seminoff, J. A., Price, M., and Kurle, C. M. (2017). Stable isotope discrimination factors and between-tissue isotope comparisons for bone and skin from captive and wild green sea turtles (Chelonia mydas). Rapid Commun. Mass Spectrom. 31, 1903–1914. doi: 10.1002/rcm.7974
van Dam, R. P., and Diez, C. E. (1997). Predation by hawksbill turtles on sponges at Mona Island, Puerto Rico in Proceedings of the 8th International Coral Reef Symposium, eds. H. A. Lessios and I. G. Macintyre. Smithsonian Tropical Research Institute, 1421–1426.
Vander Zanden, H. B., Bjorndal, K. A., Reich, K. J., and Bolten, A. B. (2010). Individual specialists in a generalist population: results from a long-term stable isotope series. Biol. Lett. 6, 711–714. doi: 10.1098/rsbl.2010.0124
Volkham, J. K., and Tanoue, E. (2002). Chemical and biological studies of particulate organic matter in the ocean. Curr. Biol. 7, R126–R279. doi: 10.1016/S0960-9822(97)70976-X
Von Brandis, R. G., Mortimer, J. A., Reilly, B. K., van Soest, R. W. M., and Branch, G. M. (2014). Diet composition of hawksbill turtles (Eretmochelys imbricata) in the Republic of Seychelles. Western Indian Ocean J. Mar. Sci. 13, 81–91.
Wall, C. B., Wallsgrove, N. J., Gates, R. D., and Popp, B. N. (2021). Amino acid δ13C and δ15N analyses reveal distinct species-specific patterns of trophic plasticity in a marine symbiosis. Limnol. Oceanogr. 66, 2033–2050. doi: 10.1002/lno.11742
Whiting, S. D., and Guinea, M. L. (1998). A large population of slow growing hawksbills: preliminary results from a wild foraging population in fog bay, Northern Territory in Proceedings of the seventeenth annual symposium on sea turtle biology and conservation. Miami, FL: NOAA Tech Memo NMFS–SEFSC-415, 104–107.
Wood, S. N. (2006). Generalized additive models: An introduction with R. Boca Raton, FL: Chapman and Hall/CRC, doi: 10.1201/9781420010404.
Wood, L. D., Hardy, R., Meylan, P. A., and Meylan, A. B. (2013). Characterization of a hawksbill turtle (Eretmochelys imbricata) foraging aggregation in a high-latitude reef community in southeastern Florida, United States. Herpetol. Conserv. Biol. 8, 258–275.
Wood, L. D., Milton, S. L., and Maple, T. L. (2017). Foraging behavior of wild hawksbill turtles (Eretmochelys imbricata) in Palm Beach County, Florida, United States. Chelonian Conserv. Biol. 16, 70–75. doi: 10.2744/CCB-1242.1
Keywords: amino acid, carbon isotope fingerprinting, compound-specific isotope analysis, Eretmochelys imbricata, trophic position, somatic growth, spongivory, sponge (porifera)
Citation: Ramirez MD, Avens L, Meylan AB, Shaver DJ, Stahl AR, Meylan PA, Clark JM, Howell LN, Stacy BA, Teas WG and McMahon KW (2023) Dietary plasticity linked to divergent growth trajectories in a critically endangered sea turtle. Front. Ecol. Evol. 11:1050582. doi: 10.3389/fevo.2023.1050582
Edited by:
Seth Newsome, University of New Mexico, United StatesReviewed by:
Kyung-Hoon Shin, Hanyang University, Republic of KoreaCopyright © 2023 Ramirez, Avens, Meylan, Shaver, Stahl, Meylan, Clark, Howell, Stacy, Teas and McMahon. This is an open-access article distributed under the terms of the Creative Commons Attribution License (CC BY). The use, distribution or reproduction in other forums is permitted, provided the original author(s) and the copyright owner(s) are credited and that the original publication in this journal is cited, in accordance with accepted academic practice. No use, distribution or reproduction is permitted which does not comply with these terms.
*Correspondence: Matthew D. Ramirez, ✉ cmFtaXJlem1kQHVuY3cuZWR1
Disclaimer: All claims expressed in this article are solely those of the authors and do not necessarily represent those of their affiliated organizations, or those of the publisher, the editors and the reviewers. Any product that may be evaluated in this article or claim that may be made by its manufacturer is not guaranteed or endorsed by the publisher.
Research integrity at Frontiers
Learn more about the work of our research integrity team to safeguard the quality of each article we publish.