 Yisong Zhao
 Kun Yang1,2†
 Yi Luo
 Zhenyu Yu
- 1Faculty of Geography, Yunnan Normal University, Kunming, China
- 2GIS Technology Research Center of Resource and Environment in Western China, Ministry of Education, Yunnan Normal University, Kunming, China
The surface thermal environment plays an important role in urban sustainable development and ecological environment protection. Existing researches mainly focus on the formation process and mechanism of the surface thermal environment and lack the analysis of its effect on the lake ecological environment under the influence of human activities. Therefore, based on the analysis of the variations in land surface temperature (LST) and lake surface water temperature (LSWT) of Dianchi Lake at multiple spatio-temporal scales, this study evaluated the response of LSWT by using the methods of spatial influence, the center of gravity migration trajectory, trend analysis, and correlation analysis. The results show that: (1) Urbanization has a greater warming effect on LSWT than on LST, and the warming effect at night is greater than that at daytime. From 2001 to 2018, the warming trend of LSWT in daytime and night was 0.01°C/a and 0.02°C/a, respectively, while the cooling trend of LST in daytime was −0.03°C/a and the warming trend of LST in night was 0.01°C/a. (2) Areas with high human activity are warming faster, both in the eastern and northern coastal areas of lake and the heavily urbanized sub-basins. (3) The spatial influence of LST and LSWT are highly correlated, and the response of the outer buffer in the range of 2 km is obvious, and the direction of gravity center migration trajectory is consistent. The results are of great significance for the control and improvement of urban heat island and ecological environment protection of Dianchi Lake in Kunming and can provide data support and decision support for urban planning, promoting the construction of the ecological civilization city in Kunming, and reducing the accumulation of urban surface heat.
Introduction
With the acceleration of urbanization, human social and economic activities are profoundly changing the urban thermal environment. On the one hand, impervious surfaces largely replace the original natural surfaces, and impervious materials with low specific heat capacity and high reflectivity aggravate the heat concentration of the city. On the other hand, with the surge in urban population and car ownership, and the increase of artificial heat sources, the overall level of urban heat emission is increasing day by day. Urban thermal environment change has an important impact on human settlement environment, health of residents, urban energy and resource consumption, and ecosystem process evolution (He et al., 2021; Luo et al., 2021). The status of the urban thermal environment is one of the important indicators to measure the sustainable development of the urban ecological economy, and the quantitative study of the urban thermal environment has attracted extensive attention (You et al., 2021; Yang et al., 2021b; Yu et al., 2022b). Existing studies mainly take the urban city as a whole to analyze the contribution of urban functional areas to the spatial distribution of urban thermal environment (Yang et al., 2021c; Chen et al., 2022; Yu et al., 2022a,b), the impact of landscape structure on the urban surface heat island effect (Weng et al., 2004; Li et al., 2011; Connors et al., 2012; Estoque et al., 2017) and urban ventilation (Yang et al., 2019a, 2020, 2021a; Ren et al., 2022; Xie et al., 2022).
As a relatively independent geographical unit, there exists a “land-air-water” energy exchange in the basin. The additional heat accumulation brought by urbanization changes the local microclimate cycle and precipitation distribution patterns (Kustas et al., 2003; Wang et al., 2012; Weber et al., 2017). For many years, the research on urban heat island and urban waterlogging caused by this has attracted extensive attention. Studies have demonstrated that large water bodies in cities contribute to urban heat island mitigation (Xu et al., 2013). It can be inferred from this water effect that the thermal effect brought by urbanization not only affects the land but also affects the water body and the most direct effect is to heat the water body. In terms of runoff, existing studies have shown that after the first rainstorm in summer, the temperature of urban surface runoff will rise by 3°C, and the temperature of storm storage pond will rise by 2°C (Adamowski and Prokoph, 2013; Somers et al., 2013). Janke et al. developed a hydrothermal model to quantify the impact on stream temperature of urban development in watersheds of cold water streams (Janke et al., 2009). Yi et al. revealed the heating effect of different underlying surface types on runoff water temperature from the micro scale, and found that impervious surface has a great influence on runoff temperature (Yi et al., 2019). Yang et al. discussed the influence of precipitation events on LSWT under the background of different ISC levels and different growth rates of impervious surface area (ISA; Yang et al., 2021d). These studies analyzed the short-term impact effects of runoff and river channel warming caused by a single rainfall event in the background of urbanization at the micro scale, while the long-term effects of urbanization on lake temperature at the macro scale are not widely studied. Lake water temperature is an important parameter for the evaluation of lake physical, biological, climatic processes, and aquatic ecological environment. Lake water temperature increase will change the structure and quantity of lake species, lead to a series of water environment problems, such as algae explosion, fish and shrimp death, and affect the sustainable development of cities (Connors et al., 2012; Layden et al., 2015; Zhang et al., 2015; Dong et al., 2016; Hirst et al., 2017). Therefore, it is necessary to carry out long-term lake response research and has important practical significance.
Because of the contact with the atmosphere and heat exchange directly, lake surface water temperature (LSWT) is the most sensitive and direct manifestation of the change in lake water temperature (Sharma et al., 2015; Wan et al., 2017; Liu et al., 2019). Based on remote sensing technology, we can easily obtain the long time series and large area synchronous observation of surface temperature data. LSWT obtained by remote sensing technology is the most important data source for lake water temperature research. Studies on LSWT are mainly focused on the Tibetan plateau and other areas far away from cities that also serve as an indicator of the ecological environment (Zhang et al., 2014; Wan et al., 2017, 2018; Wang et al., 2019), focusing on the impact of climate change on LSWT (Kraemer et al., 2015; Magee and Wu, 2017; Woolway and Merchant, 2018). Studies on urban lakes mainly focus on hydrology and water quality effects in the context of urbanization (Zhao et al., 2013; Luo et al., 2017, 2018), while there are few studies on the surface water temperature of urban lakes (Liu et al., 2015). Yang et al. conducted a comparative analysis of LSWT of 11 lakes on the Yunnan-Guizhou Plateau and found that human activities are one of the important driving factors of the surface temperature of urban and semi-urban lakes (Yang et al., 2019b). A study on the influence of surface thermal environment changes on LSWT in urban lakes at a inner-lake scale has not been carried out.
In this study, the Dianchi Lake basin was selected as the research object and the MODIS LST product (MOD11A2) was used as the main data source to systematically analyze the thermal environment characteristics of the Dianchi Lake basin and reveal the LSWT response under the background of human activities. The aim is to explore the characteristics and response rules of LST and LSWT in the Dianchi Lake basin and provide decision support for water resources regulation, water pollution control, and urban sustainable development. The Dianchi Lake basin is a shallow lake, and the vertical stratification of the lake is not obvious. In this study, only the surface water temperature of the lake was studied, the vertical variation of lake water temperature and temperature diffusion effect was not considered.
Materials and methods
Study area
Dianchi Lake is the largest freshwater lake in Yunnan-Guizhou Plateau and the sixth largest in China, it belongs to the Jinsha River system of the Yangtze River Basin. The average water depth is 5.3 m, the lake area is 309 km2, and the storage capacity is 1.56 billion m3. As a large urban lake, Dianchi Lake plays an important role in the urban development of Kunming and is an important water source for the survival and development of Kunming city. It has a variety of water functions such as flood control, regulation and storage, irrigation, landscape, climate regulation, and standby water source, and is known as the “Pearl of the Plateau.” The Dianchi Lake basin is a typical subtropical plateau monsoon climate, with a small annual temperature difference and distinct dry and rainy seasons. It’s not too hot in summer due to the influence of the southwest warm and humid airflow over the Indian Ocean. In winter, the northern mountains block the cold airflow from the north to the south, and the winter climate is mild, so Kunming has a pleasant climate like spring all year round. Dianchi Lake basin is a faulted tectonic basin. Formed by the basin’s water confluence, it is surrounded by mountains and the terrain gradually descends in a ladder form from north to south. The landform is mainly composed of three types: mountain and hill, silted plain, and Dianchi Lake water body. The overall area of the basin is 2920 km2, with an average altitude of 1900 m, as shown in Figure 1.
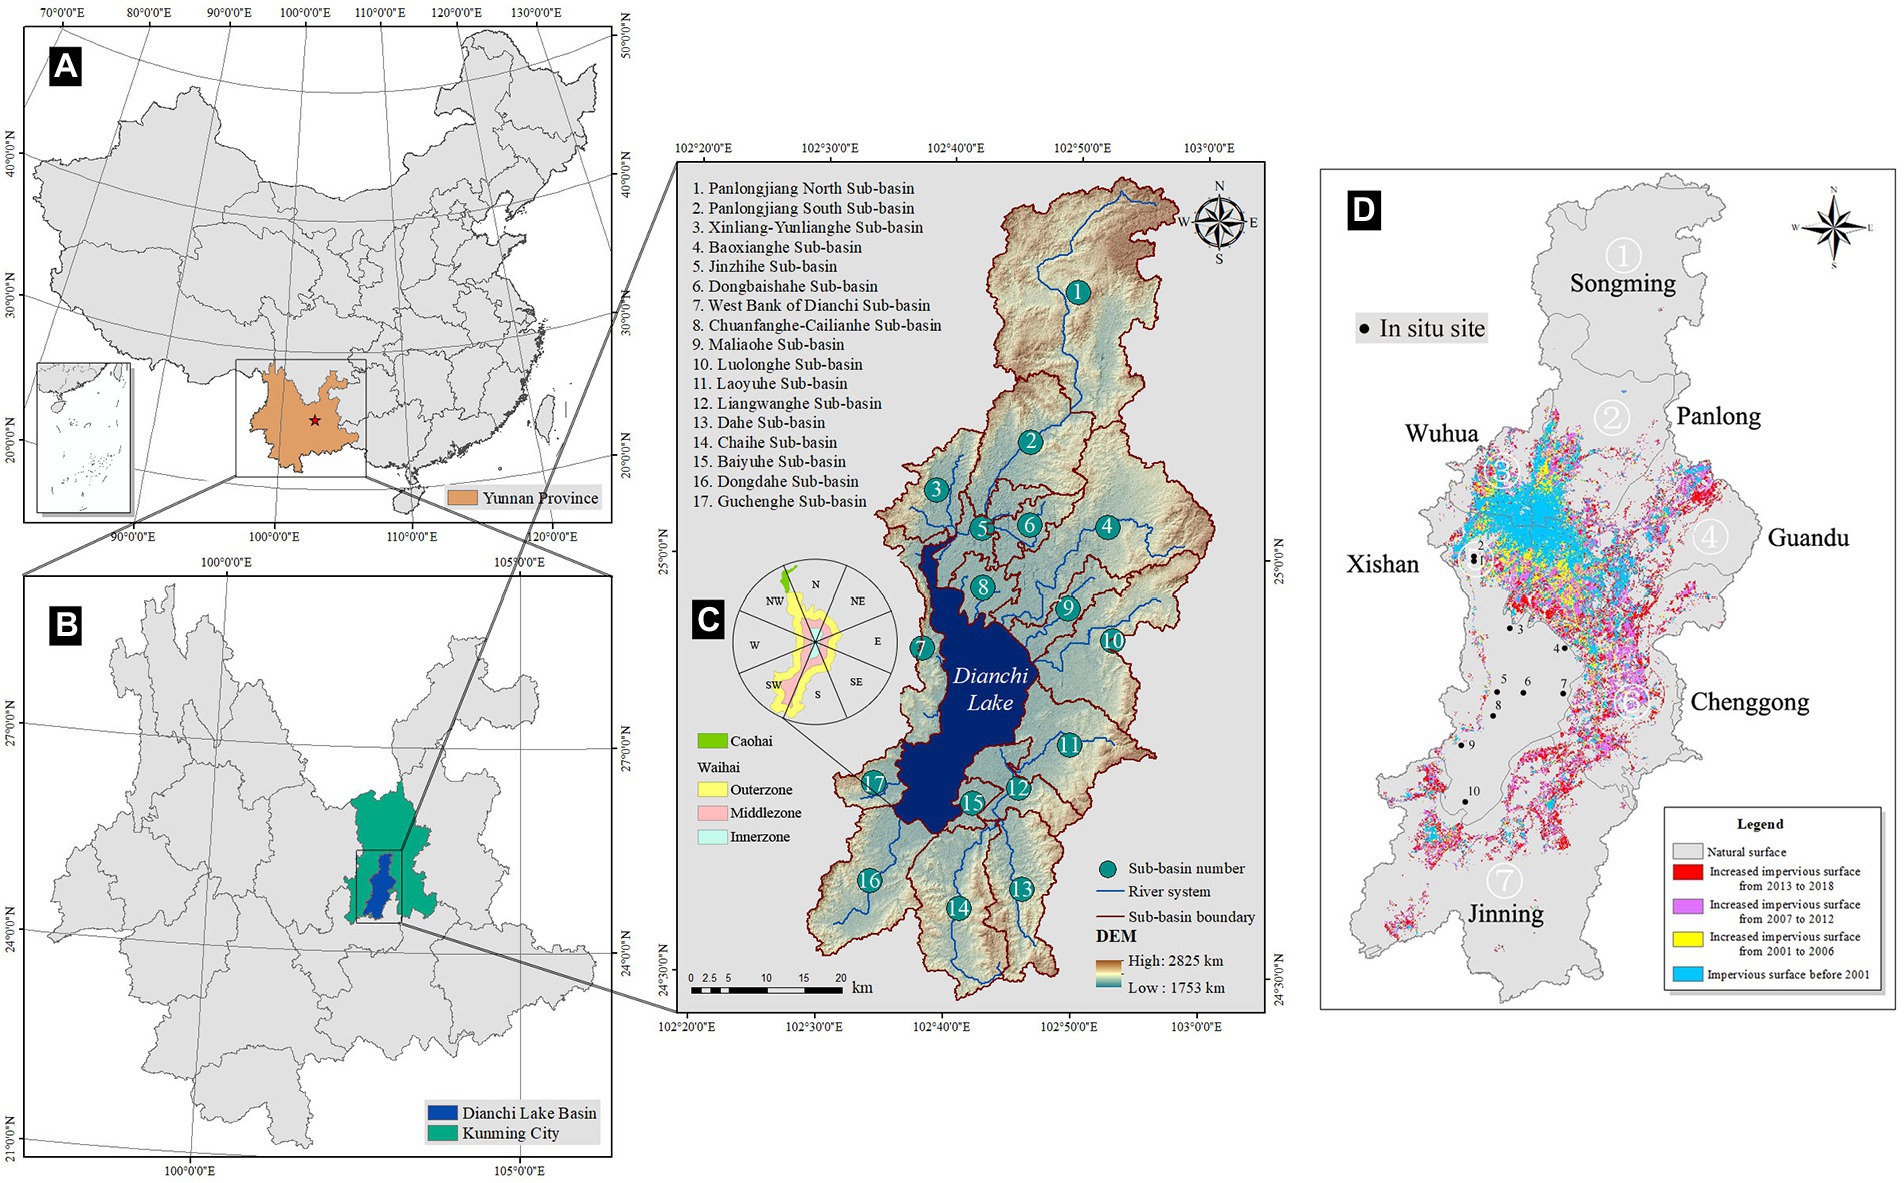
Figure 1. Study area [where, (A). Yunnan’s location in China; (B) the location of Dianchi Lake basin in Yunnan; (C) Dianchi Lake watershed division and Dianchi Lake water body division; (D) temporal and spatial variation of impervious surface and location of LSWT in-situ station].
Limited by terrain, urban construction and agricultural planting in Kunming are mainly carried out around the flat land around Dianchi Lake, as shown in Figure 1. And Dianchi Lake has only one outlet, which led to a long water exchange cycle and belongs to a semi-enclosed urban lake. As the capital city of Yunnan Province, Kunming is the political, economic, cultural center, and transportation hub of Yunnan province, and an important gateway for exchanges and cooperation between China and countries in Southeast Asia and South Asia. According to statistics, the land area of Dianchi Lake basin is only 0.76% of the province, but the urban population, GDP, and fiscal revenue account for 1/3, 1/4, and 1/4 of the province, respectively. According to the statistical yearbook of Yunnan Province in 2016, the permanent population of Kunming has reached about 6.76 million. In the past 30 years, the urban impervious surface of Dianchi Lake basin has been expanding continuously, which has changed the local micro-climate cycle and led to a series of urban problems such as urban heat island and urban waterlogging. At the same time, the occurrence of Dianchi cyanobacteria blooms has been reported frequently. Water pollution control of Dianchi Lake has always been an important part of Kunming’s urban ecological environment construction and has become the key and difficult project of freshwater lake pollution control in China, attracting high attention.
Data source and preprocessing
Data source
Data sources used in this study include MOD11A2, ASTER GDEM V2, Landsat-8 OLI, meteorological station data, and in situ measurement data, as shown in Table 1.
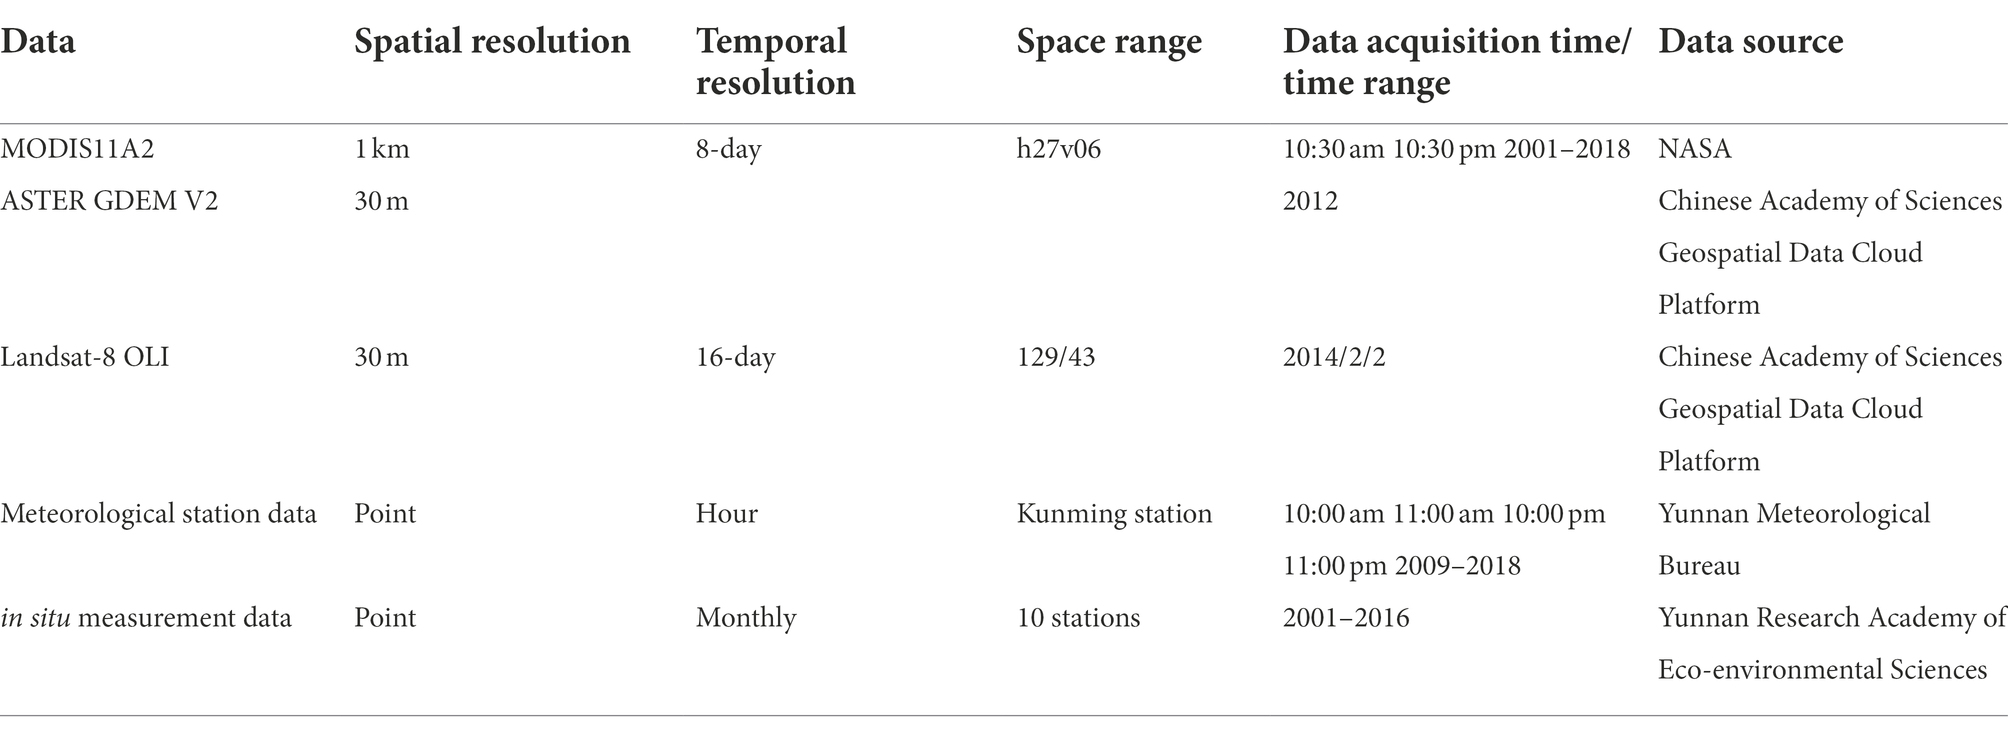
Table 1. Data source.
MOD11A2 is used for surface temperature extraction. MODIS Terra’s 8-day synthetic L3 product (MOD11A2) was selected as the main data source to analyze the surface thermal environment of Dianchi Lake basin. The satellite reentry cycle is twice a day, and transit times are10:30 am and 10:30 pm, respectively. And the LST product data error can be controlled within 1 K. MOD11A2 is obtained by split-window algorithm, the spatial resolution of 1 km, the data obtained by NASA’s website.1
ASTER GDEM V2 global digital elevation data is used for watershed boundary determination and subwatershed division, with a spatial resolution of 30 m. It can be downloaded from the geospatial Data Cloud platform of Computer Network Center, Chinese Academy of Sciences,2 which was jointly developed by METI and NASA in Japan and distributed freely to the public.
Landsat-8 OLI satellite data were used to extract the water boundary of Dianchi Lake. The data was acquired on February 2, 2014, with a spatial resolution of 30 m, cloud cover of 0.07, and strip number of 129/43. They were also downloaded from the geospatial data cloud platform of the Computer Network Center of the Chinese Academy of Sciences. This study does not consider the subtle variation of the Dianchi Lake water area (Xiao et al., 2018).
The hourly measured data of the Kunming meteorological station are used to analyze the climate background and the covariation of air temperature and water temperature in the Dianchi Lake basin. Due to the limitation of data acquisition, part of the data in the research period was intercepted for analysis. The data span was from 2009 to 2018. The morning and afternoon data were averaged at 10:00 and 11:00 respectively, as the corresponding air temperature were at 10:30 am and 10:30 pm.
We used the in situ measurement data of LSWT in Dianchi Lake from 2001 to 2016 as verification. The measured data were provided by Yunnan Research Academy of Eco-environmental Sciences, and included the monthly average measured data of 10 conventional national control points. The site locations are shown in Figure 1D.
The expansion map of the impervious surface of Dianchi Lake basin in the study period that we extracted from the GAIA dataset (Figure 1D). GAIA data is freely available from Tsinghua University.3 The methods and procedures for the GAIA data can be found in their research paper (Gong et al., 2020).
Data preprocessing
Due to cloud pollution and sensor noise, there are a lot of outliers and missing values in MOD11A2, which cannot be used directly. As shown in Figure 2, images with missing pixels accounting for more than 25% were counted. The statistical results of image missing show that data missing in summer is more serious than that in other seasons, and data quality at night is better than that in the daytime, which is largely related to cloud cover and weather conditions in the research area. Therefore, it is necessary to preprocess MOD11A2. MOD11A2 preprocessing includes data extraction, reprojection, clipping, outlier recognition, missing value filling, timeseries filtering, and land and water separation, and data validation.
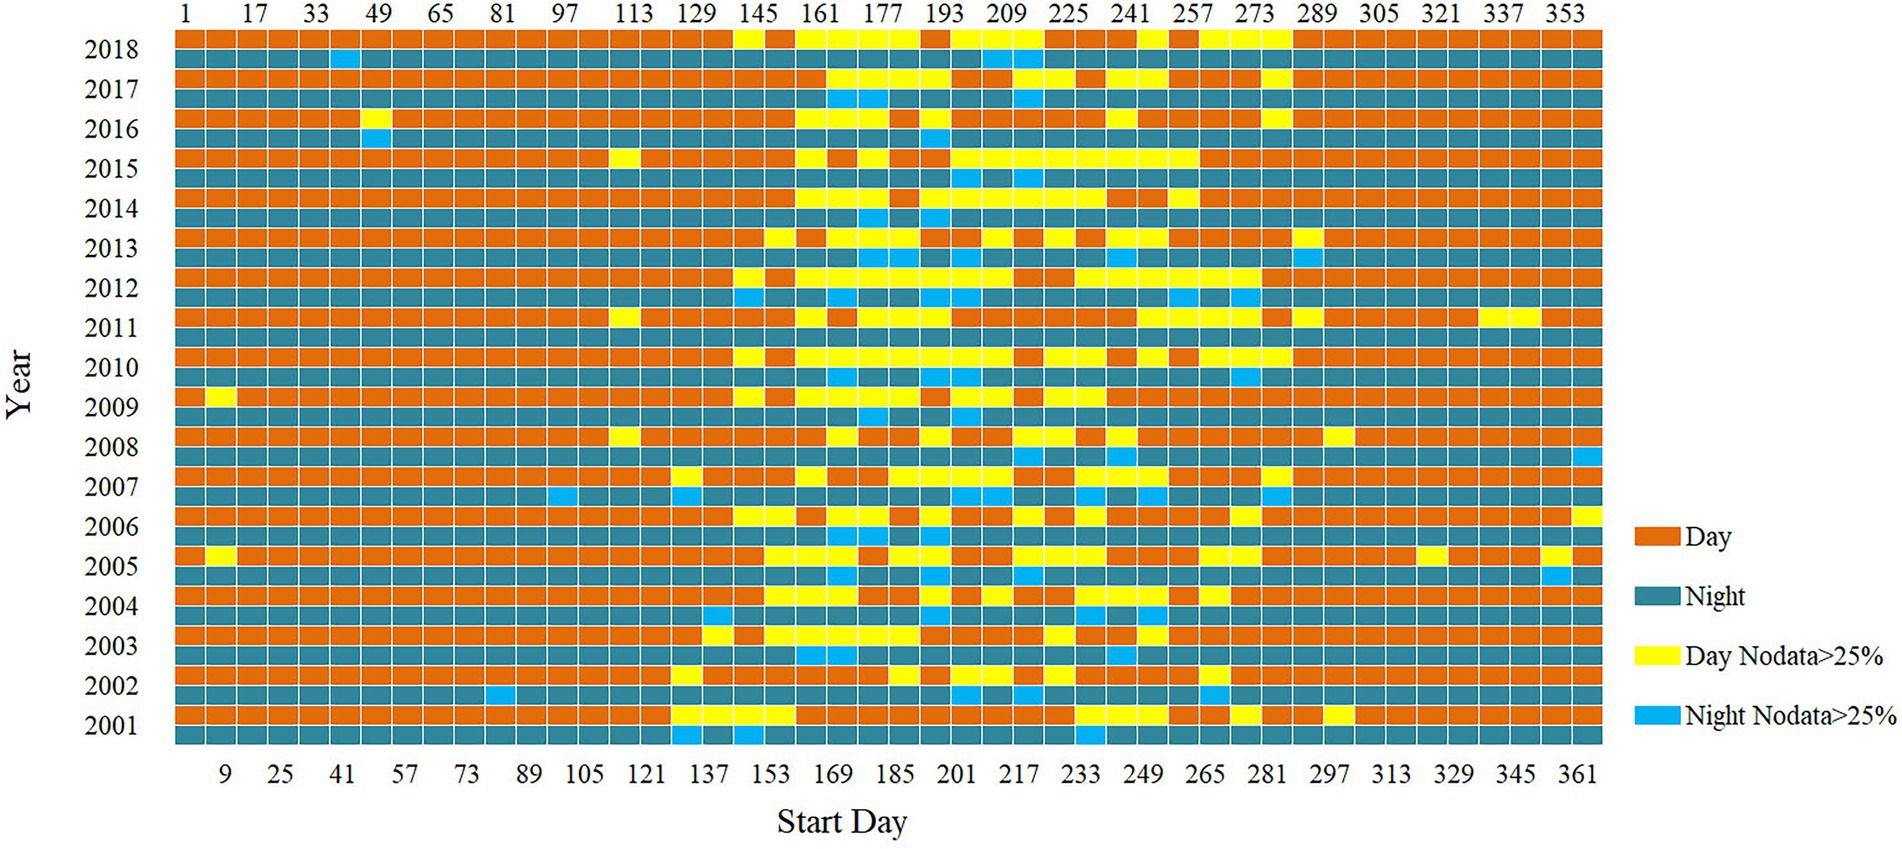
Figure 2. Data missing on MOD11A2.
Extraction, reprojection
There are 46 scenes of daytime and night data each year, and a total of 1656 scenes of data were covered in 18 years. The MODIS Reprojection Tool (MRT) was used to extract four bands of daytime and nighttime data and their corresponding QC (Quality Control) file data, and the data were reprojected into Albers equal-area projection.
Clipping
The boundary of Dianchi Lake basin was trimmed to obtain the data of the study area. The boundary of the Dianchi Lake basin was divided by SWAT model, and according to “the 12th Five-Year Plan of Kunming City” and “Water Pollution Prevention Plan of Dianchi Lake Basin,” the Dianchi Lake Basin is divided into 17 sub-basins. The division of Dianchi Lake Basin and sub-basins is shown in Figure 1.
Outlier recognition
QC files of daytime and nighttime data, respectively, record the quality of corresponding pixels, which can assist in identifying outliers and missing values of data. The QC file is an 8-bit binary file. If bit 0 and bit 1 are “00,” it means that the data quality is good and no further check is required. If bit 0 and bit 1 are “01,” it means that there is some error in the data, and other bits need to be further checked. Considering the balance of data volume and quality, we ultimately chose the error ≤2 K data as the original dataset. The valid data in the daytime and night was 76.68 and 83.73%, respectively. Based on this, we set an empirical threshold value (the highest temperature is not higher than 40°C, the lowest temperature is not less than −5°C), identify the values beyond the threshold range as abnormal data, and set these abnormal data as missing values.
Missing value filling
When the temperature values of adjacent images exist at the same time, directly interpolate using the temperature values before and after the present day (i.e., 8-day since it is the 8-day product). If the temperature values of adjacent images do not exist at the same time, the ordinary least square method is used to estimate missing values. Ordinary least square means that the selected regression model should minimize the sum of residual squares of all observations. It is implemented through the scipy.optimize.leastsq() function in Python. In this step, we fill in the data based on the similarity of time series data without using the spatial interpolation method, mainly considering the large difference between LST and LSWT, and spatial interpolation may introduce additional errors.
Timeseries filtering
Timeseries filtering is carried out to eliminate the influence of abnormal data fluctuations on trend analysis. According to the method in reference (Wan et al., 2017), daytime data are filtered by the Lowess filter and nighttime data are filtered by the Percentile filter. This step mainly for removing outliers brought by weather and so on to make the data more regular.
Land and water separation
Then, the Dianchi Lake basin is divided into a water section and a land section by the lake boundary. The lake boundary was extracted by the MNDWI index of Landsat8 data and corrected manually. Considering the influence of the mixed pixels in the water-land interface zone, and referring to previous similar studies (Wan et al., 2017; Yang et al., 2019b) and surface temperature profile analysis results, buffer zones of 1 km were made on both sides of the water boundary to eliminate the possible mixed pixels, and the pixels in this part of the transition zone would not participate in the subsequent analysis.
Data validation
We used the in situ measurement data of Dianchi LSWT to compare with the MODIS LST obtained. The error is basically within 2 K. The mean MAE and RMSE of LSWT-day were 1.69 K and 2.08 K, and those of LSWT-Night were 1.43 K and 1.81 K, respectively.
Spatio-temporal multiscale synthesis
The preprocessed MOD11A2 data were synthesized pixel by pixel on the time scale of year, season, and month, respectively, to analyze the interannual variation characteristics, seasonal differences, monthly differences, and periodicity of LST and LSWT. On the monthly scale, the composite data of the mean values of each month in 12 months were obtained by calculating the corresponding month according to the data number. On the seasonal scale, spring includes March, April, and May, summer includes June, July, and August, autumn includes September, October, and November, and winter includes January, February, and December. The annual scale was obtained by pixel-by-pixel synthesis of 46 sceneries and 8-day composite images per year.
Multi-scale synthesis was performed for daytime and nighttime data respectively, and the daily variation of LST, daily variation of LSWT, the temperature difference between LST and LSWT in the daytime, and temperature difference between LST and LSWT at night were calculated for each period.
To quantitatively analyze the difference in the internal spatial distribution of LST and LSWT, the whole basin is divided into17 sub-basins, and Dianchi Lake is divided into Caohai and Outer lake, Outer zone, Middle zone, and Inner zone, as shown in Figure 1C. According to the area and length and width of the lake, we use the distances within 2 km (Outer zone), between 2 km and 4 km (Middle zone), and more than 4 km (Inner zone) respectively from the lake shore to evenly divide the lake surface into three layers as much as possible, which can not only retain the rule of LSWT changing layer by layer from the lake shore to the lake center, but also not be excessively disturbed by pixel mosaic effect.
After removing the LST-LSWT mixed pixels, Caohai is disconnected from the rest of Dianchi Lake. Therefore, continuous LSWT is obtained through the Kriging interpolation method in spatial analysis, and original data are used for multiyear mean analysis and trend analysis.
Methods
Standard deviation method
The mean standard deviation method is used to classify LST into five grades: high temperature area, sub-high temperature area, medium temperature area, sub-low temperature area, and low temperature area. The specific classification method is shown in Table 2. The mean standard deviation classification method is to calculate the mean and standard deviation of LST in Dianchi Lake basin from 2001 to 2018 and then formulate a unified classification standard that can be used for the whole research period after calculating the classification standard. Under this unified classification standard, the temporal and spatial changes in surface temperature in the Dianchi Lake basin can be reflected.
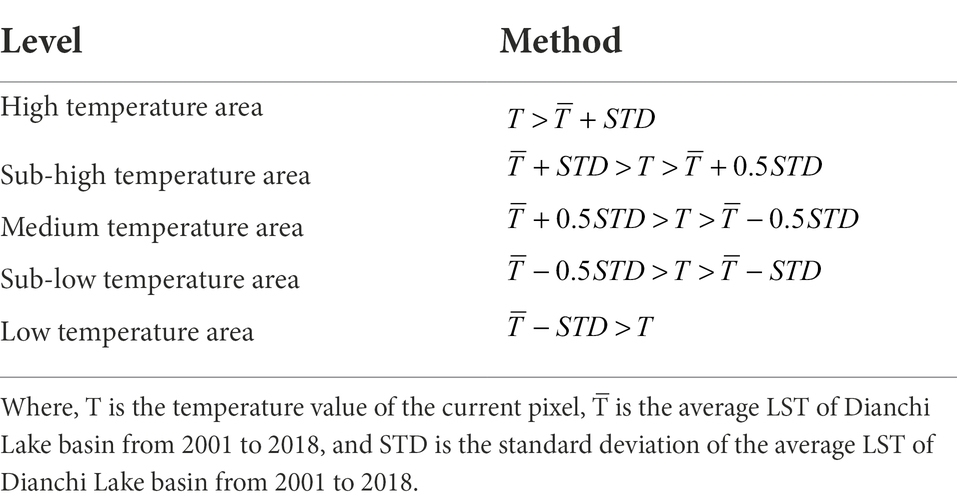
Table 2. The classification standard of LST.
Mann-Kendall trend test
The trend analysis method used in this paper is the Mann-Kendall trend test (Atta Ur and Dawood, 2016), which is a non-parametric statistical method. The advantage is that the samples do not need to obey a certain distribution and are not disturbed by a few outliers, so it is very suitable for studying the temperature change trend. This method is recommended by The World Meteorological Organization (WMO) and has been widely used to analyze long-term trends and abrupt changes in time series of hydrological, precipitation, runoff, temperature, and water quality factors. In the Mann-Kendall test, the null hypothesis H_0 is the time series data (X1, X2, …, Xn), is the sample of n independent random variables with the same distribution; The alternative hypothesis H1 is a bilateral test for al i, j ≤ n, and Xi and Xj are not equally distributed. Define the test statistic S:
where sign() is the sign function. When Xi − Xj less than, equal to, or greater than zero, sign(Xi − Xj) is −1, 0, or 1, respectively. S is a normal distribution, the mean value is 0 and variance Var(S) = n(n − 1) (2n + 5)/18. When the MK statistic formula S is greater than, equal to and less than zero, it is:
In the bilateral trend test, for a given confidence level α if ǀZǀ ≥ Z1−α/2, then the null hypothesis H0 is unacceptable, that is, at the confidence level α, timeseries data has an obvious upward or downward trend. A positive Z value indicates an increasing trend, while a negative value indicates a decreasing trend.
Spatial influence
The influence of LST on LSWT varies with spatial distance, we introduce the concept of spatial influence. According to the first law of geography process and heat transfer efficiency of diminishing, we believe that the influence of LST on LSWT is related to the proximity between them and the temperature of LST itself, and it decays with distance (Miller, 2004; Tobler, 2004; Zhao et al., 2014). In other words, if the distance between water pixel and land pixel j is closer, water pixel will be influenced by land pixel more, and vice versa. Therefore, the total amount of influence of LST on LSWT Ti of water pixel i can be expressed by the following formula:
where, Gi is the sum of the spatial influence of land pixels on water pixel i, Tj is the surface temperature of land pixel j, n is the total number of land pixels, Dij is the distance between water pixel and land pixel j. Gtotal is the total value of the spatial influence of a certain region, and m is the number of water units contained in the region. In this study, the outer area, middle area, inner area, Caohai, Waihai and the whole lake were counted as separate regions.
Pearson’s correlation analysis is used to verify the consistency between air temperature data and LSWT, and the consistency between spatial influence and LSWT. The centers of gravity of the annual spatial influence and the LSWT was calculated, and these centers of gravity were connected according to the time series, to analyze the trajectory and direction of the spatial distribution changes of spatial influence and the LSWT. The Pearson correlation analysis was implemented by Python software package, and the center of gravity migration trajectory analysis was implemented by ArcGIS software.
Results
Spatial–temporal characteristics analysis
Analysis of spatial–temporal characteristics at the annual scale
From 2001 to 2018, the average daytime temperature of LST and LSWT in the Dianchi Lake basin were 22.61°C and 17.44°C respectively, and the average nighttime temperature were 10.94°C and 15.27°C, respectively (Figure 3). The LST was higher than the LSWT in the daytime and lower than the LSWT at night. The daily variations of LST and LSWT in Dianchi Lake were 11.67°C and 2.17°C, respectively. The daily variation range of LST and LSWT is quite different, which is caused by the difference in heat capacity between lake and land.
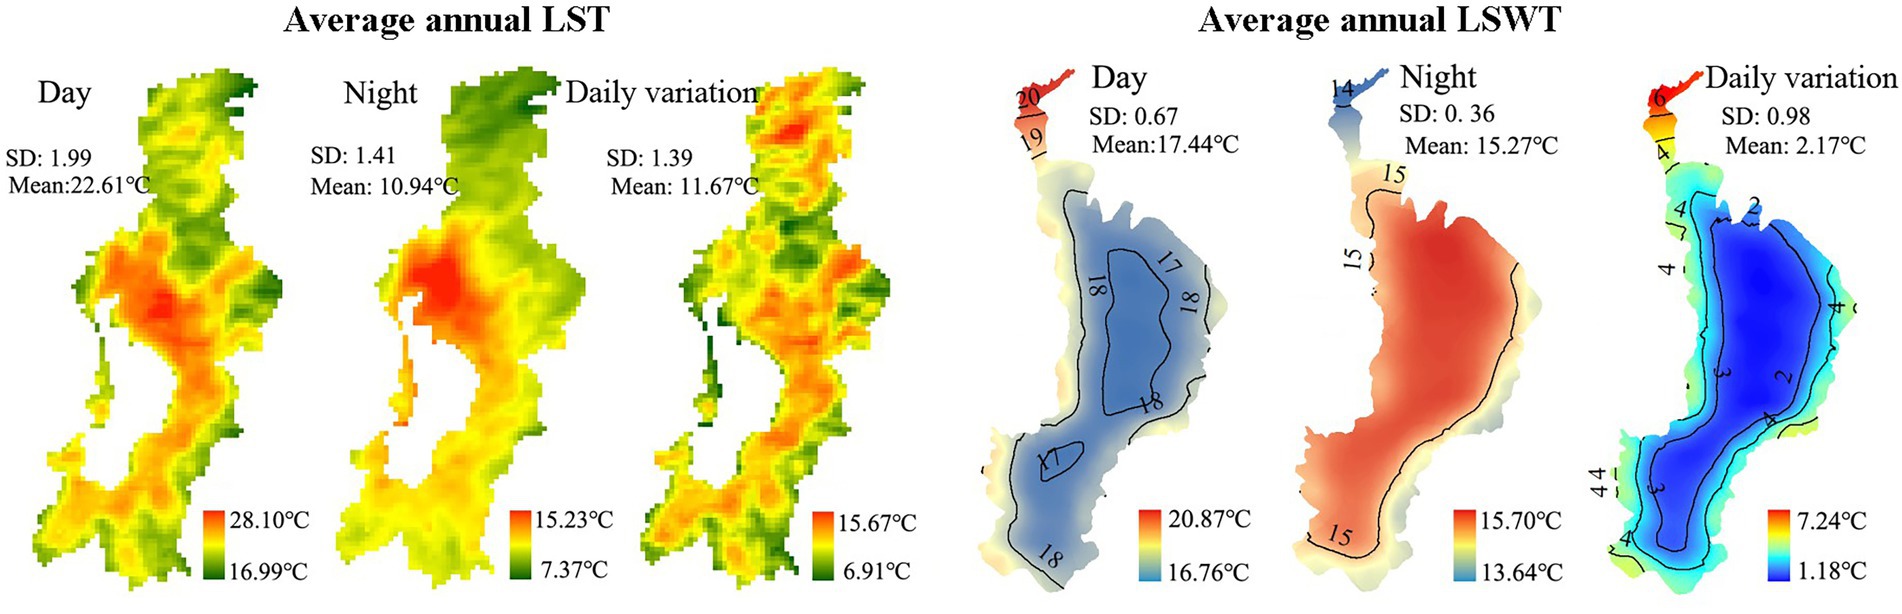
Figure 3. Spatial distribution of annual mean from 2001 to 2018.
From the perspective of spatial distribution, the heat is evenly distributed during the day and concentrated at night. LST-day is mainly affected by topography, which is higher in low-elevation and flat terrain. While LST-night is concentrated in built-up areas. The heat island effect is even more pronounced during the night. For example, sub-basins 13, 16, 15, and 17 have higher surface temperatures in both daytime and nighttime (Figure 4), and these sub-basins have higher impervious areas (Gong et al., 2020). There is an obvious regular in the spatial distribution of LSWT. During the day, the LSWT-day of the Caohai in the north area of Dianchi Lake is higher than the Waihai, and the LSWT-day of the lakeside part was higher than that of the central part. The LSWT-day gradually decreased from the outer to the inner zone, while the regular of the spatial distribution of LSWT-night is opposite.
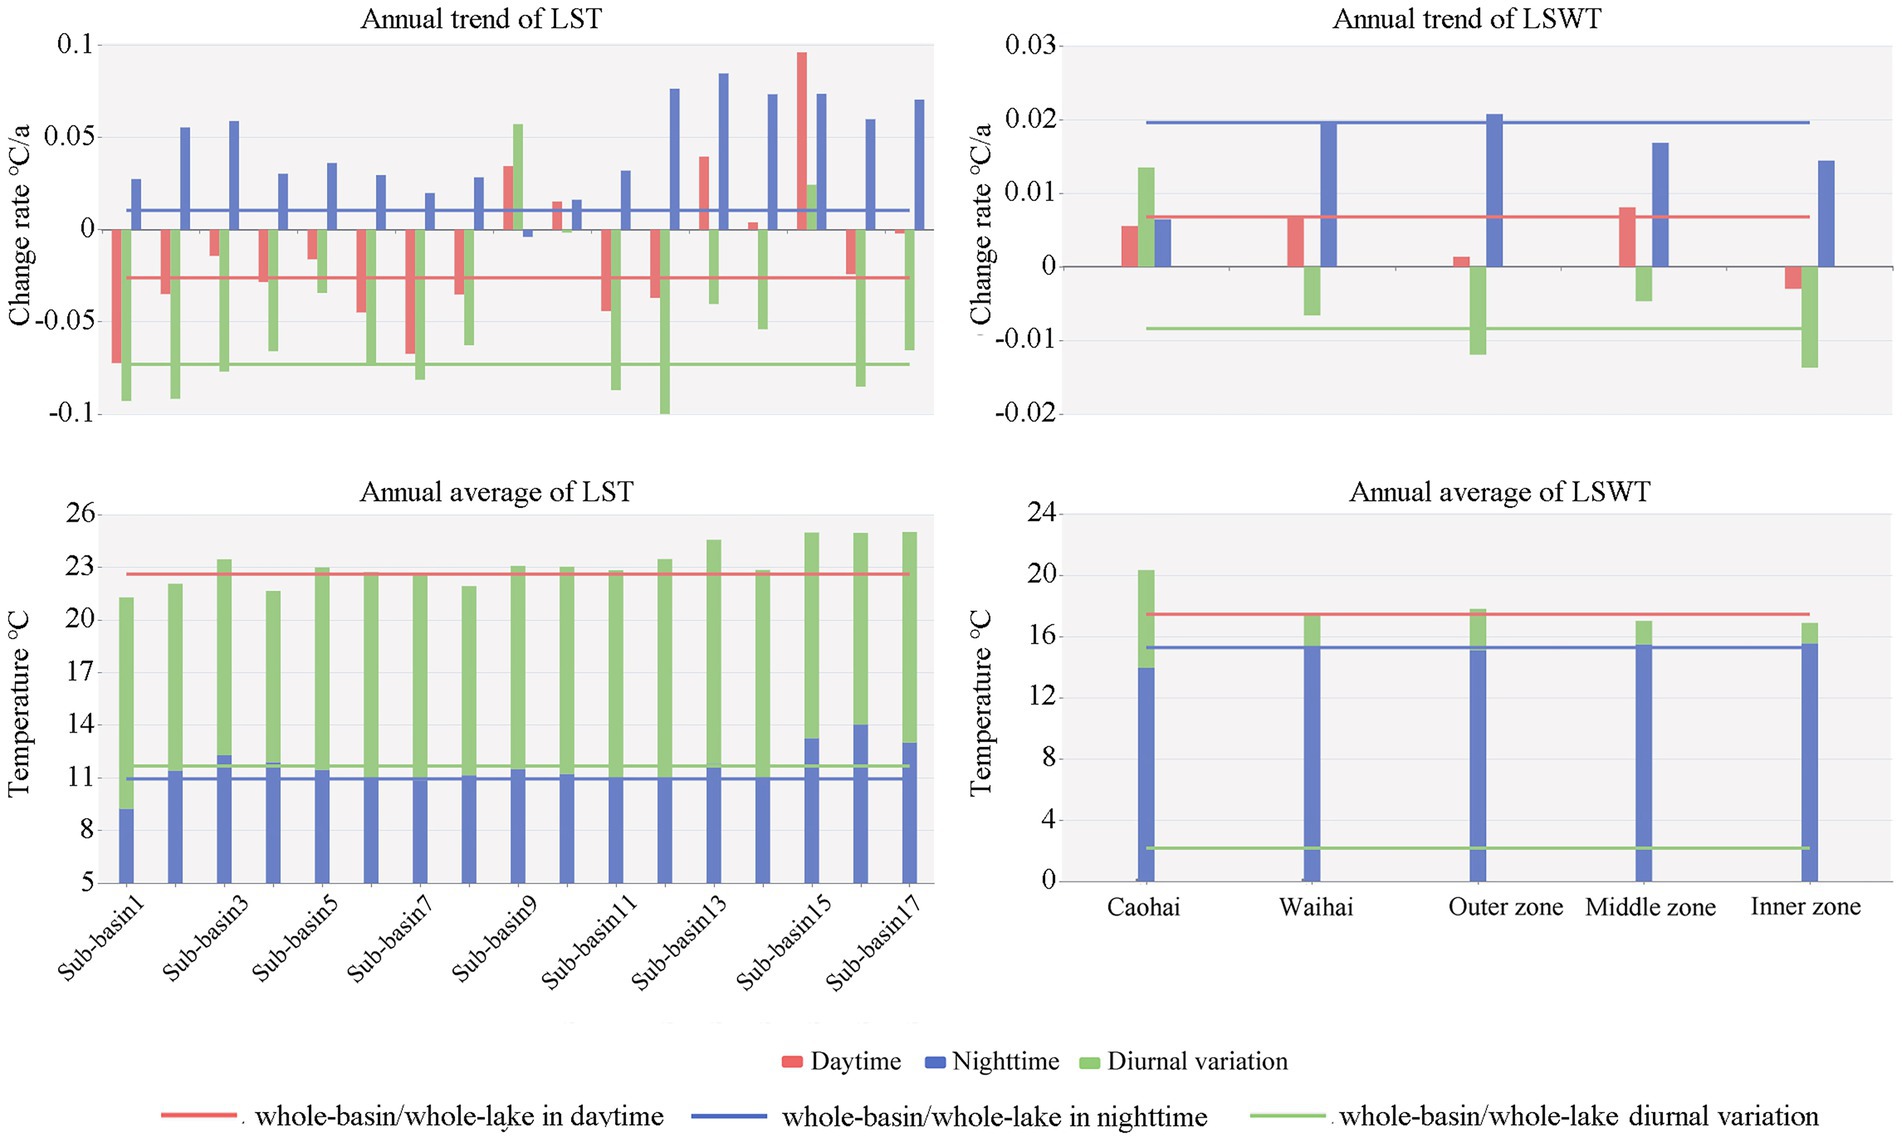
Figure 4. Spatial differences in temperature distribution.
During the study period, LST-day showed an overall cooling trend with a trend of −0.03°C/a (Figure 4). Among 17 sub-basins, 12 sub-basins showed a cooling trend, and sub-basin 1 passed the significance test. Sub-basin 1 is Panlongjiang North Sub-basin, which is far away from the urban center of Kunming and is less disturbed by human activities, with natural surface cover. Five sub-basins showed a warming trend (9, 10, 13, 14, 15), among which sub-basins 13 and 15 passed the significance test. These sub-basins with warming trends are almost all located in built-up areas. LSWT-day of the whole Dianchi Lake showed a warming trend, with a trend of 0.01°C/a. Except for the cooling trend in the inner zone, other parts of the lake showed a warming trend too. Inner zone and sub-basin 1 represent the parts where least affected by human activities on land and lake, respectively, and both of them show a cooling trend in the daytime. At night, the LST of the whole basin and LSWT of the whole Dianchi Lake showed a warming trend, with a change rate of 0.01°C/a and 0.02°C/a, respectively. It can be seen that the warming rate of LSWT-night is greater than that of LST-night. Except for sub-basin 9, the LST of 16 sub-basins showed a warming trend. The LST of sub-basins 13, 12, 15, 14, 17, 16, 3, 2, and 11 passed the significance test. LSWT of all parts of the lake showed a warming trend, and the warming trend of the Waihai and middle zone passed the significance test. This indicates that the warming effect of urbanization is more significant at night, and the warming effect of human activities on the lake is greater than that on land.
The trend analysis results of daily variation of LST(LST-DV), daily variation of LSWT(LSWT-DV), and temperature difference between LST and LSWT in the daytime and nighttime (TD-day and TD-night) all showed a cooling trend of −0.07°C/a, −0.01°C/a, −0.05°C/a and −0.02°C/a, respectively (Figure 5). Most LST-DV of sub-basins is cooling trends, except sub-basins 9, 10, and 15. The LSWT-DV all showed a cooling trend except for Caohai.
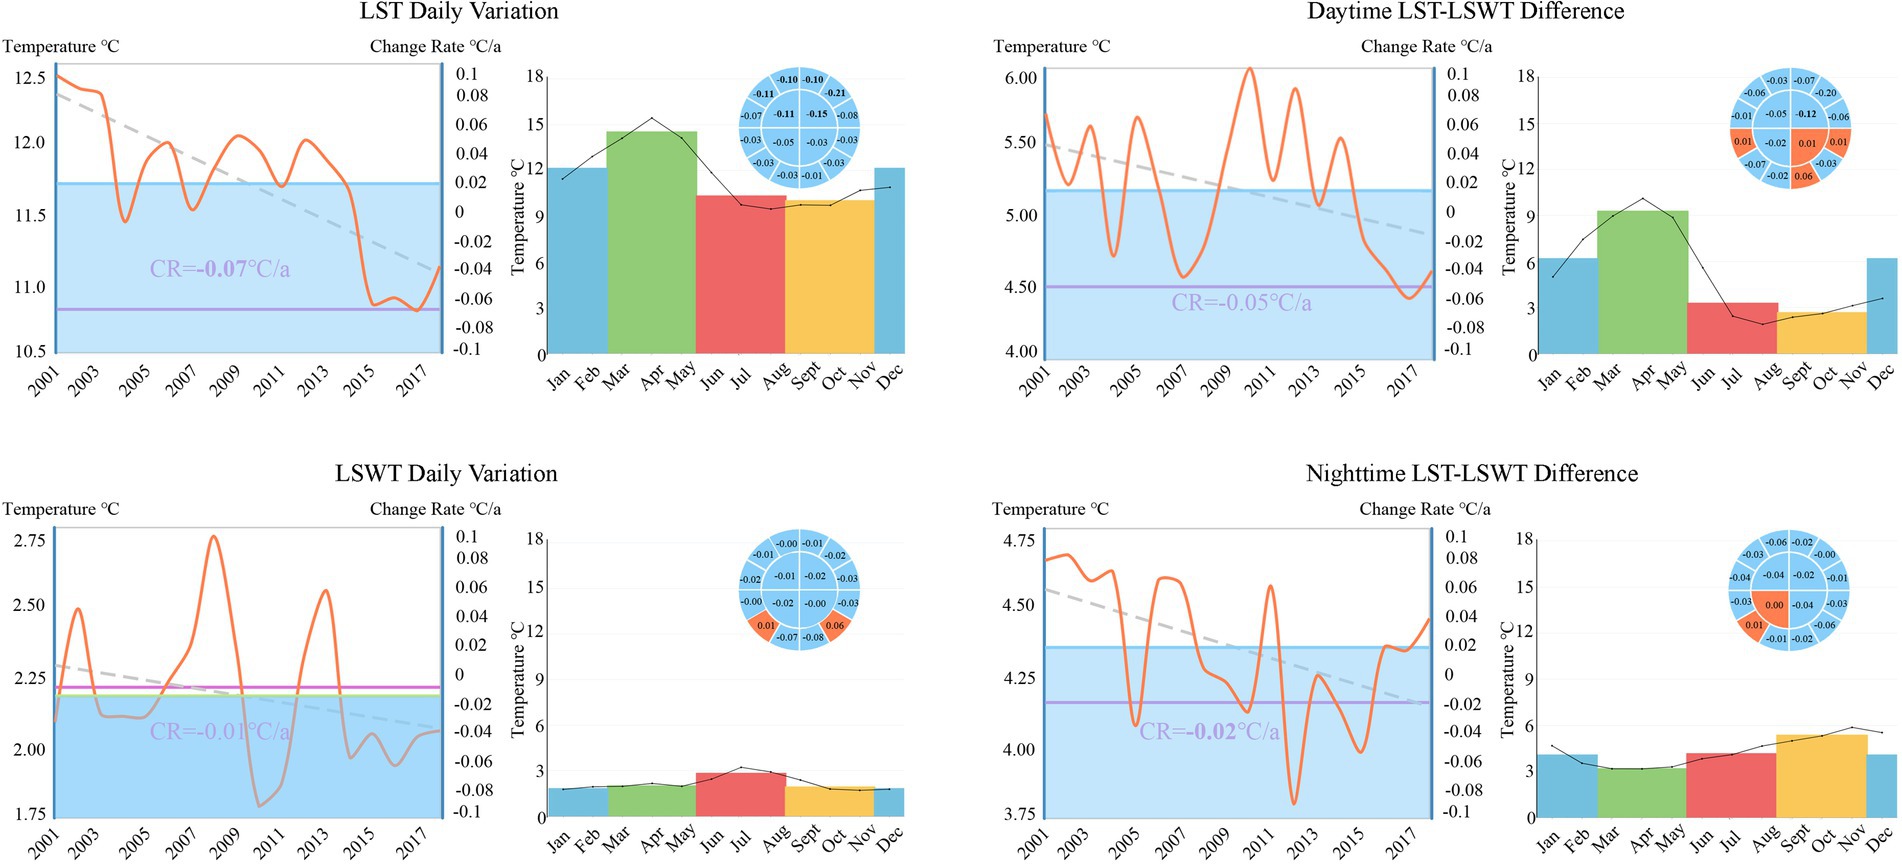
Figure 5. Multiscale temperature difference and trend from 2001 to 2018.
Taking nighttime as an example, the expansion intensity and direction of LST were analyzed. The standard deviation of LST from 2001 to 2018 was 1.48, and the mean value was 10.94°C. The mean standard deviation method was used to conduct a unified standard classification of nighttime LST in annual time series. The classification standards of low temperature, sub-low temperature, medium temperature, sub-high temperature and high temperature are T < 9.46, 9.46 ≤ T < 10.20, 10.20 ≤ T < 11.68, 11.68 ≤ T < 12.42, 12.42 ≤ T, respectively. The annual area and total area proportion of each grade in the research period were statistically analyzed. The overall area of the high temperature region and sub-high temperature region expanded significantly at the rate of 18.2 km2/a and 12 km2/a, and the area proportion increased significantly at the rate of 0.74%/a and 0.49%/a, respectively. The total area of medium temperature area, sub-low temperature area, and low temperature area decreased at rates of 10.48 km2/a, 3.2 km2/a, and 14.08 km2/a, respectively. The decrease rate of the total area of medium temperature area passed the significance test. The area proportion of medium temperature area, sub-low temperature area, and low temperature area decreased at a rate of 0.42%/a, 0.13%/a, and 0.57%/a, respectively. The decreasing rate of area proportion of medium temperature area passed the significance test (Figure 6).
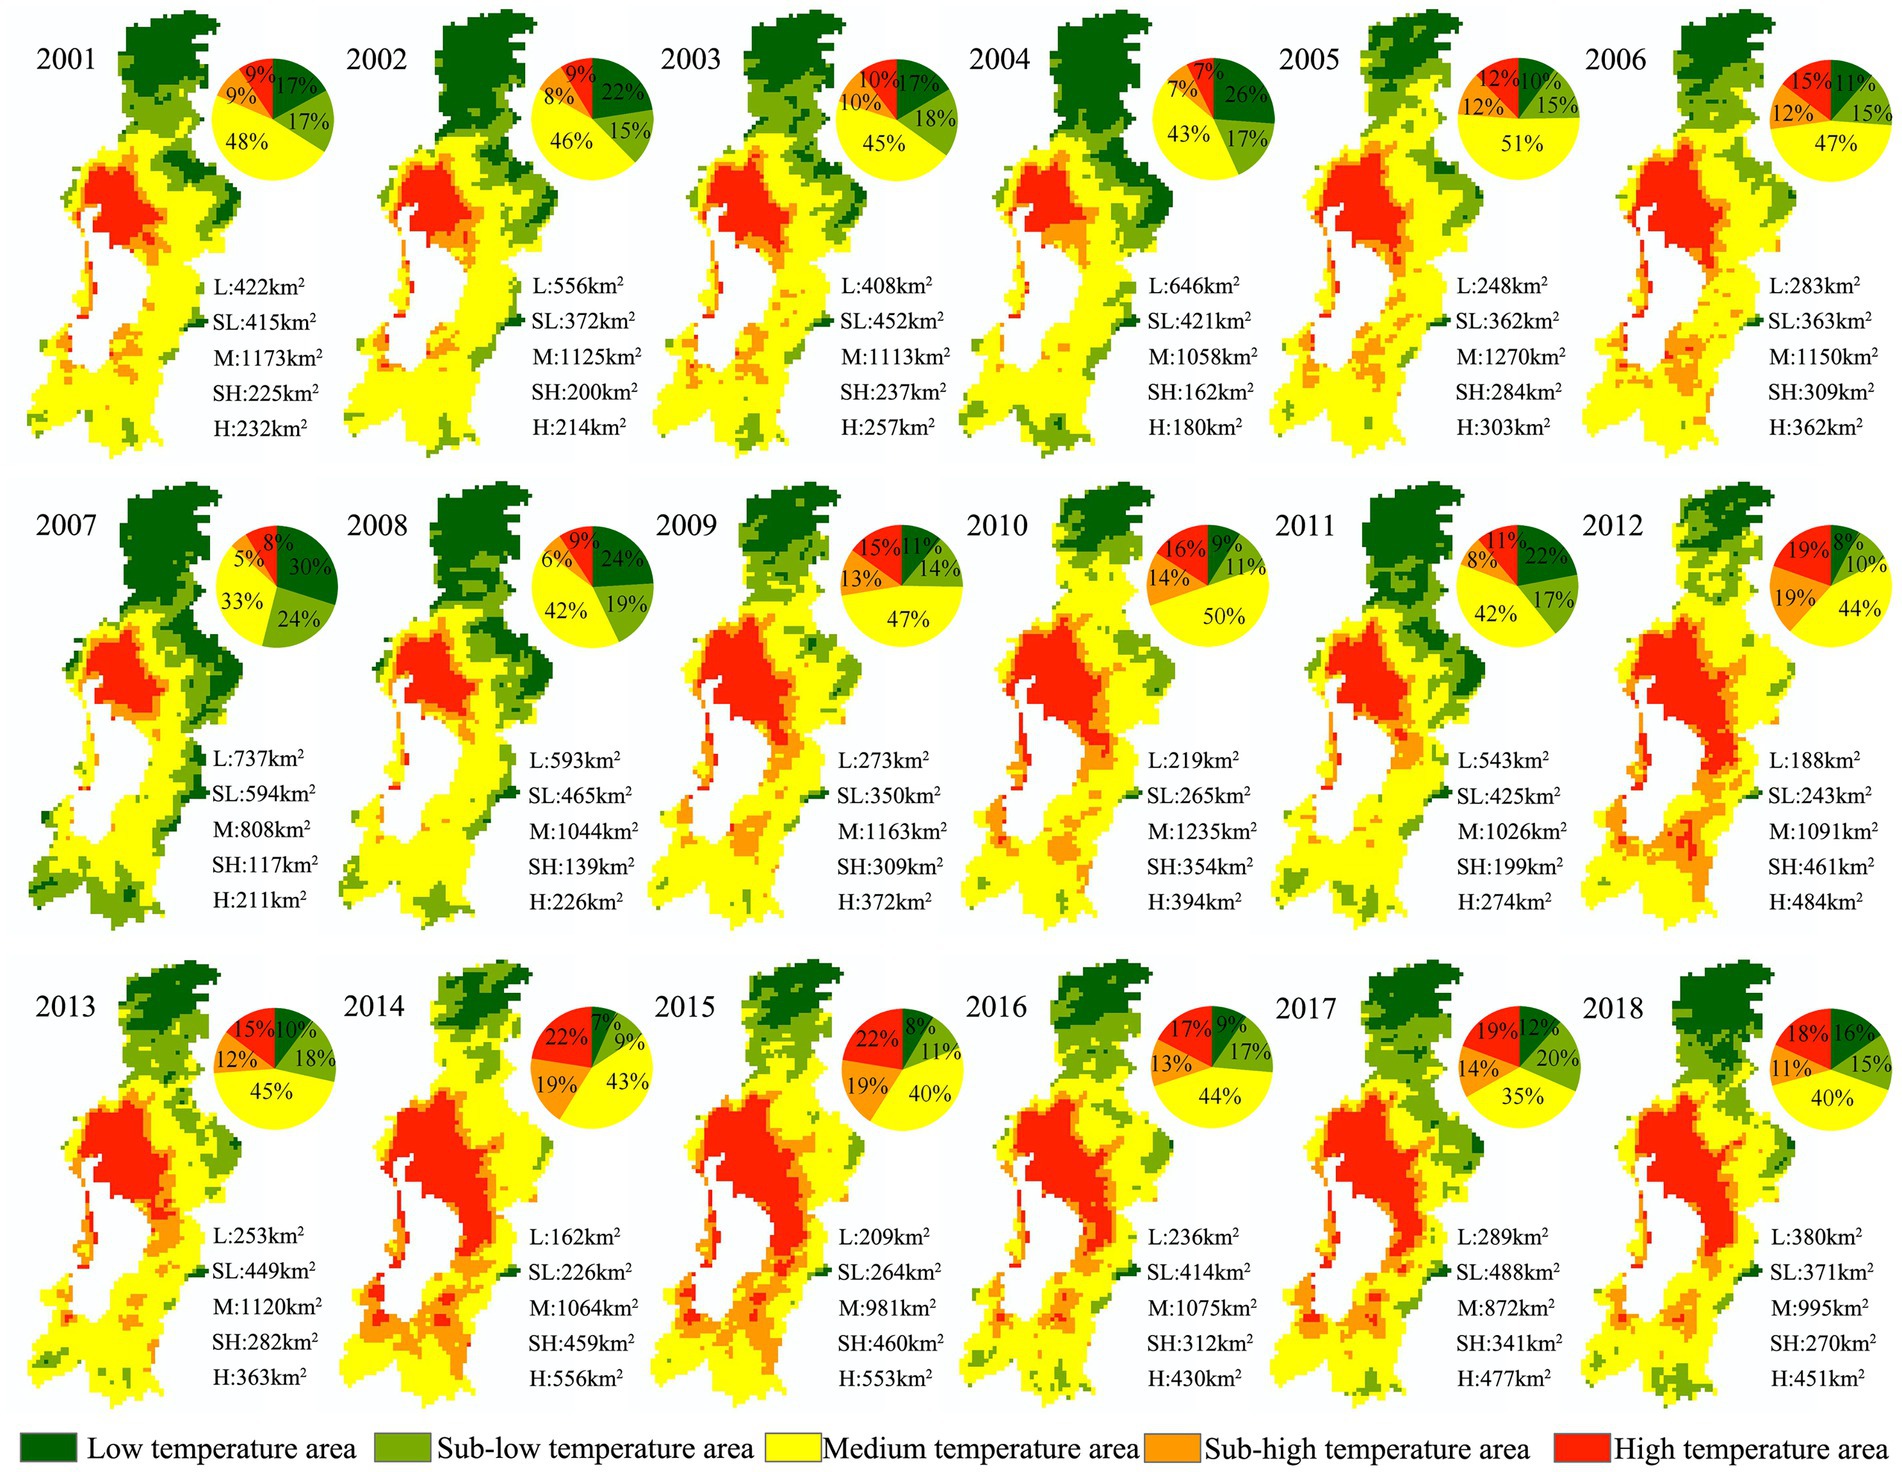
Figure 6. Classification of annual mean LST-night from 2001 to 2018.
The land area of the Dianchi Lake basin is divided into eight parts according to the direct relationship with the center of the lake, and the expansion trend of high temperature area in eight directions is analyzed. The expansion trend of the high temperature area was calculated according to the changes of the area and proportion of the high temperature area in the preceding and following years. As shown in Figure 7, starting from the upper left corner, the thematic map of the expansion trend of high temperature area in the eight directions from 2001 to 2007, 2007 to 2013, 2001 to 2018, and 2013 to 2018 is drawn clockwise. Before 2007, the high temperature area mainly expanded in the north direction, and the expansion rate was 6.87 km2/a, which was related to the marginal urban expansion, the depression-filled urban expansion, and the reconstruction of urban villages in the main urban area of Kunming. From 2007 to 2013, the expansion was mainly in the southeast direction, with an expansion rate of 7.45 km2/a. The urban expansion in this period was mainly in Chenggong New Area. From 2013 to 2018, there were negative expansion values of high temperature areas in multiple directions during this period, mainly because the construction of wetland around Dianchi Lake and the Dianchi-Niulanjiang Water diversion project alleviated the thermal environment deterioration of the Dianchi Lake basin. During this period, the urban maintained positive expansion in multiple directions, including southeast (location of Chenggong New Area), south (location of Jinning and Majinpu high-tech Zone), and northeast (location of airport New Area) as the main development direction. The main expansion direction of the high temperature area was south, and the expansion rate was 6.56 km2/a. From 2001 to 2018, the overall expansion of high temperature area shows that the high temperature area expanded in different degrees in eight directions. Except for the west direction, which showed a slight expansion trend due to topography, the other seven directions expanded significantly. The main expansion directions were southeast and north, and the expansion rates are 4.21 km2/a and 3.25 km2/a, respectively.
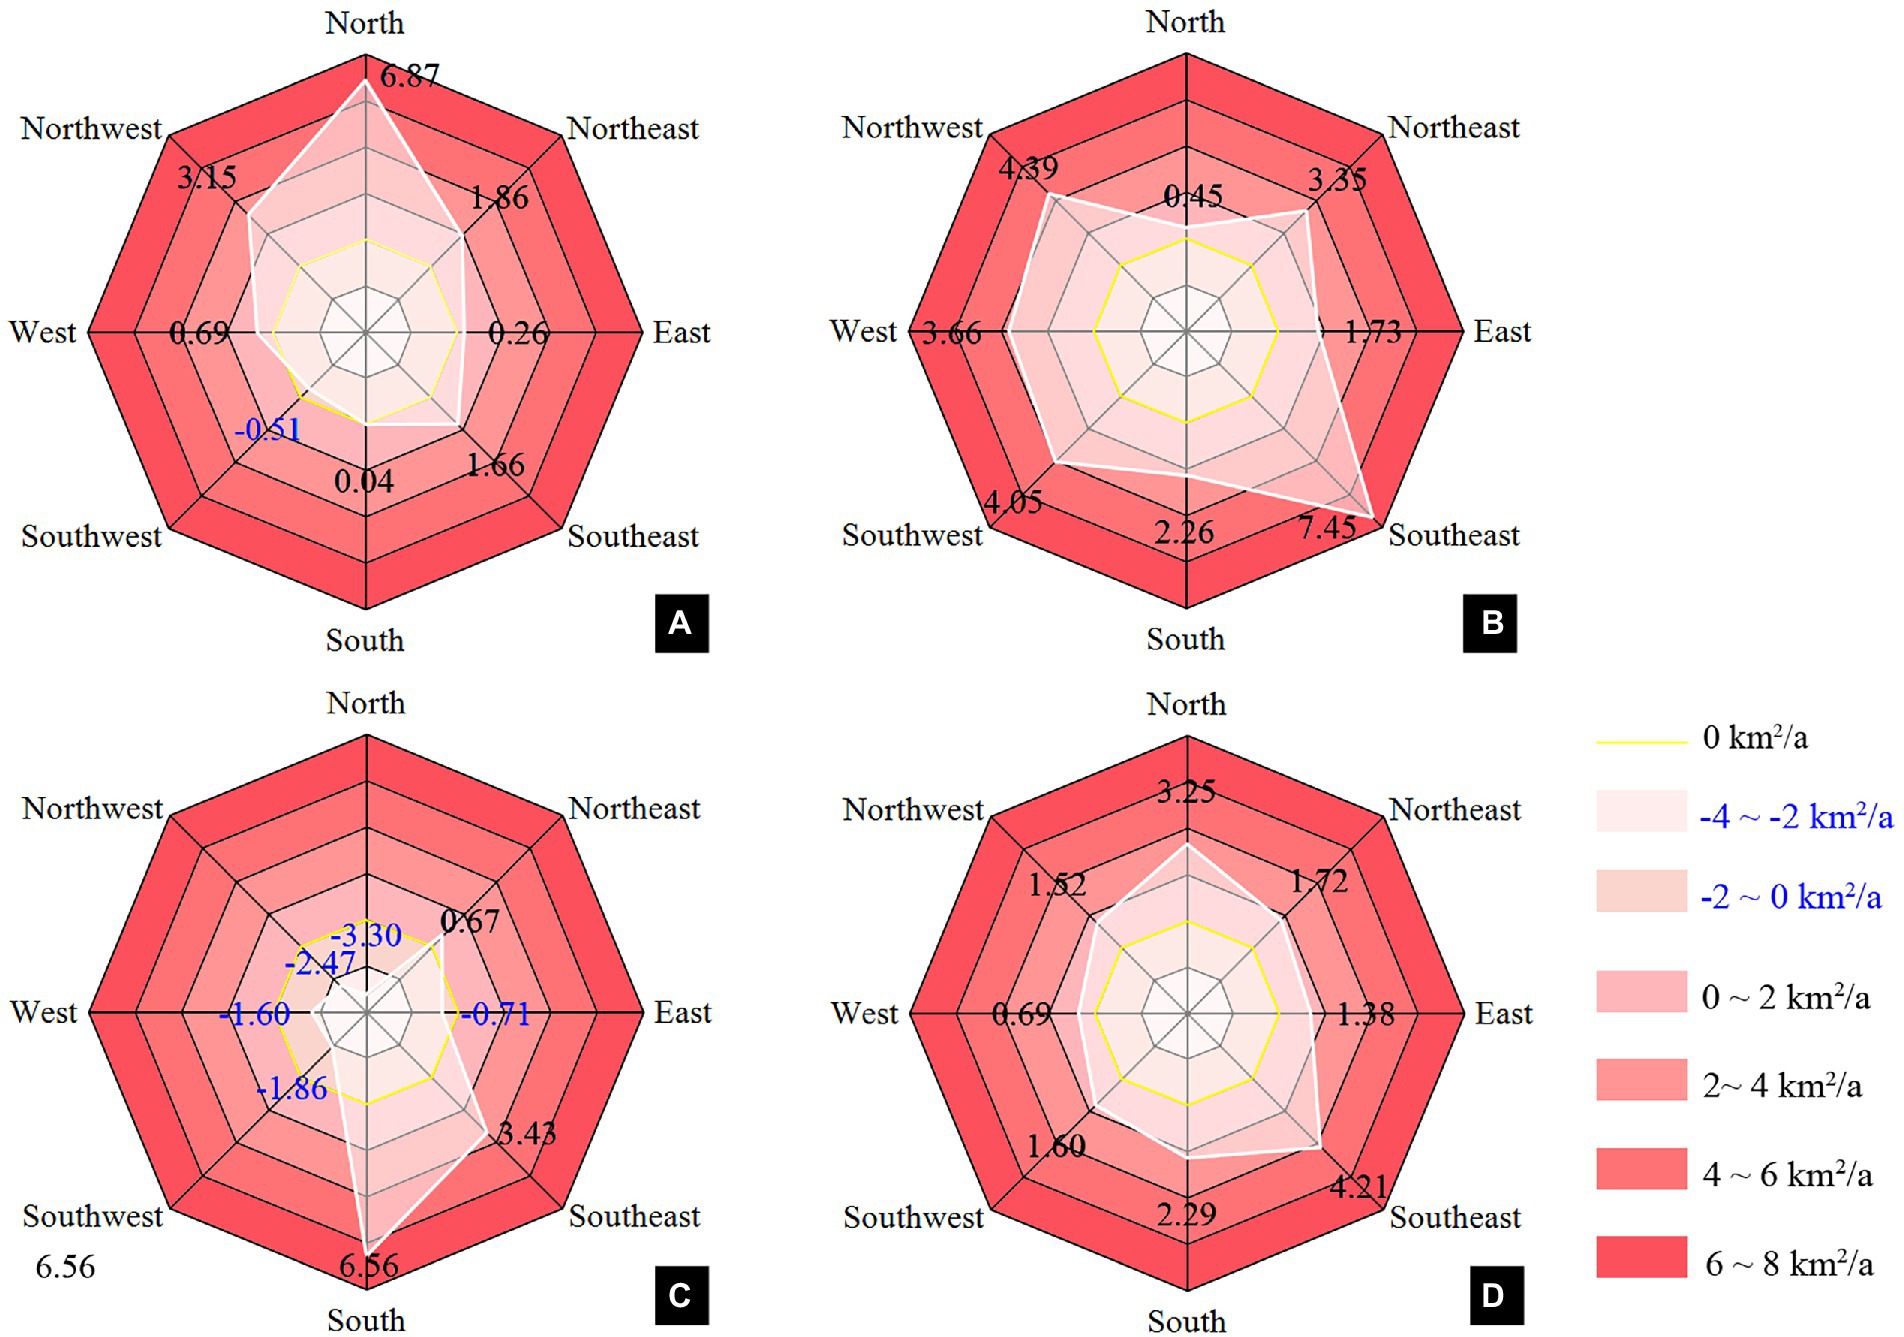
Figure 7. The expansion direction of the annual mean LST-night [where, (A) 2001–2007; (B) 2007–2013; (C) 2013–2018; (D) 2001–2018].
Analysis of spatial–temporal characteristics at the seasonal scale
From 2001 to 2018, the order of the seasonal average of LST-day from high to low is spring, summer, autumn, and winter, while the order of the seasonal mean values of LSWT-day, LSWT-night, and that of LST-night from high to low is summer, spring, autumn and winter (Figure 8). It is noteworthy that in summer LST is lower than in spring during the daytime, which may be related to urban rain island. LST-day showed a cooling trend except in autumn, while LST-night showed a warming trend in all seasons. LSWT-day and LSWT-night both showed a warming trend except in summer. As can be seen, LST and LSWT have the same trend in autumn, showing a warming trend. Except for LST-night, there was a cooling trend in summer. In summer, cloud and rain weather interferes greatly and water temperature is affected by many factors, the cause of the cooling trend needs to be further studied.
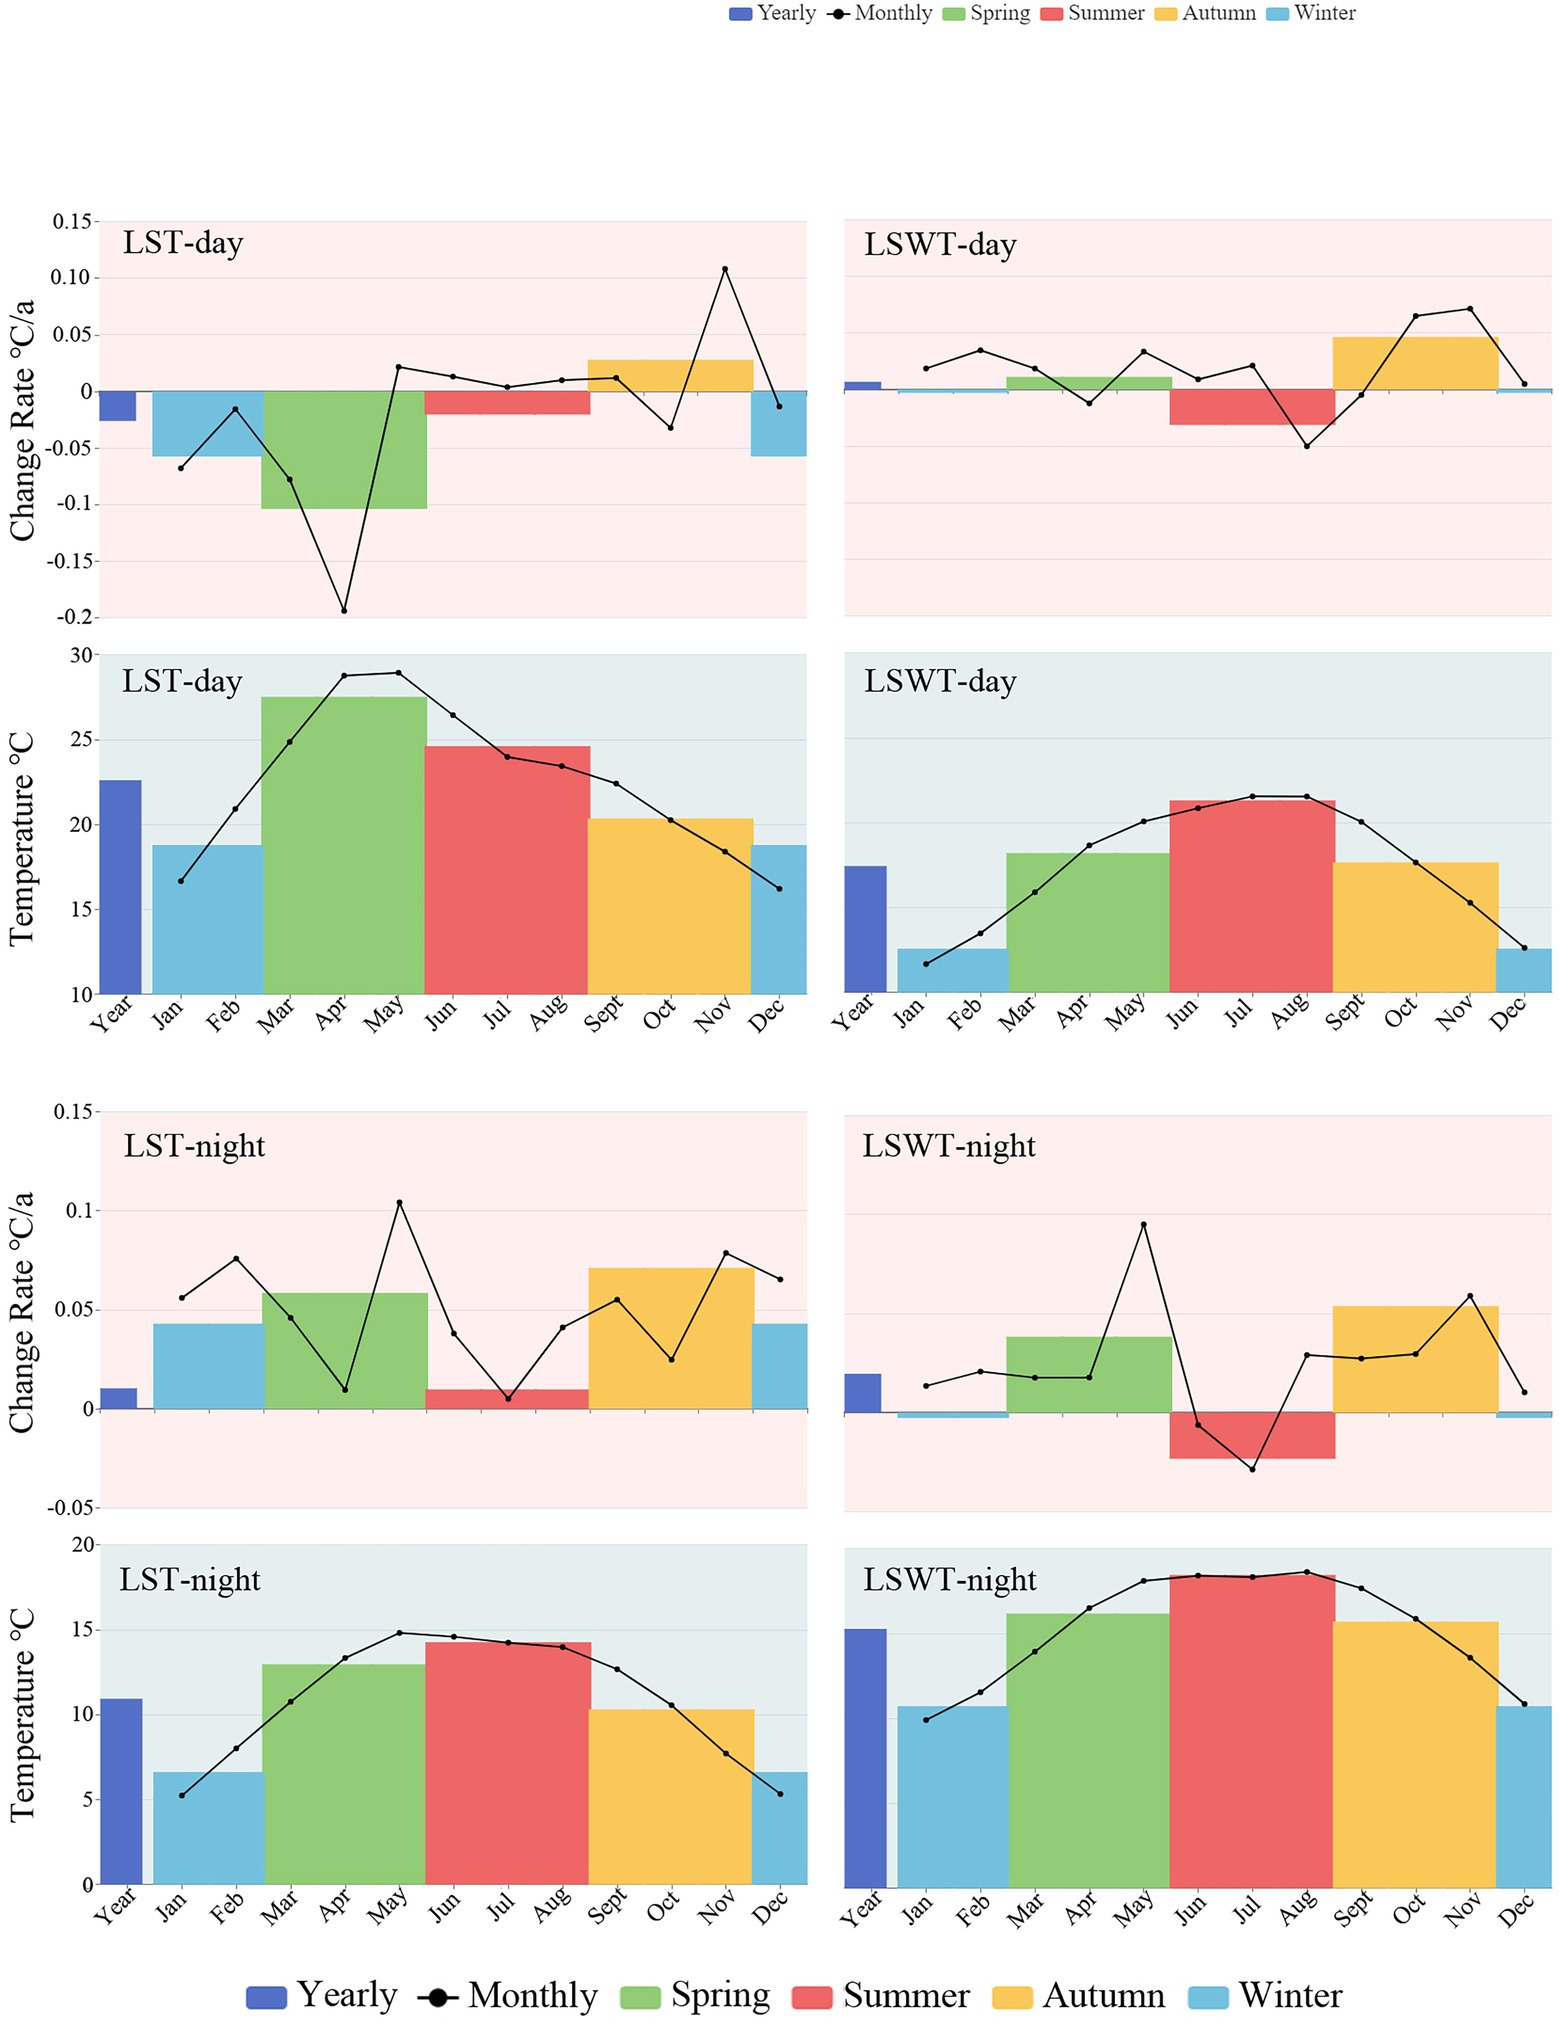
Figure 8. Multiscale average temperature and trend from 2001 to 2018.
The seasonal order of daily variation of LST from high to low is spring, winter, summer, and autumn. And the order of daily variation of LSWT from high to low is summer, spring, autumn, and winter. Caohai has the largest daily variation, which is above 5.5°C in all seasons. It is worth noting that the Caohai and the outer zone show the phenomenon that maximum in spring, minimum in autumn, followed by summer and winter, which is consistent with the LST. The seasonal order of daytime lake-land surface temperature (LST) difference from high to low is spring, winter, summer, and autumn. The seasonal order of lake-LST difference at night from high to low is autumn, winter, summer, and spring. It can be seen that in autumn, the lake-LST difference is the smallest in the daytime and the largest at night. In spring, the day is maximum and the night is minimum.
As shown in Figure 9, in spring, the whole Dianchi Lake and all parts of the lake show a warming trend in daytime and nighttime. The daytime LST showed a cooling trend, but the overall cooling trend was not significant. Sub-basin 13 and sub-basin 15 showed a warming trend, and sub-basin 13 showed a significant warming trend. At night, LST showed a warming trend except for sub-basin 9, and sub-basins 2, 3, 12, 13, 14, 15, 16, and 17 showed a significant warming trend. The annual mean daily variation of LST, daily variation of LSWT, the daytime temperature difference between LST and LSWT, and nighttime temperature difference between LST and LSWT were 14.55°C, 2.03°C, 9.31°C, and 3.21°C, respectively, and all showed a decreasing trend.
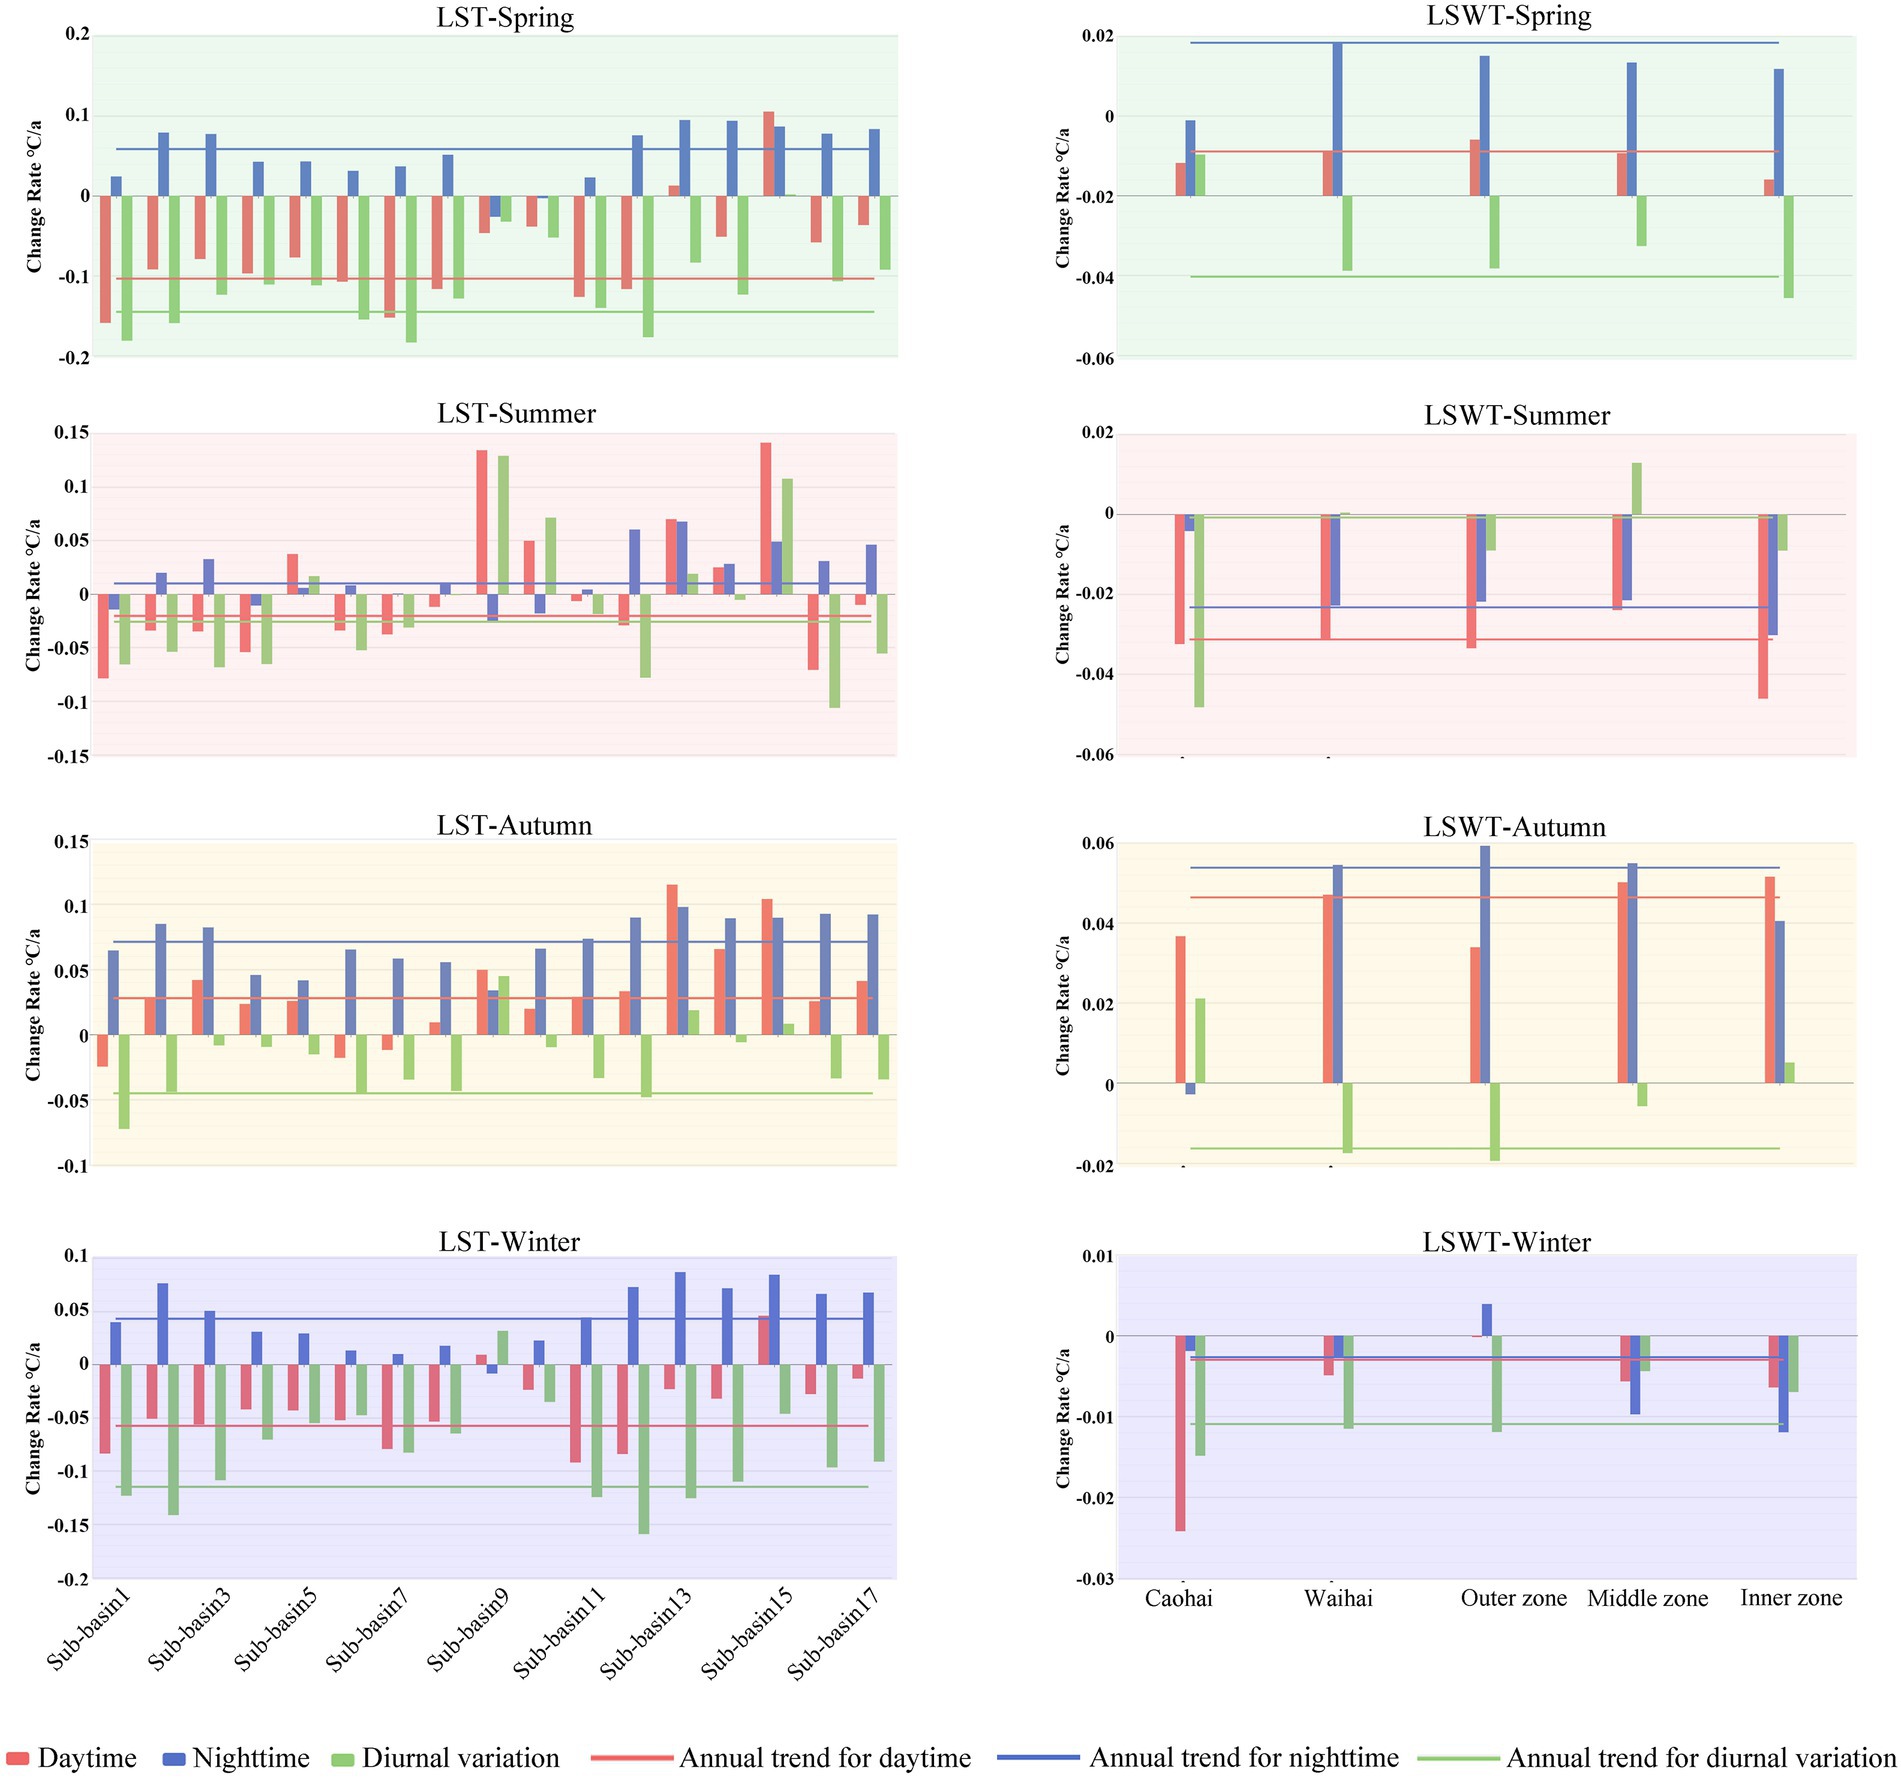
Figure 9. Seasonal scale temperature trends from 2001 to 2018.
In summer, the LSWT of the whole Dianchi Lake and all parts of the lake show a cooling trend in the daytime. And there is a cooling trend at night, except for Caohai. And the overall trend of LSWT-day and LSWT-night were −0.03°C/a and −0.02°C/a. LST-day showed a cooling trend, and the overall trend was −0.02°C/a. Sub-basins 5, 9, 10, 13, 14, and 15 showed a warming trend, among which 9, 10, 13, and 15 were significant. LST-night showed a warming trend, with the overall trend being 0.01°C/a. Sub-basins 1, 4, 9, and 10 showed a decreasing trend, while other sub-basins showed an increasing trend, among which 12 and 13 showed a significant increasing trend. The annual mean daily variation of LST, daily variation of LSWT, the daytime temperature difference between LST and LSWT, and nighttime temperature difference between LST and LSWT were 10.35°C, 2.86°C, 3.31°C, and 4.18°C, respectively. The temperature difference between LST and LSWT increased in the daytime, while the daily variation of LST, daily variation of LSWT, and nighttime temperature difference between LST and LSWT decreased.
In autumn, LSWT of the whole Dianchi Lake and all parts of the lake showed a warming trend in daytime and nighttime, and all but Caohai passed the significance test in the nighttime. LST showed a warming trend in daytime and nighttime, with a change rate of 0.03°C/a and 0.07°C/a, respectively, and the change rate of LST-night passed the significance test. The LST-day of sub-basins 1, 6, and 7 showed a cooling trend, while the rest showed a warming trend, among which sub-basins 13 and 15 passed the significance test. The LST-night of all sub-basins showed a warming trend, and sub-basins 2, 3, 11, 12, 13, 14, 15, 16, and 17 passed the significance test. The annual mean daily variation of LST, daily variation of LSWT, the daytime temperature difference between LST and LSWT, and nighttime temperature difference between LST and LSWT were 10.04°C, 1.96°C, 2.70°C, 5.39°C, respectively. The temperature difference between LST and LSWT increased at nighttime, while the daily variation of LST, daily variation of LSWT, and daytime temperature difference between LST and LSWT decreased.
In winter, LSWT showed a warming trend day and night. In the daytime, LSWT-day of the whole lake, Waihai, and the outer zone showed a warming trend, and the rest showed a cooling trend. While in the nighttime, LSWT-night of the whole lake, Caohai, and the outer zone showed a warming trend, and the rest showed a cooling trend. LST-day showed a cooling trend with a change rate of −0.06°C/a, and all sub-basins showed a cooling trend except for sub-basins 9 and 15. LST-night showed a warming trend, with an overall change rate of 0.04°C/a. Except for sub-basin 9, the LST-night of all sub-basins showed a warming trend, among which sub-basin 13 showed a significant warming trend. The annual mean daily variation of LST, daily variation of LSWT, the daytime temperature difference between LST and LSWT, and nighttime temperature difference between LST and LSWT were 12.17°C, 1.85°C, 6.22°C, and 4.10°C, respectively. And all four showed a decreasing trend.
As can be seen from the above results, the warming effect of urbanization is most obvious in autumn, and LST and LSWT show a warming trend in both daytime and nighttime in autumn. During the daytime, the trend of LST and LSWT was opposite in winter and spring, but the trend was the same in summer and autumn. The change trend of LSWT of Caohai and LST is the same in all seasons except for summer. During the nighttime, the change trend of LST and LSWT is opposite in summer, and the trend is the same in winter and spring. The change trend of LSWT of Caohai and LST is the same in all seasons. It indicates that the change trends of the whole lake and each part of the lake are not the same, and the LSWT of Caohai is heavily influenced by LST. In addition, consistent with the results of the annual scale, the warming effect at nighttime is more obvious than that at daytime. The trend pattern of Caohai and the outer zone is more likely to be inconsistent with that of the whole lake, and the sub-basins with high urbanization are more likely to show a warming trend in each season.
Analysis of spatial–temporal characteristics at the monthly scale
In the daytime, the LST reaches the annual maximum of 28.93°C in May and the annual minimum of 16.21°C in December. The difference between the average LST in the highest month and the lowest month is 12.72°C. The maximum monthly LSWT is 21.54°C in August, and the lowest monthly temperature is 11.76°C in January. The LSWT difference between the highest month and the lowest month is 9.87°C. During the daytime, the LST-day showed a warming trend in May, June, July, August, September, and November, and a cooling trend in January, February, March, April, October, and December (Figure 8). Among them, the whole basin and all sub-basins showed a warming trend in November, and sub-basins 13, 14, and 15 showed a significant warming trend. Sub-basin 15 showed a warming trend in all months, while sub-basin 1 showed a cooling trend except in November. LSWT-day showed a warming trend except for April and August, and LSWT of all spatial scales passed the significance test in November.
At night, the LST-night reached a peak of 14.81°C in May and a minimum of 5.24°C in January. The difference between the average LST-night in the highest month and the lowest month was 9.57°C. At night, the LSWT-night reached a peak of 18.63°C in August and a trough of 9.90°C in January. The average difference between the highest and lowest monthly LSWT-night was 8.73°C (Figure 8). During the nighttime, The LST-night showed a warming trend in all 12 months, and the warming trend was significant in May, with the maximum trend reaching 0.10°C/a. From the point of view of sub-basins, there was a warming trend in all months of sub-basins 2–4 and 12–17. Except for June and July, LSWT-night showed a warming trend, and the warming trend was significant in May and November. In May and November, all spatial scales LSWT passed the significance test except Caohai.
The daily variation of LST (LST-DV) reached a maximum value of 15.43°C in April and a minimum value of 9.46°C in August. The daily variation of LSWT (LSWT-DV) reached a maximum value of 3.22°C in July and a minimum value of 1.70°C in November. The maximum and minimum monthly diurnal variation of LSWT was 3 months later than that of LST. The maximum temperature difference between LST-day and LSWT-day (TD-day) is 10.11°C in April and the minimum is 1.90°C in August. The maximum temperature difference between LST-night and LSWT-night (TD-night) was 5.86°C in November and 3.16°Cin April. In April, the temperature difference between LST and LSWT was the largest in the daytime and the smallest in the nighttime (Figure 5). Similar to the previous results, most temperature differences show a cooling trend. LST-DV showed a cooling trend in all months. Except for July and October, LSWT-DV also showed a cooling trend. Except for June, August, and November, TD-day showed a cooling trend. TD-night showed a cooling trend except for October (Figure 5).
To sum up, on the monthly scale, we find that LST and LSWT peak months are not consistent, the former peak in May, and the latter in August. The extremum months of daily variation are not consistent too. LST-DV reached its maximum value and mini-mum value in April and August, respectively. The maximum and minimum values of LSWT-DV appeared in July and November. The maximum daily variation time of LSWT is three months behind that of LST. The maximum and minimum daytime temperature differences between LST-day and LSWT-day were in April and August, respectively. The temperature difference between LST-night and LSWT-night was the largest in November and the smallest in April. LST-day showed a warming trend in the rainy season and a cooling trend in the dry season. All months of LST-night show a warming trend, and there is a significant warming trend in peak months. LSWT showed a warming trend in most months. For LSWT-Day, the temperature dropped in April and August, and the temperature increased in other months. For LSWT-night, the temperature drops in June and July, and increases in the rest months.
Response analysis of LSWT to LST
Analysis of air temperature background
The results of the Pearson correlation analysis showed that there was a high correlation between air temperature (AT) and LSWT during the study period from 2009 to 2018. The correlation coefficients of daytime and nighttime were 0.9474 and 0.9538, respectively. The LSWT is consistent with the AT highly, indicating that AT is an important factor affecting LSWT. Then the variation trends of AT, LSWT, and LST from 2009 to 2018 in daytime and nighttime were calculated, respectively (Figure 10). In the daytime, the AT showed cooling trends most time except for March, September, and December, the LST also showed cooling trends most time except for November and December. While LSWT does not always cool, the cooling trends only in February, May, September, winter, spring, and yearly, and the increasing rate of LSWT in December was greater than that of AT. At night, LSWT showed a warming trend in July, October, and November, while AT showed a cooling trend in the corresponding period. And the increasing rate of LSWT was greater than that of AT in the year, autumn, January, and December. The abnormal warming phenomenon of LSWT may indicate that AT is not the only reason of the LSWT changing, and it is reasonable to speculate that additional heat sources contributed to the rise of LSWT.
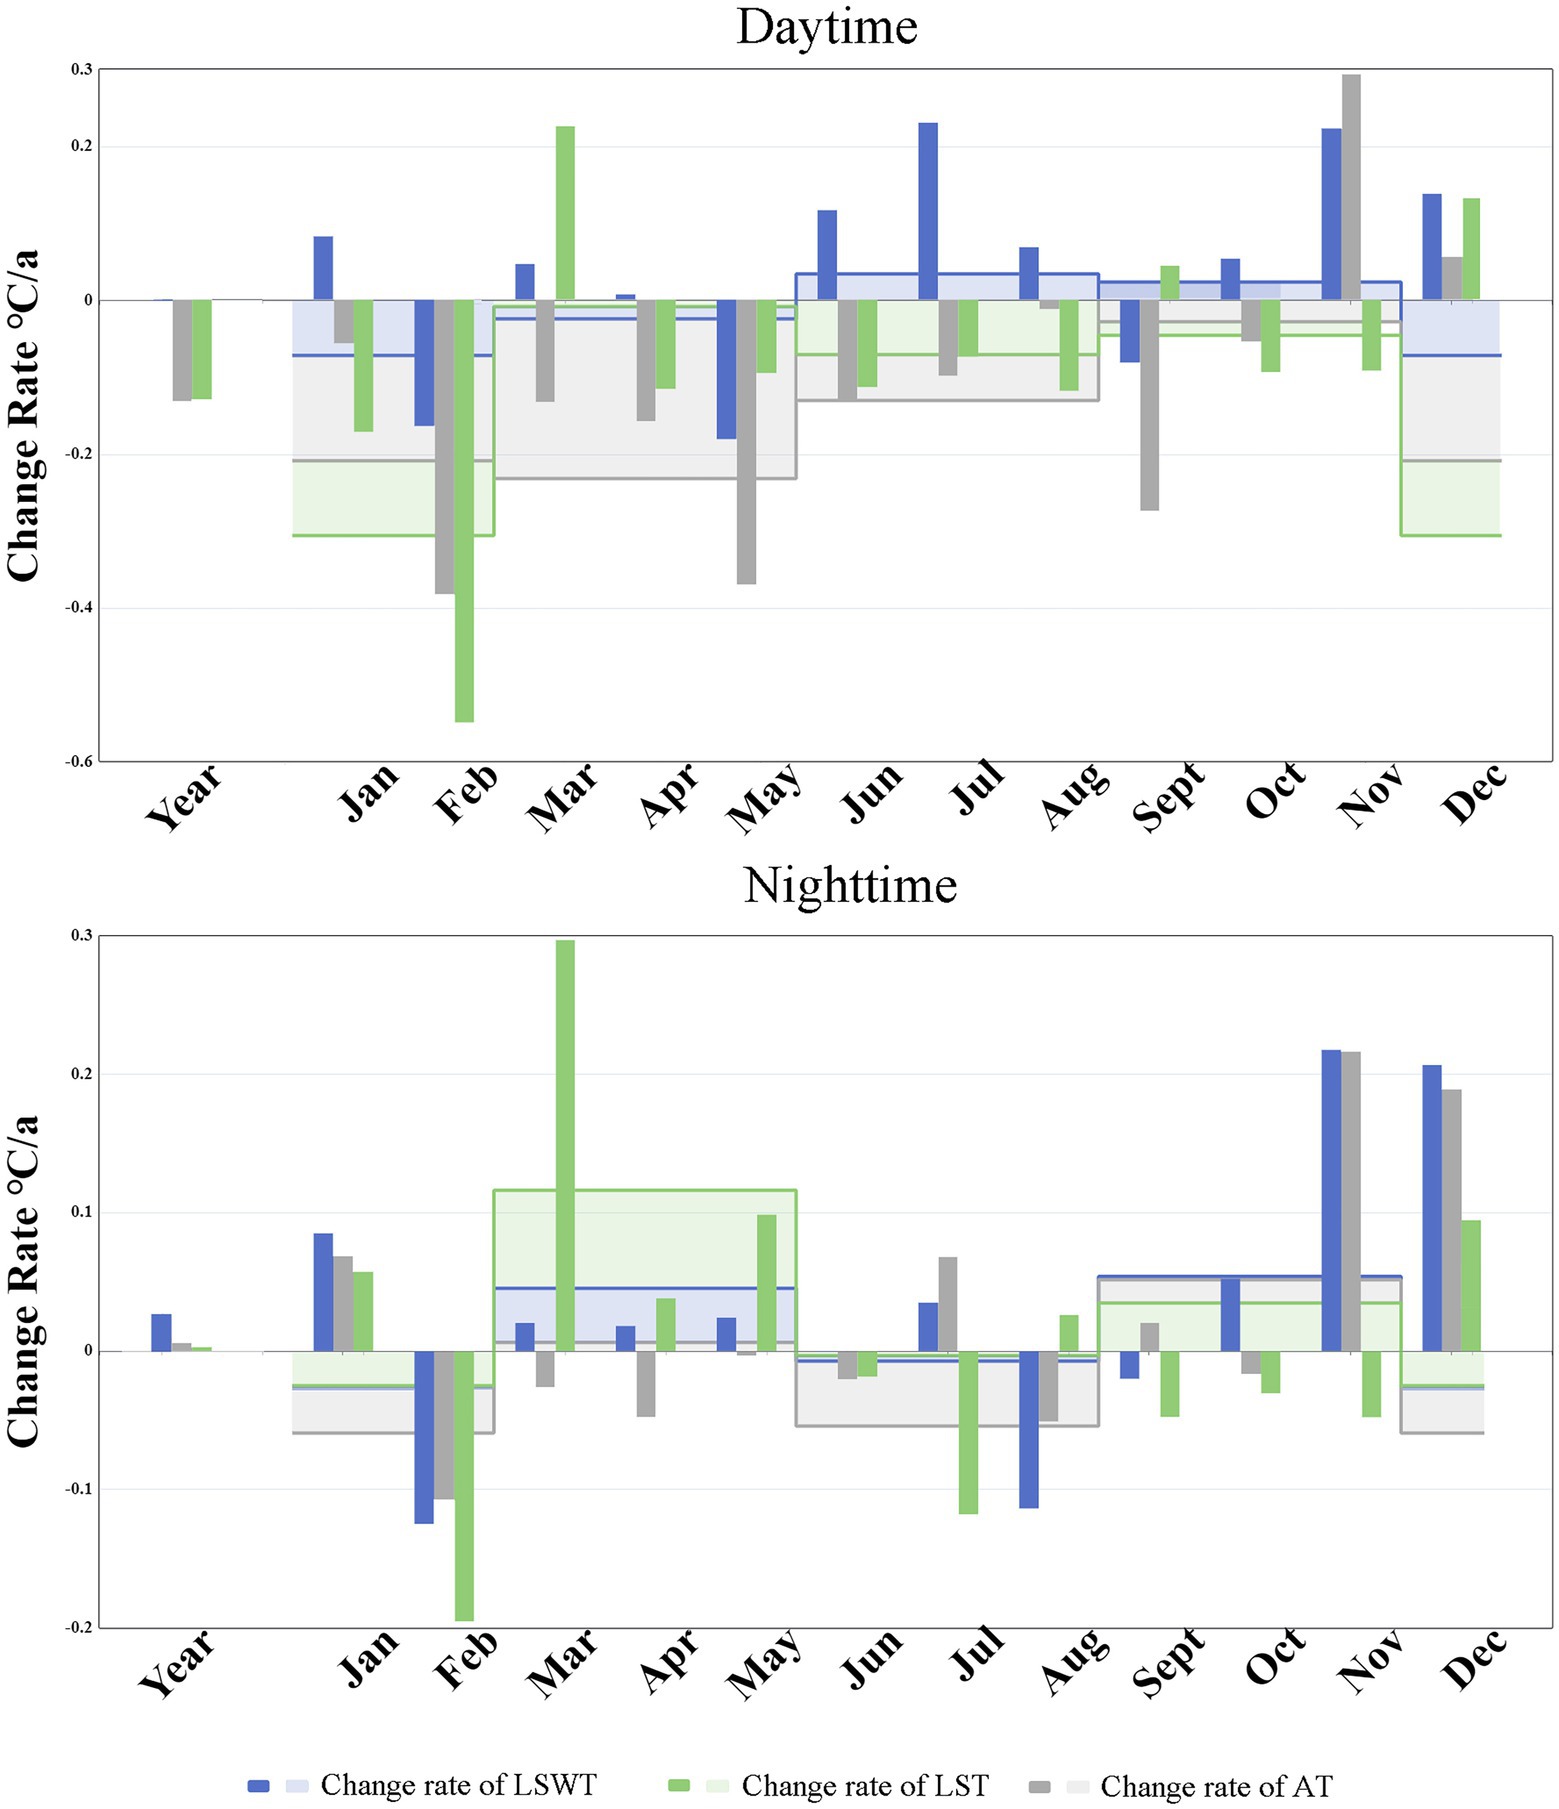
Figure 10. Temperature trends of AT, LSWT, and LST from 2009 to 2018.
Spatial influence distribution and LSWT water partition response
The results of multiyear mean normalization of spatial influence and water partition change trend response are shown in Figure 11. According to the results of spatial influence calculation, the spatial influence of LSWT has a certain directional rule. The annual mean temperature differences of day, night, and day showed the same rule that the spatial influence values of the north, east and south directions were large, while the west, southwest, and northwest directions were relatively small. This is related to the fact that the west part of Dianchi Lake is Xishan mountain and the urban development is limited. The spatial influence well reflects the spatial distribution of LST in the basin. The calculation results of the zonal trend of LSWT showed that the north, northwest, and west directions showed a cooling trend during the daytime. This is similar to daytime LST. The other directions showed a warming trend, basically in line with the trend of gradually weakening from the outer layer to the inner layer. The trend distribution of the outer buffer is consistent with the spatial influence. At night, the LSWT showed an overall warming trend. Similar to the daytime situation, the warming trend in the northwest and west direction is low. The lower warming trend in the northeast may be the mitigating effect of some wetland projects around the lake. It is worth noting that the contrast between the east and west trends is striking. The warming trend on the East Coast was large during daytime and at night, while the warming trend on the west coast was small, and the temperature even dropped during daytime. The greater the spatial influence of the lake partition is, the greater the trend of LSWT is, and the more obvious the correlation is in the outer buffer zone. This pattern is more pronounced in the outer buffer. And the temperature difference is a downward trend. The decline is greater in the north, northwest, west, and east.
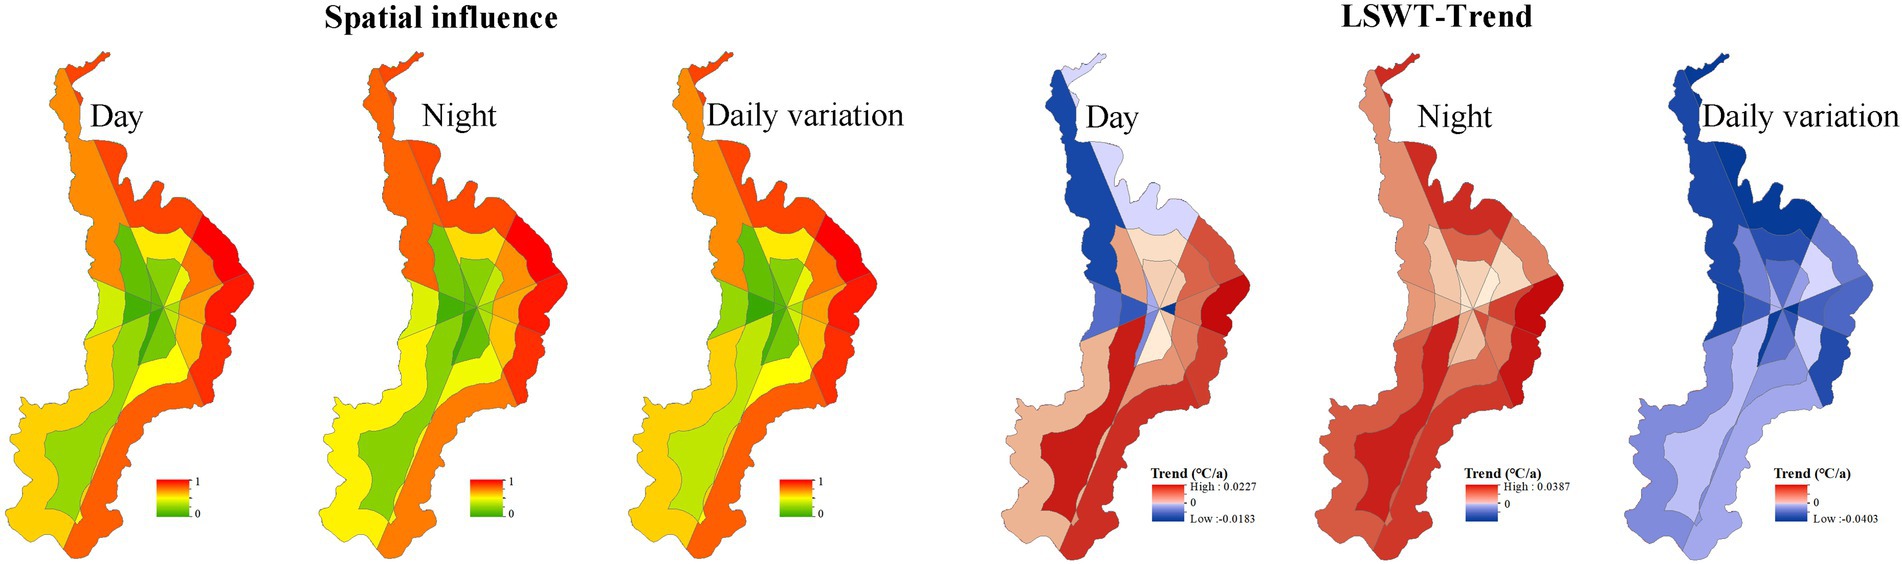
Figure 11. Spatial influence and LSWT trends of lake partition.
Correlation analysis between spatial influence and LSWT
The correlation analysis between spatial influence and water temperature showed that the correlation between spatial influence and LSWT was high in daytime, nighttime, and temperature difference, most of which were above 0.8 (Figure 12). The mean values of correlation between spatial influence and lake surface temperature were 0.9168 and 0.9196, respectively. Overall, the nocturnal correlation was higher than the diurnal correlation. Both daytime and nighttime correlations show that the grass sea has a higher correlation than the open sea and the correlation between the outer buffer and the inner buffer decreases.
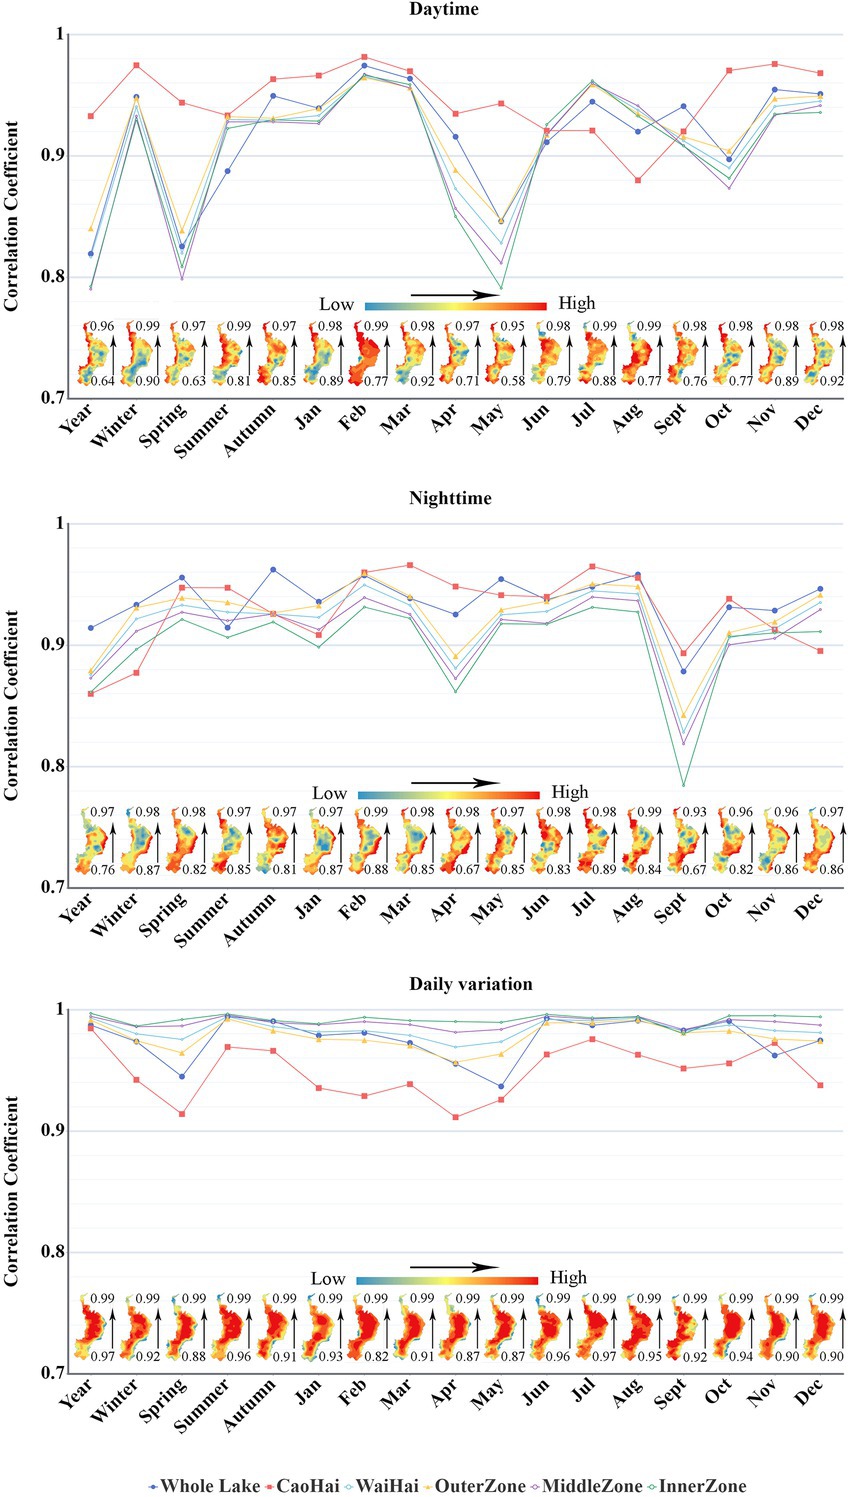
Figure 12. Correlation of G and T.
During the daytime, the correlation of LSWT of all parts and the whole was the highest in February, and the correlation of Caohai was as high as 0.9814 in February. The inner buffer has the lowest correlation in May, which is 0.7909. At night, Waihai, outer layer, and inner layer had the highest correlation in February, while the whole lake, Caohai, and middle layer had the highest correlation in autumn, March, and July, respectively. The highest correlation was 0.9658 in Caohai in March, and the lowest correlation was 0.7843 in the inner buffer in June.
The correlation between spatial influence temperature difference and the LSWT temperature difference is very high, the correlation is greater than 0.9, and the average correlation is 0.9780. On the whole, the temperature difference correlation of Caohai is the lowest, and that of the inner buffer is the highest. The correlation between daytime and nighttime is the opposite. The correlation between temperature differences in the Caohai is lower than that in the Waihai, and the correlation between the outer buffer and the inner buffer is increasing. The specific reasons need to be further analyzed.
Centre of gravity migration trajectory
In general, the migration range of the monthly gravity center in the dry season is small, while that in the rainy season is large, and the seasonal and annual scale changes are also large. In the dry season, due to the small range of change, the change is not obvious, small interference. The consistency of gravity center trajectory direction is 82.9% after the dry season is excluded.
The transfer trajectory of the gravity center of LSWT is very consistent with that of space influence. The characteristics of the center of gravity migration are analyzed by taking the center of gravity migration trajectory of the annual mean at night as an example (Figure 13). The research period is divided into three periods, namely 2001 to 2007, 2007 to 2013, and 2013 to 2018. It is found that the gravity center migration of G and T shows a northeast-southwest trend, which is related to the urban expansion of Kunming to Airport New Area, Chenggong New Area, and Majinpu High-tech Zone. The migration space range of spatial influence G is larger than that of LSWT T. From 2001 to 2007, the migration of spatial influence G was mainly in the north direction, and the urban expansion in this period was mainly the marginal and depression-filled urban expansion in the northern main city of Dianchi Lake. In the second period, 2007–2013, the situation changed. From 2007 to 2008, the center of gravity showed a southward trend. This is mainly because Chenggong New Area is located in the southeast of the old city. After 2008, it showed a trend of east and north development. From 2013 to 2018, it still keeps the trend eastward, and the migration range of the center of gravity becomes smaller. The change range of T center of gravity of LSWT is small, and it also migrated northward and eastwards on the whole, but the direction and range of migration are not completely consistent with the spatial influence, mainly because there are many factors affecting the change of water temperature center of gravity, so the migration trajectory of the center of gravity presents certain differences.
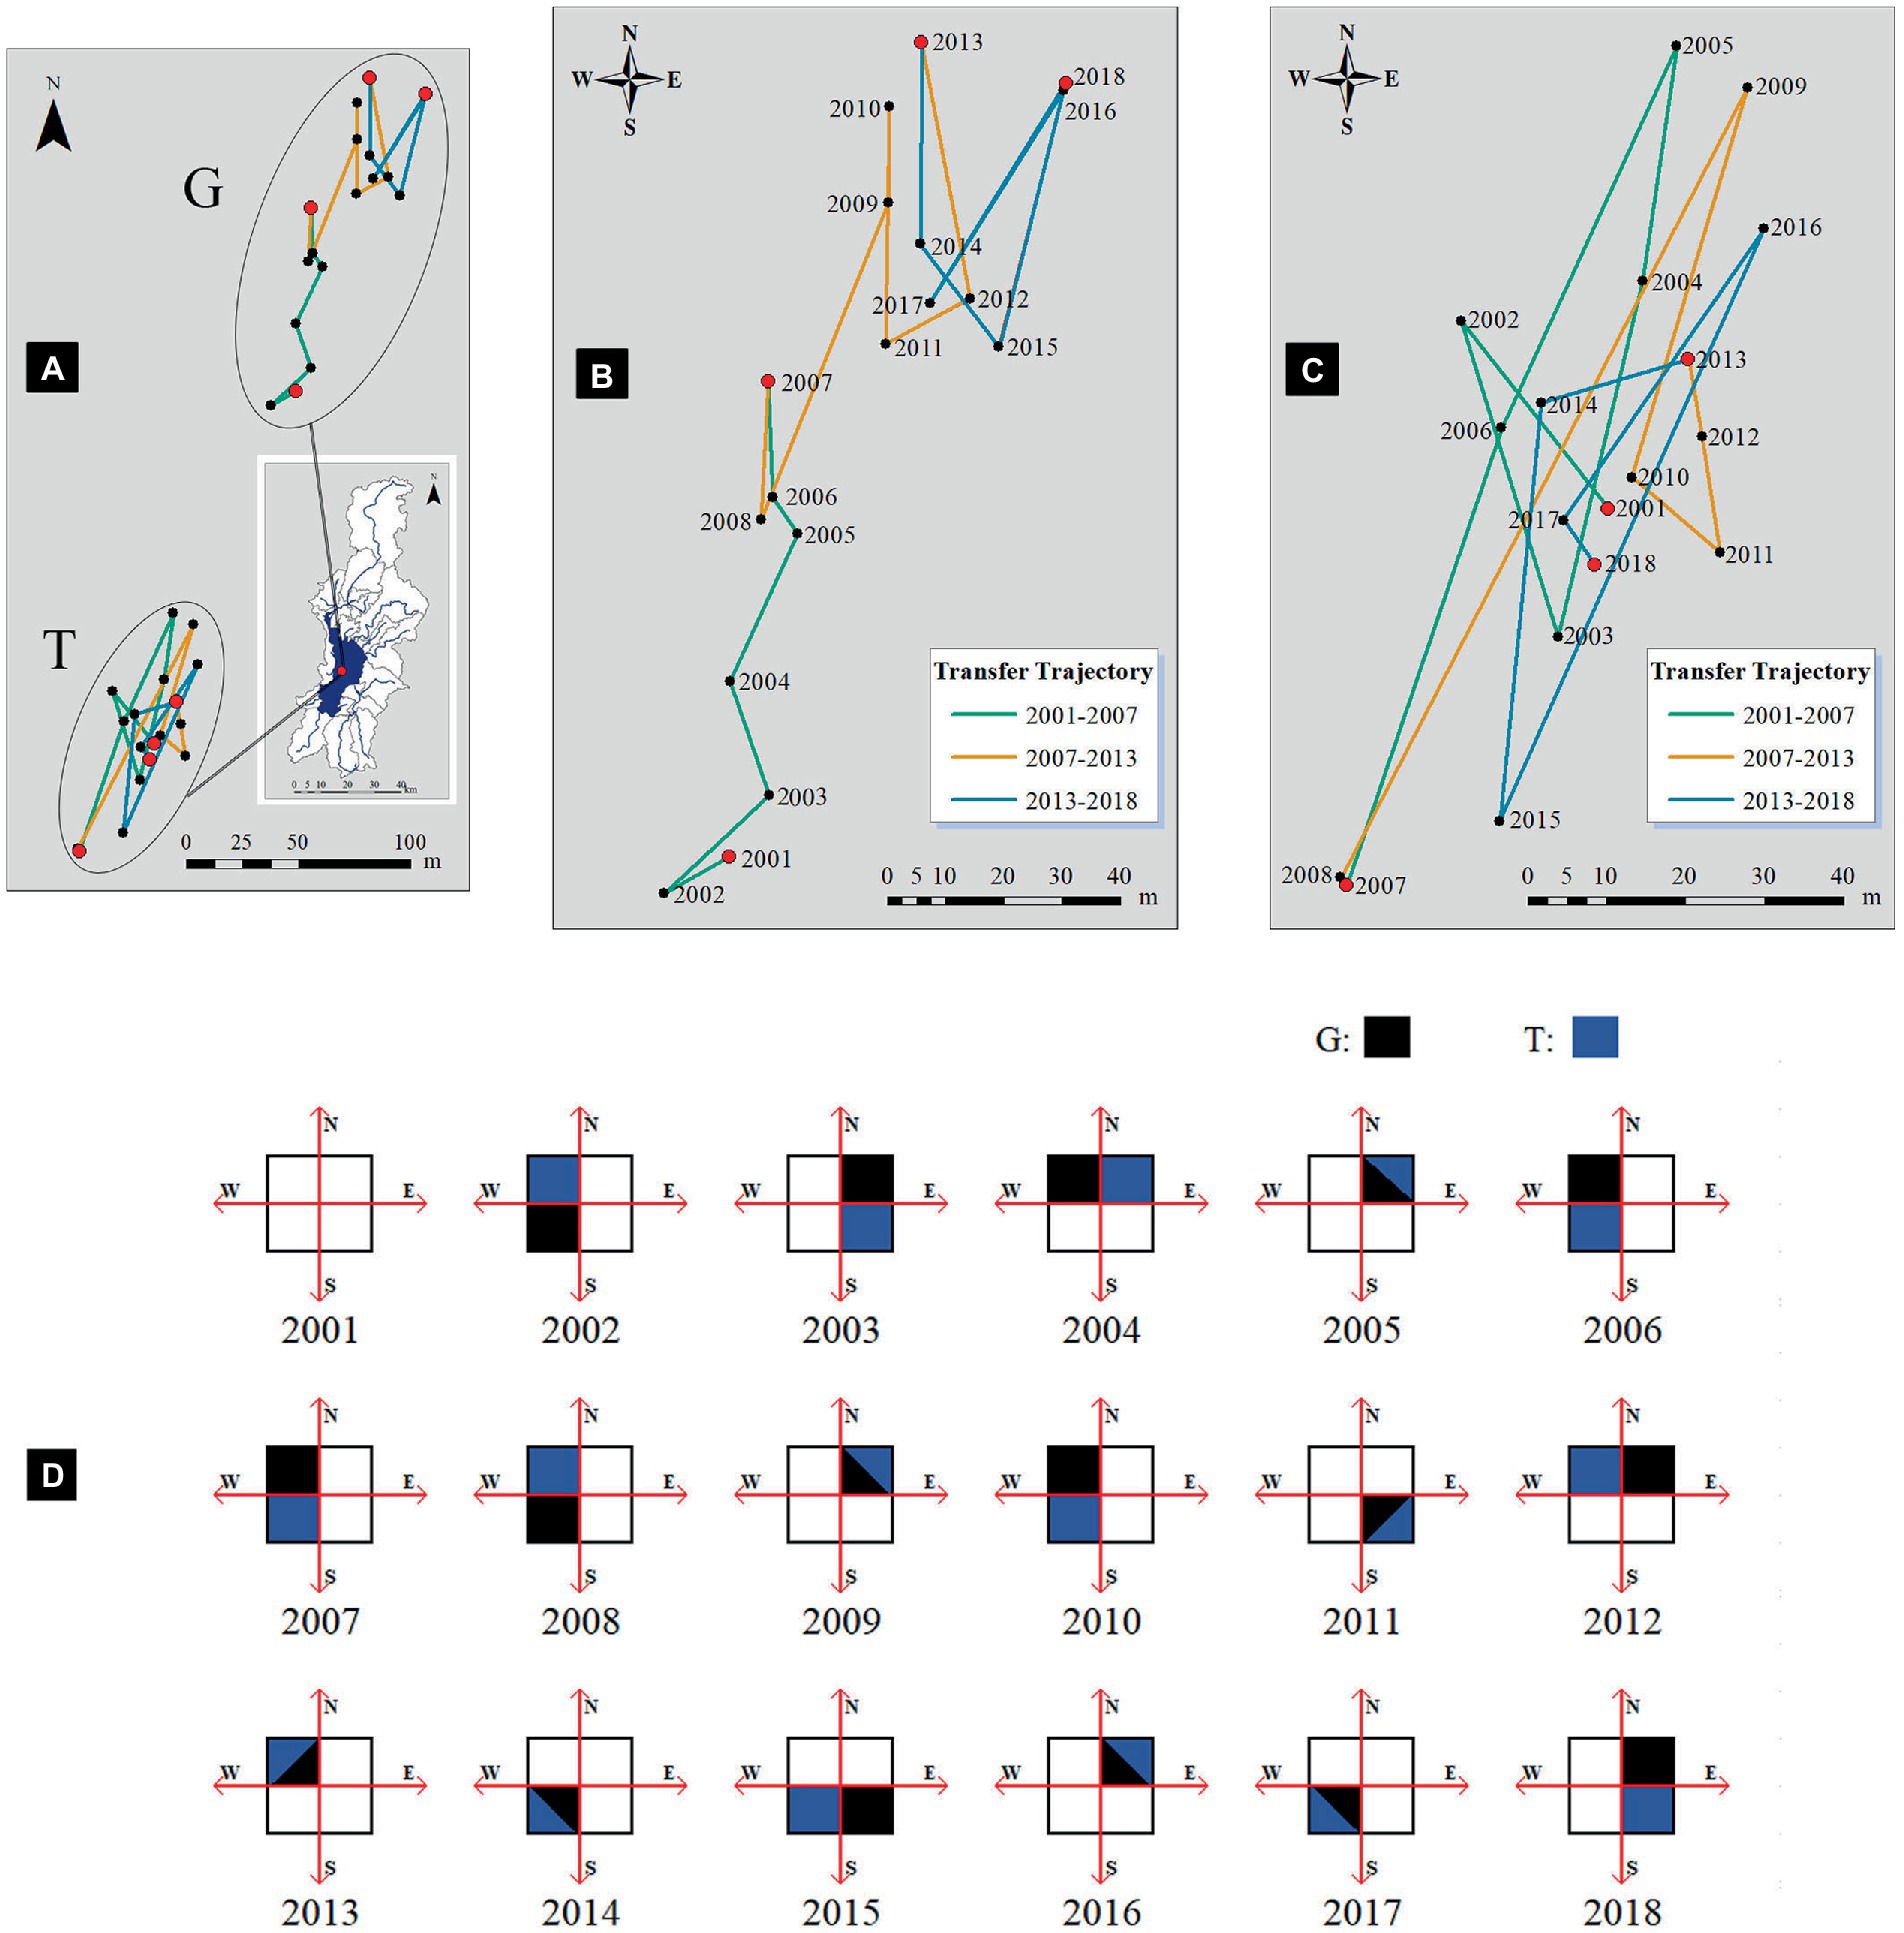
Figure 13. Migration trajectories and direction quadrants of spatial influence (G) and LSWT (T) from 2001 to 2018. (A) migration trajectories of G and T; (B) migration trajectory of G; (C) migration trajectory of T; (D) quadrant diagrams of gravity center migration direction of G and T.
Annually from 2001 to 2018, the center of gravity position relative to the previous year’s center of gravity location of the relative spatial orientation mapping statistics, we found that the relative location of the center of gravity position diagram, all the year present G and T consistent direction migration or migration of north and south direction is consistent even two directions are consistent with the rule, not present situation, the focus of the migration path in the opposite direction, Therefore, we believe that there is an obvious relationship between the two migrations. It is found that the years of G and T moving in the same quadrant are gradually increasing, including 1 from 2001 to 2006, 2 from 2007 to 2012, and 4 from 2013 to 2018. Surface With the rapid expansion of the impervious surface of Dianchi Lake basin, the influence degree of spatial influence G on the surface water temperature of the lake is increasing, and the influence proportion is increasing.
Discussion
Studies have shown that the world’s lakes are warming quickly by about 0.3°C each decade on average, according to a new global synthesis of lake temperature data (Witze, 2015). In our results, LSWT of Dianchi Lake increases by 0.01°C/a in the daytime and 0.02°C/a at night, respectively, which is slightly lower than the former data. The spatial difference of temperature trend distribution indicates that Dianchi Lake basin does not present an overall warming trend. The surface temperature of inner zone of lake and the sub-basins dominated by natural environment all show a cooling trend (Figure 4). The general climate background is a cooling, and the warming of LSWT and LST is not the result of the general climatic background but is obviously related to human activities at the local scale of the watershed. Lakes, as sentinels of global climate change, are sensitive indicators of climate change (Livingstone and Dokulil, 2001; Adrian et al., 2009; Politi et al., 2012; Wan et al., 2018). At the local scale of the watershed, we can see that LSWT is more sensitive than LST, and it is also a sentinel of the impact of human activities on the thermal environment (Yang et al., 2019b) compared the effects of human activities on the LSWT across lakes, and found that the warming trend of urban and semi-urban lakes was higher than that of natural lakes. By comparing the characteristics of LST and LSWT, this study verifies the impact of human activities on LSWT from the perspective of spatial heterogeneity for a single lake, laying a foundation for subsequent quantitative research on the threshold of impact range. Abnormal warming of LSWT at a rate higher than that of climate warming also has been mentioned in several studies (Schneider et al., 2009; Schneider and Hook, 2010; O'Reilly et al., 2015; Dong et al., 2016; Woolway and Merchant, 2017; Sharma et al., 2019; Woolway et al., 2019). Factors affecting LSWT are different in different lakes, and the long-term trend of lake temperature does not necessarily follow the change of air temperature (Andrew et al., 2008; Politi et al., 2012; Schmid et al., 2014), but also related to external environmental conditions such as lake morphology, hydrological characteristics, internal physical structure, air temperature, wind speed, water transparency, solar radiation, and surrounding landform changes (Livingstone and Dokulil, 2001; Layden et al., 2015; Woolway et al., 2016; Gray et al., 2018). The rise of LSWT in Dianchi Lake basin is mainly related to the change of land use type and urbanization around Dianchi Lake.
However, the existence of some objective factors may have a negative impact on the research results. On the one hand, the surface thermal environment is highly sensitive to time, and MODIS is a good choice for this research. However, the spatial resolution is limited, and the impact range and distance threshold of urbanization on the lake need further quantitative analysis. We describe the response range of LSWT only through rough three-layer buffer and eight directions. This division is subjective to a certain extent, and it is difficult to satisfy the requirements of determining the range of influence and the threshold of distance from shore to LSWT. In future studies, multi-source data fusion and downscaling methods should be considered to obtain more accurate data. On the other hand, due to the interference of cloud and rainfall, it is very common to lose data in summer. In order to verify whether the missing data in summer after interpolation and filtering still affect the results, we compared LSWT with in-situ data through error analysis and correlation analysis. The results show that RMSE and MAE are 2.43 K and 2.34 K, respectively, in summer daytime, and the RMSE and MAE at night in summer are 3.11 K and 2.12 K respectively, It is slightly lower than the overall level, but the error range is acceptable. The Pearson coefficient of daytime and nighttime in summer are 0.73 and 0.79 respectively, while on the whole are 0.86 and 0.90, respectively. The results show that the missing of summer data does have some impact on the accuracy of the data. The estimation result obtained by interpolation is pixel temperature under theoretical clear sky condition, which is different from the real pixel temperature under cloud, which may inevitably bring some errors in this process. The reconstruction of cloud data is still a problem worthy of further discussion in order to obtain more accurate LST data.
The following three aspects need to be further studied. First of all, during the study period, the positive effects of Dianchi Lake water environment treatment projects such as water diversion project, wetland project around the lake, and thermal pollution discharge pretreatment facilities exist at the same time as the negative effects of urbanization, population pressure and economic growth. These factors have a comprehensive impact on the thermal environment of the whole basin, and the contribution of each driving factor needs to be further analyzed. Then, the internal mechanism and process between short-term impact and long-term impact of urbanization on lake water temperature need to be further discussed. Finally, the contribution of human activities to surface water temperature of Dianchi Lake needs further analysis.
Conclusion
From a new research perspective, we comprehensively analyzed the characteristics of surface thermal environment at the watershed scale, divided the Dianchi Lake basin into two parts: land and lake, and conducted a comparative analysis of LST and LSWT. At the same time, the warming phenomenon of Dianchi Lake has been verified at annual, seasonal and monthly scales. It can be found that the urban heat island effect of the land part of Dianchi Lake is not obvious, and even the surface temperature has a trend of decreasing. The spatial distribution of LSWT, intra-lake heterogeneity of thermal responses and the shift of center of gravity are related to human activities on land. The main conclusions are summarized as follows:
From 2001 to 2018, the surface thermal environment of Dianchi Lake basin presents the following characteristics: (1) Due to the difference of specific heat capacity, multiyear mean of LST is higher than that of LSWT in daytime, while nighttime LSWT is higher than LST. The seasonal patterns of LST and LSWT are inconsistent, while Caohai is greatly affected by land, and the seasonal patterns of temperature change are similar to those of land. LST and LSWT peak months are not consistent, the former peak in May, and the latter in August. The extremum months of daily variation are not consistent too. The maximum daily variation time of LSWT is three months behind that of LST. (2) In terms of time series changes, the warming effect of urbanization on LST is greater than that on LST, and the warming effect at night is greater than that at daytime. From 2001 to 2018, the daytime and nighttime warming trends of LSWT were 0.01°C/a and 0.02°C/a, respectively, while the daytime cooling trends of LST were −0.03°C/a and the nighttime warming trends were 0.01°C/a. The warming effect of urbanization is most obvious in autumn, and LST and LSWT show a warming trend in both daytime and nighttime in autumn. The trend pattern of Caohai and the outer zone is more likely to be inconsistent with that of the whole lake, and the sub-basins with high urbanization are more likely to show a warming trend in each season. (3) In terms of spatial distribution, the surface thermal environment effect of land is mainly reflected in the spatial expansion of LST high temperature region. From 2001 to 2018, the overall expansion of the high temperature region showed that the high temperature region expanded in eight directions to different degrees. Except for the west, the expansion is obvious in the other seven directions. The main expansion direction was southeast and north, and the expansion rate was 4.21 km2/a and 3.25 km2/a, respectively. The warming response of LSWT to thermal environment has spatial heterogeneity. The change rate decreases from the shore to the center of the lake, and the warming trend in the eastern lake area is greater than that in the western lake area. (4) Areas with high human activity are warming faster. The variation trend of surface thermal environment has spatial differences. The sub-basins with high urbanization and lake parts near the shore of human activity usually have obvious warming effect, while the near-shore water body is greatly affected by LST, and the change rule of seasons and months tends to be similar. Highly urbanized sub-basins tend to have a warming trend, even as other sub-basins generally decline. In Caohai and the Outerzone area, the change rule of LSWT is similar to that of LST, and usually has a higher warming trend. (5) Temperature differences show a cooling trend. The daily variation of LST, the daily variation of LSWT, the temperature difference between LSWT and LST in the daytime, and temperature difference between LSWT and LST at night all showed a decreasing trend. The decreasing trend of temperature difference reflects the response of heat exchange in the basin, that a greater warming trend at night than during daytime and a greater warming trend of LSWT than that of LST.
Response characteristics of LSWT in Dianchi Lake basin: Lake water temperature is not a single air temperature response. In this case, LSWT has an obvious response to the spatial influence of LST. The LSWT in the regions with high spatial influence tends to rise, especially in the outer buffer zone (within 2 km of the shore). The most obvious example is the comparison between the east part and the west part of Dianchi Lake. The east part has a higher spatial influence and obvious warming trend than the west part. The correlation between spatial influence and LSWT is different at different spatial and temporal scales. At the spatial scale, the correlation between spatial influence and LSWT of Caohai and the outer zone is higher. At the time scale, it is most correlated in February, less correlated in summer, and more correlated at nighttime than at daytime. This shows that the spatial influence has a certain scope of action and time window. The gravity transfer trajectory of LSWT and spatial influence is consistent. The transfer direction of gravity center of spatial influence is consistent with that of LSWT. The influence of LST brought by human activities on LSWT cannot be ignored.
Data availability statement
Publicly available datasets were analyzed in this study. This data can be found here: https://ladsweb.modaps.eosdis.nasa.gov.
Author contributions
KY and YL: conceptualization. YZ and YL: methodology and writing—review and editing. YZ: writing—original draft and visualization. ZY: validation. KY and YL: supervision, project administration, and funding acquisition. All authors have revised the final manuscript. All authors contributed to the article and approved the submitted version.
Funding
This work was supported by the National Natural Science Foundation of China (NSFC): 42271441, and the Ten Thousand Talent Plans for Young Top-notch Talents of Yunnan Province: YNWR-QNBJ-2019-200.
Acknowledgments
We are grateful to platforms and institutions for providing data support. MODIS data is provided by NASA LAADS Web; DEM and Landsat data was downloaded from the geospatial Data Cloud platform of Computer Network Center, Chinese Academy of Sciences; The hourly air temperature data of the Kunming meteorological station of this study was obtained from the Yunnan Meteorological Bureau; GAIA data was downloaded from Tsinghua University; and the in situ measurement LSWT data were provided by Yunnan Research Academy of Eco-environmental Sciences.
Conflict of interest
The authors declare that the research was conducted in the absence of any commercial or financial relationships that could be construed as a potential conflict of interest.
Publisher’s note
All claims expressed in this article are solely those of the authors and do not necessarily represent those of their affiliated organizations, or those of the publisher, the editors and the reviewers. Any product that may be evaluated in this article, or claim that may be made by its manufacturer, is not guaranteed or endorsed by the publisher.
Footnotes
References
Adamowski, J., and Prokoph, A. (2013). Assessing the impacts of the urban heat island effect on streamflow patterns in Ottawa, Canada. J. Hydrol. 496, 225–237. doi: 10.1016/j.jhydrol.2013.05.032
Adrian, R., Reilly, C., Zagarese, H., Baines, S. B., Hessen, D. O., Keller, W., et al. (2009). Lakes as sentinels of climate change. Limnol. Oceanogr. 54, 2283–2297. doi: 10.4319/lo.2009.54.6_part_2.2283
Andrew, J. T., Norman, D. Y., Keller, B., Girard, R., Heneberry, J., Gunn, J. M., et al. (2008). Cooling lakes while the world warms: effects of forest regrowth and increased dissolved organic matter on the thermal regime of a temperate. urban lake. 53, 404–410. doi: 10.4319/lo.2008.53.1.0404
Atta Ur, R., and Dawood, M. (2016). Spatio-statistical analysis of temperature fluctuation using Mann–Kendall and Sen’s slope approach. Clim. Dyn. 48, 783–797. doi: 10.1007/s00382-016-3110-y
Chen, Y., Yang, J., Yang, R., Xiao, X., and Xia, J. C. (2022). Contribution of urban functional zones to the spatial distribution of urban thermal environment. Build. Environ. 216:109000. doi: 10.1016/j.buildenv.2022.109000
Connors, J. P., Galletti, C. S., and Chow, W. T. L. (2012). Landscape configuration and urban heat island effects: assessing the relationship between landscape characteristics and land surface temperature in Phoenix, Arizona. Landsc. Ecol. 28, 271–283. doi: 10.1007/s10980-012-9833-1
Dong, B., Sutton, R. T., and Shaffrey, L. (2016). Understanding the rapid summer warming and changes in temperature extremes since the mid-1990s over Western Europe. Clim. Dyn. 48, 1537–1554. doi: 10.1007/s00382-016-3158-8
Estoque, R. C., Murayama, Y., and Myint, S. W. (2017). Effects of landscape composition and pattern on land surface temperature: an urban heat island study in the megacities of Southeast Asia. Sci. Total Environ. 577, 349–359. doi: 10.1016/j.scitotenv.2016.10.195
Gong, P., Li, X., Wang, J., Bai, Y., Chen, B., Hu, T., et al. (2020). Annual maps of global artificial impervious area (GAIA) between 1985 and 2018. Remote Sens. Environ. 236:111510. doi: 10.1016/j.rse.2019.111510
Gray, B. R., Robertson, D. M., and Rogala, J. T. (2018). Effects of air temperature and discharge on upper Mississippi River summer water temperatures. River Res. Appl. 34, 506–515. doi: 10.1002/rra.3278
He, B. J., Zhao, D. X., Xiong, K., Qi, J., Ulpiani, G., Pignatta, G., et al. (2021). A framework for addressing urban heat challenges and associated adaptive behavior by the public and the issue of willingness to pay for heat resilient infrastructure in Chongqing, China. Sustain. Cities Soc. 75:103361. doi: 10.1016/j.scs.2021.103361
Hirst, A. J., Giri, K., Ball, D., and Lee, R. S. (2017). Determination of the physical drivers of Zostera seagrass distribution using a spatial autoregressive lag model. Mar. Freshw. Res. 68:1752. doi: 10.1071/mf16252
Janke, B. D., Herb, W. R., Mohseni, O., and Stefan, H. G. (2009). Simulation of heat export by rainfall–runoff from a paved surface. J. Hydrol. 365, 195–212. doi: 10.1016/j.jhydrol.2008.11.019
Kraemer, B. M., Anneville, O., Chandra, S., Dix, M., Kuusisto, E., Livingstone, D. M., et al. (2015). Morphometry and average temperature affect lake stratification responses to climate change. Geophys. Res. Lett. 42, 4981–4988. doi: 10.1002/2015gl064097
Kustas, W. P., Norman, J. M., Anderson, M. C., and French, A. N. (2003). Estimating subpixel surface temperatures and energy fluxes from the vegetation index–radiometric temperature relationship. Remote Sens. Environ. 85, 429–440. doi: 10.1016/s0034-4257(03)00036-1
Layden, A., Merchant, C., and MacCallum, S. (2015). Global climatology of surface water temperatures of large lakes by remote sensing. Int. J. Climatol. 35, 4464–4479. doi: 10.1002/joc.4299
Li, J., Song, C., Cao, L., Zhu, F., Meng, X., and Wu, J. (2011). Impacts of landscape structure on surface urban heat islands: a case study of Shanghai, China. Remote Sens. Environ. 115, 3249–3263. doi: 10.1016/j.rse.2011.07.008
Liu, G., Ou, W., Zhang, Y., Wu, T., Zhu, G., Shi, K., et al. (2015). Validating and mapping surface water temperatures in Lake Taihu: results from MODIS land surface temperature products. IEEE J. Sel. Top. Appl. Earth Obs. Remote Sens. 8, 1230–1244. doi: 10.1109/jstars.2014.2386333
Liu, B., Wan, W., Xie, H., Li, H., Zhu, S., Zhang, G., et al. (2019). A long-term dataset of lake surface water temperature over the Tibetan plateau derived from AVHRR 1981-2015. Sci. Data 6:48. doi: 10.1038/s41597-019-0040-7
Livingstone, D. M., and Dokulil, M. T. (2001). Eighty years of spatially coherent Austrian lake surface temperatures and their relationship to regional air temperature and the North Atlantic oscillation. Limnol. Oceanogr. 46, 1220–1227. doi: 10.4319/lo.2001.46.5.1220
Luo, X., Yang, J., Sun, W., and He, B. (2021). Suitability of human settlements in mountainous areas from the perspective of ventilation: a case study of the main urban area of Chongqing. J. Clean. Prod. 310:127467. doi: 10.1016/j.jclepro.2021.127467
Luo, Y., Yang, K., Yu, Z., Chen, J., Xu, Y., Zhou, X., et al. (2017). Dynamic monitoring and prediction of Dianchi Lake cyanobacteria outbreaks in the context of rapid urbanization. Environ. Sci. Pollut. Res. Int. 24, 5335–5348. doi: 10.1007/s11356-016-8155-2
Luo, Y., Zhao, Y., Yang, K., Chen, K., Pan, M., and Zhou, X. (2018). Dianchi Lake watershed impervious surface area dynamics and their impact on lake water quality from 1988 to 2017. Environ. Sci. Pollut. Res. Int. 25, 29643–29653. doi: 10.1007/s11356-018-2967-1
Magee, M. R., and Wu, C. H. (2017). Response of water temperatures and stratification to changing climate in three lakes with different morphometry. Hydrol. Earth Syst. Sci. 21, 6253–6274. doi: 10.5194/hess-21-6253-2017
Miller, H. J. (2004). Tobler's first law and spatial analysis. Ann. Assoc. Am. Geogr. 94, 284–289. doi: 10.1111/j.1467-8306.2004.09402005.x
O'Reilly, C. M., Sharma, S., Gray, D. K., Hampton, S. E., Read, J. S., Rowley, R. J., et al. (2015). Rapid and highly variable warming of lake surface waters around the globe. Geophys. Res. Lett. 42, 10773–10781. doi: 10.1002/2015gl066235
Politi, E., Cutler, M. E. J., and Rowan, J. S. (2012). Using the NOAA advanced very high resolution radiometer to characterise temporal and spatial trends in water temperature of large European lakes. Remote Sens. Environ. 126, 1–11. doi: 10.1016/j.rse.2012.08.004
Ren, J., Yang, J., Zhang, Y., Xiao, X., Xia, J. C., and Li, X. (2022). et al., Exploring thermal comfort of urban buildings based on local climate zones. J. Clean. Prod. 340:130744. doi: 10.1016/j.jclepro.2022.130744
Schmid, M., Hunziker, S., and Wüest, A. (2014). Lake surface temperatures in a changing climate: a global sensitivity analysis. Clim. Chang. 124, 301–315. doi: 10.1007/s10584-014-1087-2
Schneider, P., and Hook, S. J. (2010). Space observations of inland water bodies show rapid surface warming since 1985. Geophys. Res. Lett. 37:L22405. doi: 10.1029/2010gl045059
Schneider, P., Hook, S. J., Radocinski, R. G., Corlett, G. K., Hulley, G. C., Schladow, S. G., et al. (2009). Satellite observations indicate rapid warming trend for lakes in California and Nevada. Geophys. Res. Lett. 36:L22402. doi: 10.1029/2009gl040846
Sharma, S., Blagrave, K., Magnuson, J. J., O’Reilly, C. M., Oliver, S., Batt, R. D., et al. (2019). Widespread loss of lake ice around the northern hemisphere in a warming world. Nat. Clim. Chang. 9, 227–231. doi: 10.1038/s41558-018-0393-5
Sharma, S., Gray, D. K., Read, J. S., O'Reilly, C. M., Schneider, P., Qudrat, A., et al. (2015). A global database of lake surface temperatures collected by in situ and satellite methods from 1985-2009. Sci. Data 2:150008. doi: 10.1038/sdata.2015.8
Somers, K. A., Bernhardt, E. S., Grace, J. B., Hassett, B. A., Sudduth, E. B., Wang, S., et al. (2013). Streams in the urban heat island: spatial and temporal variability in temperature. Freshw. Sci. 32, 309–326. doi: 10.1899/12-046.1
Tobler, W. J. (2004). On the first law of geography: a reply. Ann. Assoc. Am. Geogr. 94, 304–310. doi: 10.1111/j.1467-8306.2004.09402009.x
Wan, W., Li, H., Xie, H., Hong, Y., Long, D., Zhao, L., et al. (2017). A comprehensive data set of lake surface water temperature over the Tibetan plateau derived from MODIS LST products 2001-2015. Sci. Data 4:170095. doi: 10.1038/sdata.2017.95
Wan, W., Zhao, L., Xie, H., Liu, B., Li, H., Cui, Y., et al. (2018). Lake surface water temperature change over the Tibetan plateau from 2001 to 2015: a sensitive indicator of the warming climate. Geophys. Res. Lett. 45, 11177–11186. doi: 10.1029/2018gl078601
Wang, J., Huang, L., Ju, J., Daut, G., Wang, Y., Ma, Q., et al. (2019). Spatial and temporal variations in water temperature in a high-altitude deep dimictic mountain lake (Nam co), central Tibetan plateau. J. Great Lakes Res. 45, 212–223. doi: 10.1016/j.jglr.2018.12.005
Wang, S., Qian, X., Han, B. P., Luo, L. C., and Hamilton, D. P. (2012). Effects of local climate and hydrological conditions on the thermal regime of a reservoir at tropic of cancer, in southern China. Water Res. 46, 2591–2604. doi: 10.1016/j.watres.2012.02.014
Weber, T., Haensler, A., and Jacob, D. (2017). Sensitivity of the atmospheric water cycle to corrections of the sea surface temperature bias over southern Africa in a regional climate model. Clim. Dyn. 51, 2841–2855. doi: 10.1007/s00382-017-4052-8
Weng, Q., Lu, D., and Schubring, J. (2004). Estimation of land surface temperature–vegetation abundance relationship for urban heat island studies. Remote Sens. Environ. 89, 467–483. doi: 10.1016/j.rse.2003.11.005
Woolway, R. I., Jones, I. D., Maberly, S. C., French, J. R., Livingstone, D. M., Monteith, D. T., et al. (2016). Diel surface temperature range scales with Lake size. PLoS One 11:e0152466. doi: 10.1371/journal.pone.0152466
Woolway, R. I., and Merchant, C. J. (2017). Amplified surface temperature response of cold, deep lakes to inter-annual air temperature variability. Sci. Rep. 7:4130. doi: 10.1038/s41598-017-04058-0
Woolway, R. I., and Merchant, C. J. (2018). Intralake heterogeneity of thermal responses to climate change: a study of large northern Hemisphere Lakes. J. Geophys. Res. Atmos. 123, 3087–3098. doi: 10.1002/2017jd027661
Woolway, R. I., Weyhenmeyer, G. A., Schmid, M., Dokulil, M. T., de Eyto, E., Maberly, S. C., et al. (2019). Substantial increase in minimum lake surface temperatures under climate change. Clim. Chang. 155, 81–94. doi: 10.1007/s10584-019-02465-y
Xiao, Q., Yang, K., and Hong, L. (2018). Remote sensing monitoring and temporal-spatial analysis of surface water body area changes of lakes on the Yunnan-Guizhou plateau over the past 30 years. J. Lake Sci. 30, 1083–1096. doi: 10.18307/2018.0421
Xie, P., Yang, J., Sun, W., Xiao, X., and Cecilia Xia, J. (2022). Urban scale ventilation analysis based on neighborhood normalized current model. Sustain. Cities Soc. 80:103746. doi: 10.1016/j.scs.2022.103746
Xu, H., Lin, D., and Tang, F. (2013). The impact of impervious surface development on land surface temperature in a subtropical city: Xiamen, China. Int. J. Climatol. 33, 1873–1883. doi: 10.1002/joc.3554
Yang, J., Wang, Y., Xiao, X., Jin, C., Xia, J., and Li, X. (2019a). Spatial differentiation of urban wind and thermal environment in different grid sizes. Urban Clim. 28:100458. doi: 10.1016/j.uclim.2019.100458
Yang, J., Wang, Y., Xiu, C., Xiao, X., Xia, J., and Jin, C. (2020). Optimizing local climate zones to mitigate urban heat island effect in human settlements. J. Clean. Prod. 275:123767. doi: 10.1016/j.jclepro.2020.123767
Yang, J., Wang, Y., Xue, B., Li, Y., Xiao, X., Xia, J. C., et al. (2021a). Contribution of urban ventilation to the thermal environment and urban energy demand: different climate background perspectives. Sci. Total Environ. 795:148791. doi: 10.1016/j.scitotenv.2021.148791
Yang, J., Yang, R., Chen, M.-H., Su, C.-H., Zhi, Y., and Xi, J. (2021b). Effects of rural revitalization on rural tourism. J. Hosp. Tour. Manag. 47, 35–45. doi: 10.1016/j.jhtm.2021.02.008
Yang, J., Yang, Y., Sun, D., Jin, C., and Xiao, X. (2021c). Influence of urban morphological characteristics on thermal environment. Sustain. Cities Soc. 72:103045. doi: 10.1016/j.scs.2021.103045
Yang, K., Yu, Z., Luo, Y., Zhou, X., and Shang, C. (2019b). Spatial-temporal variation of Lake surface water temperature and its driving factors in Yunnan-Guizhou plateau. Water Resour. Res. 55, 4688–4703. doi: 10.1029/2019wr025316
Yang, K., Zhang, Y., Luo, Y., and Shang, C. (2021d). Precipitation events impact on urban lake surface water temperature under the perspective of macroscopic scale. Environ. Sci. Pollut. Res. Int. 28, 16767–16780. doi: 10.1007/s11356-020-12093-0
Yi, L., Qiulin, L., Kun, Y., Wenqing, X., Xiaolu, Z., Chunxue, S., et al. (2019). Thermodynamic analysis of air-ground and water-ground energy exchange process in urban space at micro scale. Sci. Total Environ. 694:133612. doi: 10.1016/j.scitotenv.2019.133612
You, H., Yang, J., Xue, B., Xiao, X., Xia, J., Jin, C., et al. (2021). Spatial evolution of population change in Northeast China during 1992–2018. Sci. Total Environ. 776:146023. doi: 10.1016/j.scitotenv.2021.146023
Yu, H., Yang, J., Li, T., Jin, Y., and Sun, D. (2022a). Morphological and functional polycentric structure assessment of megacity: an integrated approach with spatial distribution and interaction. Sustain. Cities Soc. 80:103800. doi: 10.1016/j.scs.2022.103800
Yu, H., Yang, J., Sun, D., Li, T., and Liu, Y. (2022b). Spatial responses of ecosystem service value during the development of Urban agglomerations. Land 11:165. doi: 10.3390/land11020165
Zhang, Y., Wu, Z., Liu, M., He, J., Shi, K., Zhou, Y., et al. (2015). Dissolved oxygen stratification and response to thermal structure and long-term climate change in a large and deep subtropical reservoir (Lake Qiandaohu, China). Water Res. 75, 249–258. doi: 10.1016/j.watres.2015.02.052
Zhang, G., Yao, T., Xie, H., Qin, J., Ye, Q., Dai, Y., et al. (2014). Estimating surface temperature changes of lakes in the Tibetan plateau using MODIS LST data. J. Geophys. Res. Atmos. 119, 8552–8567. doi: 10.1002/2014jd021615
Zhao, H., Duan, X., Stewart, B., You, B., and Jiang, X. (2013). Spatial correlations between urbanization and river water pollution in the heavily polluted area of Taihu Lake Basin, China. J. Geogr. Sci. 23, 735–752. doi: 10.1007/s11442-013-1041-7
Keywords: surface thermal environment, lake surface water temperature, spatial influence, land surface temperature, remote sensing
Citation: Zhao Y, Yang K, Luo Y and Yu Z (2022) Spatial–temporal characteristics of surface thermal environment and its effect on Lake surface water temperature in Dianchi Lake basin. Front. Ecol. Evol. 10:984692. doi: 10.3389/fevo.2022.984692
Edited by:
Changchun Huang, Nanjing Normal University, ChinaReviewed by:
Yulong Guo, Henan Agricultural University, ChinaZhigang Cao, Nanjing Institute of Geography and Limnology (CAS), China
Copyright © 2022 Zhao, Yang, Luo and Yu. This is an open-access article distributed under the terms of the Creative Commons Attribution License (CC BY). The use, distribution or reproduction in other forums is permitted, provided the original author(s) and the copyright owner(s) are credited and that the original publication in this journal is cited, in accordance with accepted academic practice. No use, distribution or reproduction is permitted which does not comply with these terms.
*Correspondence: Yi Luo, bHlzaXN0QHlubnUuZWR1LmNu
†These authors have contributed equally to this work and share first authorship