 Lauren Seex
 Tommaso Saccà
 Charlotte K. Hemelrijk
95% of researchers rate our articles as excellent or good
Learn more about the work of our research integrity team to safeguard the quality of each article we publish.
Find out more
ORIGINAL RESEARCH article
Front. Ecol. Evol. , 28 November 2022
Sec. Behavioral and Evolutionary Ecology
Volume 10 - 2022 | https://doi.org/10.3389/fevo.2022.982507
This article is part of the Research Topic Sex and Gender Effects on Power, Status, Dominance, and Leadership – An Interdisciplinary Look at Human and Other Mammalian Societies View all 22 articles
Intersexual dominance (dominance between the sexes) is often assumed to be binary with species categorized as either male- or female-dominant. Yet in many species, the degree of intersexual dominance falls somewhere in the middle of these two extremes. There are several measures of intersexual dominance, but in empirical studies, it is not possible to evaluate which is best because the real degree of intersexual dominance is unknown. This evaluation is possible, however, in the agent-based model, DomWorld, because individuals have internal dominance values that drive their agonistic behavior. In the present study, we defined the accuracy of measures of intersexual dominance in DomWorld by the strength of the correlation between the degree of intersexual dominance based on A) their internal dominance values and B) observations of their competitive interactions (similar to observations in empirical studies). We examined the four measures that have been most commonly used in the literature: the proportion of intersexual conflicts won and initiated, the Female Dominance Index, and the proportion of female-dominant dyads. The Female Dominance Index was highly accurate, possibly because it was based on the outcomes of intra- and intersexual conflicts, both of which influence an individual's dominance. The proportion of intersexual conflicts initiated was similar in its accuracy to the Female Dominance Index and it was the only measure to be unaffected by missing data. Measures were more accurate when groups were smaller, or the intensity of aggression was higher, but their accuracy did not depend on the degree of sexual dimorphism. To best represent dominance relations between the sexes, we recommend reporting both the Female Dominance Index and the proportion of intersexual conflicts initiated.
Dominance relations among individuals result from repeated agonistic interactions (Drews, 1993). An individual that consistently defeats an opponent (evokes submission) is dominant, while the victim is subordinate (Drews, 1993). Dominance hierarchies function to reduce the frequency of conflicts because individuals are unlikely to attack if they think they will be defeated (Jackson, 1991). The dominance style of a group ranges on a continuum from despotic to egalitarian (Vehrencamp, 1983). In groups where the difference in winning ability among individuals is high, the dominance style is more despotic, and more dominant individuals gain greater access to monopolisable resources such as food, space, or mates by outcompeting less dominant individuals (Vehrencamp, 1983). When the winning ability among individuals in a group is similar, the dominance style of the group is more egalitarian and all individuals have similar access to resources (Vehrencamp, 1983). Thus, the dominance style of a group as well as the dominance rank of an individual are important to its fitness and survival.
Prior attributes such as body size are often reported to underlie the ability of one individual to defeat another (Chase and Seitz, 2011). Thus, in species where males are larger than females, males are often assumed to be dominant over all females. Yet, in some species with male-biased sexual dimorphism, females dominate some males despite their smaller body size [e.g., bonobos (Surbeck and Hohmann, 2013), vervets (Hemelrijk et al., 2020), capuchins (Izar et al., 2021), macaques (Hemelrijk et al., 2008), rock hyraxes (Koren et al., 2006), wolves (Cafazzo et al., 2016), and giraffes (Horová et al., 2015)]. Therefore, prior attributes are not the only aspect that influences dominance. Other factors also influence an individual's ability to win a fight, such as support from others in conflicts (White and Wood, 2007), leverage (Lewis, 2002), and prior experience (Hsu et al., 2006).
The winner–loser effect implies that in their subsequent dominance interaction, winners are more likely to win again, and losers are more likely to lose again. The winner–loser effect has been found in many taxa ranging from crustacea, amphibia, and insects to mammals including humans (Hsu et al., 2006). In empirical studies, it has been shown to (partially) underlie the formation of dominance hierarchies (Franz et al., 2015) and in theoretical studies, dominance hierarchies similar to those of real animals emerge based on winner–loser effects (Chase, 1974; Beacham, 1988; Hemelrijk et al., 2017). The effect has been demonstrated in same-sex dyads, hermaphroditic dyads, and when the sex is unknown (Hsu et al., 2006; Mesterton-Gibbons et al., 2016) but has been studied seldom between the sexes because studies of intersexual dominance are lacking in comparison to studies on intrasexual dominance. Generally, dominance relations are studied separately for each sex because males and females are supposed to have different drivers underlying competition; males compete for access to females and females compete for access to food (Trivers, 1972). Yet, clearly, males can act as a direct competitor for food and space with females (Li and Kokko, 2019).
Whether individuals that engage in intersexual conflicts experience the winner–loser effect has seldom been studied, although there is indirect evidence suggesting that they do. The winner–loser effect was demonstrated in dominance interactions between pigs where half of the dyads were mixed sex (Oldham et al., 2020). Also, in crickets, males that previously won a conflict were more likely to attack a female than males that had not fought (Adamo and Hoy, 1995), suggesting the winner–loser effect can be carried over from intrasexual to intersexual conflicts. Besides, in some agent-based models, where the winner–loser effect is made to operate both within and between the sexes, patterns emerge that resemble empirical patterns (Hemelrijk et al., 2017; Hofstede et al., 2018). Therefore, the winner–loser effect may be functioning in interactions between the sexes as well as within a sex. Winning a conflict against a member of the same sex may influence an individual's ability to win a conflict against a member of the opposite sex and vice versa. Regarding intrasexual dominance hierarchies, while they are normally calculated using only intrasexual conflicts, they may be more accurate if they also included intersexual conflicts because these provide more information about an individual's prior experience.
Species have often been grouped arbitrarily in categories of either “male-dominant” or “female-dominant.” Yet, intersexual dominance in a group is seldom binary. Rather, groups may range from strongly male-dominant to strongly female-dominant (Davidian et al., 2022; Kappeler et al., 2022b). For instance, strict female dominance over males was supposed to be widespread in lemurs, but intersexual dominance relations have been shown to vary across groups and species, when they were measured as the proportion of intersexual conflicts won and the proportion of subordinate males (Kappeler et al., 2022a). What remains unclear is which measure of intersexual dominance best represents dominance relations between the sexes in groups of animals. A study by Kappeler et al. (2022b) demonstrated that the degree of intersexual dominance strongly correlated among several measures of it, suggesting that all measures were equally suitable. However, in empirical studies, the accuracy of measures cannot be determined because there is no “true” value of intersexual dominance with which the degree of intersexual dominance based on observed conflicts can be compared. Indeed, several traits such as group size, dominance style, or a higher proportion of unknown relations have been shown to bias the results of measures of dominance (Hemelrijk et al., 2005; Klass and Cords, 2011; Douglas et al., 2017; Sánchez-Tójar et al., 2018), although it is unclear how they influence measures of intersexual dominance. While the accuracy of measures of intersexual dominance cannot be estimated in empirical data, it can be studied in a computational model, DomWorld, because here both are known: the internal dominance of individuals that influences their behavior as well as their observed competitive interactions (Hemelrijk, 1999).
In the agent-based model, DomWorld, patterns of behavior resemble those observed in real animals (Hemelrijk et al., 2017). In it, individuals are guided by simple rules to group and compete. The outcomes of their competitive interactions are self-reinforcing. Individuals have internal dominance values that determine their likelihood to attack and win conflicts and, thus, reflect their real dominance. After a conflict, the dominance value of the winner is increased (making it more likely to win again) and that of the loser is decreased (making it more likely to lose again), representing the winner–loser effect (Hsu et al., 2006, 2009). In the model, the internal dominance value of an individual steers its behavior and is thus considered the “real” dominance that cannot be known in empirical studies. Data are collected in a similar way on the competitive interactions in the model as in real animals. Thus, in the model, the accuracy of different measures of intersexual dominance can be determined by comparing the intersexual dominance values based on the “real” internal values with those based on observed conflicts.
DomWorld is suitable for this type of analysis for several reasons. First, patterns of social behavior emerge in the model that resemble those of real animals, including patterns of intersexual dominance which have been confirmed in empirical studies (Hemelrijk et al., 2008, 2020; Izar et al., 2021). Namely, it has been shown that females are dominant over more males if there is a higher proportion of males in the group because frequent male–male aggression causes some males to become victimized and over these males, females are dominant. Second, DomWorld has previously been used to determine the accuracy of different methods of deriving a dominance hierarchy by comparing a hierarchy based on observed outcomes of conflicts to the hierarchy based on internal dominance values (Hemelrijk et al., 2005). Third, in the model, different group sizes, sex ratios, dominance styles, and degrees of sexual dimorphism can be simulated and the effects of each of these traits can be studied in relation to the accuracy of measures of intersexual dominance.
In the present paper, we study the accuracy and robustness of measures of intersexual dominance using the agent-based model, DomWorld. We first conduct a literature review to find which measures of intersexual dominance are used most often. Subsequently, we investigate in the model the accuracy of four of these measures. We study how their accuracy is affected by traits such as dominance style, group size, and sex ratio. We examine the robustness of measures by investigating whether the measures are unaffected by reducing the dataset, thus by introducing a higher proportion of unknown relationships (where two individuals do not interact). We examine also whether intrasexual dominance hierarchies based on observed interactions resemble the real dominance relations within a sex (based on internal values) more strongly if the hierarchy is calculated using either only intrasexual conflicts or both intrasexual and intersexual conflicts.
For clarity and conciseness from hereon, we consider measures of intersexual dominance from a female perspective, but the male perspective can be calculated as the inverse, e.g., if the proportion of intersexual conflicts won by females is 20%, this means it is 80% for males.
In August 2021, LS searched the Web of Science for measures of intersexual dominance, under the keywords “female dominance” (419 results) and “inter-sexual OR intersexual dominance” (16 results). Seventy-five papers were found that used a quantitative measure of intersexual dominance 141 times. Disregarding whether measures were used repeatedly by the same authors or research group, we considered only measures that quantified patterns of dyadic agonistic interactions between males and females, and excluded measures concerning coalitions, affiliation, leadership, and feeding priority. We preserved the definitions used in the papers and focused on the measure of intersexual dominance. Thus, if two papers use the measure “the proportion of intersexual conflicts won” but defined winning differently, we counted them as the same. We included studies both in the wild and in captivity. We considered studies of animals in natural settings (groups in captivity or the wild) as well as in artificial settings (e.g., test arenas). We sorted the 141 measures into 22 distinct categories, combining similar measures (Table 1). Eight measures that were only used once are not shown. Refer to the Supplementary material for an exhaustive list.
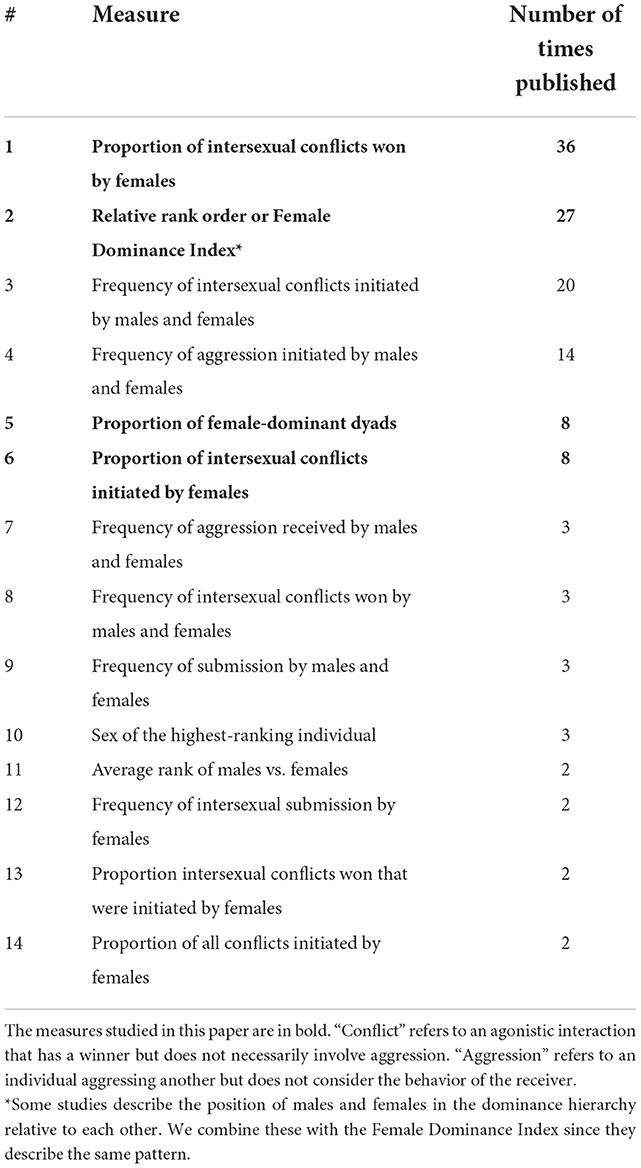
Table 1. Distinct categories of quantitative measures of intersexual dominance.
We selected the most common measures, including only those used more than five times since these made up 80% of the times that measures of intersexual dominance were used. We did not use measures that compared frequencies of aggression or submission between males and females because (1) they treat intersexual dominance as a dichotomy and (2) a higher frequency of aggression is not necessarily indicative of dominance. The final measures of intersexual dominance chosen were the proportion of intersexual conflicts won, the Female Dominance Index, the proportion of female-dominant dyads, and the proportion of intersexual conflicts initiated.
The proportion of conflicts won or initiated was calculated per female for all their conflicts against males and then averaged over all females. The proportion of female-dominant dyads was calculated as the proportion of intersexual dyads where females dominated males (won more than 50% of conflicts) divided by the total number of intersexual dyads where a male and female had at least one interaction. Here, we defined a female-dominant dyad as females winning more than 50% of conflicts against a male, but in the literature, there were different definitions of a “female-dominant dyad” such as if females won more than 50% of conflicts (e.g., Hohenbrink et al., 2016), more than 75% conflicts (e.g., Knowles et al., 2004), or significantly more conflicts than 50% (binomial test) (e.g., Hasiniaina et al., 2018). We chose the threshold of more than 50% to make the measure more comparable to our other measures of intersexual dominance that do not allow for frequent “neutral” dyads i.e., those that are neither male- nor female-dominant.
The Female Dominance Index (Hemelrijk et al., 2008) is the average proportion of males that females are dominant over in a group, based on a hierarchy of all adults (constructed from wins and losses). Based on this hierarchy, the Female Dominance Index is the total number of males that each female outranks, divided by the maximum number of males females could dominate (number of females in a group multiplied by the number of males in a group). If a female ties with a male in her dominance rank, this is counted as 0.5 dominance of the female over the male. This results in a Female Dominance Index value that is the average proportion of males that females dominate. Because the Female Dominance Index is affected by how the dominance hierarchy is calculated, we studied four popular methods of deriving a hierarchy and calculated Female Dominance Index based on each: David's score Dij method (DS) (Gammell et al., 2003; de Vries et al., 2006), Average Dominance Index (ADI) (Hemelrijk et al., 2005), I&SI (de Vries, 1998), and randomized Elo-rating (Sánchez-Tójar et al., 2018). For randomized Elo-rating, we kept the parameters used in Sánchez-Tójar et al. (2018) meaning the sigmoid parameter was set as 0.01 and k was set as 200, and we randomized the order of interactions 1,000 times. For further details on how these dominance hierarchies are calculated, refer to Supplementary material.
Here, we summarize the main aspects of the agent-based model, DomWorld. For a full description of the model, see Hemelrijk (1999). In DomWorld, agents are guided by cognitively simple rules to move, group, and compete. All agents begin the simulation with an initial DOM value (Table 2) that influences their likelihood to engage in and win conflicts and is updated following conflicts. Individuals compete over non-specified resources and have a risk-sensitive attack strategy (Jackson, 1991; Hemelrijk, 2000). This strategy means that an individual will only attack if it thinks it will win a conflict (so-called “mental battle”). An individual is more likely to start a conflict if it is more dominant than its partner i.e., has a higher DOM value. The probability to win by agent i is calculated as its DOM value divided by the sum of the DOM values of both partners (DomRatio, Equation 1). If it thinks it will win, thus, if this ratio is higher than a random number between 0 and 1, it will initiate a “real” fight. Whether an individual wins (wi = 1) or else loses (wi = 0) a real fight is calculated in the same way.
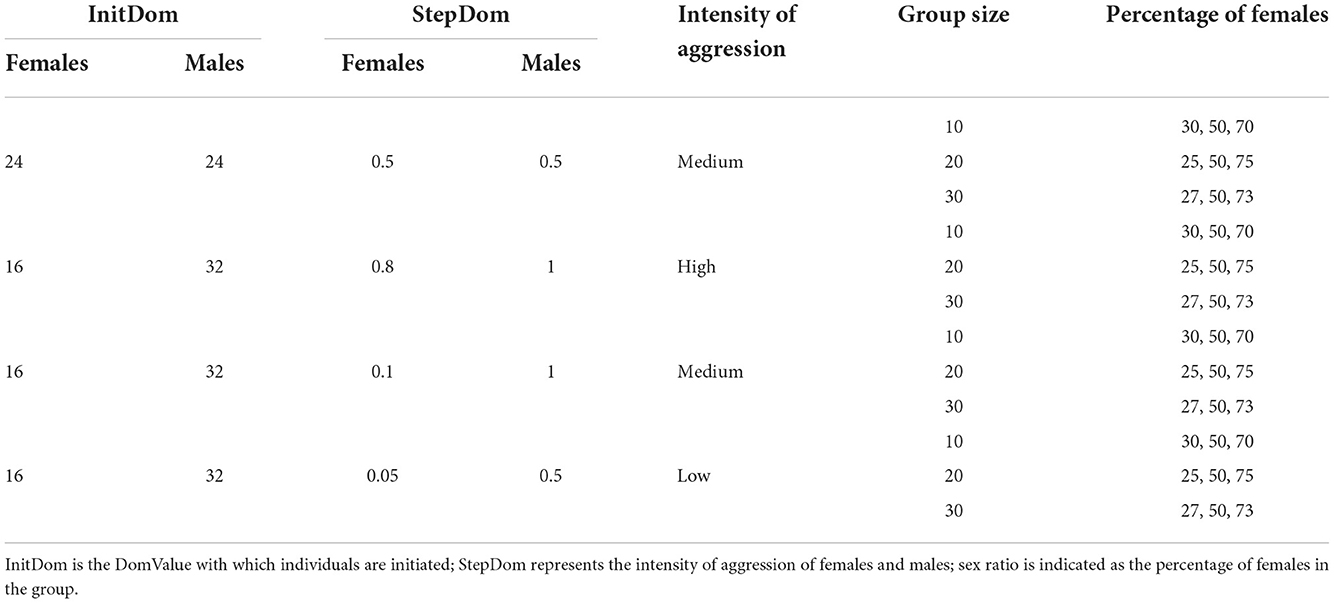
Table 2. Parameters in experiments in DomWorld.
Following a conflict, the winner turns toward the loser, chases it a ChaseDist, and the loser turns 180° and flees a FleeDist. The DOM value of the winner increases and the loser decreases by the same amount (Equation 2). The amount with which the DOM value of both partners is updated following a conflict depends on the rank distance between them and the intensity of aggression (StepDom) of the initiator; a more unexpected result or higher value of StepDom causes a larger update to dominance values than an expected result or a lower value of StepDom.
Time in the model is based on activations, with 20 activations of all individuals equating to one period. We use data in the model after a stable dominance hierarchy has developed, namely from periods 230 to 260. The degree of intersexual dominance based on internal dominance values was calculated per individual as its average DOM value over this time period. A dominance hierarchy was created based on these values by ordering them from largest (most dominant) to smallest (least dominant). Based on this internal hierarchy, we calculated the average proportion of males that females dominant (Female Dominance Index, Hemelrijk et al., 2008). We measured the observed degree of intersexual dominance by observing the competitive behavior of individuals and calculated the different measures as described above.
We ran simulations with different parameters for the initial dominance (InitDom) and intensity of aggression (StepDom) of the sexes, resembling either sexually dimorphic or monomorphic species (Table 2). Although we label individuals “Male” and “Female,” the only difference between them is their InitDom and StepDom and thus a simulation with male-biased sexual dimorphism is equivalent to one with female-biased sexual dimorphism. For a full list of parameters, refer to Supplementary Table S1.
We simulate four different types of societies based on the intensity of aggression of males and females (StepDom) (Table 2). We do not use very low values for StepDom (e.g., Female StepDom = 0.01, Male StepDom = 0.1), because this results in a group where all males always dominate females (Hemelrijk et al., 2008). We also investigate how group size and sex ratio (Table 2) influence the accuracy of measures.
For each of the 36 parameter settings, we ran the model 40 times. Per run, we estimated the accuracy of measures of intersexual dominance by correlating each of the different measures based on observed behavior with the internal degree of intersexual dominance using a Spearman correlation. Regarding the Female Dominance Index, we examined which of the four ways chosen for deriving a hierarchy (DS, ADI, I&SI, and randomized Elo-rating) resulted in the strongest correlation with internal values.
We studied whether we derived intrasexual hierarchies (hierarchies of a single sex) more accurately when using only intrasexual conflicts or both intra- and intersexual conflicts. We calculated intrasexual dominance hierarchies of males and females separately based on how often individuals won from members of the same-sex (intrasexual conflicts) or members of both sexes (both intra- and intersexual conflicts). We correlated the ordinal rank position of individuals in the hierarchy relative to members of their own sex with their position in the hierarchy based on internal DOM values using a Spearman correlation.
We determined the robustness of measures of intersexual dominance in terms of their insensitivity to data reduction. Omitting dominance interactions causes a higher proportion of unknown relationships, which is known to affect other measures of dominance (Klass and Cords, 2011). Here, for each parameter setting, we omitted 0, 5, 10, 15, 20, and 25 periods uniformly chosen between periods 230 and 260 for each of the 40 runs. For each number of omitted periods, we calculated the four measures of intersexual dominance based on observed behavior per run and correlated these values of intersexual dominance with the proportion of missing data using a Spearman correlation. When values of intersexual dominance were less affected by missing data, they were considered more robust.
Data manipulation and statistical tests were conducted in R (version 4.1.2) (R Core Team, 2021) and RStudio (RStudio Team, 2020). Graphs were created in Rstudio with ggplot2 (v3.3.6; Wickham, 2016) and ggpubr (v0.4.0; Kassambara, 2020). Hierarchies created using DS and I&SI were done so using the EloRating package for R (v0.46.11; Neumann and Kulik, 2020). Hierarchies based on randomized Elo-rating were calculated with the aniDom package in R (v0.1.5; Farine and Sánchez-Tójar, 2021). We assessed the normality of data using Shapiro-Wilk tests and based on the inspection of qq plots. Data were non-normal, and thus, we used non-parametric tests (Friedman test and Wilcoxon signed-rank test with Holm adjusted p-values).
We studied which factors influenced the accuracy of measures by fitting a general linear model using the glmmTMB package (v1.1.3; Brooks et al., 2017). Since the response variable was the correlation coefficient (non-integer) and our data was bounded between 0 and 1, we use a beta family. The goodness of fit was measured through statistics based on simulated residuals from the package DHARMa (v0.4.5; Hartig, 2022). We checked for co-linearity in multi-variate models using the variance inflation factor (VIF). For the significance of factor variables, we report the likelihood ratio test between the full model and the model without the factor of interest and provide full summary tables in the Supplementary material. We performed post-hoc pairwise comparisons using the emmeans package (v1.7.4.1; Lenth, 2021) to compare the estimated marginal means among factors (p-values here were corrected for multiple comparisons using the Tukey method).
The Female Dominance Index is the average proportion of males that females dominate in a dominance hierarchy. When the dominance hierarchy based on observed wins and losses was calculated using DS, the Female Dominance Index was more strongly correlated with the degree of intersexual dominance based on internal dominance values than when the hierarchy was calculated using ADI, I&SI, and randomized Elo-rating [ = 93.33, p < 0.001; DS vs. ADI p < 0.001; DS vs. ISI p < 0.0001; DS vs. Elo-rating p < 0.0001; ADI vs. ISI p < 0.0001; ADI vs. Elo-rating p < 0.0001; ISI vs. Elo-rating p < 0.0001, Figure 1A]. Thus, from hereon, we use DS to calculate dominance hierarchies.
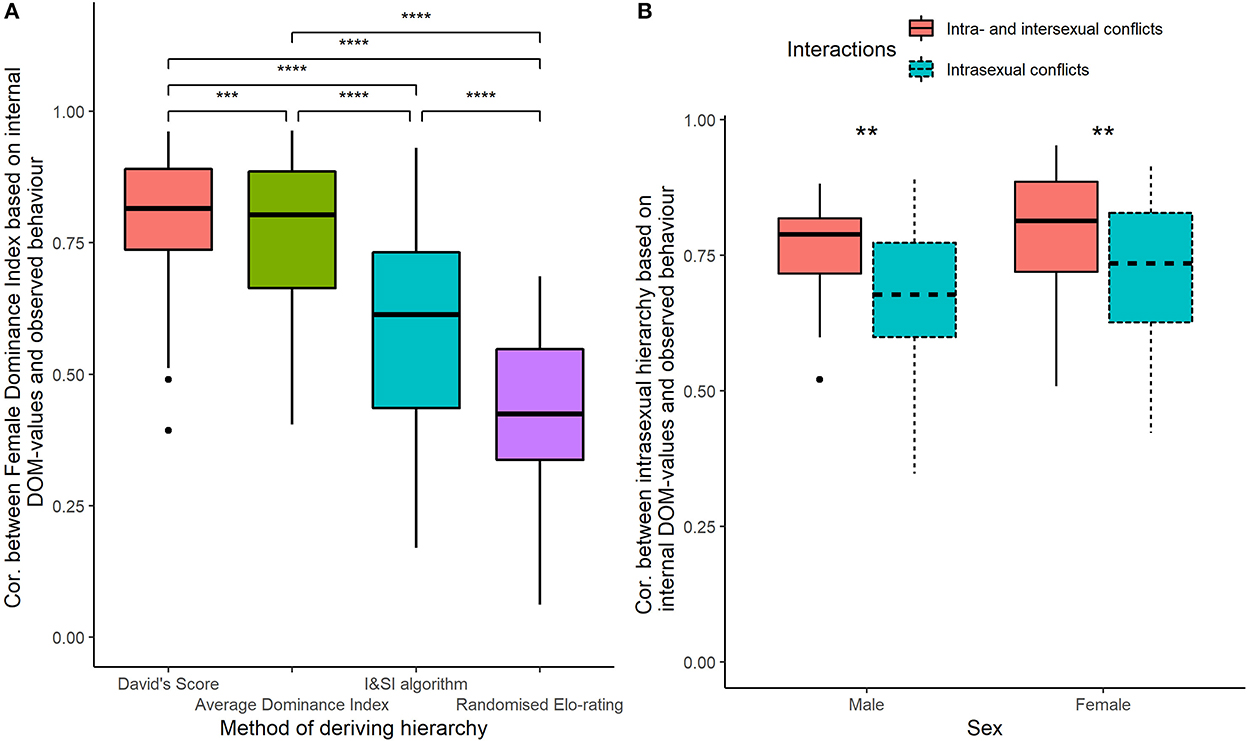
Figure 1. (A) Spearman correlation coefficient between the degree of intersexual dominance calculated using Female Dominance Index based on internal values and Female Dominance Index based on observed outcomes of dominance interactions for different methods of deriving a dominance hierarchy for 36 different parameter settings (40 runs per setting). (B) Spearman correlation coefficient between the intrasexual hierarchy based on internal DOM-values and the intrasexual hierarchy for each sex calculated from all conflicts of both sexes (intra- and intersexual conflicts) or intrasexual conflicts only. **p < 0.01, ***p < 0.001, ****p < 0.0001.
When studying dominance among same-sex individuals, the position of individuals in a hierarchy relative to members of their own sex (intrasexual hierarchy) was more strongly correlated with the internal dominance hierarchy when both intra- and intersexual conflicts were included in the calculation, rather than just intrasexual conflicts (Males, Mann-Whitney-Wilcoxon Test U = 916.5, n = 36, p = 0.003; Females, U = 879, n = 36, p = 0.009, Figure 1B).
The four measures of intersexual dominance differed in their accuracy [Likelihood ratio test: = 58.78, p < 0.0001]. The Female Dominance Index and proportion of intersexual conflicts initiated correlated most strongly with internal values and correlated significantly more strongly than other measures (Figure 2A, Table 3). Nevertheless, values of all measures of intersexual dominance based on observed behavior significantly correlated with each other (p < 0.0001), and their correlation coefficients ranged from 0.74 to 0.91 (Figure 2B).
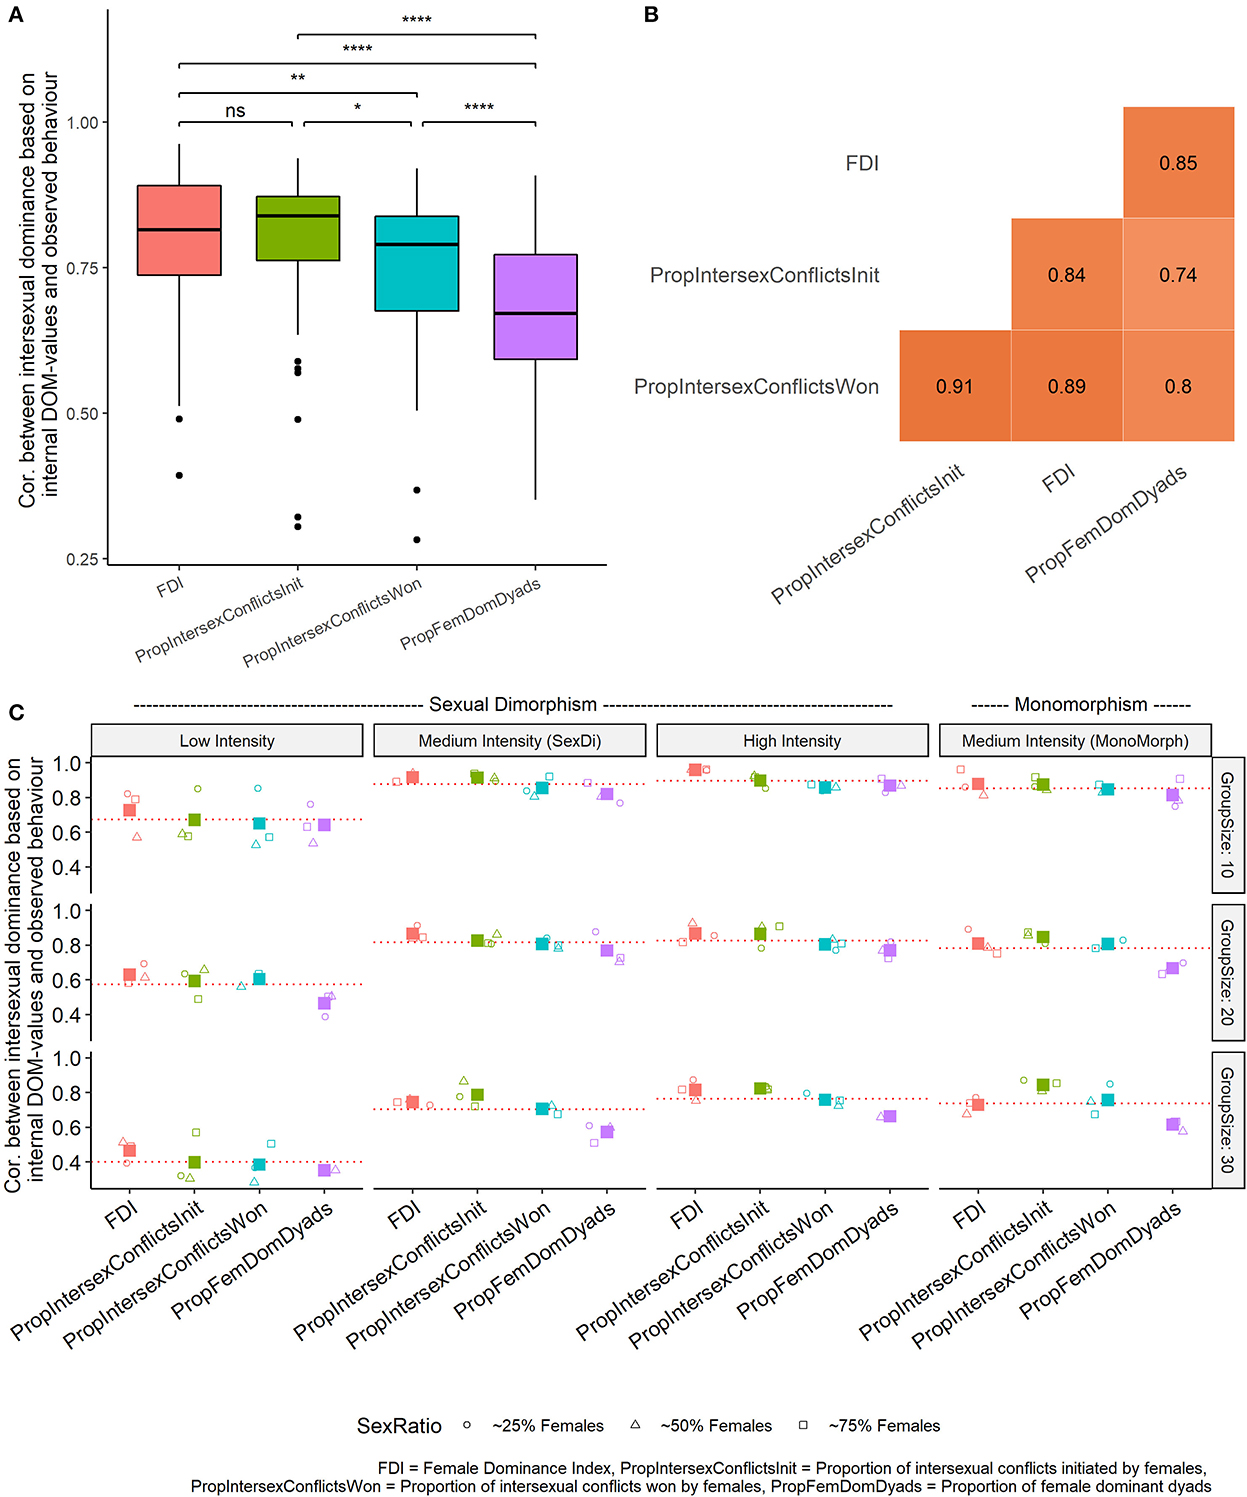
Figure 2. (A) Median and inter-quartile ranges of Spearman correlation coefficients of measures of intersexual dominance based on observed wins and losses and based on internal DOM-values (36 parameter settings, 40 runs per setting) for four ways of measuring intersexual dominance. *p < 0.05, **p < 0.01, ****p < 0.0001. (B) Spearman correlation matrix among values from measures of intersexual dominance, based on all runs from all parameter settings combined (n = 1,440). (C) Spearman correlation coefficient between intersexual dominance based on measures using observed behavior and based on internal DOM-values in relation to the intensity of aggression and group size. Red dotted lines indicated the mean correlation coefficient for that parameter setting (based on all measures). Large solid squares indicate averages for all sex ratios for each measure of each combination of group size and intensity of aggression.
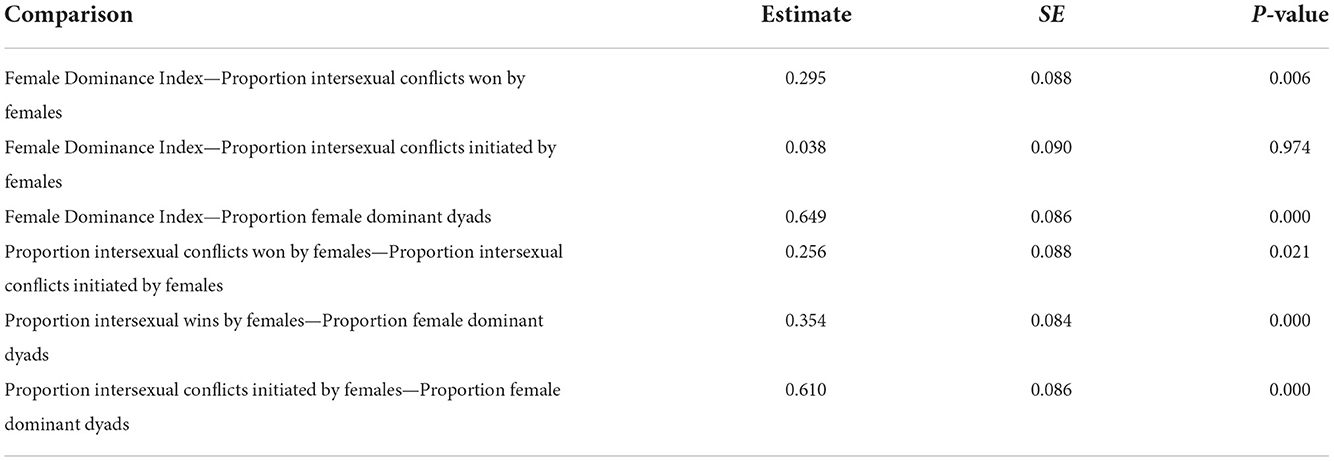
Table 3. Emmeans post-hoc comparisons of the accuracy of different measures of intersexual dominance.
Measures of intersexual dominance were significantly less accurate when the intensity of aggression was low than medium or high and the degree of sexual dimorphism did not influence the accuracy of measures [Intensity of aggression: = 178.14, p < 0.0001, emmeans post-hoc, High, Medium (sexual dimorphism), and Medium (monomorphism) intensity vs. Low intensity p < 0.0001, Supplementary Table S9]. Larger group sizes resulted in weaker accuracy in all four measures of intersexual dominance (Group Size: estimate = −0.051, SE = 0.0038, p < 0.001), while sex ratio did not have a significant effect (estimate = −0.18, SE = 0.16, p = 0.28) (Figure 2C).
We studied the influence of a higher proportion of missing data (and therefore a higher proportion of unknown relations, Supplementary Figure S4) on measures of intersexual dominance. Most measures indicated stronger dominance of females over males when more data were missing. In the case of the proportion of female-dominant dyads, missing data significantly increased female dominance in 94% of the parameter settings. This increase was true for 47% of the parameter settings of the Female Dominance Index, 53% of parameter settings for the proportion of intersexual conflicts won, and none of the parameter settings for the proportion of intersexual conflicts initiated (Figure 3, Supplementary Table S11).
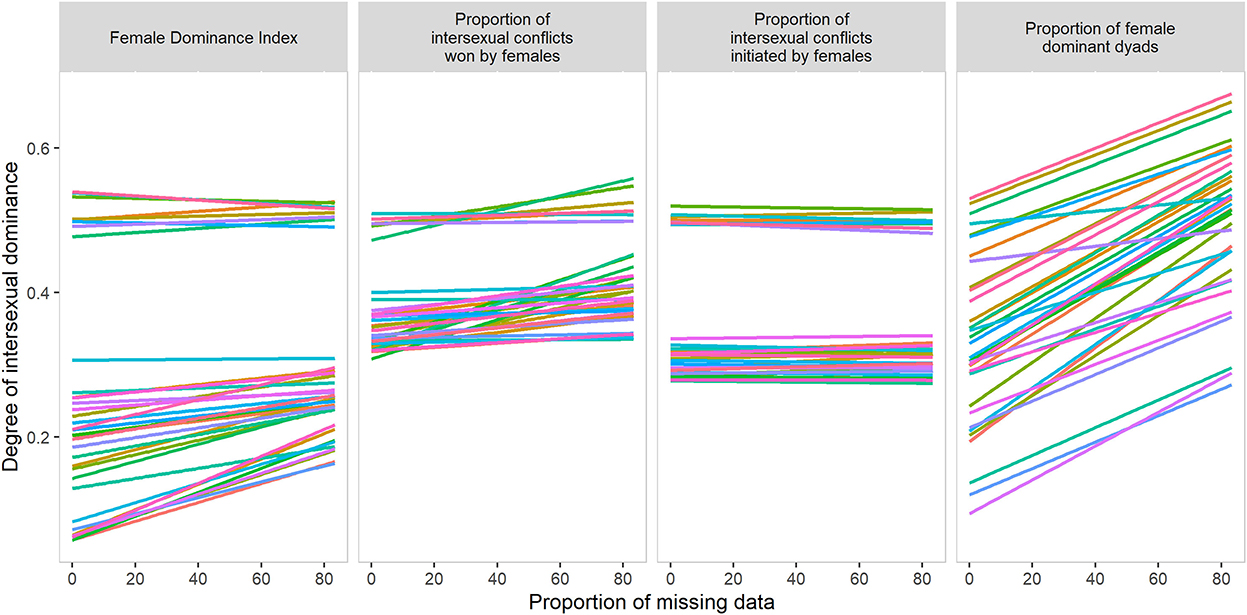
Figure 3. The relationship between measures of intersexual dominance and proportion of missing data for 36 parameter settings in DomWorld.
We studied in the model DomWorld (Hemelrijk, 1999) the accuracy (correlation with internal values) and robustness (influence of a reduced dataset) of four measures of intersexual dominance commonly used in the literature: the Female Dominance Index, the proportion of intersexual conflicts won, the proportion of intersexual conflicts initiated and the proportion of female dominant dyads. The Female Dominance Index and the proportion of intersexual conflicts initiated were more accurate than the other measures across a range of group sizes, intensities of aggression, and sex ratios. Regarding robustness, the proportion of intersexual conflicts initiated was the only measure that was robust to missing data. Nevertheless, all four measures performed well, and the degree of intersexual dominance was significantly correlated among them.
The Female Dominance Index is the average proportion of males that rank below females in a dominance hierarchy of both sexes (Hemelrijk et al., 2008). Values of intersexual dominance based on Female Dominance Index were most accurate when using DS to calculate the dominance hierarchy, followed closely by the ADI while I&SI and randomized Elo-rating were the least accurate. These results support the conclusions from a former study that assessed the accuracy of dominance hierarchies in DomWorld and also showed that DS was slightly better than ADI and that I&SI performed worst (Hemelrijk et al., 2005). It should be noted that the aim of I&SI is to produce a maximally linear dominance hierarchy which is neither always the case in hierarchies produced in DomWorld (de Vries, 2009), nor in real animals (Douglas et al., 2017). Thus, I&SI should only be used when a hierarchy can be assumed to be linear (de Vries, 1998).
In DomWorld, randomized Elo-rating did not produce a dominance hierarchy similar to that based on the internal dominance values and thus performed poorly compared to other measures. This result contradicts a study that demonstrated randomized Elo-rating is preferable to other methods for more egalitarian groups (Sánchez-Tójar et al., 2018). We attribute this disagreement to the different methods used. In the study of Sánchez-Tójar et al. (2018), interactions were simulated according to pre-assigned and static dominance ranks of individuals where the difference in winning probability between two adjacently ranked individuals was constant. Thus, patterns of interactions may have been less realistic than those in DomWorld where dominance is dynamic and reflects experience with victory and defeat with other group members and patterns of behavior have been shown to resemble those of real animals (Hemelrijk et al., 2017).
The Female Dominance Index and the proportion of intersexual conflicts initiated were the most accurate measures from those studied here (although the Female Dominance Index had a higher minimum, maximum and mean values than the proportion of intersexual conflicts initiated, Supplementary Table S6). We consider Female Dominance Index to be theoretically superior to other methods since it incorporates both intrasexual (same-sex) and intersexual (between-sex) conflicts, both of which may influence an individual's propensity to win in its subsequent fight through the winner–loser effect. In DomWorld, intrasexual dominance hierarchies were more accurate when hierarchies were built using outcomes from conflicts among all adults as opposed to just intrasexual conflicts. In line with this, an empirical study has shown that the location of individuals in a hierarchy based on same-sex conflicts correlated strongly with their location in the hierarchy based on conflicts among all adults, suggesting the two hierarchies are highly related (Kappeler et al., 2022b). Thus, we propose that when studying intrasexual dominance, intersexual conflicts should also be considered because they may induce winner–loser effects which influence an individual's ability to win intrasexual conflicts, and their inclusion may make intrasexual hierarchies more accurate. Future studies should investigate how similar or different hierarchies built from same-sex conflicts are to those built from all conflicts among adults. Moreover, evidence that the winner–loser effect occurs in conflicts between the sexes is unclear and, thus, needs to be studied in the future.
Measures of intersexual dominance were more accurate when the group size was smaller and when the intensity of aggression was higher. In smaller groups in DomWorld, most individuals interact with each other (no unknown relationships) and when the intensity of aggression is higher the hierarchy is more differentiated and resembles a more despotic species (Hemelrijk, 1999). Thus, in real animals, measures of intersexual dominance may be more accurate when groups are smaller and when groups are more despotic because in both cases dominance relations are easier to infer. Interestingly, sexual dimorphism had no influence on the accuracy of measures of intersexual dominance. Therefore, the same measures of intersexual dominance are useful for different species, even if the sexes differ in their body size or intensity of aggression.
The Female Dominance Index and the proportion of intersexual conflicts initiated were significantly more accurate measures of intersexual dominance than the other two measures. Yet, the proportion of intersexual conflicts initiated was the only measure that was not influenced by missing data. A high proportion of unknown relationships has been shown to influence measures of intersexual dominance (Kappeler et al., 2022b). Here, we demonstrate that more unknown relations caused three of our four measures to overestimate the degree of female dominance over males. Thus, in the case of animals that do not interact frequently, the proportion of intersexual conflicts initiated might be more appropriate than Female Dominance Index to measure the degree of intersexual dominance.
When possible, we recommend reporting both the Female Dominance Index and the proportion of intersexual conflicts initiated in studies of intersexual dominance. These measures reflect different aspects of dominance between the sexes and reporting them together helps to distinguish between these aspects. The Female Dominance Index indicates where on average females are positioned in the hierarchy relative to males, while the proportion of conflicts initiated by females indicates how uni-directional the agonistic relationship between the sexes is. For example, in a group, some females may dominate some males according to the Female Dominance Index without females ever initiating conflicts against males (thus, the proportion of intersexual conflicts initiated equals zero). This is the case in some species of primate where females are dominant over some males because these males are attacked frequently by other males and fall in rank below some females (e.g., Hemelrijk et al., 2008). Moreover, sometimes females attack some males despite being lower in rank than these males (here, the Female Dominance Index may be zero, while the proportion of intersexual conflicts initiated is greater than zero).
In this study, we ignore the reasons why individuals engage in conflicts. We assume that this approach makes our results of general relevance. Moreover, although this study was not based on real animals, we replicated some results from an empirical study that compared measures of intersexual dominance (Kappeler et al., 2022b). Namely, values of intersexual dominance from the different measures were highly correlated with each other, indicating that all measures of intersexual dominance are equally useful. However, using DomWorld, we have shown more subtle differences among the measures because of our access to “real” internal dominance values and the large amount of data we can simulate. Nevertheless, our study has some limitations that may affect the generalizability of our conclusions to real animals. First, the internal degree of intersexual dominance was calculated using the Female Dominance Index based on internal DOM values which may have biased the internal values to correlate stronger with the Female Dominance Index (calculated with DS) more than the other measures. However, since all our measures were significantly correlated with each other as well as having similar levels of accuracy with internal values, we do not think there is a strong bias.
Second, in DomWorld an individual will initiate a fight if it thinks it will win, based on a ratio of its own and its partners' dominance values compared to a random number. This rule may not precisely reflect the real motivation of animals and thus, individuals in DomWorld may have a higher (or lower) propensity to initiate fights that they do not win than in real animals. Indeed, in sifakas, there seems to be an interesting relationship between sex, initiation of agonistic interactions, and the ability to win. Under certain conditions, males were more likely to win intersexual conflicts if they initiated them than if they did not, despite intersexual dominance being biased toward females (Lewis et al., 2022). Thus, more research is required on why individuals initiate conflicts, especially in intersexual dyads, and whether the proportion of intersexual conflicts initiated reflects intersexual dominance relations well in real animals.
We studied the accuracy of four measures of intersexual dominance in a computational model, DomWorld, because its patterns of dominance resemble those in empirical data (Hemelrijk et al., 2017). We demonstrate that in smaller or more despotic groups, all four measures were more accurate. We urge future studies to report intersexual dominance by using two of our most effective measures together, the Female Dominance Index and the proportion of intersexual conflicts initiated. We highlight the need to include both intra- and intersexual conflicts when inferring a dominance hierarchy, even when considering dominance among members of a single sex.
The datasets presented in this study can be found in online repositories. The names of the repository/repositories and accession number(s) can be found below: DataVerseNL: https://doi.org/10.34894/FX1R29.
LS, TS, and CH were involved in the conceptualization of the study. LS analyzed the data and drafted the manuscript. All authors contributed to discussions and editing of the manuscript.
LS was funded by the Leverhulme Trust Study Abroad Studentship, SAS-2020-026/2. The idea for this manuscript came out of the Workshop of the Lorentz Center in the Netherlands (Dynamics of the dominance of females relative to males in a group) for which funding was awarded to CH.
We thank the editor and reviewers for their comments on our manuscript which greatly improved it.
The authors declare that the research was conducted in the absence of any commercial or financial relationships that could be construed as a potential conflict of interest.
All claims expressed in this article are solely those of the authors and do not necessarily represent those of their affiliated organizations, or those of the publisher, the editors and the reviewers. Any product that may be evaluated in this article, or claim that may be made by its manufacturer, is not guaranteed or endorsed by the publisher.
The Supplementary Material for this article can be found online at: https://www.frontiersin.org/articles/10.3389/fevo.2022.982507/full#supplementary-material
Adamo, S. A., and Hoy, R. R. (1995). Agonistic behaviour in male and female field crickets, Gryllus bimaculatus, and how behavioural context influences its expression. Anim. Behav. 49, 1491–1501. doi: 10.1016/0003-3472(95)90070-5
Beacham, J. L. (1988). The relative importance of body size and aggressive experience as determinants of dominance in pumpkinseed sunfish, Lepomis gibbosus. Anim. Behav. 36, 621–623. doi: 10.1016/S0003-3472(88)80042-3
Brooks, M. E., Kristensen, K., Benthem, K. J., van Magnusson, A., Berg, C. W., Nielsen, A., et al. (2017). glmmTMB balances speed and flexibility among packages for zero-inflated generalized linear mixed modeling. R J. 9, 378–400. doi: 10.32614/RJ-2017-066
Cafazzo, S., Lazzaroni, M., and Marshall-Pescini, S. (2016). Dominance relationships in a family pack of captive arctic wolves (Canis lupus arctos): the influence of competition for food, age and sex. PeerJ 4, e2707. doi: 10.7717/peerj.2707
Chase, I. D. (1974). Models of hierarchy formation in animal societies. Behav. Sci. 19, 374–382. doi: 10.1002/bs.3830190604
Chase, I. D., and Seitz, K. (2011). Self-structuring properties of dominance hierarchies a new perspective. Adv Genet. 75, 51–81. doi: 10.1016/B978-0-12-380858-5.00001-0
Davidian, E., Surbeck, M., Lukas, D., Kappeler, P. M., and Huchard, E. (2022). The eco-evolutionary landscape of power relationships between males and females. Trends Ecol. Evol. 37, 706–718. doi: 10.1016/j.tree.2022.04.004
de Vries, H. (1998). Finding a dominance order most consistent with a linear hierarchy: a new procedure and review. Anim. Behav. 55, 827–843. doi: 10.1006/anbe.1997.0708
de Vries, H. (2009). On using the DomWorld model to evaluate dominance ranking methods. Behaviour 146, 843–869. doi: 10.1163/156853909X412241
de Vries, H., Stevens, J. M. G., and Vervaecke, H. (2006). Measuring and testing the steepness of dominance hierarchies. Anim. Behav. 71, 585–592. doi: 10.1016/j.anbehav.2005.05.015
Douglas, P. H., Ngonga Ngomo, A.-C., and Hohmann, G. (2017). A novel approach for dominance assessment in gregarious species: ADAGIO. Anim. Behav. 123, 21–32. doi: 10.1016/j.anbehav.2016.10.014
Drews, C. (1993). The concept and definition of dominance in animal behaviour. Behaviour 125, 283–313. doi: 10.1163/156853993X00290
Farine, D. R., and Sánchez-Tójar, A. (2021). aniDom: Inferring Dominance Hierarchies and Estimating Uncertainty. Available online at: https://CRAN.R-project.org/package=aniDom (accessed August 23, 2022).
Franz, M., McLean, E., Tung, J., Altmann, J., and Alberts, S. C. (2015). Self-organizing dominance hierarchies in a wild primate population. Proc. R. Soc. B Biol. Sci. 282, 20151512. doi: 10.1098/rspb.2015.1512
Gammell, M. P., de Vries, H., Jennings, D. J., Carlin, C. M., and Hayden, T. J. (2003). David's score: a more appropriate dominance ranking method than Clutton-Brock et al.'s index. Anim. Behav. 66, 601–605. doi: 10.1006/anbe.2003.2226
Hartig, F. (2022). Dharma: Residual Diagnostics for Hierarchical (Multi-level/Mixed) Regression Models. Available online at: https://CRAN.R-project.org/package=DHARMa (accessed August 18, 2022).
Hasiniaina, A. F., Scheumann, M., Evasoa, M. R., Braud, D., Rasoloharijaona, S., Randrianambinina, B., et al. (2018). High frequency/ultrasonic communication in a critically endangered nocturnal primate, Claire's mouse lemur (Microcebus mamiratra). Am. J. Primatol. 80, e22866. doi: 10.1002/ajp.22866
Hemelrijk, C. K. (1999). An individual–orientated model of the emergence of despotic and egalitarian societies. Proc. R. Soc. Lond. B Biol. Sci. 266, 361–369. doi: 10.1098/rspb.1999.0646
Hemelrijk, C. K. (2000). Towards the integration of social dominance and spatial structure. Anim. Behav. 59, 1035–1048. doi: 10.1006/ANBE.2000.1400
Hemelrijk, C. K., Kappeler, P. M., and Puga-Gonzalez, I. (2017). “The self-organization of social complexity in group-living animals,” in Advances in the Study of Behavior, eds M. Naguib, J. Podos, L. W. Simmons, L. Barrett, S. Healy, and M. Zuk (Academic Press), 361–405. doi: 10.1016/bs.asb.2017.02.005
Hemelrijk, C. K., Wantia, J., and Gygax, L. (2005). The construction of dominance order: comparing performance of five methods using an individual-based model. Behaviour 142, 1037–1058. doi: 10.1163/156853905774405290
Hemelrijk, C. K., Wantia, J., and Isler, K. (2008). Female dominance over males in primates: self-organisation and sexual dimorphism. PLoS ONE 3, e2678. doi: 10.1371/journal.pone.0002678
Hemelrijk, C. K., Wubs, M., Gort, G., Botting, J., and van de Waal, E. (2020). Dynamics of intersexual dominance and adult sex-ratio in wild vervet monkeys. Front. Psychol. 11, 839. doi: 10.3389/fpsyg.2020.00839
Hofstede, G. J., Student, J., and Kramer, M. R. (2018). The status–power arena: a comprehensive agent-based model of social status dynamics and gender in groups of children. AI Soc. doi: 10.1007/s00146-017-0793-5
Hohenbrink, S., Schaarschmidt, F., Bünemann, K., Gerberding, S., Zimmermann, E., and Radespiel, U. (2016). Female dominance in two basal primates, Microcebus murinus and Microcebus lehilahytsara: variation and determinants. Anim. Behav. 122, 145–156. doi: 10.1016/j.anbehav.2016.10.008
Horová, E., Brandlová, K., and Gloneková, M. (2015). The first description of dominance hierarchy in captive giraffe: not loose and egalitarian, but clear and linear. PLoS ONE 10, e0124570. doi: 10.1371/journal.pone.0124570
Hsu, M. J., Lin, J. F., and Agoramoorthy, G. (2006). Effects of group size on birth rate, infant mortality and social interactions in Formosan macaques at Mt Longevity, Taiwan. Ethol. Ecol. Evol. 18, 3–17. doi: 10.1080/08927014.2006.9522722
Hsu, Y., Lee, I. H., and Lu, C.-K. (2009). Prior contest information: mechanisms underlying winner and loser effects. Behav. Ecol. Sociobiol. 63, 1247–1257. doi: 10.1007/s00265-009-0791-9
Izar, P., Fernández-Bolaños, M., Seex, L., Gort, G., Suscke, P., Tokuda, M., et al. (2021). Female emancipation in a male dominant, sexually dimorphic primate under natural conditions. PLoS ONE 16, e0249039. doi: 10.1371/journal.pone.0249039
Jackson, W. M. (1991). Why do winners keep winning? Behav. Ecol. Sociobiol. 28, 271–276. doi: 10.1007/BF00175100
Kappeler, P. M., Fichtel, C., and Radespiel, U. (2022a). The island of female power? Intersexual dominance relationships in the lemurs of Madagascar. Front. Ecol. Evol. 10, 858859. doi: 10.3389/fevo.2022.858859
Kappeler, P. M., Huchard, E., Baniel, A., Canteloup, C., Charpentier, M. J. E., Cheng, L., et al. (2022b). Sex and dominance: how to assess and interpret intersexual dominance relationships in mammalian societies? Front. Ecol. Evol. 10, 918773. doi: 10.3389/fevo.2022.918773
Kassambara, A. (2020). ggpubr: “ggplot2” Based Publication Ready Plots. R Package Version 0.4.0. Availabe online at: https://cran.r-project.org
Klass, K., and Cords, M. (2011). Effect of unknown relationships on linearity, steepness and rank ordering of dominance hierarchies: simulation studies based on data from wild monkeys. Behav. Processes 88, 168–176. doi: 10.1016/j.beproc.2011.09.003
Knowles, R. J., Curtis, T. M., and Crowell-Davis, S. L. (2004). Correlation of dominance as determined by agonistic interactions with feeding order in cats. Am. J. Vet. Res. 65, 1548–1556. doi: 10.2460/ajvr.2004.65.1548
Koren, L., Mokady, O., and Geffen, E. (2006). Elevated testosterone levels and social ranks in female rock hyrax. Horm. Behav. 49, 470–477. doi: 10.1016/j.yhbeh.2005.10.004
Lenth, R. V. (2021). Emmeans: Estimated Marginal Means, Aka Least-Squares Means. Available online at: https://CRAN.R-project.org/package=emmeans (accessed January 27, 2022).
Lewis, R. J. (2002). Beyond dominance: the importance of leverage. Q. Rev. Biol. 77, 149–164. doi: 10.1086/343899
Lewis, R. J., Bueno, G. L., and Di Fiore, A. (2022). Variation in female leverage: the influence of kinship and market effects on the extent of female power over males in Verreaux's sifaka. Front. Ecol. Evol. 10, 851880. doi: 10.3389/fevo.2022.851880
Li, X.-Y., and Kokko, H. (2019). Intersexual resource competition and the evolution of sex-biased dispersal. Front. Ecol. Evol. 7, 111. doi: 10.3389/fevo.2019.00111
Mesterton-Gibbons, M., Dai, Y., and Goubault, M. (2016). Modeling the evolution of winner and loser effects: a survey and prospectus. Math. Biosci. 274, 33–44. doi: 10.1016/j.mbs.2016.02.002
Neumann, C., and Kulik, L. (2020). EloRating: Animal Dominance Hierarchies by Elo Rating. Available online at: https://CRAN.R-project.org/package=EloRating (accessed March 31, 2022).
Oldham, L., Camerlink, I., Arnott, G., Doeschl-Wilson, A., Farish, M., and Turner, S. P. (2020). Winner–loser effects overrule aggressiveness during the early stages of contests between pigs. Sci. Rep. 10, 13338. doi: 10.1038/s41598-020-69664-x
R Core Team (2021). R: A Language and Environment for Statistical Computing. Vienna, Austria: R Foundation for Statistical Computing Available online at: https://www.R-project.org/
RStudio Team (2020). Rstudio: Integrated Development Environment for R. Boston, MA: RStudio, PBC. Available online at: http://www.rstudio.com/
Sánchez-Tójar, A., Schroeder, J., and Farine, D. R. (2018). A practical guide for inferring reliable dominance hierarchies and estimating their uncertainty. J. Anim. Ecol. 87, 594–608. doi: 10.1111/1365-2656.12776
Surbeck, M., and Hohmann, G. (2013). Intersexual dominance relationships and the influence of leverage on the outcome of conflicts in wild bonobos (Pan paniscus). Behav. Ecol. Sociobiol. 67, 1767–1780. doi: 10.1007/s00265-013-1584-8
Trivers, R. L. (1972). “Parental investment and sexual selection,” in Sexual Selection and the Descent of Man: The Darwinian Pivot Sexual Selection and the Descent of Man, ed B. Campbell (Chicago, IL: Aldine), 136–179.
Vehrencamp, S. L. (1983). A model for the evolution of despotic versus egalitarian societies. Anim. Behav. 31, 667–682. doi: 10.1016/S0003-3472(83)80222-X
White, F. J., and Wood, K. D. (2007). Female feeding priority in bonobos,Pan paniscus, and the question of female dominance. Am. J. Primatol. 69, 837–850. doi: 10.1002/ajp.20387
Keywords: intersexual dominance, Female Dominance Index, dominance, sex, winner-loser effect, DomWorld, agent-based model
Citation: Seex L, Saccà T and Hemelrijk CK (2022) How to measure intersexual dominance? Front. Ecol. Evol. 10:982507. doi: 10.3389/fevo.2022.982507
Received: 30 June 2022; Accepted: 17 October 2022;
Published: 28 November 2022.
Edited by:
José F. Fontanari, University of São Paulo, BrazilReviewed by:
María Florencia Scaia, Consejo Nacional de Investigaciones Científicas y Técnicas (CONICET), ArgentinaCopyright © 2022 Seex, Saccà and Hemelrijk. This is an open-access article distributed under the terms of the Creative Commons Attribution License (CC BY). The use, distribution or reproduction in other forums is permitted, provided the original author(s) and the copyright owner(s) are credited and that the original publication in this journal is cited, in accordance with accepted academic practice. No use, distribution or reproduction is permitted which does not comply with these terms.
*Correspondence: Lauren Seex, bC5zZWV4QHJ1Zy5ubA==
Disclaimer: All claims expressed in this article are solely those of the authors and do not necessarily represent those of their affiliated organizations, or those of the publisher, the editors and the reviewers. Any product that may be evaluated in this article or claim that may be made by its manufacturer is not guaranteed or endorsed by the publisher.
Research integrity at Frontiers
Learn more about the work of our research integrity team to safeguard the quality of each article we publish.