 John M. Fryxell
 Simon Mduma2
 Grant J. C. Hopcraft
 Craig Packer
94% of researchers rate our articles as excellent or good
Learn more about the work of our research integrity team to safeguard the quality of each article we publish.
Find out more
ORIGINAL RESEARCH article
Front. Ecol. Evol., 18 August 2022
Sec. Population, Community, and Ecosystem Dynamics
Volume 10 - 2022 | https://doi.org/10.3389/fevo.2022.981842
This article is part of the Research TopicNew Perspectives and Emerging Directions in Predator–Prey Functional Response Research: Hommage to C.S. Holling (1930–2019)View all 18 articles
Predator-prey theory often assumes that potential prey individuals are solitary and evenly distributed in space. This assumption is violated in social, mobile prey, such as many ungulates. Here we use data from 80 monthly field censuses to estimate the parameters for a power relationship between herd density and population density for eight species of large herbivores commonly found in the diet of Serengeti lions, confirming a power relationship proposed from a preliminary Serengeti dataset. Here we extend our analysis of that model to demonstrate how parameters of the power function relate to average herd size and density-dependent changes in herd size and evaluate how interspecific variation in these parameters shapes the group-dependent functional response by Serengeti lions for eight prey species. We apply the different prey-specific functional response models in a Rosenzweig-MacArthur framework to compare their impact on the stability of predator–prey dynamics. Model outcomes suggest that group formation plays a strong role in stabilizing lion–herbivore interactions in Serengeti by forcing lions to search over a larger area before each prey encounter. As a consequence of grouping by their prey, our model also suggests that Serengeti lions are forced to broaden their diets to include multiple species of prey in order to persist, potentially explaining the generalist foraging by lions routinely recorded across multiple ecosystems.
Holling’s (1959a,b) pivotal concept of the predator functional response has shaped the development of ecological theory, experimentation, and field measurement of predator-prey relationships for decades. A central assumption in Holling’s models, as well as virtually all subsequent models of predator functional responses, is that both predators and prey move independently, such that the rate of prey encounter by each predator is governed solely by the densities of predators and prey. Departures from this assumption often have important dynamical consequences. For example, much debate has centered on the degree of empirical support for functional response models that incorporate time expenditure via aggressive interference between predators (Beddington, 1975; DeAngelis et al., 1975). Time wasted on agonistic interactions among predators detracts from search time, thereby reducing the efficiency of search by predators and, consequently, the per capita predation risks faced by prey individuals. Under some circumstances, mutual interference can lead to a relationship in which each predator’s feeding rate is well-approximated by the ratio of prey to predators, rather than density of prey per se (Arditi and Ginzburg, 1989).
Considerably less attention has been directed to dynamical implications when prey and/or predators travel in groups, rather than as independent individuals (Cosner et al., 1999). This is somewhat surprising, since many organisms form loose social associations, ranging from the smallest bacteria to the largest mammals on land or sea (Wilson, 1975; Krause and Ruxton, 2002). Depending on the degree of spatial clustering by predators or prey, group geometry, and the nature of the behavioral response by a predator to each successful encounter, group formation can result in functional responses that vary from Holling’s (1959a,b) classic type II hyperbola, to predator-dependent interference (Beddington, 1975; DeAngelis et al., 1975) or even ratio-dependent (Arditi and Ginzburg, 1989) forms (Cosner et al. (1999).
In an earlier paper (Fryxell et al., 2007) based on 2.5 years of data, we suggested that grouping patterns of Serengeti large herbivores can be approximated reasonably well by a power law relationship with population density. Here we use a much larger database (7 years) to estimate parameters for the power law relationship for the eight Serengeti herbivore species that are most frequently captured by lions. We then evaluate the impact of interspecific variation in fitted power law relationships recorded across the eight prey species on group-dependent functional responses in a Rosenzweig-MacArthur model framework (Rosenzweig and MacArthur, 1963; Rosenzweig, 1971). This allows us to compare the relative impact of each species’ herding patterns on local predator-prey stability. A future paper will address the effect of dynamic models of group formation by Serengeti lions. Here we simply assume that lions form a constant hunting group of 4.02 individual lionesses (since females do most of the hunting), based on the mean lioness group size during 10,709 ad hoc field sightings recorded during 2004–2012.
The most commonly applied functional response model is Holling’s type II hyperbolic curve:
where Ψ = the number of prey killed by each individual predator per unit time (in units day–1); N = prey density (km–2); α = the rate of encounter by a randomly searching predator per unit of search time (km2 day–1); h1 = the time spent capturing each prey item (day); and h2 = the time spent processing each prey item (day). Holling’s type II functional response predicts that predation rates will increase rapidly with initial increases in prey density at a rate dictated by the search parameter α, decelerate at intermediate prey densities, and eventually saturate at an asymptote dictated by the reciprocal of handling time (1/[h1 + h2]).
Field observations (Scheel, 1993) of lion behavior allow us to mechanistically predict the lion functional response from first principles (Fryxell et al., 2007). At its core, predator search efficiency depends on the area searched per unit time (a), composed of the distance traveled per unit time (10 km day–1) multiplied by 2× the radius of successful attack (0.2 km). This value must then be weighted by the probability (valued between 0 and 1) that a lion will choose to attack the encountered prey group (s) and the subsequent probability of successful capture (p), hence the rate of successful attack per unit search time α = asp. Lion preference (s) and probability of successful prey capture (p) vary across prey species, as do the capture time per successful attack (h1 measured in days) and the time to consume each prey item (h2 measured in days), which is predictable on the basis of the amount of meat on the carcass divided by lion group size (γ). All of these parameters have been estimated in the field by Scheel (1993) for the eight most common prey species in the diet of Serengeti lions (Table 1).
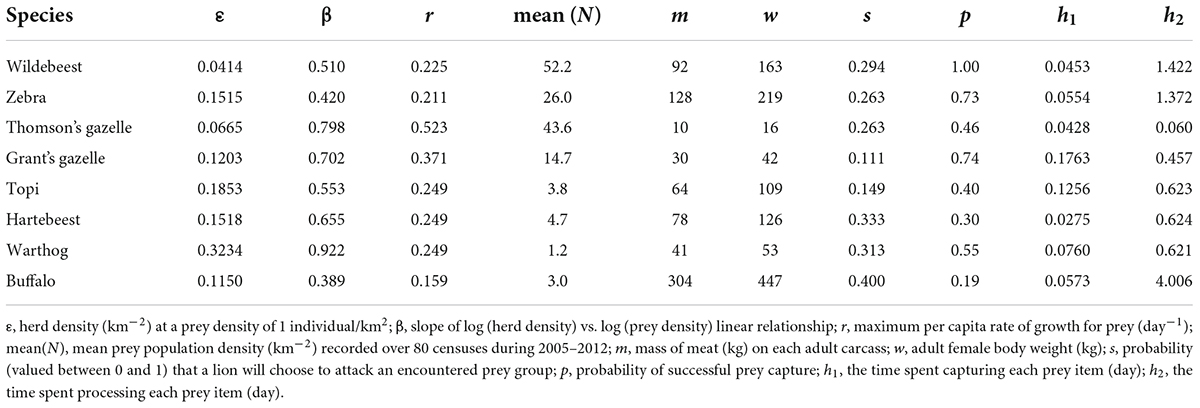
Table 1. Parameters for Serengeti group-dependent predator–prey model.
The rate at which prey are killed by predators (Ψ) also depends on the degree to which they form herds, due to grouping effects on predator search efficiency. If prey individuals typically tend to co-occur in close spatial proximity, such that a compact herd is no more conspicuous than a single prey individual, the rate of encounter is better predicted by herd density rather than prey density per se (Cosner et al., 1999; Fryxell et al., 2007). Frequency distributions from several previous studies (Bonabeau et al., 1999; Sjoberg et al., 2000) suggest that group density (H) in some fish and mammal species is related to prey density (N) by a power function: H = εNβ, a pattern consistent with previously-published data from our work in Serengeti (Sinclair, 1977; Fryxell et al., 2007). If lions form hunting groups of constant size γ, then the group-dependent functional response for Serengeti lions (Fryxell et al., 2007) can be calculated as follows:
The impact of predation on system dynamics can be evaluated by simply substituting this group-dependent functional response into a Rosenzweig-MacArthur system of equations to model the rate of change of predators (F2(N,P)) and prey (F1(N,P)) in continuous time (Rosenzweig and MacArthur, 1963; Rosenzweig, 1971):
where P = predator density (km–2); r = maximum per capita rate of growth for prey (day–1); K = prey carrying capacity (km–2); c = rate of conversion of consumed prey into new predator recruits (kg–1), m = mass of meat on the carcass of every prey item killed (kg); and d = mortality rate of predators (day–1). Local stability of the interaction depends on the magnitude of elements of the Jacobian (sometimes termed community) matrix (M) calculated at equilibrium densities of N and P:
where , , , and . The model system will be locally stable provided that the eigenvalues of the Jacobian matrix have a negative real part, which will only be true if and only if μ1,1+μ2,2< 0 and μ1,1μ2,2– μ1,2μ2,1> 0 (Otto and Day, 2007). All but 3 of the system parameters (c, d, and K) in our group-dependent predator–prey model were obtainable from previous publications on lion predatory behavior (Scheel, 1993), Western’s (1979) summary of field estimates of life history parameters for seven species of large mammals (excluding topi), Western’s (1979) allometric equation to predict the maximum per capita growth rate (r) of African large mammals based on body mass to predict r for topi, or census data gathered during 2005–2012 (described below).
To apply the local stability analysis to Serengeti herbivores, we evaluate model stability at combinations of d and K estimated for each prey species. K for each herbivore species was estimated as mean population density recorded over 80 ground censuses during 2005–2012. Long-term data suggest that adult survivorship of Serengeti lions has averaged 80% per year (Packer, 2023), which we converted to a daily exponential rate of mortality by d = −log (0.8)/365 = 0.0006. Immediately following collapse of the lion population living in the Ngorongoro Crater to four individuals following a Stomoxys fly outbreak in the 1960’s, the maximum exponential rate of subsequent increase was 0.53 (Packer, 2023), which we converted to an exponential daily rate of r = 0.53/365 = 0.0015. Assuming that lions were feeding at a maximum rate during that time, then c = (r + d)/m(max[Ψ]) = 0.00005 kg–1. We accordingly evaluated local stability of lion-herbivore dynamics in relation to prey carrying capacity (K) and lion mortality rate per day (d), both of which are likely to be ecosystem-specific.
From 2005 to 2012, we performed monthly census counts of large herbivores falling within a 100 m radius of a slowly driven (10–20 kph) vehicle along 391 km of existing roads and game tracks that span a wide range of crude habitat types (open grasslands, lightly-wooded savannah grasslands, thickets, and woodlands) that span the full spatial extent of Packer’s (2023) long-term Serengeti lion study area. Data from six of these track counts form the dataset (Supplementary material), with one track being driven each sequential day. Tracks were chosen that are normally accessible year-round. GPS waypoints were taken every 0.1 km when the transect was first laid out, so that subsequent odometer readings could be readily translated into UTM coordinates. Monthly census observations were ordinarily performed by both an observer and the driver.
Herbivore counts were initiated as close to sunrise as possible, with the odometer zeroed at the same obvious visual marker (fork in a road, signpost, etc.) used on every replicate. We used a maximum 100 m observation limit, chosen because distance sampling models in the same habitat types from the Serengeti western corridor (Bukombe et al., 2015) showed that >90% of typical lion prey (buffalo, wildebeest, topi, and zebra) were visible in open and savannah grasslands that predominate in our study areas on the Serengeti Plains and plains/woodland ecotone. Serendipitously, this width of transect roughly approximates the maximum range of successful stalks (200 m) by Serengeti lions (Scheel, 1993).
As each herbivore group was detected, the vehicle slowly advanced until it was nearly orthogonal to the herd. The vehicle was then stopped, and, if the group was large, the engine was shut off. Each observer counted individuals on their side of the vehicle, including all animals up to the midline of the track. The odometer reading was immediately recorded on a paper scoresheet, as well as an alphanumerical code for the species and the number of counted individuals. For species of special demographic interest, this process included estimates of age and sex class based on horn shape and length (Sinclair et al., 2013).
For the purposes of the current study, the herbivore census data were aggregated each month, which were converted to estimates of population density by dividing by the 391 km2 total extent of the visual census coverage.
Significant relationships between log (herd density) and log (population density) were found for wildebeest (F1,78 = 282.3, P < 0.001, R2 = 0.781), zebra (F1,78 = 82.5, P < 0.001, R2 = 0.508), Thomson’s gazelle (F1,78 = 359.5, P < 0.001, R2 = 0.819), Grant’s gazelle (F1,78 = 153.2, P < 0.001, R2 = 0.658), topi (F1,78 = 283.5, P < 0.001, R2 = 0.782), hartebeest (F1,78 = 196.8, P < 0.001, R2 = 0.713), warthog (F1,78 = 1144, P < 0.001, R2 = 0.935), and buffalo (F1,78 = 88.7, P < 0.001, R2 = 0.526), with well-structured and consistent residual variation around log-log regression lines for each species (Figure 1).
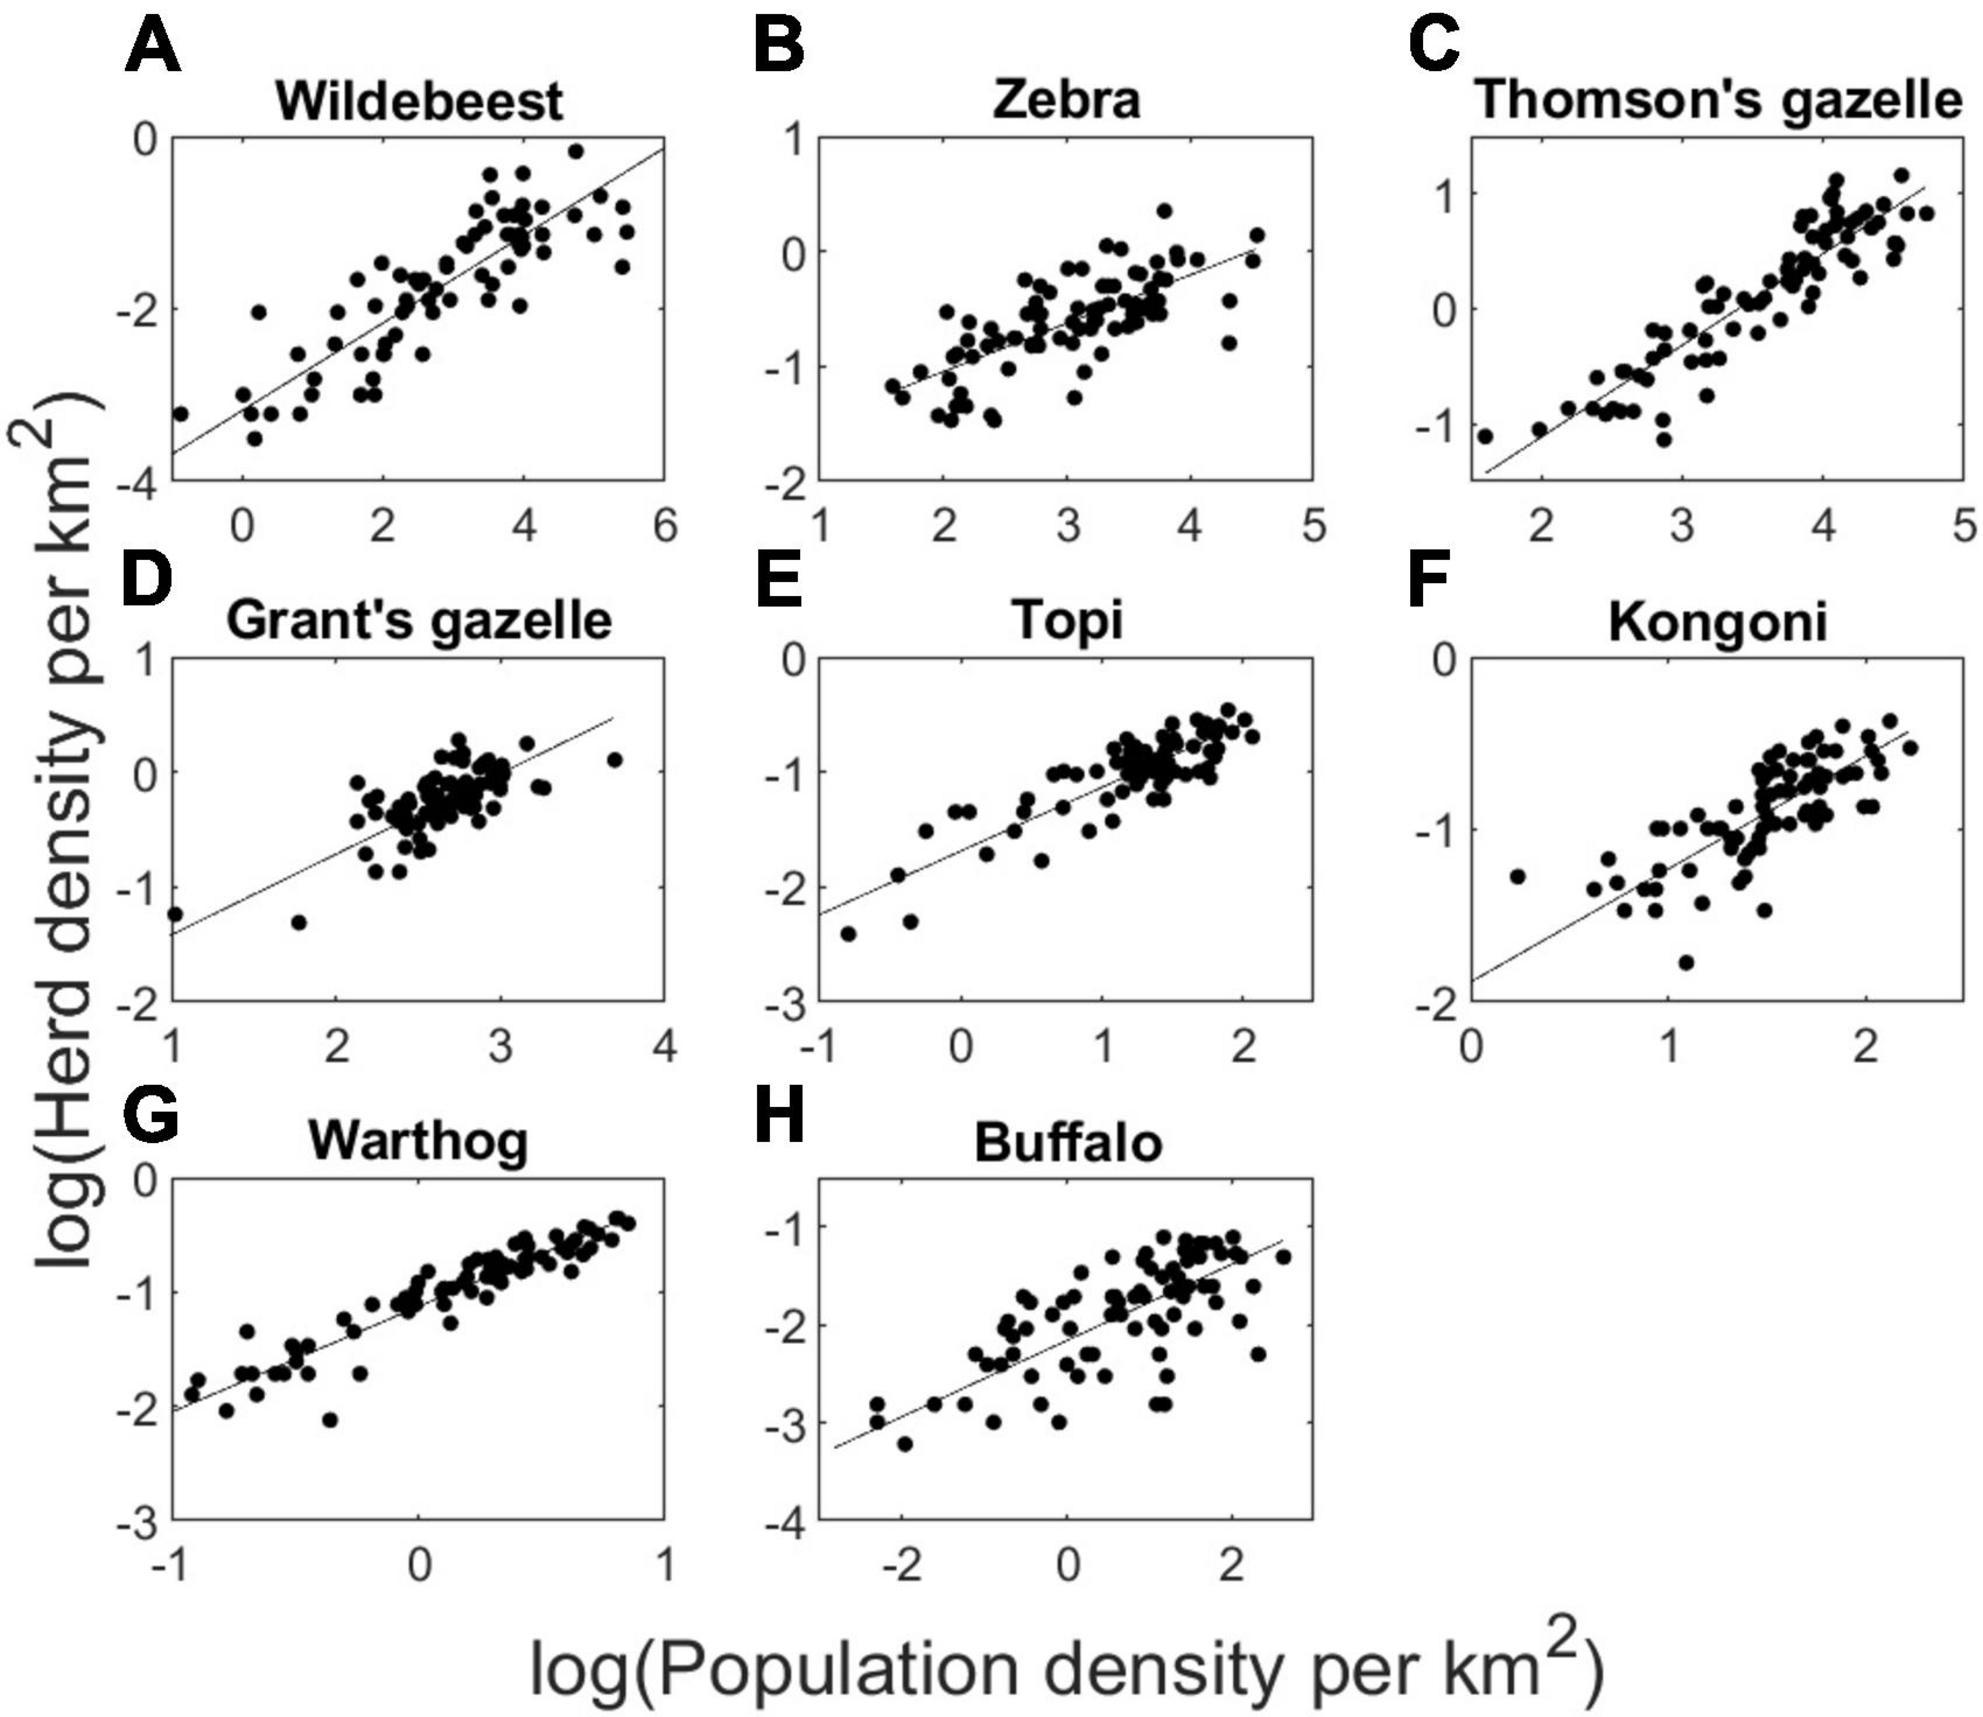
Figure 1. Log-transformed herd density plotted against log-transformed population density of 8 species of large herbivores in Serengeti National Park recorded during 80 monthly censuses conducted during 2005–2012. Best-fit regression lines provide the parameter values of ε and β of the power function (H = εNβ) applied to the functional response model (Eq. 2). Panels correspond to wildebeest (A), zebra (B), Thomson’s gazelles (C), Grant’s gazelles (D), topi (E), hartebeest (F), warthog (G), and buffalo (H).
Parameters for the power relationship offer practical insight into grouping characteristics (Figure 2). The lead parameter ε scales inversely with average group size. Hence, at a population density of 1 wildebeest per km2, herd density (ε) would be 0.0414, implying an average group size (1/ε) of roughly 24 individuals. Density-dependence in group formation scales inversely with the magnitude of the exponent β (Figure 2). Hence, a 10-fold increase in wildebeest density from 1 to 10 individuals per km2 would result only in a 3.2-fold increase (10β) in the frequency of herds per unit area, due to density-dependent increase in herd size. The magnitude of both of these parameters varied considerably across species. Wildebeest (ε = 0.0414) and Thomson’s gazelles (ε = 0.0665) exhibited much stronger grouping tendency at low population density than did warthogs (ε = 0.3234). Density-dependent effects on grouping were strongest in buffalo (β = 0.389) and zebra (β = 0.420) and weakest in warthog (β = 0.922) and Thompson’s gazelles (β = 0.798).
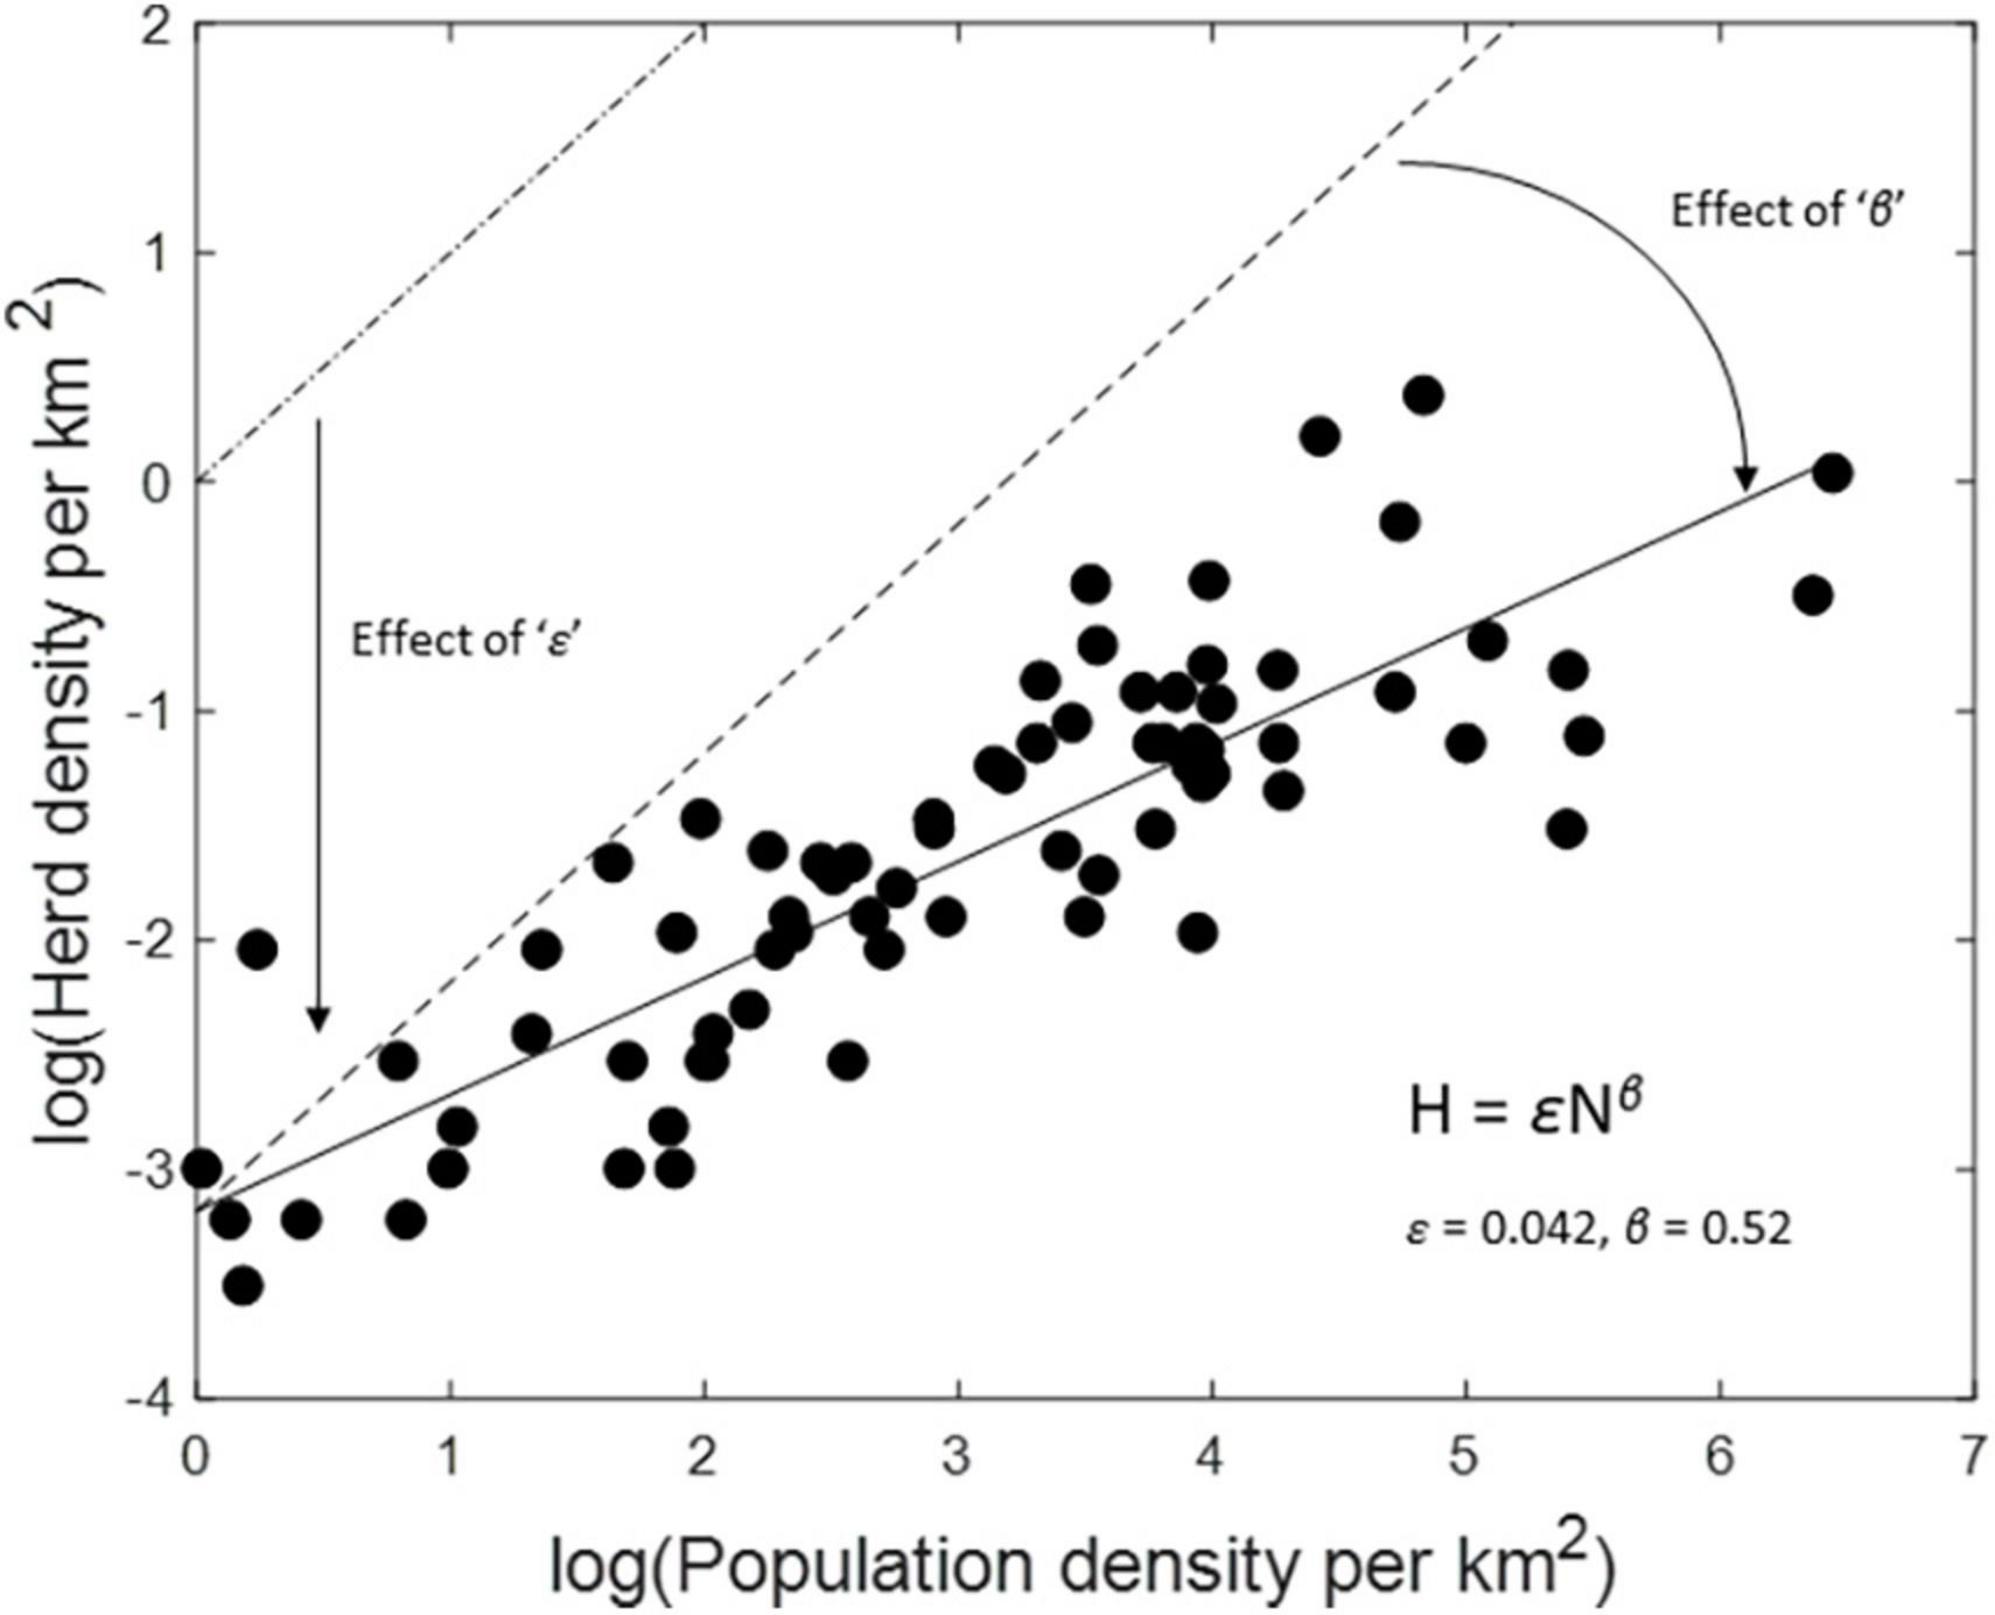
Figure 2. Graphical interpretation of the power function for Serengeti wildebeest. The dash-dot line in the upper left corner of the plot depicts the relationship when wildebeest individuals are solitary and randomly distributed in space. The dashed line depicts the relationship expected if wildebeest formed groups of constant size of 24 (= 1/ε). The solid line depicts the best-fit regression line plotted through the scatterplot of observations of log (herd density) plotted against log (population density). Deviation of the solid line from the dashed line is the result of density-dependent increase in group size.
Theory predicts that the magnitude of the grouping parameters can have considerable impact on the functional response and consequently on predator-prey dynamics. As a case in point, consider the effect of slight changes in grouping parameters on stability of a population of lions preying solely on wildebeest. Three outcomes are theoretically possible: both predators and prey approach a stable equilibrium over time (dark shading in Figures 3–6), both predators and prey have an unstable equilibrium, so population abundance would cycle continuously over time (open portion in Figures 3–6), or predators cannot sustain themselves in perpetuity (stippled shading in Figures 3–6). Changing the observed value of wildebeest ε = 0.04 to ε = 0.08 (i.e., reducing mean herd size from 24 to 12 when N = 1 km–2) roughly doubles the range of parameters leading to unstable (i.e., cyclic) dynamics). This can be seen by comparing the unshaded portion of Figure 3B vs. Figure 3A or Figure 3D vs. Figure 3C. Increasing the density-dependence grouping parameter for wildebeest from β = 0.50 to β = 0.75 (i.e., weakening the tendency to form larger herd when the population gets larger) would have a similarly destabilizing effect on lion-wildebeest population interactions (compare the unshaded portion of Figure 3C vs. Figure 3A or Figure 3D vs. Figure 3B).
Figure 3. Plot of dynamically unstable (unshaded), locally stable (dark shading), and unsustainable (moderate shading) outcomes for the group-dependent predator-prey model applied to lions feeding exclusively on wildebeest (Eqs 3, 4) as determined by predator mortality rate (d) and prey carrying capacity (K). Parameter values in panel (D) represent the observed grouping parameters for Serengeti wildebeest (ε = 0.04 and β = 0.50). The other panels demonstrate the impact of modifying prey grouping parameters (A) reducing both mean group size and grouping tendency (ε = 0.08 and β = 0.75); (B) retaining mean group size, reducing grouping tendency (ε = 0.04 and β = 0.75); (C) reducing mean group size, retaining grouping tendency (ε = 0.08 and β = 0.50). The red lines depict the estimated values of lion d and wildebeest K for Serengeti.
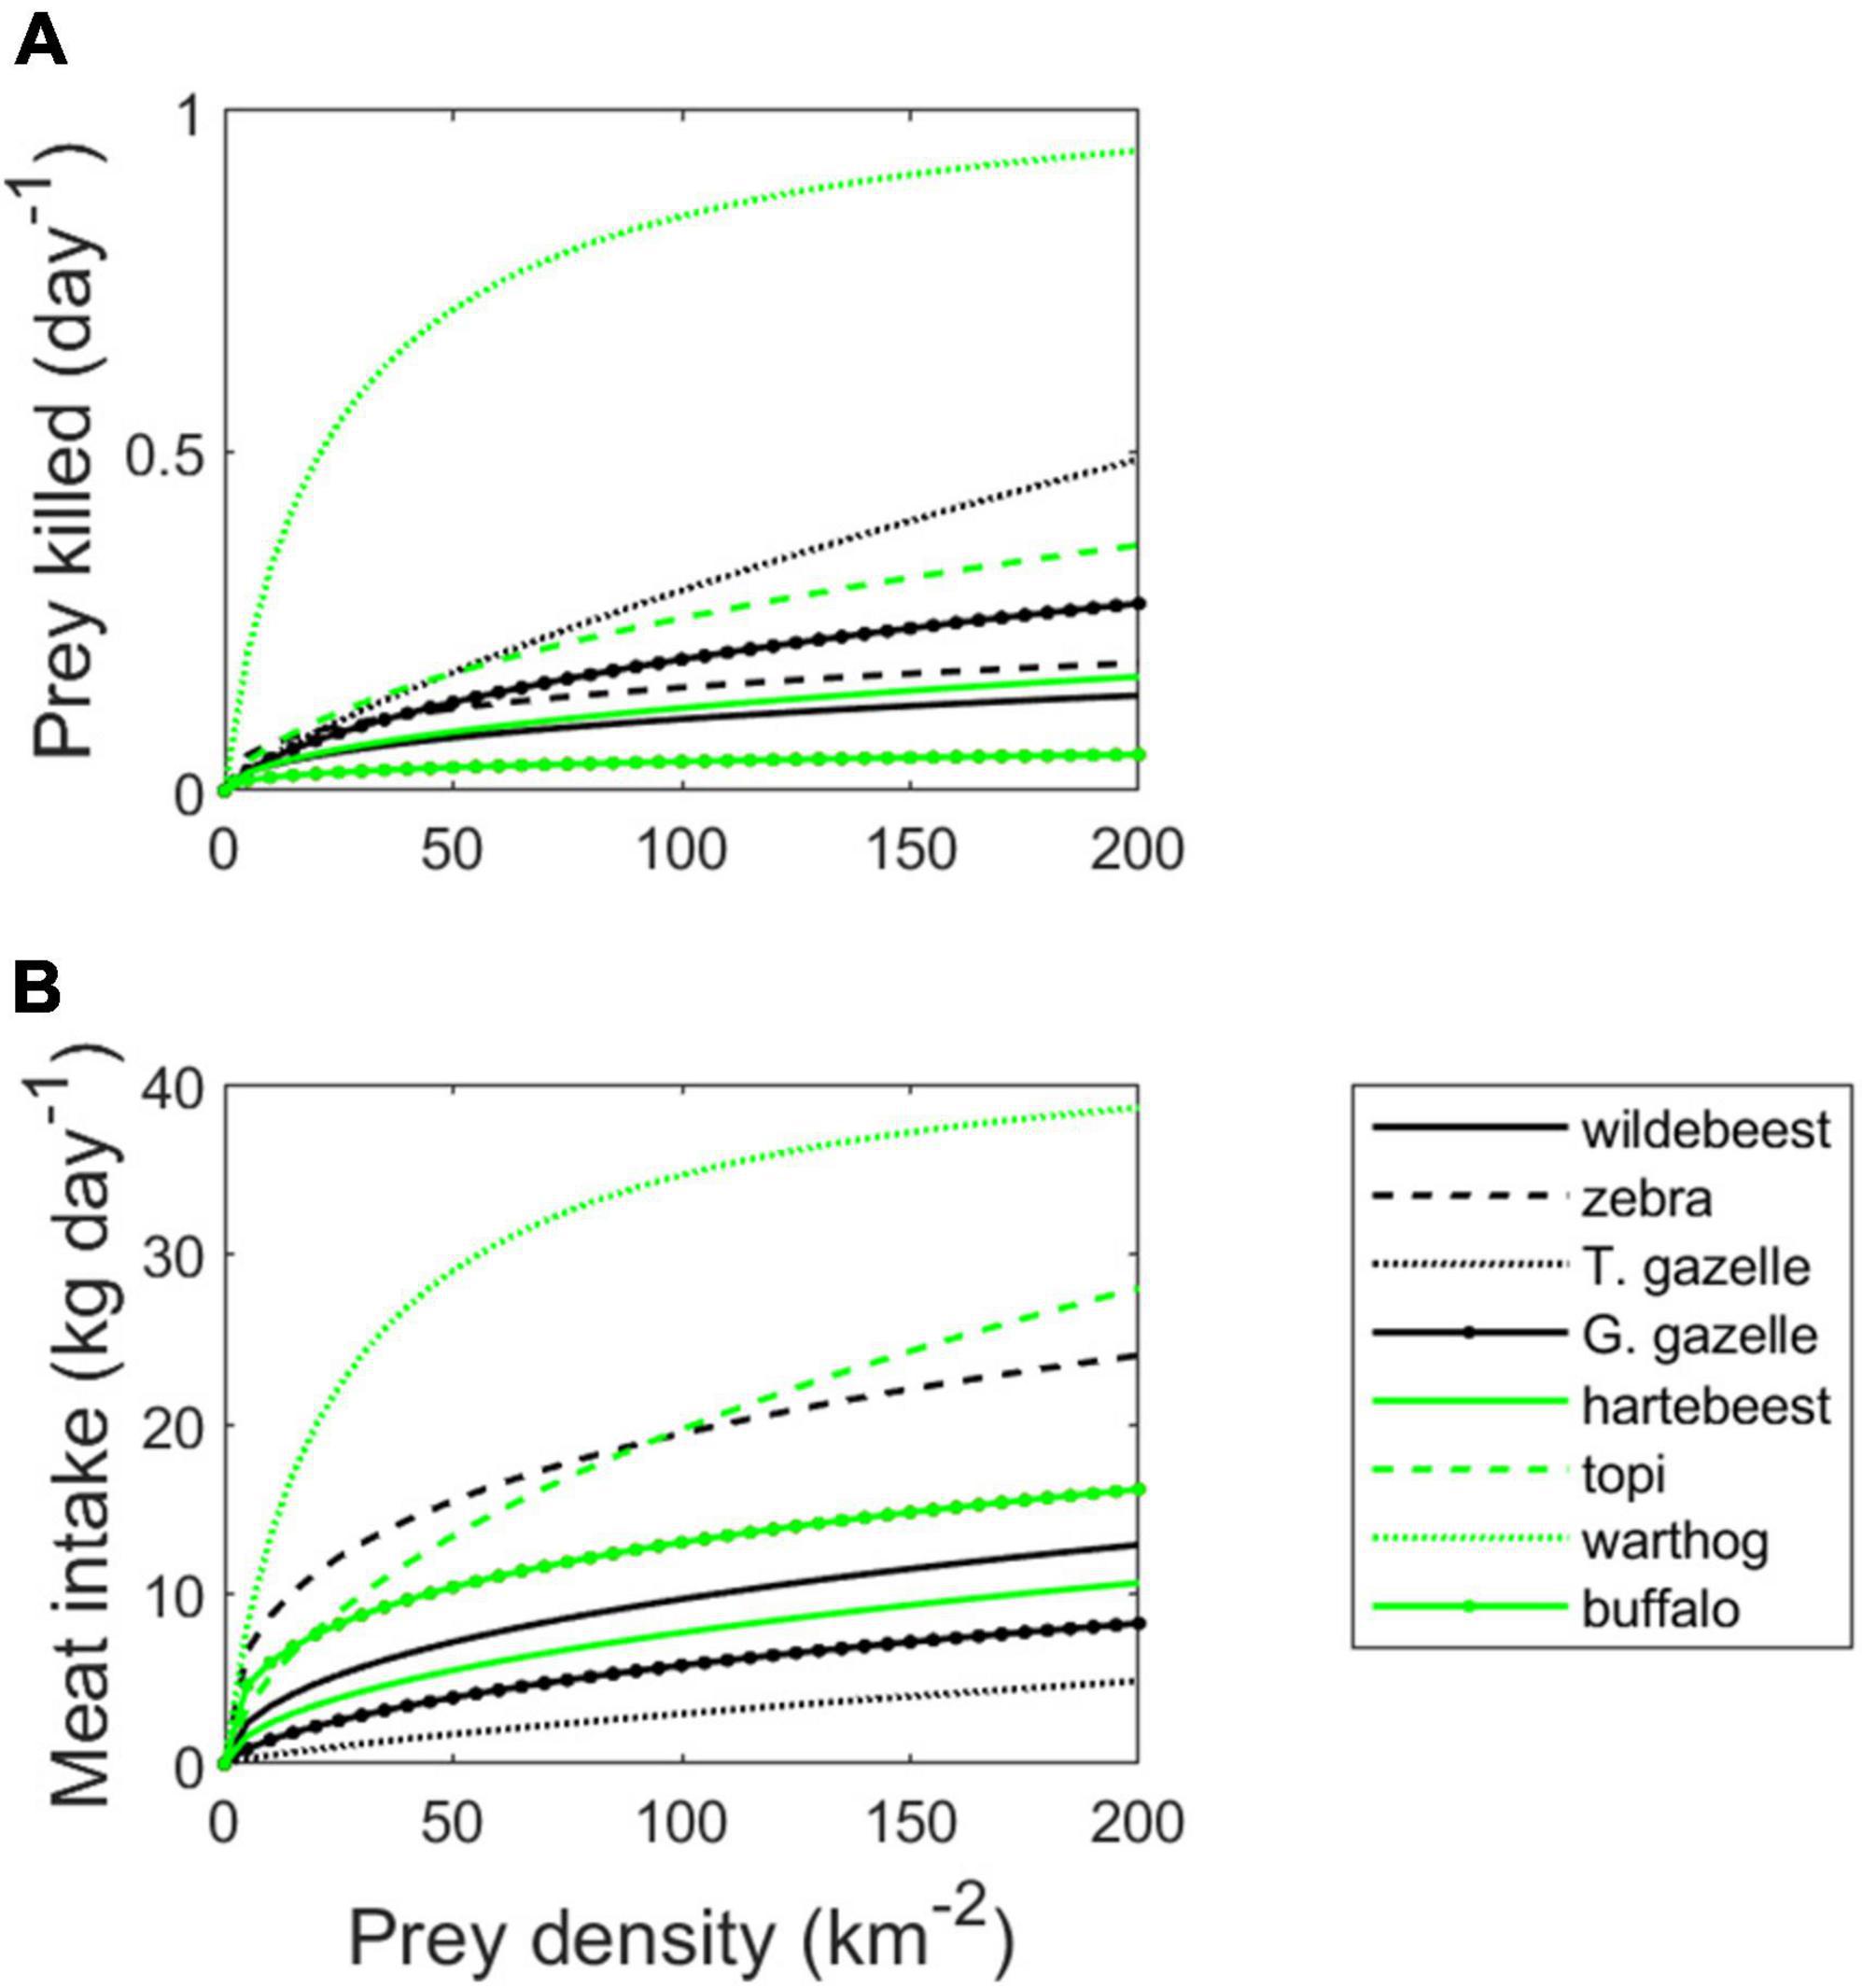
Figure 4. Group-dependent lion functional response for eight species of large herbivore prey in Serengeti (A) and the rate of meat intake as a result of this response (B). Parameters given in Table 1.
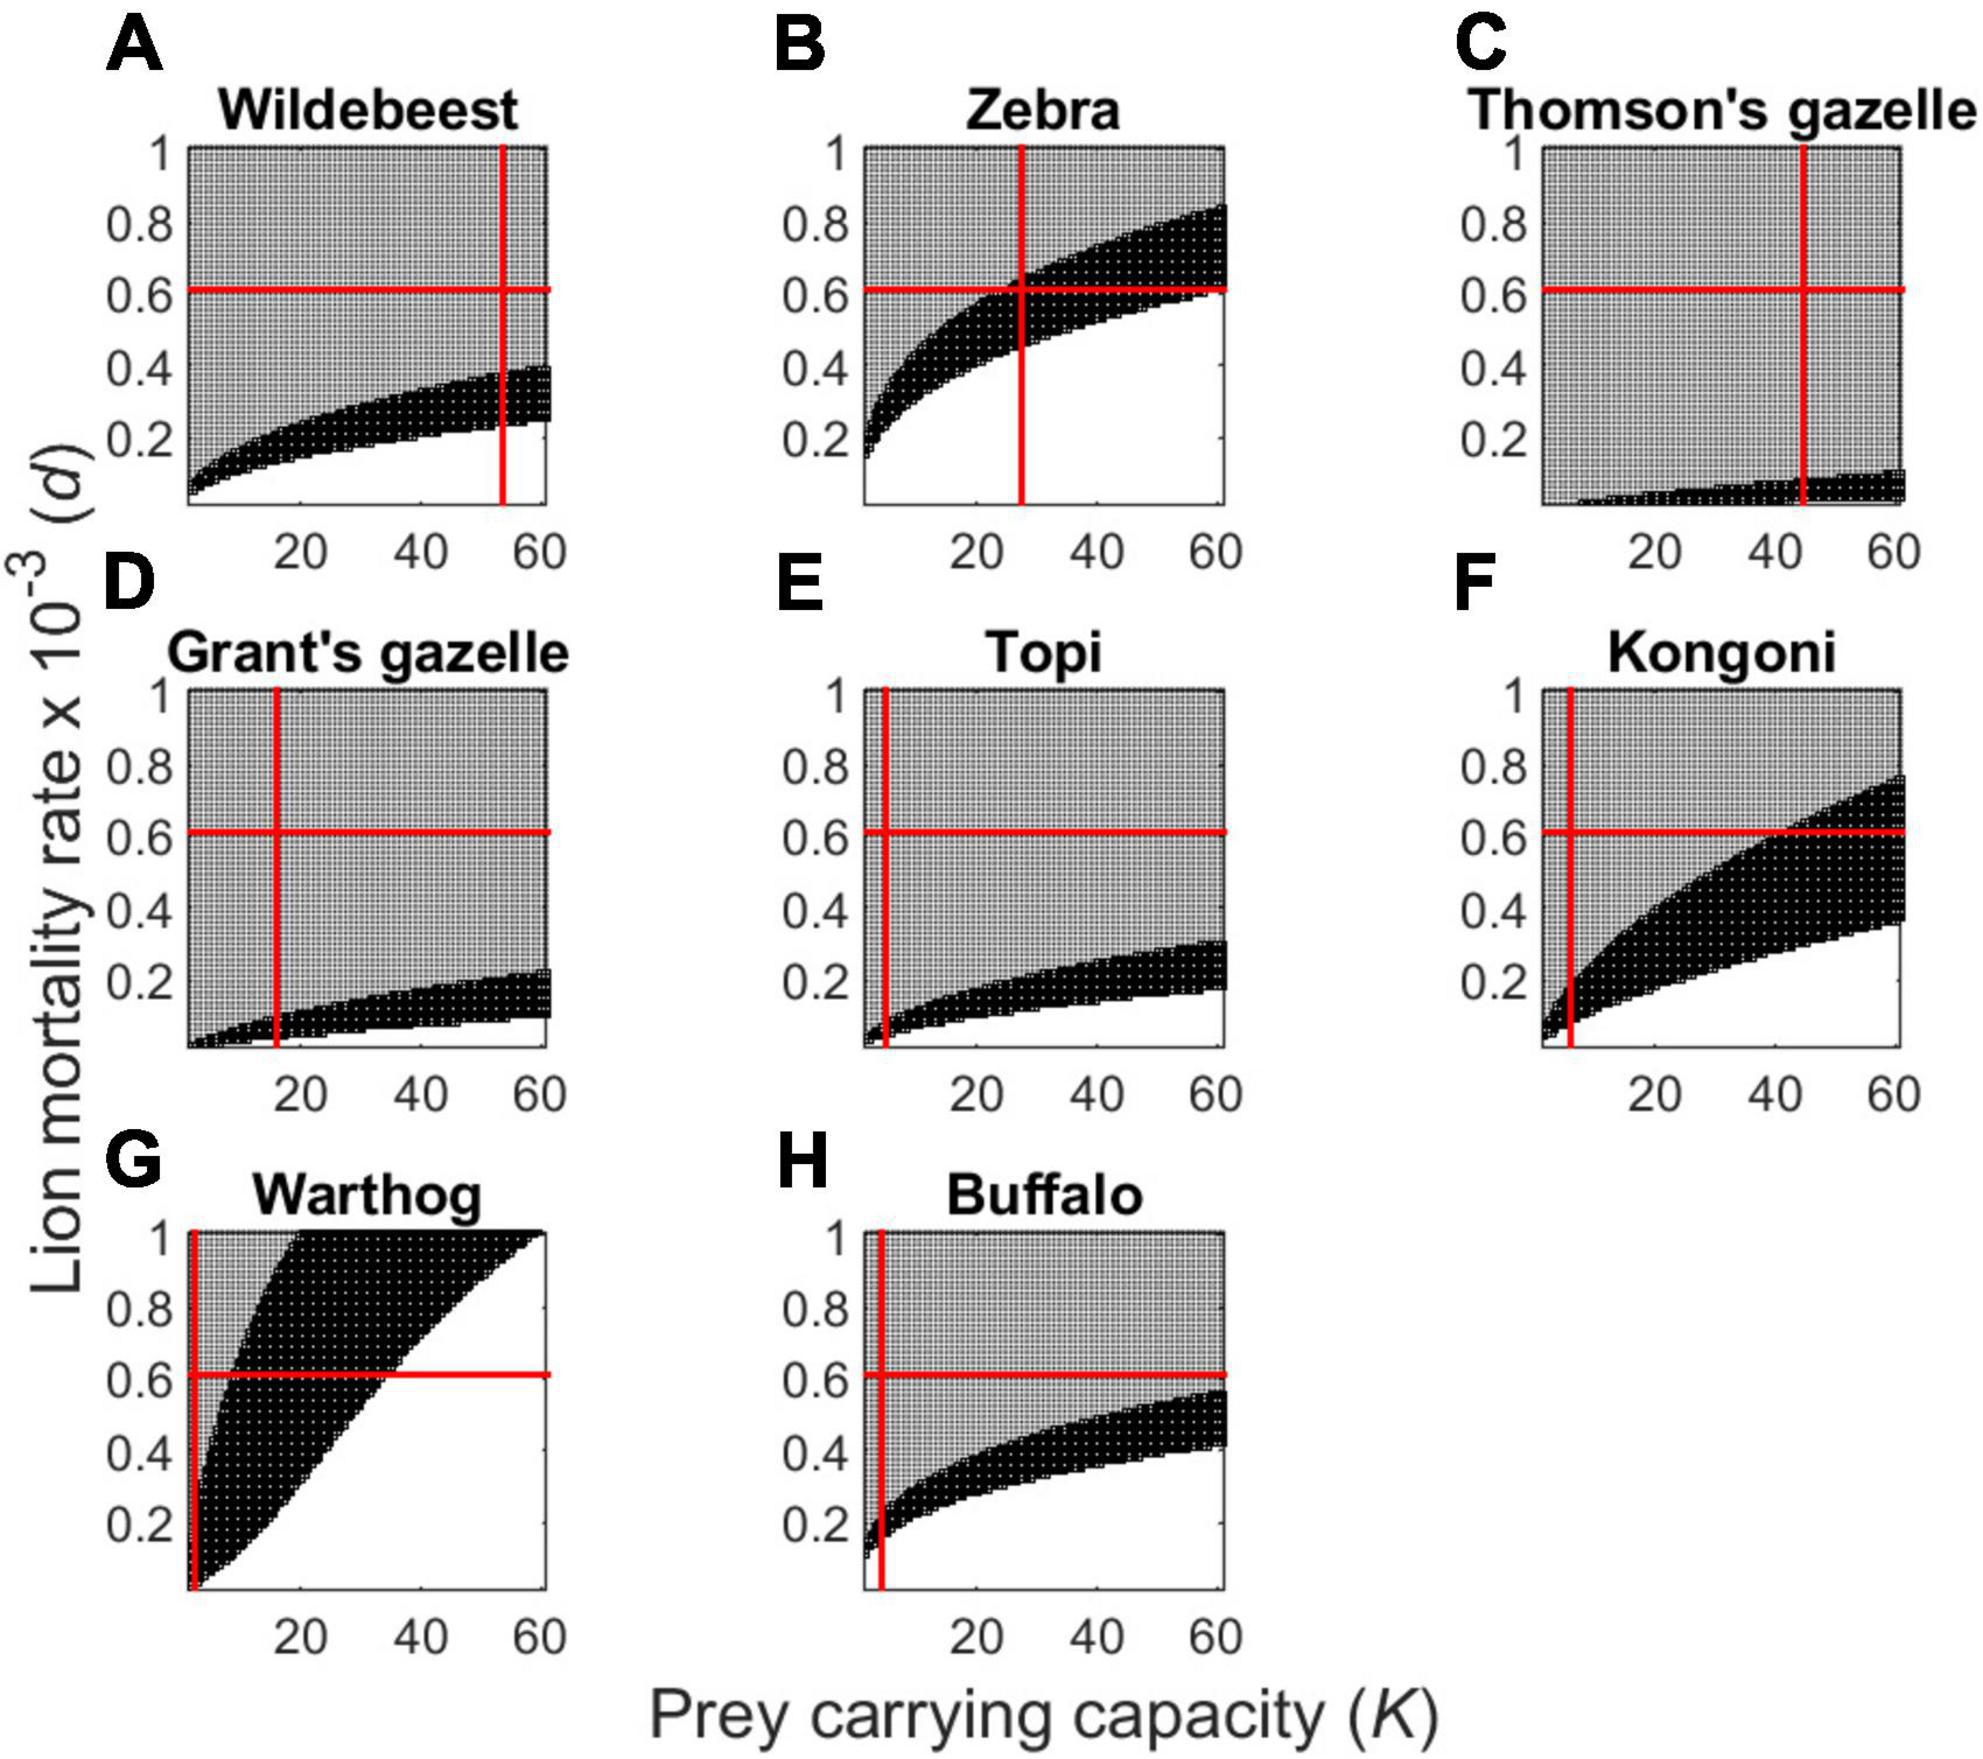
Figure 5. Plot of dynamically unstable (unshaded), locally stable (dark shading), and unsustainable (moderate shading) outcomes for the group-dependent predator-prey model (Eqs. 3, 4), for the most common prey of Serengeti lions. The red lines depict the values of lion daily mortality rate (d) and prey carrying capacity (K) as in Figure 4. Panels correspond to wildebeest (A), zebra (B), Thomson’s gazelles (C), Grant’s gazelles (D), topi (E), hartebeest (F), warthog (G), and buffalo (H).
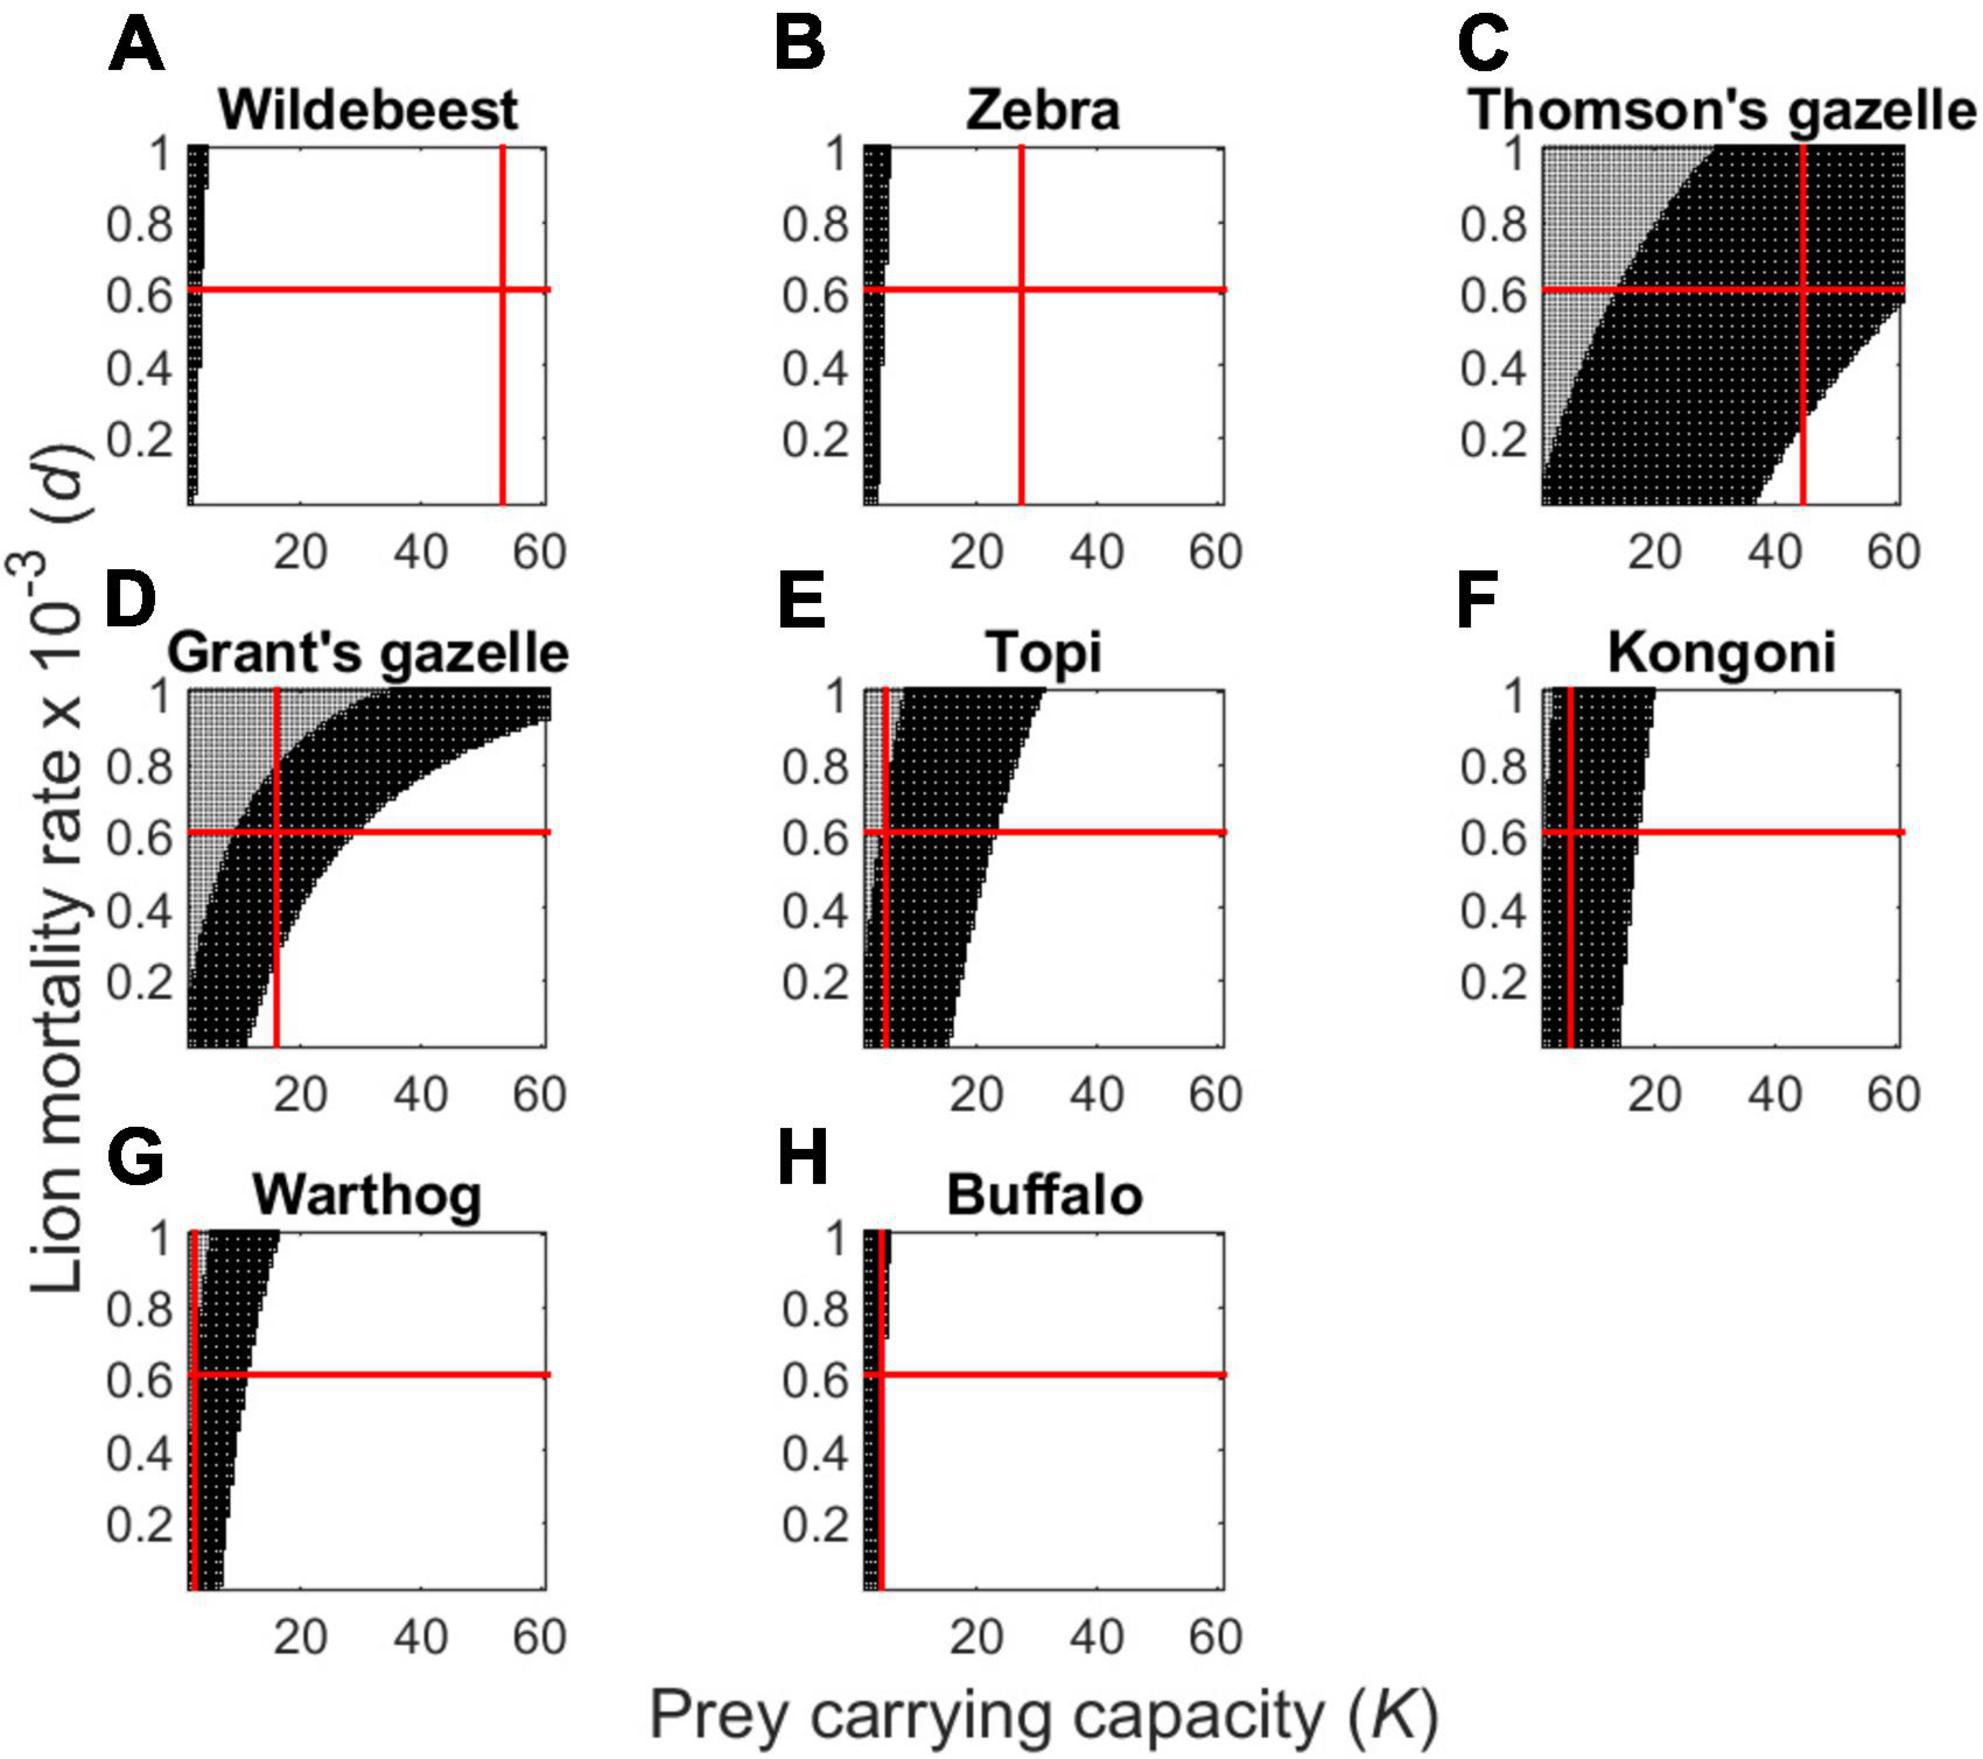
Figure 6. Plot of dynamically unstable (unshaded), locally stable (dark shading), and unsustainable (moderate shading) outcomes for the group-dependent predator-prey model (Eqs 3, 4) as determined by predator mortality rate (d) and prey carrying capacity (K) for the most common prey of Serengeti lions, assuming that prey are solitary and randomly distributed in space. The red lines depict the values of lion daily mortality rate (d) and prey carrying capacity (K) estimated from our empirical data, showing that many of the observed values lie outside stable regions with the exception of zebra. Panels correspond to wildebeest (A), zebra (B), Thomson’s gazelles (C), Grant’s gazelles (D), topi (E), hartebeest (F), warthog (G), and buffalo (H).
Largely due to differences in grouping characteristics and body size, our model predicts that the functional response by a group of four lions should vary considerably across the eight herbivore species (Figure 4A). Predation rates are predicted to increase much more rapidly with density for warthogs than any other prey species. This is because warthogs occur in small family groups, resulting in a relatively large value of ε (Table 1). Since warthog family groups forage separately from each other, there is little density-dependence in grouping tendency, as reflected by their large value of β (Table 1). Although more highly aggregated in space, Thomson’s gazelles also suffer relatively high predation rates relative to the other herbivore species. This is due to their exceptionally short handling time, resulting in a much higher asymptote (= 1/[γh1+ h2]) than for the other species. The rank ordering with respect to the meat intake per lion deviates from the functional response, however, due to differences in edible body mass across prey species (Figure 4B). As a result, a population density of 500 Thomson’s gazelles per km2 would be necessary to produce an equivalent meat yield (and consequently an equivalent per capita rate of lion population growth) as ∼20 hartebeest per km2.
Interspecific variation in body size and grouping characteristics has substantial impact on local stability of the pairwise interactions between lions and any single Serengeti herbivore (Figure 5). Our model suggests that the ratio of cyclic, stable, and unsustainable parameter combinations is broadly comparable across wildebeest (Figure 5A), topi (Figure 5F), and buffalo (Figure 5H). The proportion of unsustainable parameter combinations is substantially higher for Thomson’s gazelles (Figure 5C), and more intermediate for Grant’s gazelles (Figure 5D) and hartebeest (Figure 5E). Zebra and particularly warthogs should be substantially more likely to be unstable (based on the proportion of parameter space that is unshaded in Figures 5B,G), leading to a greater tendency for population oscillations.
Holling’s (1959a,b) formulation of the functional response has had an enormous influence on decades of theoretical modeling in ecology and evolution. Indeed, one would be hard pressed to find a more pivotal concept, since it helps clarify factors influencing both the fitness benefits experienced by consumers as well as the fitness losses faced by their resource base. It is increasingly obvious, however, that no single functional response formulation can adequately model per capita consumption rates across all species. Here we have shown that the pattern of social aggregation by prey individuals is a key organismal trait, dramatically altering predator feeding efficiency and, therefore, stability of predator and prey populations through its effect on predator search efficiency (Cosner et al., 1999; Fryxell et al., 2007).
All eight of the lion’s main prey species are group living. For most, associations amongst individuals are transient, with constant ebb and flow between ephemeral herds (Gueron and Levin, 1995; Gueron et al., 1996). These temporary associations are particularly obvious for the migratory species like wildebeest, zebra, and Thomson’s gazelles, but they are also true to a lesser extent for resident species like topi, hartebeest, and buffalo. Even warthogs occur in close-knit family groups, rather than as independently distributed individuals.
Following earlier work on grouping patterns of ungulates and fish (Bonabeau et al., 1999; Sjoberg et al., 2000), we have estimated the power law relationship between population density and social group density as a compact and computationally tractable means of predicting how encounter rates should vary with increasing prey abundance. Monthly observations fit the postulated power function well (Figure 1) and similar measures could be useful for evaluating the impact of grouping decisions made by mobile aggregations of prey in other settings. The exponent in the power law formulation measures the tendency for average group size to change with population abundance. Exponents <<1 suggest that groups become ever larger as a population grows and can drastically slow the rate at which group-dependent functional responses saturate. But even in species like warthog that form groups of roughly constant size, there is an appreciable reduction in the predator’s search efficiency.
By substituting our simple power function for herd density in every location where prey density occurs in Holling’s (1959a,b) type II functional response formula, we can evaluate the theoretical impact of herding on the predation and food-intake rates of Serengeti lions. Such mechanisticaly-derived functional responses are particularly useful where direct measurements of predator feeding rates would not only be prohibitively slow and expensive (Beardsell et al., 2021), but very unlikely to provide parameter estimates over the full range of densities needed to reliably characterize the functional response. Although impressive functional response measurements have been achieved in remote field settings, predation rate estimates from routine population monitoring would be difficult to derive in many situations. Our mechanisticaly-derived functional response curves suggested substantial variation in lion feeding efficiency across prey species, largely through herd formation, both in average herd size and density-dependent changes in herd size, with additional interspecific differences owing to capture success, preference, and body mass.
An obvious limitation of any mechanisticaly-derived functional response model is that key parameters in the model may themselves be sensitive to changes in either predator or prey density. In the case of Serengeti lions, for example, we have assumed that the degress of selectivity and probability of success per attack varies across prey species, but does not vary with the size of lion or prey groups. Scheel’s (1993) extensive observational records taken during lion hunts provided us a solid baseline estimate of p, but it is certainly possible that a deeper dataset might reveal a more complex dynamic relationship between hunting success and population abundance, which would have noteworthy dynamic implications. For example, vigilance and information about the potential for imminent attack is often enhanced in group-forming organisms compared to those that are more solitary (Elgar, 1989; Handegard et al., 2012), simply due to more eyes being available to periodically scan the surrounding landscape and enhanced communication among prey group members. This would lead to a decrease in attack success (p) or perhaps selectivity (s) if group size increases with density, with consequent effects on lion functional responses and ecosystem stability (Fryxell and Berdahl, 2018). Of course, it also conceivable that a lion ambush of a large prey group could result in improved odds of singling out a weak individual or cause such confusion among prey individuals that prey escape is compromised (Couzin and Krause, 2003), having the opposite effect.
Our model assumes that a group of prey is just as detectable as a single prey individual, implying that lion detectability and search path width is constant. It seems quite possible that detection distance is to some degree positively related to group size, but we simply do not have enough data from our Serengeti field research at present to estimate the relationship. Since group size is itself related to population density in our power model of group dependency, group size-dependent detection would influence the magnitude of search efficiency α, with consequent effects on system dynamics. Taking this to an extreme, if lion detection distance increased by 200 m with each additional prey group member, then prey aggregation would have no net effect on lion feeding rates. Such an extreme effect seems unrealistic, however, given physical and physiological limits on perception. It seems inconceivable that a lion on the Serengeti plains could routinely detect a group of 100 closely-clustered gazelles at 20 km distance. Nonetheless, the nature of the relationship between detection distance and prey group size for Serengeti lions (or indeed any other predator) remains an important, and as yet unanswered, question.
Our model suggests that foraging on a single species of prey would be effectively unsustainable for lions under the observed conditions, despite the impressive abundance of large herbivore prey in the Serengeti. According to our field-based estimates of d, c, and K, resource specialization would not be viable for lions over the long-term, with the possible exception of zebra. This helps explain why Serengeti lions have broad diets and are highly opportunistic in their feeding preferences across Africa (Scheel and Packer, 1995; Hayward and Kerley, 2006; Owen-Smith and Mills, 2008). Specializing on any single prey species simply would not yield a sufficient rate of prey capture to sustain typical hunting groups.
A simple thought experiment demonstrates how drastically the situation would change if herbivores did not form groups (i.e., setting ε = β = 1). If herbivores were asocial and randomly distributed in space, Serengeti lions could readily persist even while specializing on any single prey species (Figure 6). In contrast, highly mobile groups of prey individuals are effectively hiding from discovery by predators, much as in a predator-prey shell game (Mitchell and Lima, 2002). Thus, each predator is forced to explore large expanses of empty space before occasionally encountering any given social group (Cosner et al., 1999; Fryxell et al., 2007). If the predator can only capture and kill one prey individual at a time, all the remaining individuals can subsequently escape and regroup on safer pastures. Hence, herd formation serves both to reduce the rate of encounter (Cosner et al., 1999; Fryxell et al., 2007) and dilute the per capita risk of death of group members once the group is encountered (Hamilton, 1971).
Our model makes a number of testable predictions. First, individual predation risks for solitary prey should be markedly higher than for social prey species at comparable population densities. Second, the selective advantage of group formation should decrease where predator populations have been reduced by disease or anthropogenic disturbance. If prey animals face meaningful resource competition, average group size and/or density-dependent grouping should therefore decline with decreased predator abundance. Finally, predator and prey populations in ecosystems with limited capacity for herd formation due to restrictions on herbivore movement should be less stable than those in systems with mobile, highly aggregated prey. We hope that our simple model encourages a fresh look at other predator-prey systems to see if the patterns observed in Serengeti hold up across a range of circumstances.
The original contributions presented in this study are included in the article/Supplementary material, further inquiries can be directed to the corresponding author.
Ethical review and approval was not required for the animal study because field research was of a strictly observational nature.
JF developed and analyzed the data and models and wrote the first draft. All authors contributed to the gathering of data and subsequent drafts of the manuscript.
NSERC, NSF, ERC, BES, and NERC have provided financial support for the field research in Serengeti, as well as subsequent data and model analysis.
This research was made possible through operating grants from the Natural Sciences and Engineering Research Council of Canada, National Science Foundation (United States), European Research Council (EU), British Ecological Society, and the Natural Environment Research Council (United Kingdom).
The authors declare that the research was conducted in the absence of any commercial or financial relationships that could be construed as a potential conflict of interest.
All claims expressed in this article are solely those of the authors and do not necessarily represent those of their affiliated organizations, or those of the publisher, the editors and the reviewers. Any product that may be evaluated in this article, or claim that may be made by its manufacturer, is not guaranteed or endorsed by the publisher.
The Supplementary Material for this article can be found online at: https://www.frontiersin.org/articles/10.3389/fevo.2022.981842/full#supplementary-material
Arditi, R., and Ginzburg, L. R. (1989). Coupling in predator-prey dynamics: Ratio dependence. J. Theor. Biol. 139, 311–326. doi: 10.1016/S0022-5193(89)80211-5
Beardsell, A., Gravel, D., Bertaux, D., Gauthier, G., Clermont, J., Careau, V., et al. (2021). Derivation of predator functional responses using a mechanistic approach in a natural system. Front. Ecol. Evol. 9:630944. doi: 10.3389/fevo.2021.630944
Beddington, J. R. (1975). Mutual interference between parasites or predators and its effect on searching efficiency. J. Anim. Ecol. 44, 331–340. doi: 10.2307/3866
Bonabeau, E., Dagorn, L., and Freon, P. (1999). Scaling in animal group-size distributions. Proc. Natl. Acad. Sci. U.S.A. 96, 4472–4477. doi: 10.1073/pnas.96.8.4472
Bukombe, J., Senzota, R. B., Fryxell, J. M., Kittle, A., Kija, H., Hopcraft, J. G. C., et al. (2015). Do animal size, seasons and vegetation type influence detection probability and density estimates of Serengeti ungulates? Afr. J. Ecol. 54, 29–38. doi: 10.1111/aje.12255
Cosner, C., DeAngelis, D. L., Ault, J. S., and Olson, D. B. (1999). Effects of spatial grouping on the functional response of predators. Theor. Pop. Biol. 56, 65–75. doi: 10.1006/tpbi.1999.1414
Couzin, I. D., and Krause, J. (2003). Self-organization and collective behavior in vertebrates. Adv. Study Behav. 32, 1–76. doi: 10.1016/S0065-3454(03)01001-5
DeAngelis, D. L., Goldstein, R. A., and ONeill, R. V. (1975). A model for trophic interaction. Ecology 56, 881–892. doi: 10.2307/1936298
Elgar, M. A. (1989). Predator vigilance and group size in mammals and birds: A critical review of the empirical evidence. Biol. Rev. 64, 13–33. doi: 10.1111/j.1469-185X.1989.tb00636.x
Fryxell, J. M., and Berdahl, A. M. (2018). Fitness tradeoffs of group formation and movement by Thomson’s gazelles in the Serengeti ecosystem. Philos. Trans. R. Soc. Lond. B Biol. Sci. 73:20170013. doi: 10.1098/rstb.2017.0013
Fryxell, J. M., Mosser, A., Sinclair, A. R. E., and Packer, C. (2007). Group formation stabilizes predator-prey dynamics. Nature 449, 1041–1043. doi: 10.1038/nature06177
Gueron, S., and Levin, S. A. (1995). The dynamics of group formation. Math. Biosci. 128, 243–264. doi: 10.1016/0025-5564(94)00074-A
Gueron, S., Levin, S. A., and Rubenstein, D. I. (1996). The dynamics of herds: From individuals to aggregations. J. Theor. Biol. 182, 85–98. doi: 10.1006/jtbi.1996.0144
Hamilton, W. D. (1971). Geometry of the selfish herd. J. Theor. Biol. 31, 295–311. doi: 10.1016/0022-5193(71)90189-5
Handegard, N. O., Boswell, K. M., Ioannu, C. C., Leblanc, S. P., Tjøtsheim, D. B., and Couzin, I. D. (2012). The dynamics of coordinated group hunting and collective information transfer among schooling prey. Curr. Biol. 22, 1213–1217. doi: 10.1016/j.cub.2012.04.050
Hayward, M. W., and Kerley, G. I. H. (2006). Prey preference of the lion (Panthera leo). J. Zool. Lond. 267, 309–322. doi: 10.1017/S0952836905007508
Holling, C. S. (1959a). The components of predation as revealed by a study of small mammal predation of the European pine sawfly. Can. Entomol. 91, 293–320.
Holling, C. S. (1959b). Some characteristics of simple types of predation and parasitism. Can. Entomol. 91, 385–398. doi: 10.4039/Ent91385-7
Mitchell, W. A., and Lima, S. (2002). Predator-prey shell games: Large-scale movement and its implications for decision-making by prey. Oikos 99, 249–259. doi: 10.1034/j.1600-0706.2002.990205.x
Otto, S. P., and Day, T. (2007). A biologist’s guide to mathematical modeling in ecology and evolution. Princeton, NJ: Princeton University Press.
Owen-Smith, N., and Mills, M. G. L. (2008). Shifting prey selection generates contrasting herbivore dynamics within a large-mammal predator-prey web. Ecology 89, 1120–1133. doi: 10.1890/07-0970.1
Packer, C. (2023). The lion: Behavior, ecology, and conservation of an iconic species. Princeton, NJ: Princeton University Press.
Rosenzweig, M. L. (1971). Paradox of enrichment: Destabilization of exploitation ecosystems in ecological time. Science 171, 385–387. doi: 10.1126/science.171.3969.385
Rosenzweig, M. L., and MacArthur, R. H. (1963). Graphical representation and stability conditions of predator-prey interactions. Am. Nat. 97, 209–223. doi: 10.1086/282272
Scheel, D. (1993). Profitability, encounter rates, and prey choice of African lions. Behav. Ecol. 4, 90–97. doi: 10.1093/beheco/4.1.90
Scheel, D., and Packer, C. (1995). “Variation in predation by lions: Tracking a moveable feast,” in Serengeti II: Dynamics, management and conservation of an ecosystem, eds A. R. E. Sinclair and P. Arcese (Chicago, IL: University of Chicago Press), 299–314.
Sinclair, A. R. E., Metzger, K. L., Fryxell, J. M., Packer, C., Byrom, A. E., Craft, M. E., et al. (2013). Asynchronous food-web pathways could buffer the response of Serengeti predators to El Niño Oscillation. Ecology 94, 1123–1130. doi: 10.1890/12-0428.1
Sjoberg, M., Albrectsen, B., and Hjalten, J. (2000). Truncated power laws: A tool for understanding aggregation patterns in animals? Ecol. Lett. 3, 90–94. doi: 10.1046/j.1461-0248.2000.00113.x
Western, D. (1979). Size, life history and ecology in mammals. Afr. J. Ecol. 17, 185–204. doi: 10.1111/j.1365-2028.1979.tb00256.x
Keywords: aggregation, census, diet, functional response, foraging, lions, stability
Citation: Fryxell JM, Mduma S, Masoy J, Sinclair ARE, Hopcraft GJC and Packer C (2022) Stabilizing effects of group formation by Serengeti herbivores on predator-prey dynamics. Front. Ecol. Evol. 10:981842. doi: 10.3389/fevo.2022.981842
Received: 29 June 2022; Accepted: 26 July 2022;
Published: 18 August 2022.
Edited by:
Dennis Murray, Trent University, CanadaReviewed by:
Stan Boutin, University of Alberta, CanadaCopyright © 2022 Fryxell, Mduma, Masoy, Sinclair, Hopcraft and Packer. This is an open-access article distributed under the terms of the Creative Commons Attribution License (CC BY). The use, distribution or reproduction in other forums is permitted, provided the original author(s) and the copyright owner(s) are credited and that the original publication in this journal is cited, in accordance with accepted academic practice. No use, distribution or reproduction is permitted which does not comply with these terms.
*Correspondence: John M. Fryxell, amZyeXhlbGxAdW9ndWVscGguY2E=
Disclaimer: All claims expressed in this article are solely those of the authors and do not necessarily represent those of their affiliated organizations, or those of the publisher, the editors and the reviewers. Any product that may be evaluated in this article or claim that may be made by its manufacturer is not guaranteed or endorsed by the publisher.
Research integrity at Frontiers
Learn more about the work of our research integrity team to safeguard the quality of each article we publish.